Embed Size (px)
Citation preview
161
Parabolic focal conics and polygonal textures in lipid liquid crystals (*)
S. A. Asher and P. S. Pershan
Division of Applied Sciences, Gordon McKay Laboratory, Harvard University, Cambridge, Massachusetts 02138, U.S.A.
(Reçu le 10 juillet 1978, accepté le 24 octobre 1978)
Résumé. 2014 Les phases liquide-cristallines lyotropes de dipalmitoyl-, dimyristoyl- et dilaurylphosphatidylcholinepréparées pour différentes concentrations en eau présentent des réseaux de défauts polygonaux que l’on étudieau microscope optique. Les réseaux sont semblables à ceux observés précédemment dans le cas de phases thermo-tropes smectiques et cholestériques. Le modèle de domaine focal parabolique proposé par Rosenblatt, Pindak,Clark et Meyer pour les réseaux des smectiques thermotropes permet aussi de rendre compte des propriétés obser-vées dans ces phases lamellaires lyotropes. La biréfringence des réseaux polygonaux s’accroit progressivementavec les contraintes qui induisent les défauts. Le modèle de domaine focal parabolique ne décrit pas complètementles détails des réseaux polygonaux les plus biréfringents.
Abstract. 2014 Polygonal defect arrays in lipid liquid crystals prepared from dipalmitoyl-, dimyristoyl-, and dilauryl-phosphatidylcholine with various concentrations of water have been observed and characterized using opticalmicroscopy. These arrays appear similar to the polygonal arrays previously observed in thermotropic smecticand cholesteric liquid crystals. The parabolic focal conic model proposed by Rosenblatt, Pindak, Clark and Meyerfor the polygonal arrays in thermotropic smectic liquid crystals also describes the observed properties in the smecticA phase of lipid liquid crystals. The polygonal arrays become progressively more birefringent as the strains inducingthem are increased. The parabolic focal conic model does not completely describe the details of the more bire-fringent polygonal arrays.
LE JOURNAL DE PHYSIQUE TOME 40, FÉVRIER 1979,
Classification
Physics Abstracts61.30jf - 87.20eg
1. Introduction. - Aligned monodomain lipid mul-tilayers are of interest not only because of their liquidcrystalline properties, but also because of their utilityas model systems in the study of biological membra-nes [1, 2]. These lipid liquid crystals can be utilizedeither directly for the study of the material propertiesof lipid bilayers [3-13] or, with the incorporation ofbiologically interesting ingredients [12], to study theproperties of these ingredients in the model system.If one can incorporate proteins in aligned lipid multi-lamellae, these systems would be uniquely suited forstudy of the conformational properties of the protein-lipid system.For any of these studies it is advantageous to have
large, monodomain samples of the size that were
recently obtained by Powers et al. [12, 13]. Theydescribed a technique by which lipid-water mixtures
containing less than 8 % by weight of water could beannealed into aligned monodomain liquid crystals( ~ 100 gm thick and 1 cm2) at elevated temperatures(> 100 OC). We have used this technique to preparealigned samples of dipalmitoyl- (DPPC), dimyristoyl-(DMPC) and dilauryl- (DLPC) phosphatidylcholinecontaining up to 8 % water. We have also developeda mechanical alignment technique for the room
temperature alignment of samples of DLPC contain-ing 20 % water. With both of these techniques andwith III three of these lipids we have observed variousdefect structures [14]. One of these structures is quali-tatively similar to polygonal arrays, previously observ-ed in cholesteric [15] and thermotropic smectic liquidcrystals [16-18]. We have characterized these arrays-by optical microscopy and propose a structure forone of them that is identical to the parabolic focalconic (PFC) model proposed initially by Rosenblattet al. [18] to explain the polygonal arrays that theyobserved in a thermotropic smectic liquid crystal. Wealso demonstrate the existence of arrays that have
many properties in common with the PFC, but whichare distinctly different.
Article published online by EDP Sciences and available at http://dx.doi.org/10.1051/jphys:01979004002016100
162
2. Expérimental. - Dipalmitoyl and dimyristoylphosphatidylcholine (DPPC and DMPC) were pur-chased from Sigma Chemical Co. (St. Louis, MO,USA). Dilauryl phosphatidylcholine (DLPC) waspurchased from Calbiochem (San Diego, CA, USA).Prior to use, each of the samples was monitored forpurity by thin layer chromatography. We have foundexperimentally that lipids lyophilized from benzenealign more easily and with fewer defects than if useddirectly. This may be due to the fact that lipids dissolv-ed in benzene form large inverse micelles that have ahigh degree of local order [19]. DPPC, DMPC andDLPC were aligned homeotropically (smectic layersare parallel to the glass surfaces) between 1 mm thickmicroscope slides separated by 125 pm spacers usingthe Powers technique [12, 13]. We found, however,that if the glass slides were scrupulously clean, align-ment was obtained equally well with or without thesilane surfactant described by Powers.The hydrophilic glass surfaces were prepared by
cleaning the slides with hot chromic acid and rinsingthem in a distilled water steam bath ; the condensingwater rinsed the glass surfaces. In view of the amphi-philic character of lipids, it is not surprising that ahydrophilic glass surface would align samples just aswell as the hydrophobic surface obtained with thesurfactant.For water concentration of less than 10 % by weight,
the water was added directly to the lipid. Samples ofDLPC with 20 % water were prepared by adding thewater to the lipid and dispersing it using a dentalamalgamator. Immediately after the addition of waterto the lipid, the sample was tightly clamped to preventthe escape of water during the annealing process. Weestimate the reported water concentration to beaccurate to ± 10 % of the value quoted. The alignedsamples of DPPC appeared homogeneously black,with few defects when observed microscopicallybetween crossed polarizers. The aligned samples ofDLPC with 20 % water had thin strand-like defectsthat separated homogeneous black domains (typi-cally 3 mm’ in area). In any one experiment identicaleffects were observed in the separate domains.
Although the temperatures at which phase transitionsoccur in lipid-water systems are strong functions ofthe water concentration [1, 12, 20, 21], none of thedetected features of the defect structure were depen-dent on the water concentration so long as the samplewas maintained in the La or smectic A phase.
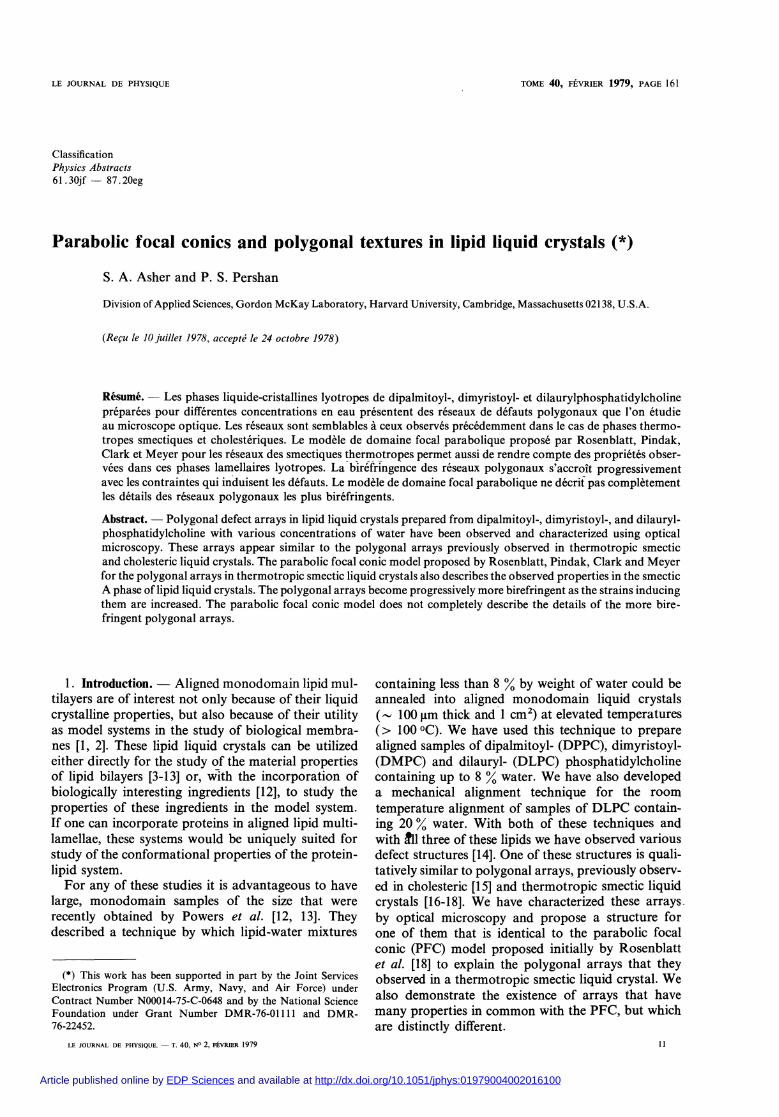
Samples of DLPC with 20 % water were aligned atroom temperature by placing the lipid-water mixturebetween glass slides separated by a 100 pm latexrubber spacer. The holder for the slides (Fig. 1)consisted of a metal box and a steel plate whichcompressed the glass slides together and against thebottom of the box. The tension on the steel plate wasvaried by set screws accessible from the top of thesample holder. Holes were drilled in the sampleholder to monitor the alignment. Macroscopic align-
Fig. 1. - Sample holder for the mechanical alignment of lipids.
ment of DLPC containing 20 % water could beobtained at room temperature by gently alternatingbetween compressing and releasing the glass slides.
In general the compression was non-uniform, andflow from one part of the sample to another could beobserved during the process. We presume that thisflow is responsible for the growth of the alignedhomeotropic areas as the process is continued. The
alignment and defect structures were monitored conti-nuously using polarized optical microscopy and
conoscopy. The phase shift in the transmitted lightinduced by the sample was measured at selected
points in the sample by a Soleil-Babinet compensatorattached to the microscope.
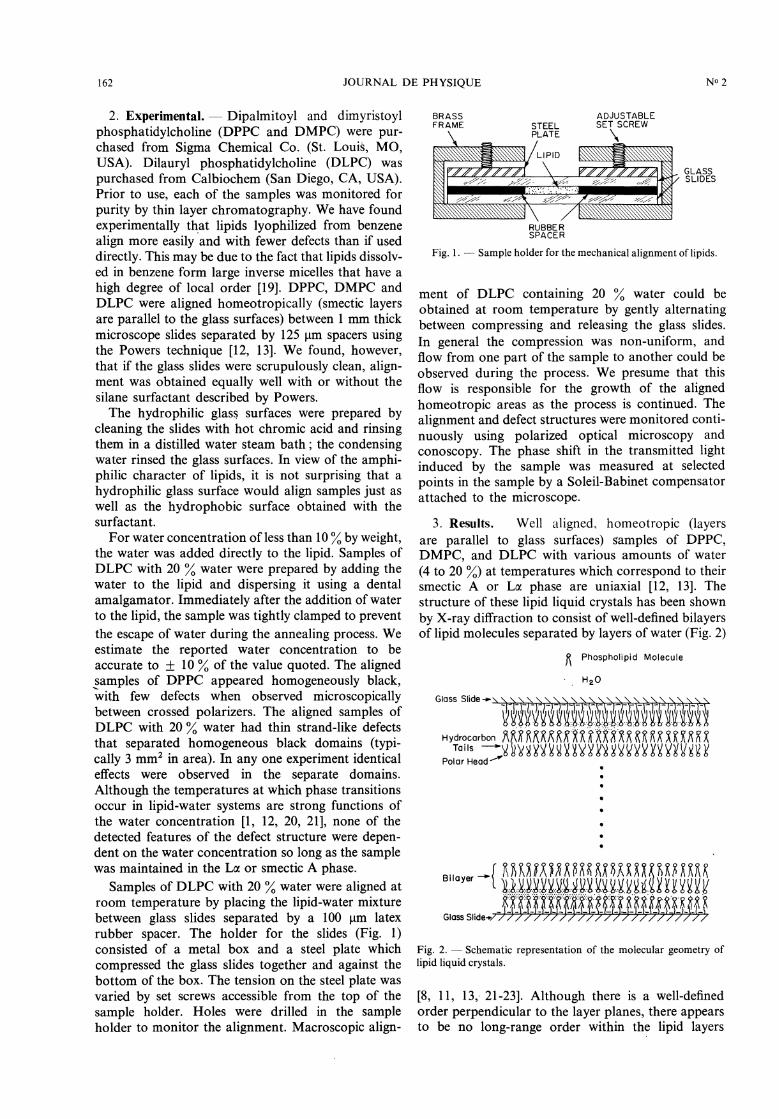
3. Results. Well aligned, homeotropic (layersare parallel to glass surfaces) samples of DPPC,DMPC, and DLPC with various amounts of water(4 to 20 %) at temperatures which correspond to theirsmectic A or La phase are uniaxial [12, 13]. Thestructure of these lipid liquid crystals has been shownby X-ray diffraction to consist of well-defined bilayersof lipid molecules separated by layers of water (Fig. 2)
Fig. 2. - Schematic representation of the molecular geometry oflipid liquid crystals.
[8, 11, 13, 21-23]. Although there is a well-definedorder perpendicular to the layer planes, there appearsto be no long-range order within the lipid layers
163
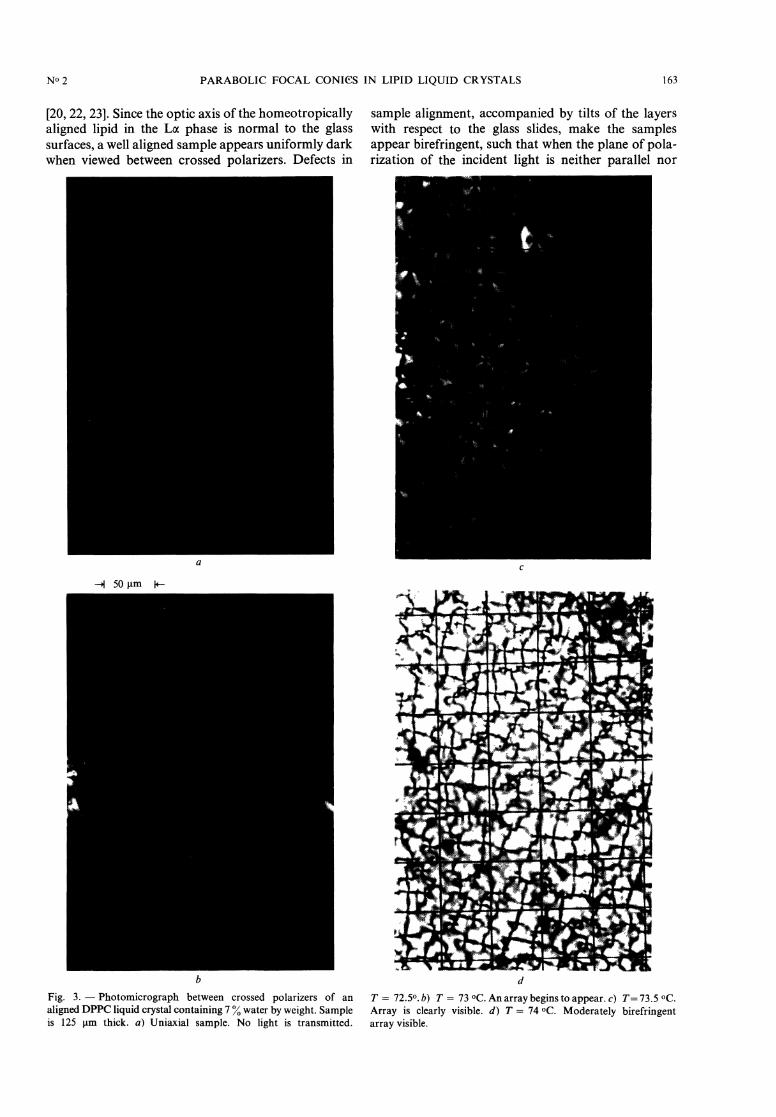
[20, 22, 23]. Since the optic axis of the homeotropicallyaligned lipid in the La phase is normal to the glasssurfaces, a well aligned sample appears uniformly darkwhen viewed between crossed polarizers. Defects in
Fig. 3. - Photomicrograph between crossed polarizers of an
aligned DPPC liquid crystal containing 7 % water by weight. Sampleis 125 pm thick. a) Uniaxial sample. No light is transmitted.
sample alignment, accompanied by tilts of the layerswith respect to the glass slides, make the samplesappear birefringent, such that when the plane of pola-rization of the incident light is neither parallel nor
T = 72.5°. b) T = 73 °C. An array begins to appear. c) T= 73.5 °C.Array is clearly visible. d ) T = 74 °C. Moderately birefringentarray visible.
164
perpendicular to the tilt direction the light leaving thesample will be elliptically polarized and will not beextinguished by a crossed polarizer. The magnitudeof the effect is related to the amount of tilt, the magni-tude of the uniaxial optical anisotropy of the alignedsystem, and the length of the tilted region as measuredparallel to the direction of light propagation, i.e.,normal to the glass slides. Figure 3a shows an alignedmonodomain sample of DPPC with 7 % water byweight at 76 °C. Upon increasing the temperatureslightly ( 1 °C within a few seconds) an array ofpolygonal defects is produced whose birefringence(and visibility) is a function of the temperatureincrease (Figs. 3b-3d). This array is stable for hoursand appears for each of the three lipids studied. Theformation of the array is completely reversible ; uponlowering the temperature it disappears. Similarly, thesepolygonal arrays can also be formed by dilating thesample (pulling apart the glass plates enclosing thesample). When the stress is relieved by restoring theplates to their initial position, the array disappears.The fact that similar effects are produced for both amechanical dilation and a temperature increase canbe rationalized from the negative thermal expansioncoefficient of lipid liquid crystals perpendicular totheir layer planes [24, 25].Some of the particular properties of the polygonal
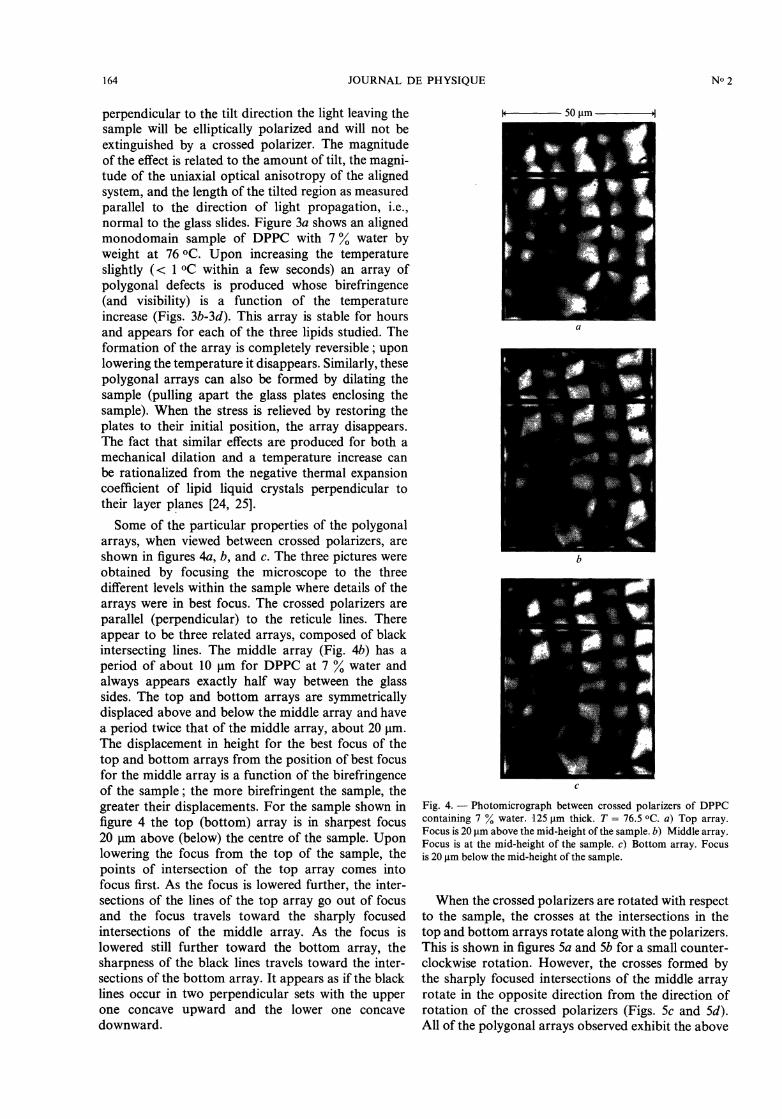
arrays, when viewed between crossed polarizers, areshown in figures 4a, b, and c. The three pictures wereobtained by focusing the microscope to the threedifferent levels within the sample where details of thearrays were in best focus. The crossed polarizers areparallel (perpendicular) to the reticule lines. There
appear to be three related arrays, composed of blackintersecting lines. The middle array (Fig. 4b) has aperiod of about 10 pm for DPPC at 7 % water andalways appears exactly half way between the glasssides. The top and bottom arrays are symmetricallydisplaced above and below the middle array and havea period twice that of the middle array, about 20 gm.The displacement in height for the best focus of thetop and bottom arrays from the position of best focusfor the middle array is a function of the birefringenceof the sample ; the more birefringent the sample, thegreater their displacements. For the sample shown infigure 4 the top (bottom) array is in sharpest focus20 gm above (below) the centre of the sample. Uponlowering the focus from the top of the sample, thepoints of intersection of the top array comes intofocus first. As the focus is lowered further, the inter-sections of the lines of the top array go out of focusand the focus travels toward the sharply focusedintersections of the middle array. As the focus islowered still further toward the bottom array, the
sharpness of the black lines travels toward the inter-sections of the bottom array. It appears as if the blacklines occur in two perpendicular sets with the upperone concave upward and the lower one concavedownward.
Fig. 4. - Photomicrograph between crossed polarizers of DPPCcontaining 7 % water. 125 pm thick. T = 76.5 °C. a) Top array.Focus is 20 pm above the mid-height of the sample. b) Middle array.Focus is at the mid-height of the sample. c) Bottom array. Focusis 20 pm below the mid-height of the sample.
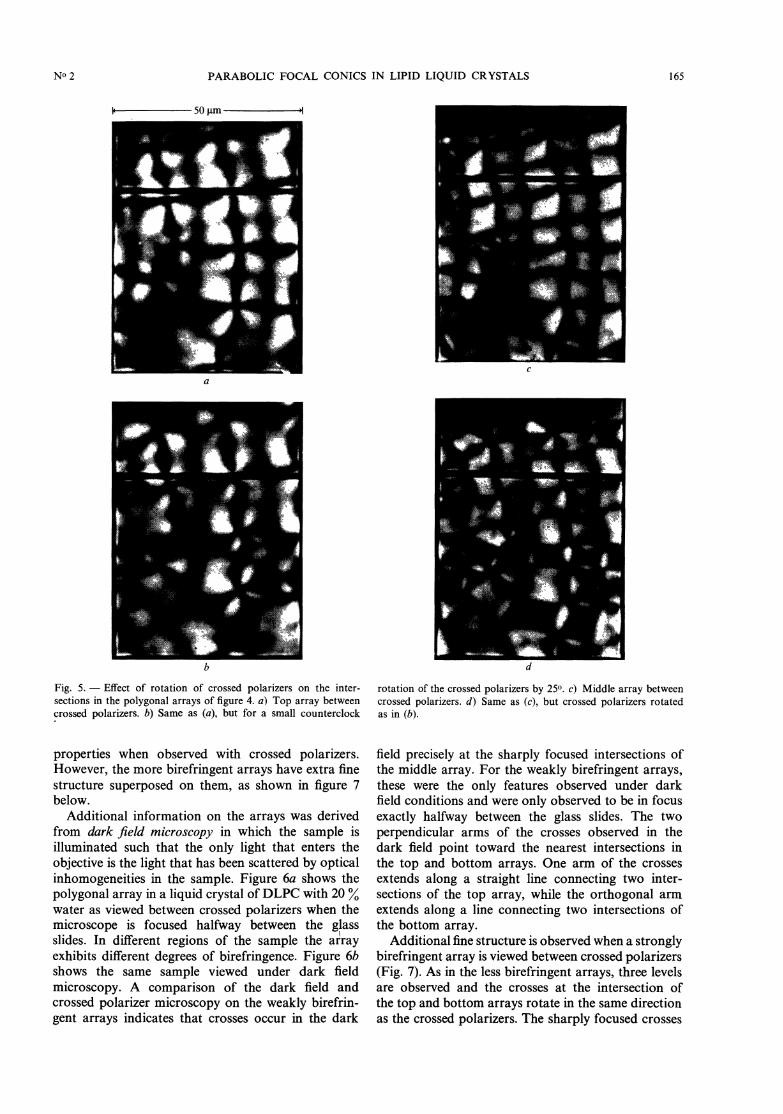
When the crossed polarizers are rotated with respectto the sample, the crosses at the intersections in thetop and bottom arrays rotate along with the polarizers.This is shown in figures 5a and 5b for a small counter-clockwise rotation. However, the crosses formed bythe sharply focused intersections of the middle arrayrotate in the opposite direction from the direction ofrotation of the crossed polarizers (Figs. 5c and 5d).All of the polygonal arrays observed exhibit the above
165
Fig. 5. - Effect of rotation of crossed polarizers on the inter-sections in the polygonal arrays of figure 4. a) Top array betweencrossed polarizers. b) Same as (a), but for a small counterclock
properties when observed with crossed polarizers.However, the more birefringent arrays have extra finestructure superposed on them, as shown in figure 7below.
Additional information on the arrays was derivedfrom dark field microscopy in which the sample isilluminated such that the only light that enters theobjective is the light that has been scattered by opticalinhomogeneities in the sample. Figure 6a shows thepolygonal array in a liquid crystal of DLPC with 20 %water as viewed between crossed polarizers when themicroscope is focused halfway between the glassslides. In different regions of the sample the arrayexhibits different degrees of birefringence. Figure 6bshows the same sample viewed under dark field
microscopy. A comparison of the dark field andcrossed polarizer microscopy on the weakly birefrin-gent arrays indicates that crosses occur in the dark
rotation of the crossed polarizers by 25°. c) Middle array betweencrossed polarizers. d) Same as (c), but crossed polarizers rotatedas in (b).
field precisely at the sharply focused intersections ofthe middle array. For the weakly birefringent arrays,these were the only features observed under darkfield conditions and were only observed to be in focusexactly halfway between the glass slides. The two
perpendicular arms of the crosses observed in thedark field point toward the nearest intersections inthe top and bottom arrays. One arm of the crossesextends along a straight line connecting two inter-sections of the top array, while the orthogonal armextends along a line connecting two intersections ofthe bottom array.
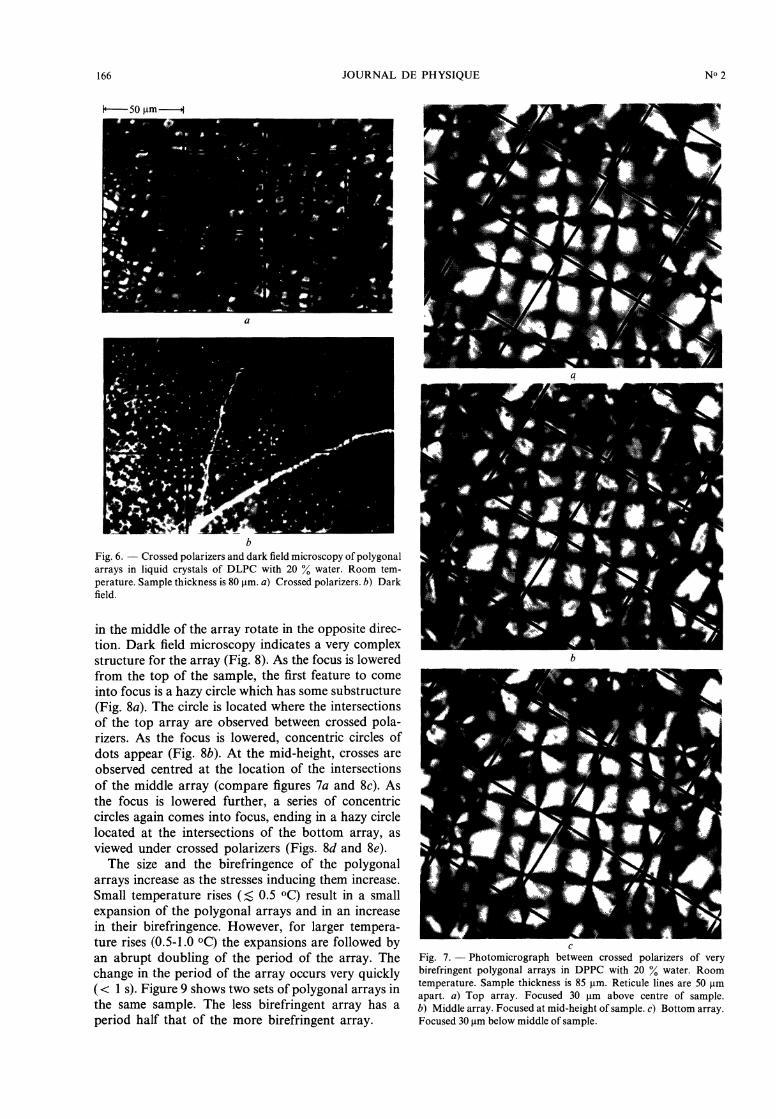
Additional fine structure is observed when a stronglybirefringent array is viewed between crossed polarizers(Fig. 7). As in the less birefringent arrays, three levelsare observed and the crosses at the intersection ofthe top and bottom arrays rotate in the same directionas the crossed polarizers. The sharply focused crosses
166
Fig. 6. - Crossed polarizers and dark field microscopy of polygonalarrays in liquid crystals of DLPC with 20 % water. Room tem-perature. Sample thickness is 80 pm. a) Crossed polarizers. b) Darkfield.
in the middle of the array rotate in the opposite direc-tion. Dark field microscopy indicates a very complexstructure for the array (Fig. 8). As the focus is loweredfrom the top of the sample, the first feature to comeinto focus is a hazy circle which has some substructure(Fig. 8a). The circle is located where the intersectionsof the top array are observed between crossed pola-rizers. As the focus is lowered, concentric circles ofdots appear (Fig. 8b). At the mid-height, crosses areobserved centred at the location of the intersectionsof the middle array (compare figures 7a and 8c). Asthe focus is lowered further, a series of concentriccircles again comes into focus, ending in a hazy circlelocated at the intersections of the bottom array, asviewed under crossed polarizers (Figs. 8d and 8e).The size and the birefringence of the polygonal
arrays increase as the stresses inducing them increase.Small temperature rises ( 0.5 °C) result in a smallexpansion of the polygonal arrays and in an increasein their birefringence. However, for larger tempera-ture rises (0.5-1.0 OC) the expansions are followed byan abrupt doubling of the period of the array. Thechange in the period of the array occurs very quickly( 1 s). Figure 9 shows two sets of polygonal arrays inthe same sample. The less birefringent array has aperiod half that of the more birefringent array.
Fig. 7. - Photomicrograph between crossed polarizers of verybirefringent polygonal arrays in DPPC with 20 % water. Roomtemperature. Sample thickness is 85 pm. Reticule lines are 50 pmapart. a) Top array. Focused 30 gm above centre of sample.b) Middle array. Focused at mid-height of sample. c) Bottom array.Focused 30 gm below middle of sample.

167
Fig. 8. - Photomicrographs using dark field of the sample shownin figure 7. Reticule lines are 50 pm apart. a) Focused 30 um abovecentre of sample. b) Focused 20 um above centre of sample. c) Focus-ed at centre of sample. d) Focused at 20 pm below centre of sample.e) Focused at 30 pm below centre of sample.
The weakly birefringent arrays cannot be seen
microscopically under natural illumination. However,a faint pattern of dots appears for the more birefrin-gent arrays. Figures 10a, lOb, and 10c show the dotpattern for the arrays shown in figures 7 and 8. Theintersections of the top and bottom arrays are poorlyresolved as fuzzy black dots. The intersections of themiddle array appear as black dots when focusedabove the middle array. These dots become white whenfocused at or below the middle of the sample. The dotpattern is difficult to observe in all but the more bire-fringent arrays. Subtle variations in detail occur
depending on the birefringence of the array. Often
Fig. 9. - Photomicrograph between crossed polars of an alignedDPPC liquid crystal containing 7 % water by weight at 96 °C. Thesample thickness is 125 J.1m. The lighter, more birefringent arrayshave a period twice that of the dark arrays. Focus is mid-height.
168
v
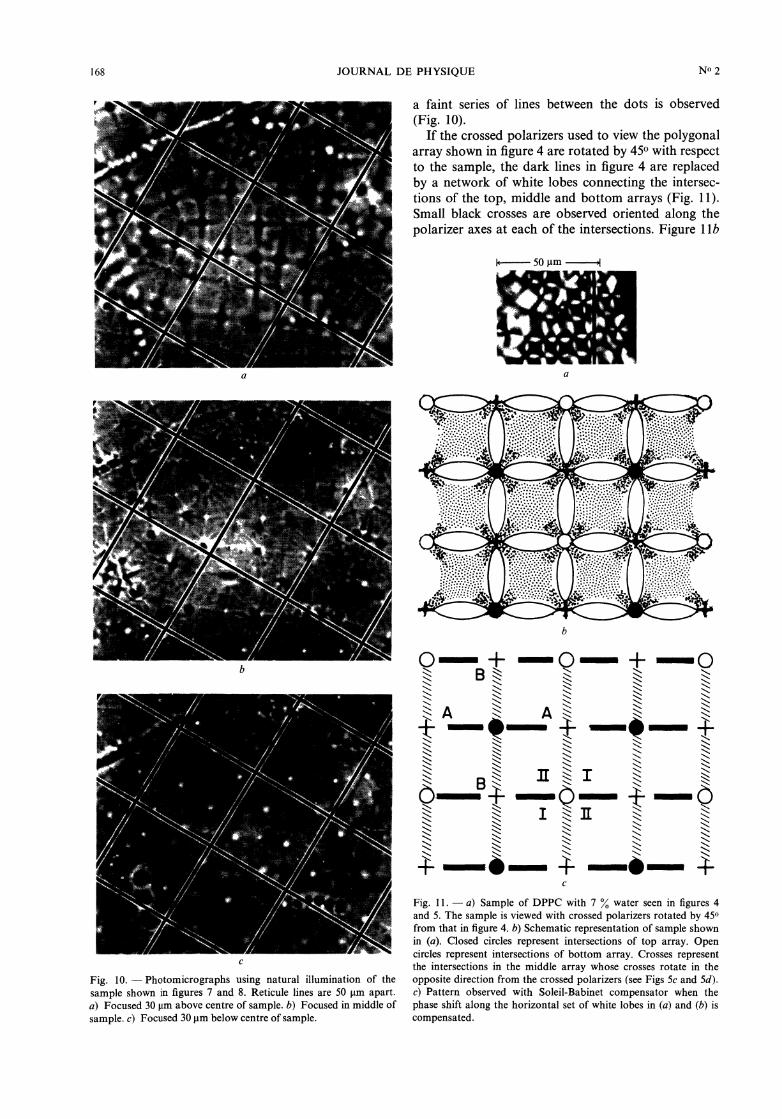
Fig. 10. - Photomicrographs using natural illumination of the
sample shown in figures 7 and 8. Reticule lines are 50 gm apart.a) Focused 30 J.1m above centre of sample. b) Focused in middle ofsample. c) Focused 30 um below centre of sample.
a faint series of lines between the dots is observed
(Fig. 10).If the crossed polarizers used to view the polygonal
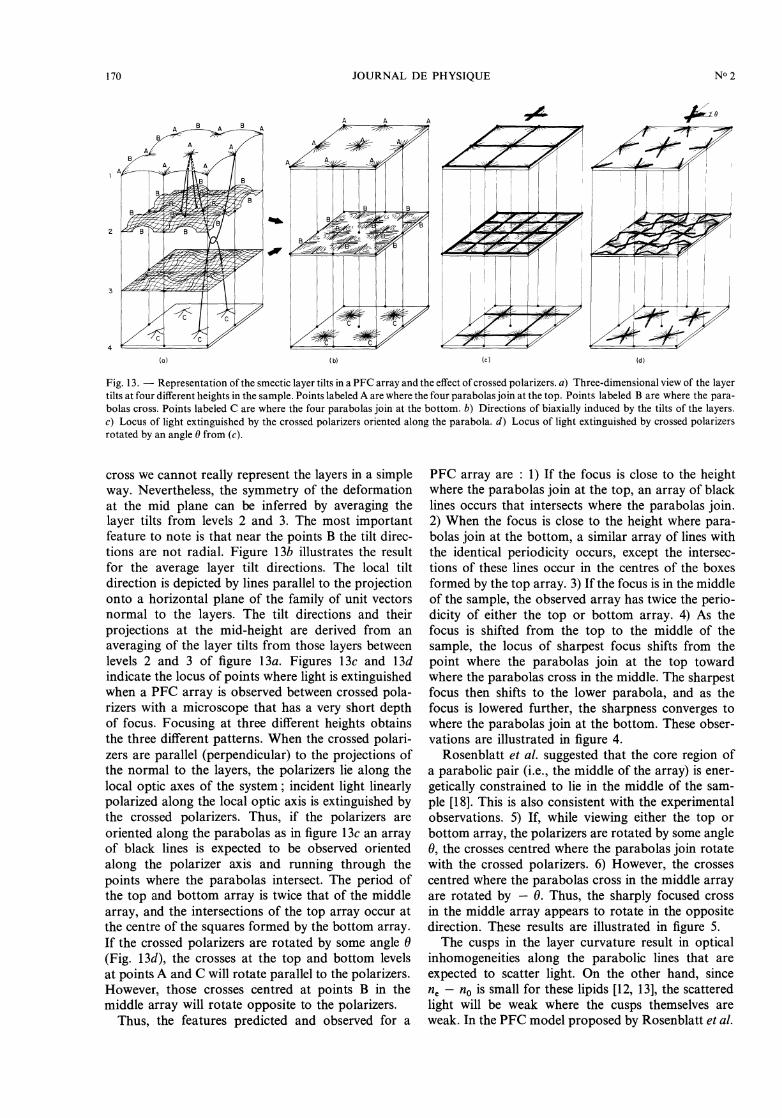
array shown in figure 4 are rotated by 450 with respectto the sample, the dark lines in figure 4 are replacedby a network of white lobes connecting the intersec-tions of the top, middle and bottom arrays (Fig. 11).Small black crosses are observed oriented along thepolarizer axes at each of the intersections. Figure 1lb
Fig. 11. - a) Sample of DPPC with 7 % water seen in figures 4and 5. The sample is viewed with crossed polarizers rotated by 450from that in figure 4. b) Schematic representation of sample shownin (a). Closed circles represent intersections of top array. Opencircles represent intersections of bottom array. Crosses representthe intersections in the middle array whose crosses rotate in the
opposite direction from the crossed polarizers (see Figs 5c and 5d).c) Pattern observed with Soleil-Babinet compensator when thephase shift along the horizontal set of white lobes in (a) and (b) iscompensated.

169
schematically represents the pattern observed in
figure 1 la. The closed black circles are the intersectionsof the top array, the open circles are the intersectionsof the bottom array, and the crosses are the sharplyfocused intersections of the middle array. Figure 11cillustrates the results observed when a Soleil-Babinet
compensator, oriented with its optic axis parallel tothe white lobes, is inserted between one of the pola-rizers and the sample. The phase shift of the compen-sator can be adjusted to exactly compensate the
sample birefringence along extended segments of thehorizontal lines running through the intersections ineither the top or bottom array and the sharply focusedintersections of the middle array. The intersectionsthemselves are uniaxial and will thus not be dark forthis same setting of the compensator. Aside from thispoint, the line segments AA are observed to be uni-formly dark. The largest birefringence in the sampleoccurs along these lines and the slow axis is parallelto AA.For this same setting of the compensator, the vertical
cross hatched lines, BB, running through the sameintersections become brighter. The first and third qua-drants, I, surrounding these intersections appearidentically, dark, but not as dark as the lines AA,while the second and fourth quadrants, II, are noti-ceably lighter, but not as light as the lines BB. Thearray is also symmetrical, in the sense that rotationof the compensator by 900 will cause the fine darklines to appear along BB and the bright lines along AA.Measurements of the ellipticity of the transmitted
light along the dark segments AA obtain optical pathdifferences of 15, 60, 80 and 340 nm for the polygonalarrays shown in figures 3b, 3c, 4 and 7, respectively.The optical path differences appear constant alongthese lines. However, at the points where the lines AAand BB would intersect, the optical path differencesare smaller. The optical path difference is also smalleraway from these lines.
In contrast to the polygonal arrays shown in figu-res 3 and 4, which show little variation in the opticalpath difference at points away from the lines connect-ing the intersections of the top, middle, and bottomarrays, the polygonal array in figure 7 shows variationsin the optical path difference at points away from theselines. These variations are difficult to measure dueto the finite resolving power of the microscope. Theyare probably related to the corrugated ribbed patternemanating from the intersections of the top andbottom arrays seen between crossed polarizers in
figure 7.
4. Discussion. - Recently, Rosenblatt et al. [18]described a model for defect structures in the ther-
motropic smectic A liquid crystal formed from cyano-benzylidene octyloxyaniline (CBOOA). CBOOA readi-ly aligns both homogeneously (smectic layers per-pendicular to glass surfaces) and homeotropically.They showed that CBOOA homogeneously aligned
Fig. 12. - Three-dimensional structure of the locus of the cusps ofthe parabolic focal conics. (After Rosenblatt et al., Ref. [18].)
forms an array of defects which they interpreted asan array of parabolic focal conics (PFC’s). In theirmodel they described these defects in terms of layercurvatures, the geometry of the defects, the energeticsof the defects and their mechanism of formation. Dueto the well-defined layer thicknesses in smectic liquidcrystals, any defects in the alignment of the layers areconstrained to particular geometric configurations inwhich the smectic layers form a family of surfacesknown as Dupin cyclides. The layers curve smoothlyexcept at a series of line defects where cusps in thecurvature of individual layers occur. Rosenblatt et al.suggested that the loci of the cusps are pairs of para-bolas passing through each other’s focus. An arrayof these PFC’s forms the network visualized in
figure 12. A consideration of the PFC model suggeststhe optical effects expected for a PFC array in a
homeotropically aligned sample. The first feature tonote in figure 12 is the presence of a three level system.The points where the parabola join together at thetop or the bottom have four-fold symmetry. The
layers curve away from the point where the parabolasjoin. In the middle, where the parabolas cross, thestructure has the symmetry of a saddle surface.Rosenblatt et al. described the details of a model forthis region in which the layers formed multiply con-nected surfaces. The details of this structure follow
directly from the assumption that the elastic resistanceto layer curvature is zero, while the resistance to
change of layer thickness is infinite.
Figure 13a is a qualitative representation of thelayer deformation in a PFC array at four differentheights in the sample. The cusps labeled A at theheight labeled 1, where the four parabolas join, splitinto four different cusps at the height of 2. The pro-jections of the layer normals in the regions surround-ing the cusps at height 1 radiate out from the cusps.This is illustrated in figure 13b. Similarly, at the lowestlevel, although the cusps are pointed up rather thandown, the projections of the layer normals are radialwith respect to the cusps. Intermediate heights 2 and 3are more complicated since none of the four cuspsat either height is cylindrically symmetrical. Further-more, at the mid-height where the two parabolas
170
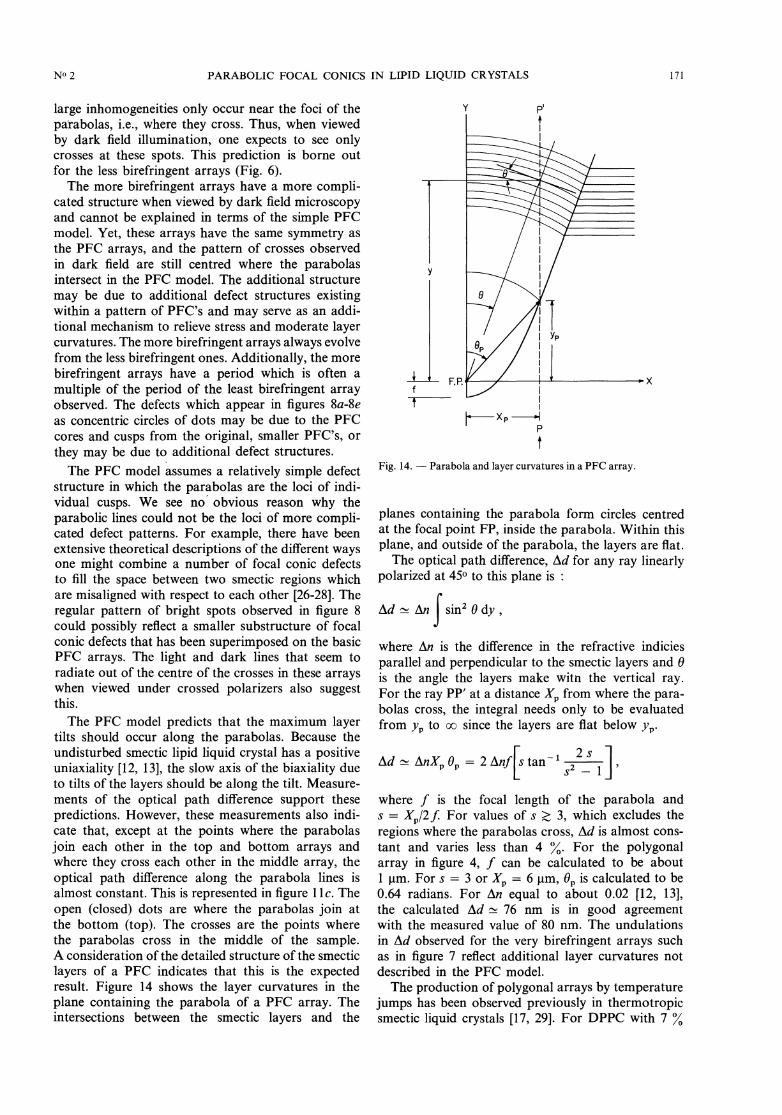
Fig. 13. - Representation of the smectic layer tilts in a PFC array and the effect of crossed polarizers. a) Three-dimensional view of the layertilts at four different heights in the sample. Points labeled A are where the four parabolas join at the top. Points labeled B are where the para-bolas cross. Points labeled C are where the four parabolas join at the bottom. b) Directions of biaxially induced by the tilts of the layers.c) Locus of light extinguished by the crossed polarizers oriented along the parabola. d) Locus of light extinguished by crossed polarizersrotated by an angle 0 from (c).
cross we cannot really represent the layers in a simpleway. Nevertheless, the symmetry of the deformationat the mid plane can be inferred by averaging thelayer tilts from levels 2 and 3. The most importantfeature to note is that near the points B the tilt direc-tions are not radial. Figure 13b illustrates the resultfor the average layer tilt directions. The local tiltdirection is depicted by lines parallel to the projectiononto a horizontal plane of the family of unit vectorsnormal to the layers. The tilt directions and their
projections at the mid-height are derived from anaveraging of the layer tilts from those layers betweenlevels 2 and 3 of figure 13a. Figures 13c and 13dindicate the locus of points where light is extinguishedwhen a PFC array is observed between crossed pola-rizers with a microscope that has a very short depthof focus. Focusing at three different heights obtainsthe three different patterns. When the crossed polari-zers are parallel (perpendicular) to the projections ofthe normal to the layers, the polarizers lie along thelocal optic axes of the system ; incident light linearlypolarized along the local optic axis is extinguished bythe crossed polarizers. Thus, if the polarizers are
oriented along the parabolas as in figure 13c an arrayof black lines is expected to be observed orientedalong the polarizer axis and running through thepoints where the parabolas intersect. The period ofthe top and bottom array is twice that of the middle
array, and the intersections of the top array occur atthe centre of the squares formed by the bottom array.If the crossed polarizers are rotated by some angle 0(Fig. 13d), the crosses at the top and bottom levelsat points A and C will rotate parallel to the polarizers.However, those crosses centred at points B in themiddle array will rotate opposite to the polarizers.
Thus, the features predicted and observed for a
PFC array are : 1) If the focus is close to the heightwhere the parabolas join at the top, an array of blacklines occurs that intersects where the parabolas join.2) When the focus is close to the height where para-bolas join at the bottom, a similar array of lines withthe identical periodicity occurs, except the intersec-tions of these lines occur in the centres of the boxesformed by the top array. 3) If the focus is in the middleof the sample, the observed array has twice the perio-dicity of either the top or bottom array. 4) As thefocus is shifted from the top to the middle of thesample, the locus of sharpest focus shifts from thepoint where the parabolas join at the top towardwhere the parabolas cross in the middle. The sharpestfocus then shifts to the lower parabola, and as thefocus is lowered further, the sharpness converges towhere the parabolas join at the bottom. These obser-vations are illustrated in figure 4.
Rosenblatt et al. suggested that the core region ofa parabolic pair (i.e., the middle of the array) is ener-getically constrained to lie in the middle of the sam-ple [18]. This is also consistent with the experimentalobservations. 5) If, while viewing either the top orbottom array, the polarizers are rotated by some angle0, the crosses centred where the parabolas join rotatewith the crossed polarizers. 6) However, the crossescentred where the parabolas cross in the middle arrayare rotated by - 0. Thus, the sharply focused crossin the middle array appears to rotate in the oppositedirection. These results are illustrated in figure 5.The cusps in the layer curvature result in optical
inhomogeneities along the parabolic lines that are
expected to scatter light. On the other hand, sincene - no is small for these lipids [12, 13], the scatteredlight will be weak where the cusps themselves areweak. In the PFC model proposed by Rosenblatt et al.
171
large inhomogeneities only occur near the foci of theparabolas, i.e., where they cross. Thus, when viewedby dark field illumination, one expects to see onlycrosses at these spots. This prediction is borne outfor the less birefringent arrays (Fig. 6).The more birefringent arrays have a more compli-
cated structure when viewed by dark field microscopyand cannot be explained in terms of the simple PFCmodel. Yet, these arrays have the same symmetry asthe PFC arrays, and the pattern of crosses observedin dark field are still centred where the parabolasintersect in the PFC model. The additional structure
may be due to additional defect structures existingwithin a pattern of PFC’s and may serve as an addi-tional mechanism to relieve stress and moderate layercurvatures. The more birefringent arrays always evolvefrom the less birefringent ones. Additionally, the morebirefringent arrays have a period which is often a
multiple of the period of the least birefringent arrayobserved. The defects which appear in figures 8a-8eas concentric circles of dots may be due to the PFCcores and cusps from the original, smaller PFC’s, orthey may be due to additional defect structures.The PFC model assumes a relatively simple defect
structure in which the parabolas are the loci of indi-vidual cusps. We see non obvious reason why theparabolic lines could not be the loci of more compli-cated defect patterns. For example, there have beenextensive theoretical descriptions of the different waysone might combine a number of focal conic defectsto fill the space between two smectic regions whichare misaligned with respect to each other [26-28]. Theregular pattern of bright spots observed in figure 8could possibly reflect a smaller substructure of focalconic defects that has been superimposed on the basicPFC arrays. The light and dark lines that seem toradiate out of the centre of the crosses in these arrayswhen viewed under crossed polarizers also suggestthis.
The PFC model predicts that the maximum layertilts should occur along the parabolas. Because theundisturbed smectic lipid liquid crystal has a positiveuniaxiality [12, 13], the slow axis of the biaxiality dueto tilts of the layers should be along the tilt. Measure-ments of the optical path difference support thesepredictions. However, these measurements also indi-cate that, except at the points where the parabolasjoin each other in the top and bottom arrays andwhere they cross each other in the middle array, theoptical path difference along the parabola lines isalmost constant. This is represented in figure 11c. Theopen (closed) dots are where the parabolas join atthe bottom (top). The crosses are the points wherethe parabolas cross in the middle of the sample.A consideration of the detailed structure of the smectic
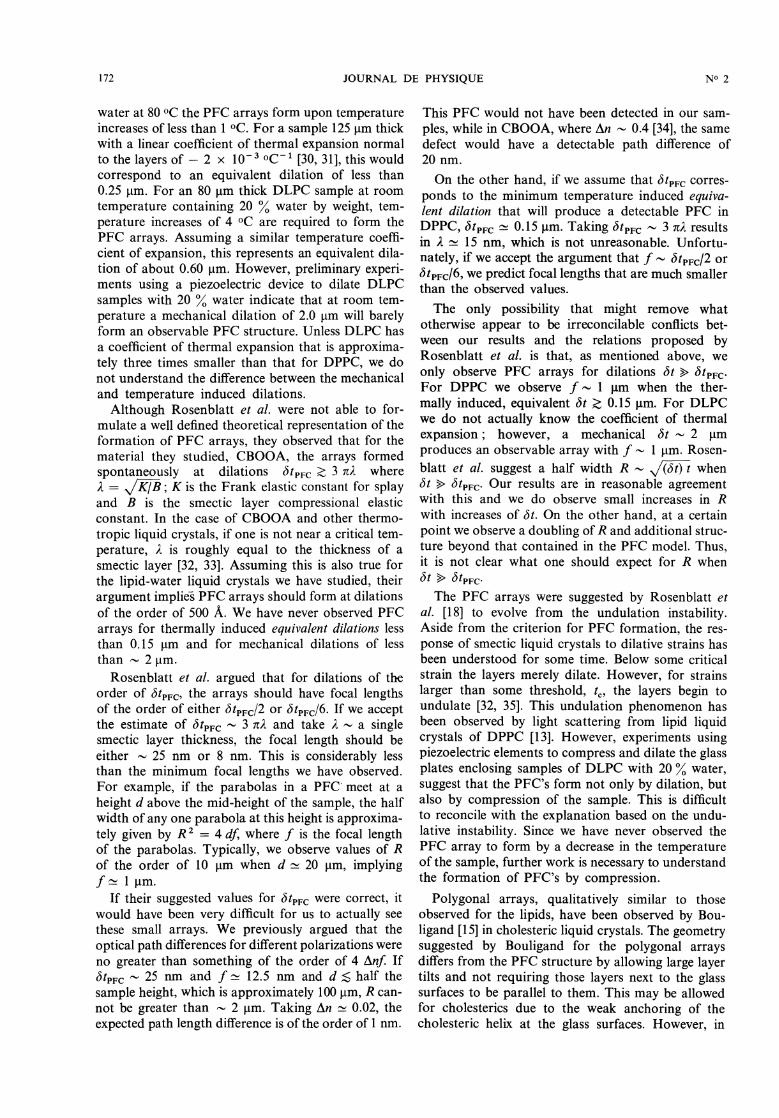
layers of a PFC indicates that this is the expectedresult. Figure 14 shows the layer curvatures in theplane containing the parabola of a PFC array. Theintersections between the smectic layers and the
Fig. 14. - Parabola and layer curvatures in a PFC array.
planes containing the parabola form circles centredat the focal point FP, inside the parabola. Within thisplane, and outside of the parabola, the layers are flat.The optical path difference, Ad for any ray linearly
polarized at 450 to this plane is :
where An is the difference in the refractive indicies
parallel and perpendicular to the smectic layers and 0is the angle the layers make witn the vertical ray.For the ray PP’ at a distance Xp from where the para-bolas cross, the integral needs only to be evaluatedfrom yp to oo since the layers are flat below yp.
where f is the focal length of the parabola ands = Xp/2 f. For values of s ;(: 3, which excludes theregions where the parabolas cross, Ad is almost cons-tant and varies less than 4 %. For the polygonalarray in figure 4, f can be calculated to be about1 gm. For s = 3 or Xp = 6 pm, 0p is calculated to be0.64 radians. For An equal to about 0.02 [12, 13],the calculated Ad ri 76 nm is in good agreementwith the measured value of 80 nm. The undulationsin Ad observed for the very birefringent arrays suchas in figure 7 reflect additional layer curvatures notdescribed in the PFC model.The production of polygonal arrays by temperature
jumps has been observed previously in thermotropicsmectic liquid crystals [17, 29]. For DPPC with 7 %
172
water at 80 °C the PFC arrays form upon temperatureincreases of less than 1 °C. For a sample 125 pm thickwith a linear coefficient of thermal expansion normalto the layers of - 2 x 10⁻³ °C-1 [30, 31], this wouldcorrespond to an equivalent dilation of less than0.25 gm. For an 80 pm thick DLPC sample at roomtemperature containing 20 % water by weight, tem-perature increases of 4 °C are required to form thePFC arrays. Assuming a similar temperature coeffi-cient of expansion, this represents an equivalent dila-tion of about 0.60 gm. However, preliminary experi-ments using a piezoelectric device to dilate DLPC
samples with 20 % water indicate that at room tem-perature a mechanical dilation of 2.0 pm will barelyform an observable PFC structure. Unless DLPC hasa coefficient of thermal expansion that is approxima-tely three times smaller than that for DPPC, we donot understand the difference between the mechanicaland temperature induced dilations.Although Rosenblatt et al. were not able to for-
mulate a well defined theoretical representation of theformation of PFC arrays, they observed that for thematerial they studied, CBOOA, the arrays formedspontaneously at dilations ÔtPFC ~ 3 n where
 = KJB ; K is the Frank elastic constant for splayand B is the smectic layer compressional elasticconstant. In the case of CBOOA and other thermo-
tropic liquid crystals, if one is not near a critical tem-perature, is roughly equal to the thickness of asmectic layer [32, 33]. Assuming this is also true forthe lipid-water liquid crystals we have studied, theirargument implies PFC arrays should form at dilationsof the order of 500 Á. We have never observed PFCarrays for thermally induced equivalent dilations lessthan 0.15 pm and for mechanical dilations of lessthan - 2 Jlm.
Rosenblatt et al. argued that for dilations of thenorder of ÔTIFCI the arrays should have focal lengthsof the order of either JtpFc/2 or JtpFc/6. If we acceptthe estimate of J tPFC ~ 3 n and take À - a singlesmectic layer thickness, the focal length should beeither - 25 nm or 8 nm. This is considerably lessthan the minimum focal lengths we have observed.For example, if the parabolas in a PFC. meet at aheight d above the mid-height of the sample, the halfwidth of any one parabola at this height is approxima-tely given by R2 = 4 df, where f is the focal lengthof the parabolas. Typically, we observe values of Rof the order of 10 pm when d rr 20 gm, implyingf ~ 1 gm.
If their suggested values for ÔTPFC were correct, it
would have been very difficult for us to actually seethese small arrays. We previously argued that theoptical path differences for different polarizations wereno greater than something of the order of 4 dnf. IfÔ TPFC - 25 nm and f ~ 12.5 nm and d half thesample height, which is approximately 100 pm, R can-not be greater than - 2 gm. Taking An ri 0.02, theexpected path length difference is of the order of 1 nm.
This PFC would not have been detected in our sam-
ples, while in CBOOA, where An - 0.4 [34], the samedefect would have a detectable path difference of20 nm.
On the other hand, if we assume that JtPFC corres-ponds to the minimum temperature induced equiva-lent dilation that will produce a detectable PFC inDPPC, ôtpfc - 0.15 gm. Taking ÔTPFC - 3 nÀ resultsin À 15 nm, which is not unreasonable. Unfortu-nately, if we accept the argument that f - ÔtPFC/2 orÔ tPFC/6, we predict focal lengths that are much smallerthan the observed values.
The only possibility that might remove whatotherwise appear to be irreconcilable conflicts bet-ween our results and the relations proposed byRosenblatt et al. is that, as mentioned above, weonly observe PFC arrays for dilations Jt btpfc.For DPPC we observe f ~ 1 pm when the ther-
mally induced, equivalent bt > 0.15 gm. For DLPCwe do not actually know the coefficient of thermalexpansion; however, a mechanical ôt - 2 Jlm
produces an observable array with f - 1 um. Rosen-
blatt et al. suggest a half width R - J(Iifi whenÔt » ÔTPFC- Our results are in reasonable agreementwith this and we do observe small increases in Rwith increases of ôt. On the other hand, at a certainpoint we observe a doubling of R and additional struc-ture beyond that contained in the PFC model. Thus,it is not clear what one should expect for R whenôt » JtpFC.The PFC arrays were suggested by Rosenblatt et
al. [18] to evolve from the undulation instability.Aside from the criterion for PFC formation, the res-ponse of smectic liquid crystals to dilative strains hasbeen understood for some time. Below some criticalstrain the layers merely dilate. However, for strainslarger than some threshold, tc, the layers begin toundulate [32, 35]. This undulation phenomenon hasbeen observed by light scattering from lipid liquidcrystals of DPPC [13]. However, experiments usingpiezoelectric elements to compress and dilate the glassplates enclosing samples of DLPC with 20 % water,suggest that the PFC’s form not only by dilation, butalso by compression of the sample. This is difficultto reconcile with the explanation based on the undu-lative instability. Since we have never observed thePFC array to form by a decrease in the temperatureof the sample, further work is necessary to understandthe formation of PFC’s by compression.
Polygonal arrays, qualitatively similar to thoseobserved for the lipids, have been observed by Bou-ligand [15] in cholesteric liquid crystals. The geometrysuggested by Bouligand for the polygonal arraysdiffers from the PFC structure by allowing large layertilts and not requiring those layers next to the glasssurfaces to be parallel to them. This may be allowedfor cholesterics due to the weak anchoring of thecholesteric helix at the glass surfaces. However, in
173
the lipids and in CBOOA [18] the anchoring appearsto be strong.The PFC arrays in the lipids appear more regular
than those in CBOOA. Also, the appearance and
disappearance of the arrays shows a more cooperativebehaviour than in CBOOA ; the lipid PFC’s rarelyappear and disappear individually. Also, they arestable for long periods of time. The differences bet-ween the PFC’s in CBOOA and in the lipids may bedue to différences in the smectic layer structures ofthermotropic and lyotropic liquid crystals. Due to theseparate polar and non-polar parts of the lipid mole-cules and because of the water layers between thelipid bilayers, the smectic layers of the lipid are verywell defined. There is little permeation of a moleculefrom one lipid bilayer to another ; as a result, it isdifficult for the smectic layers in lipids under stressto break and reform into configurations of lowerenergy.
5. Conclusions. - We have suggested that some ofthe polygonal arrays found in lipid liquid crystals of
phosphatidylcholines are parabolic focal conic arrays.Other more birefringent arrays have a more complexstructure. Since all of the polygonal arrays appearsimilar when viewed between crossed polarizers, theycan only be differentiated by additional techniquessuch as dark field microscopy. These arrays are ubi-quitous in lipid liquid crystals and result from tempe-rature increases and mechanical strains. Careful ther-
mostating of these liquid crystals is necessary if one
hopes to maintain aligned, uniaxial and defect-freesamples.
Acknowledgments. - We would like to gratefullyacknowledge very helpful conversations with RobertMeyer and Y. Bouligand. We would also like to
acknowledge the helpful comments and criticisms byCharles Rosenblatt and Michael Fisch. We thankPaul Demchak for technical assistance in the earlystages of this work. In addition, one of us (SA) wouldlike to thank Robert Meyer for his encouragement inthe early stages of this work.
References
[1] CHAPMAN, D., Quart. Rev. Biophys. 8 (1975) 185.[2] MELCHIOR, D. L. and STEIN, J. M., Ann. Rev. Biophys. Bioeng.
5 (1976) 205.[3] LEPESANT, J. P., POWERS, L. and PERSHAN, P. S., Proc. Natl.
Acad. Sci. (USA) 75 (1978) 1792.[4] CHAN, W. and PERSHAN, P. S., Phys. Rev. Lett. 39 (1977)
1368.
[5] Wu, E.-S., JACOBSON, K. and PAPAHADJOPOULOS, D., Biochem.16 (1977) 3936.
[6] SANSON, A., PTAK, M., RIGAUD, J. L. and GARY-BOBO, C. M.,Chem. Phys. Lipids 17 (1976) 445.
[7] JOST, P., LIBERTINI, L. J., HEBERT, V. C. and GRIFFITH, O. H.,J. Mol. Biol. 59 (1971) 77.
[8] LEVINE, Y. K. and WILKINS, M. H. F., Nature New Biol.230 (1971) 69.
[9] HSIA, J.-C., SCHNEIDER, H. and SMITH, I. C. P., Biochem.Biophys. Acta 202 (1970) 399.
[10] LIBERTINI, L. J., WAGGONER, A. S., JOST, P. C. and GRIF-FITH, O. H., Proc. Natl. Acad. Sci. (USA) 64 (1969) 13.
[11] LEVINE, Y. K., BAILEY, A. J. and WILKINS, M. H., Nature220 (1968) 577.
[12] POWERS, L. and PERSHAN, P. S., Biophys. J. 20 (1977) 137.
[13] POWERS, L. and CLARK, N. A., Proc. Natl. Acad. Sci. (USA)72 (1975) 840.
[14] ASHER, S. A. and PERSHAN, P. S., Biophys. J. 21 (1978) 123-a.[15] BOULIGAND, Y., J. Physique 33 (1972) 715.[16] KAHN, F. J., Appl. Phys. Lett. 3 (1973) 111.[17] RIBOTTA, R., Ph. D. thesis, Université de Paris-Sud, Orsay;
J. Physique Colloq. 37 (1976) C3-149.[18] ROSENBLATT, C. S., PINDAK, R., CLARK, N. A. and
MEYER, R. B., J. Physique 38 (1977) 1105.[19] ELWORTHY, P. H., J. Chem. Soc. (1959) 813 and (1960) 139.
[20] LUZZATI, V. and TARDIEU, A., Ann. Rev. Phys. Chem. 25(1974) 79.
[21] CHAPMAN, D., WILLIAMS, R. M. and LADBROOKE, B. D.,Chem. Phys. Lipids 1 (1967) 445.
[22] WILLIAMS, R. M. and CHAPMAN, D., Progress in the Chemistryof Fats and Other Lipids, R. T. Holman, editor (PergamonPress, Oxford) 1970, Vol. 11, p. 1.
[23] LUZZATI, V., Biological Membranes, D. Chapman, editor
(Academic Press, London) 1968, Vol. 1, p. 71.[24] RANCK, J. L., MATEU, L., SADLER, D. M., TARDIEU, A.,
GULIK-KRZYWICKI, T. and LUZZATI, V., J. Mol. Biol.85 (1974) 249.
[25] LUZZATI, V., MUSTACCHI, H., STOULIOS, A. and JUSSON, F.,Acta Crystallogr. 13 (1960) 660.
[26] BIDEAUX, R., BOCCARA, N., SARMA, G., DE SEZE, L., DEGENNES, P. G. and PARODI, O., J. Physique 34 (1973)661.
[27] BOULIGAND, Y., J. Physique 33 (1972) 525.[28] BRAGG, W. H., Nature 133 (1934) 445.[29] RIBOTTA, R., J. Physique Colloq. 37 (1976) C3-149.[30] LUZATTI, V., Biological Membranes (Academic Press,
New York) 1968, p. 71.
[31] RAND, R. P. and PANGBORN, W. A., Biochem. Biophys. Acta318 (1973) 299.
[32] DELAYE, M., RIBOTTA, R. and DURAND, G., Phys. Lett.44A (1973) 139.
[33] DE GENNES, P. B., The Physics of Liquid Crystals (OxfordUniversity Press, London) 1974, p. 291.
[34] HUANG, C. C., PINDAK, R. S. and Ho, J. T., J. Physique Lett.35 (1974) L-185.
[35] CLARK, N. A. and MEYER, R. B., Appl. Phys. Lett. 22 (1973) 4.