Embed Size (px)
Citation preview

PARABOLAS and the GRAPHIC CALCULATOR
(PARABOLEN en
de GRAFISCHE REKENMACHINE )

The quadratic function
f: x → ax2 + bx + c Parabola
-5 -4 -3 -2 -1 1 2 3 4 5
-5
-4
-3
-2
-1
1
2
3
4
5
X
Y
x
f(x)=x^2-2x-3
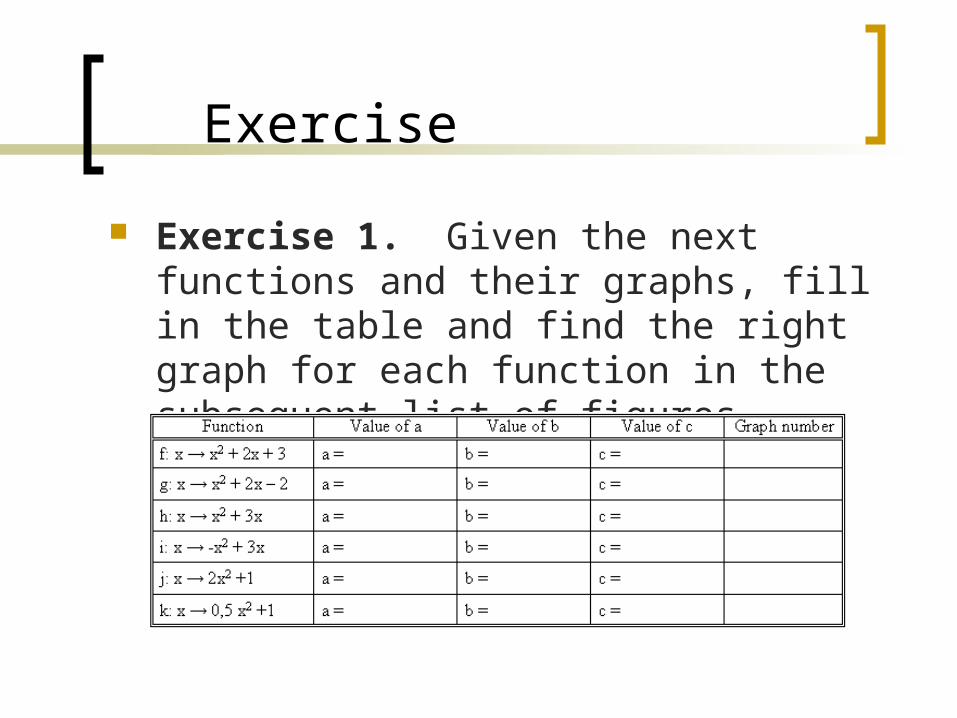
Exercise
Exercise 1. Given the next functions and their graphs, fill in the table and find the right graph for each function in the subsequent list of figures.
Changing c
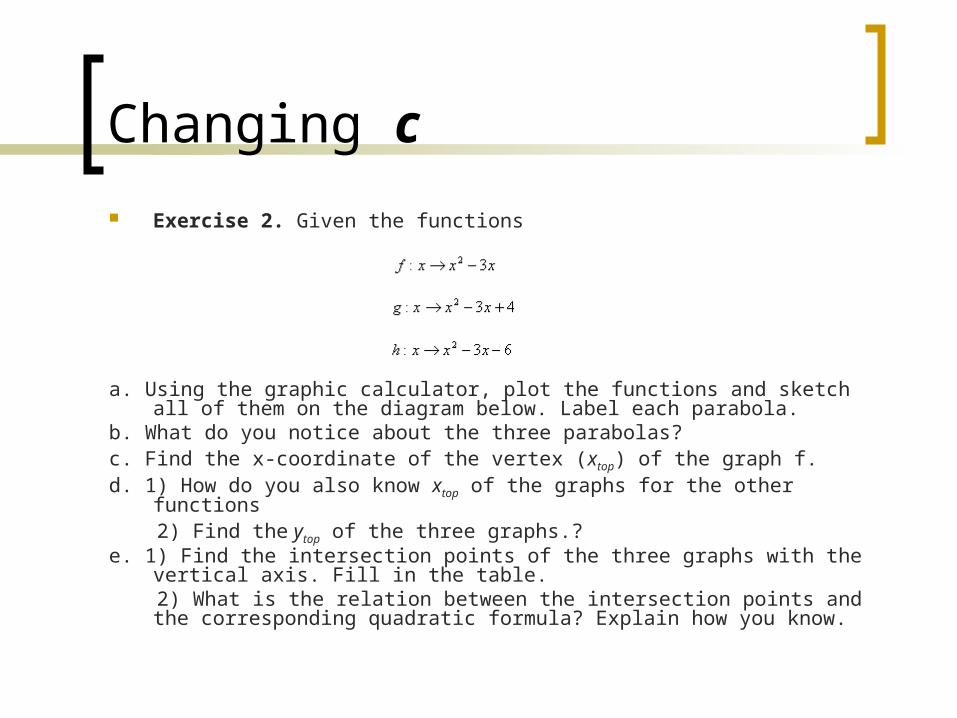
Exercise 2. Given the functions
a. Using the graphic calculator, plot the functions and sketch all of them on the diagram below. Label each parabola.
b. What do you notice about the three parabolas?c. Find the x-coordinate of the vertex (xtop) of the graph f. d. 1) How do you also know xtop of the graphs for the other functions 2) Find the ytop of the three graphs.? e. 1) Find the intersection points of the three graphs with the vertical axis. Fill in
the table. 2) What is the relation between the intersection points and the corresponding
quadratic formula? Explain how you know.
Student presentation 1.
Changing c
Changing c
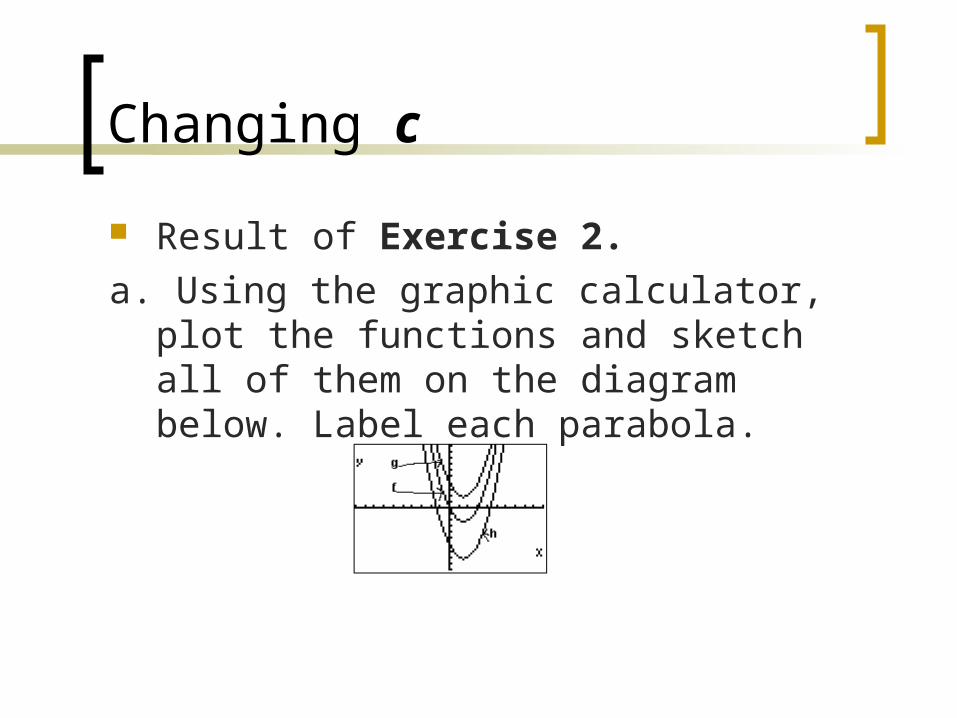
Result of Exercise 2.
a. Using the graphic calculator, plot the functions and sketch all of them on the diagram below. Label each parabola.

Changing c
Result of Exercise 2.b. What do you notice about the three
parabolas? The three parabolas are identical
because the only change is a translation along the common axis of symmetry of the three parabolas. This is due to a change of the value c.

Changing c
Result of Exercise 2.
c. Find the x-coordinate of the vertex (xtop) of the graph f.
The real value is x = 1.5 but with the graphic calculator we find an approximate value, xtop = 1.4893617.

Changing c
Result of Exercise 2.
d. 1) How do you also know xtop of the graphs for the other functions?
The xtop of the three graphs are the same because we have only changed the value 'c'.

Changing c
Result of Exercise 2.
d. 2) Find the ytop of the three graphs.
The real values of the ytop are -2.25 (f), 1.75 (g), and -8.25 (h), but the graphic calculator shows the next:
Changing c
Result of Exercise 2.
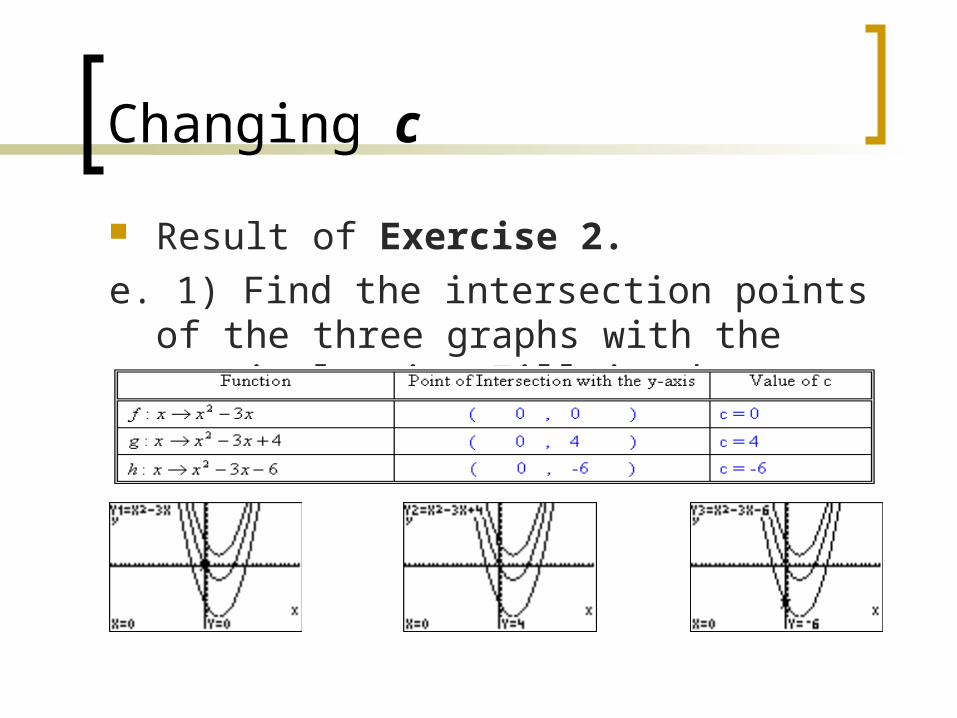
e. 1) Find the intersection points of the three graphs with the vertical axis. Fill in the table.

Changing c
Result of Exercise 2.e. 2) What is the relation between the
intersection points and the corresponding quadratic formula? Explain how you know.
The value c is the same one that the y-coordinate of the point of the intersection with the y-axes.

Changing a
Exercise 3. Given the functions
a. Using the graphic calculator, plot the functions and sketch them on the diagram below. Label each parabola.
b. What do you notice about the three parabolas? c. 1) Fill in the table. 2) What is the relation between value of a and the
corresponding graph? Please explain.
Student presentation 2.
Changing a

Changing a
Result of Exercise 3.
a. Using the graphic calculator, plot the functions and sketch them on the diagram below. Label each parabola.
Changing a
Result of Exercise 3.
b. What do you notice about the three parabolas?
The only big difference among the parabolas is their width.
Changing a
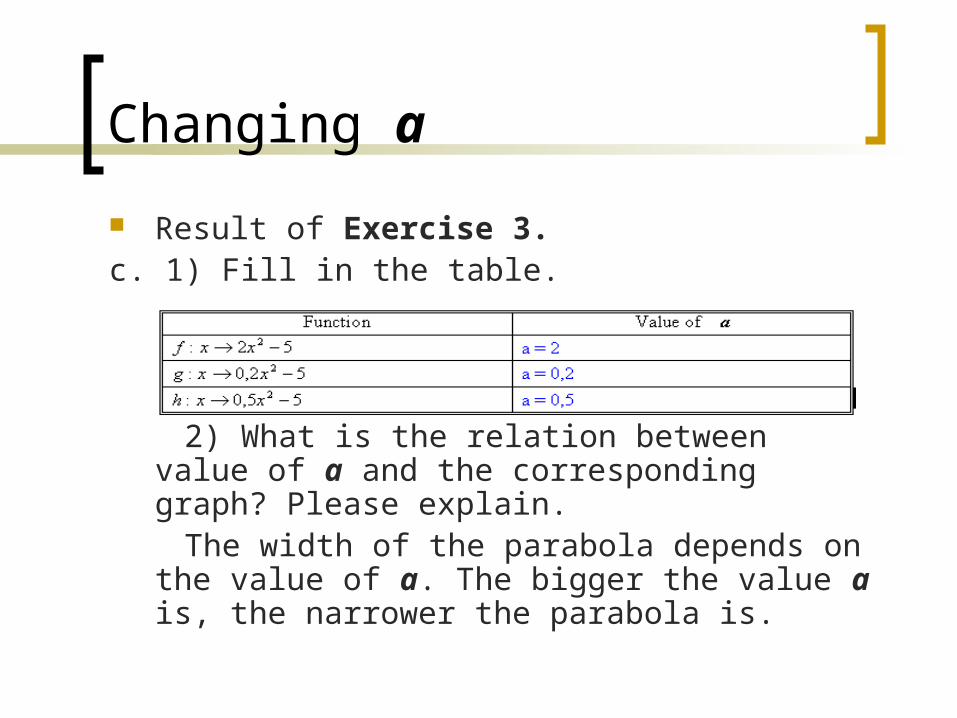
Result of Exercise 3.c. 1) Fill in the table.
2) What is the relation between value of a and the corresponding graph? Please explain.
The width of the parabola depends on the value of a. The bigger the value a is, the narrower the parabola is.
Changing a
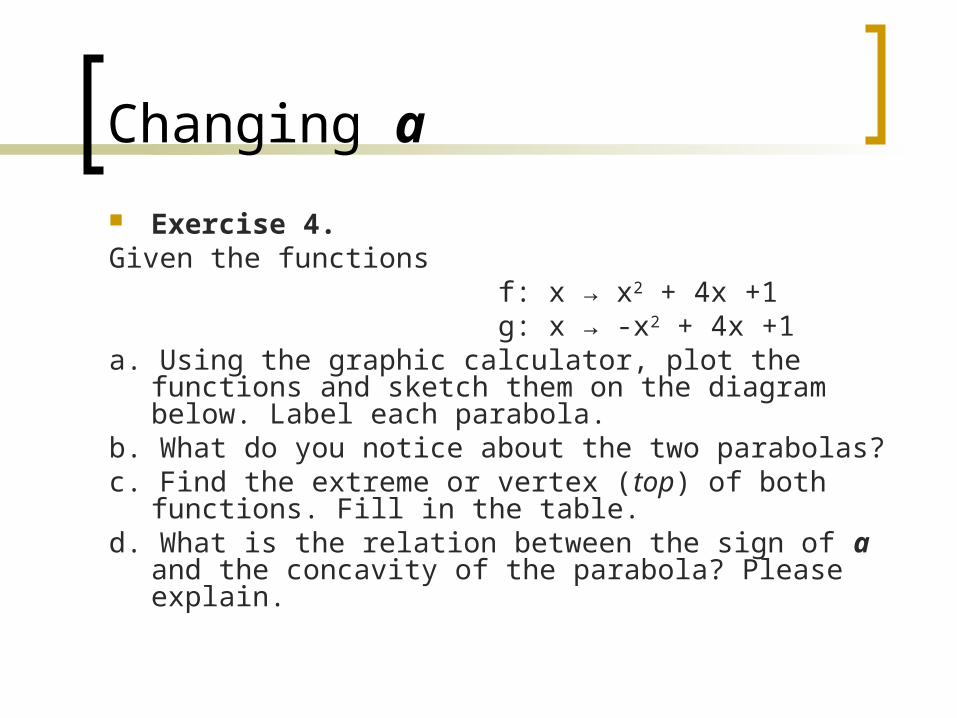
Exercise 4.Given the functions f: x → x2 + 4x +1 g: x → -x2 + 4x +1a. Using the graphic calculator, plot the functions and
sketch them on the diagram below. Label each parabola.
b. What do you notice about the two parabolas? c. Find the extreme or vertex (top) of both functions. Fill
in the table. d. What is the relation between the sign of a and the
concavity of the parabola? Please explain.

Student presentation 3.
Changing a

Changing a
Result of Exercise 4.a. Using the graphic calculator, plot the functions and
sketch them on the diagram below. Label each parabola.
b. What do you notice about the two parabolas? That concavity changes (f is een dalparabool and g is een bergparabool).
Changing a
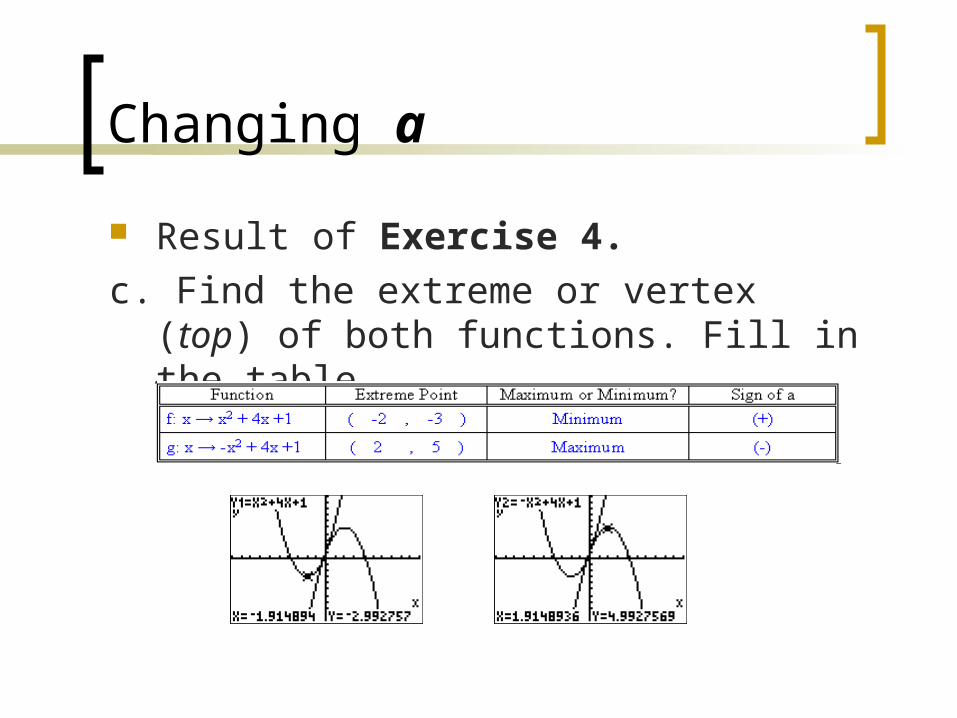
Result of Exercise 4.
c. Find the extreme or vertex (top) of both functions. Fill in the table.
Changing a
Result of Exercise 4.
d. What is the relation between the sign of a and the concavity of the parabola? Please explain.
The change depends on the sign of a.
a > 0 (dalparabool) and
a < 0 (bergparabool).
Check the Exercise 1 again
Now you should be able to verify your answer to Exercise 1 for yourself. First, check the answer that you gave before (do you still agree with your answers?). Then compare your answer to someone else’s.

To find out more…
Changing a and c
Given are the three diagrams below. For each diagram, explain in terms of a and c what the difference is between the two graphs.

End of topic activity
After finishing the activity, please give the graphic calculator back to us.
We really hope you enjoyed yourself.
Thank you very much!!! TOT ZIENS!!!