Embed Size (px)
Citation preview

Speech Communication 42 (2004) 271–287
www.elsevier.com/locate/specom
Efficient voice activity detection algorithmsusing long-term speech information
Javier Ram�ırez *, Jos�e C. Segura 1, Carmen Ben�ıtez, �Angel de la Torre,Antonio Rubio 2
Dpto. Electr�onica y Tecnolog�ıa de Computadores, Universidad de Granada, Campus Universitario Fuentenueva, 18071 Granada, Spain
Received 5 May 2003; received in revised form 8 October 2003; accepted 8 October 2003
Abstract
Currently, there are technology barriers inhibiting speech processing systems working under extreme noisy condi-
tions. The emerging applications of speech technology, especially in the fields of wireless communications, digital
hearing aids or speech recognition, are examples of such systems and often require a noise reduction technique
operating in combination with a precise voice activity detector (VAD). This paper presents a new VAD algorithm for
improving speech detection robustness in noisy environments and the performance of speech recognition systems. The
algorithm measures the long-term spectral divergence (LTSD) between speech and noise and formulates the speech/
non-speech decision rule by comparing the long-term spectral envelope to the average noise spectrum, thus yielding a
high discriminating decision rule and minimizing the average number of decision errors. The decision threshold is
adapted to the measured noise energy while a controlled hang-over is activated only when the observed signal-to-noise
ratio is low. It is shown by conducting an analysis of the speech/non-speech LTSD distributions that using long-term
information about speech signals is beneficial for VAD. The proposed algorithm is compared to the most commonly
used VADs in the field, in terms of speech/non-speech discrimination and in terms of recognition performance when the
VAD is used for an automatic speech recognition system. Experimental results demonstrate a sustained advantage over
standard VADs such as G.729 and adaptive multi-rate (AMR) which were used as a reference, and over the VADs of
the advanced front-end for distributed speech recognition.
� 2003 Elsevier B.V. All rights reserved.
Keywords: Speech/non-speech detection; Speech enhancement; Speech recognition; Long-term spectral envelope; Long-term spectral
divergence
*Corresponding author. Tel.: +34-958243271; fax: +34-
958243230.
E-mail addresses: [email protected] (J. Ram�ırez), segura@
ugr.es (J.C. Segura), [email protected] (C. Ben�ıtez), [email protected]
(�A. de la Torre), [email protected] (A. Rubio).1 Tel.: +34-958243283; fax: +34-958243230.2 Tel.: +34-958243193; fax: +34-958243230.
0167-6393/$ - see front matter � 2003 Elsevier B.V. All rights reserv
doi:10.1016/j.specom.2003.10.002
1. Introduction
An important problem in many areas of speech
processing is the determination of presence of
speech periods in a given signal. This task can beidentified as a statistical hypothesis problem and
its purpose is the determination to which category
or class a given signal belongs. The decision is
made based on an observation vector, frequently
ed.

Nomenclature
AFE advanced front endAMR adaptive multi-rate
DSR distributed speech recognition
DTX discontinuous transmission
ETSI European Telecommunication Stan-
dards Institute
FAR0 speech false alarm rate
FAR1 non-speech false alarm rate
FD frame-droppingGSM global system for mobile communica-
tions
HR0 non-speech hit-rate
HR1 speech hit-rate
HM high mismatch training/test mode
HMM hidden Markov model
HTK hidden Markov model toolkitITU International Telecommunication Union
LPC linear prediction coding coefficients
LTSE long-term spectral estimation
LTSD long-term spectral divergence
MM medium mismatch training/test mode
ROC receiver operating characteristic
SDC SpeechDat-Car
SND speech/non-speech detectionSNR signal-to-noise ratio
VAD voice activity detector (detection)
WF wiener filtering
WAcc word accuracy
WM well matched training/test mode
ZCR zero-crossing rate
272 J. Ram�ırez et al. / Speech Communication 42 (2004) 271–287
called feature vector, which serves as the input to a
decision rule that assigns a sample vector to one of
the given classes. The classification task is often
not as trivial as it appears since the increasing level
of background noise degrades the classifier effec-tiveness, thus leading to numerous detection er-
rors.
The emerging applications of speech technolo-
gies (particularly in mobile communications, ro-
bust speech recognition or digital hearing aid
devices) often require a noise reduction scheme
working in combination with a precise voice
activity detector (VAD) (Bouquin-Jeannes andFaucon, 1994, 1995). During the last decade
numerous researchers have studied different strat-
egies for detecting speech in noise and the influ-
ence of the VAD decision on speech processing
systems (Freeman et al., 1989; ITU, 1996; Sohn
and Sung, 1998; ETSI, 1999; Marzinzik and Kol-
lmeier, 2002; Sangwan et al., 2002; Karray and
Martin, 2003). Most authors reporting on noisereduction refer to speech pause detection when
dealing with the problem of noise estimation. The
non-speech detection algorithm is an important
and sensitive part of most of the existing single-
microphone noise reduction schemes. There exist
well known noise suppression algorithms (Berouti
et al., 1979; Boll, 1979), such as Wiener filtering
(WF) or spectral subtraction, that are widely used
for robust speech recognition, and for which, the
VAD is critical in attaining a high level of per-
formance. These techniques estimate the noise
spectrum during non-speech periods in order tocompensate its harmful effect on the speech signal.
Thus, the VAD is more critical for non-stationary
noise environments since it is needed to update the
constantly varying noise statistics affecting a mis-
classification error strongly to the system perfor-
mance. In order to palliate the importance of the
VAD in a noise suppression systems Martin pro-
posed an algorithm (Martin, 1993) that continu-ally updated the noise spectrum in order to prevent
a misclassification of the speech signal causes a
degradation of the enhanced signal. These tech-
niques are faster in updating the noise but usually
capture signal energy during speech periods, thus
degrading the quality of the compensated speech
signal. In this way, it is clearly better using an
efficient VAD for most of the noise suppressionsystems and applications.
VADs are employed in many areas of speech
processing. Recently, various voice activity detec-
tion procedures have been described in the litera-
ture for several applications including mobile
communication services (Freeman et al., 1989),
real-time speech transmission on the Internet

J. Ram�ırez et al. / Speech Communication 42 (2004) 271–287 273
(Sangwan et al., 2002) or noise reduction for dig-
ital hearing aid devices (Itoh and Mizushima,
1997). Interest of research has focused on the
development of robust algorithms, with specialattention being paid to the study and derivation of
noise robust features and decision rules. Sohn and
Sung (1998) presented an algorithm that uses a
novel noise spectrum adaptation employing soft
decision techniques. The decision rule was derived
from the generalized likelihood ratio test by
assuming that the noise statistics are known a
priori. An enhanced version (Sohn et al., 1999) ofthe original VAD was derived with the addition of
a hang-over scheme which considers the previous
observations of a first-order Markov process
modeling speech occurrences. The algorithm out-
performed or at least was comparable to the
G.729B VAD (ITU, 1996) in terms of speech
detection and false-alarm probabilities. Other
researchers presented improvements over thealgorithm proposed by Sohn et al. (1999). Cho
et al. (2001a); Cho and Kondoz (2001) presented a
smoothed likelihood ratio test to alleviate the
detection errors, yielding better results than
G.729B and comparable performance to adaptive
multi-rate (AMR) option 2. Cho et al. (2001b) also
proposed a mixed decision-based noise adaptation
yielding better results than the soft decision noiseadaptation technique reported by Sohn and Sung
(1998). Recently, a new standard incorporating
noise suppression methods has been approved by
the European Telecommunication Standards
Institute (ETSI) for feature extraction and dis-
tributed speech recognition (DSR). The so-called
advanced front-end (AFE) (ETSI, 2002) incorpo-
rates an energy-based VAD (WF AFE VAD) forestimating the noise spectrum in Wiener filtering
speech enhancement, and a different VAD for non-
speech frame dropping (FD AFE VAD).
On the other hand, a VAD achieves silence
compression in modern mobile telecommunication
systems reducing the average bit rate by using the
discontinuous transmission (DTX) mode. Many
practical applications, such as the global systemfor mobile communications (GSM) telephony, use
silence detection and comfort noise injection for
higher coding efficiency. The International Tele-
communication Union (ITU) adopted a toll-
quality speech coding algorithm known as G.729
to work in combination with a VAD module in
DTX mode. The recommendation G.729 Annex B
(ITU, 1996) uses a feature vector consisting of thelinear prediction (LP) spectrum, the full-band en-
ergy, the low-band (0–1 KHz) energy and the zero-
crossing rate (ZCR). The standard was developed
with the collaboration of researchers from France
Telecom, the University of Sherbrooke, NTT and
AT&T Bell Labs and the effectiveness of the VAD
was evaluated in terms of subjective speech quality
and bit rate savings (Benyassine et al., 1997).Objective performance tests were also conducted
by hand-labelling a large speech database and
assessing the correct identification of voiced, un-
voiced, silence and transition periods. Another
standard for DTX is the ETSI adaptive multi-rate
speech coder (ETSI, 1999) developed by the special
mobile group for the GSM system. The standard
specifies two options for the VAD to be usedwithin the digital cellular telecommunications
system. In option 1, the signal is passed through a
filterbank and the level of signal in each band is
calculated. A measure of the signal-to-signal ratio
(SNR) is used to make the VAD decision together
with the output of a pitch detector, a tone detector
and the correlated complex signal analysis module.
An enhanced version of the original VAD is theAMR option 2 VAD. It uses parameters of the
speech encoder being more robust against envi-
ronmental noise than AMR1 and G.729. These
VADs have been used extensively in the open
literature as a reference for assessing the perfor-
mance of new algorithms. Marzinzik and Kol-
lmeier (2002) proposed a new VAD algorithm for
noise spectrum estimation based on tracking thepower envelope dynamics. The algorithm was
compared to the G.729 VAD by means of the re-
ceiver operating characteristic (ROC) curves
showing a reduction in the non-speech false alarm
rate together with an increase of the non-speech hit
rate for a representative set of noises and condi-
tions. Beritelli et al. (1998) proposed a fuzzy VAD
with a pattern matching block consisting of a setof six fuzzy rules. The comparison was made using
objective, psychoacoustic, and subjective parame-
ters being G.729 and AMR VADs used as a ref-
erence (Beritelli et al., 2002). Nemer et al. (2001)

274 J. Ram�ırez et al. / Speech Communication 42 (2004) 271–287
presented a robust algorithm based on higher
order statistics (HOS) in the linear prediction cod-
ing coefficients (LPC) residual domain. Its perfor-
mance was compared to the ITU-T G.729 B VADin various noise conditions, and quantified using
the probability of correct and false classifications.
The selection of an adequate feature vector for
signal detection and a robust decision rule is a
challenging problem that affects the performance
of VADs working under noise conditions. Most
algorithms are effective in numerous applications
but often cause detection errors mainly due to theloss of discriminating power of the decision rule at
low SNR levels (ITU, 1996; ETSI, 1999). For
example, a simple energy level detector can work
satisfactorily in high signal-to-noise ratio condi-
tions, but would fail significantly when the SNR
drops. Several algorithms have been proposed in
order to palliate these drawbacks by means of the
definition of more robust decision rules. Thispaper explores a new alternative towards improv-
ing speech detection robustness in adverse envi-
ronments and the performance of speech
recognition systems. A new technique for speech/
non-speech detection (SND) using long-term
information about the speech signal is studied. The
algorithm is evaluated in the context of the
AURORA project (Hirsch and Pearce, 2000;ETSI, 2000), and the recently approved Advanced
Front-end standard (ETSI, 2002) for distributed
speech recognition. The quantifiable benefits of
this approach are assessed by means of an
exhaustive performance analysis conducted on the
AURORA TIdigits (Hirsch and Pearce, 2000) and
SpeechDat-Car (SDC) (Moreno et al., 2000; No-
kia, 2000; Texas Instruments, 2001) databases,with standard VADs such as the ITU G.729 (ITU,
1996), ETSI AMR (ETSI, 1999) and AFE (ETSI,
2002) used as a reference.
2. VAD based on the long-term spectral divergence
VADs are generally characterized by the feature
selection, noise estimation and classification
methods. Various features and combinations of
features have been proposed to be used in VADalgorithms (ITU, 1996; Beritelli et al., 1998; Sohn
and Sung, 1998; Nemer et al., 2001). Typically,
these features represent the variations in energy
levels or spectral difference between noise and
speech. The most discriminating parameters inspeech detection are the signal energy, zero-cross-
ing rates, periodicity measures, the entropy, or
linear predictive coding coefficients. The proposed
speech/non-speech detection algorithm assumes
that the most significant information for detecting
voice activity on a noisy speech signal remains
on the time-varying signal spectrum magnitude.
It uses a long-term speech window instead ofinstantaneous values of the spectrum to track the
spectral envelope and is based on the estimation of
the so-called long-term spectral envelope (LTSE).
The decision rule is then formulated in terms of the
long-term spectral divergence (LTSD) between
speech and noise. The motivations for the pro-
posed strategy will be clarified by studying the
distributions of the LTSD as a function of thelong-term window length and the misclassification
errors of speech and non-speech segments.
2.1. Definitions of the LTSE and LTSD
Let xðnÞ be a noisy speech signal that is seg-
mented into overlapped frames and, X ðk; lÞ its
amplitude spectrum for the k band at frame l. TheN -order long-term spectral envelope is defined as
LTSENðk; lÞ ¼ maxfX ðk; lþ jÞgj¼þNj¼�N ð1Þ
The N -order long-term spectral divergence be-tween speech and noise is defined as the deviation
of the LTSE respect to the average noise spec-
trum magnitude NðkÞ for the k band, k ¼0; 1; . . . ;NFFT� 1, and is given by
LTSDN ðlÞ
¼ 10 log101
NFFT
XNFFT�1
k¼0
LTSE2ðk; lÞN 2ðkÞ
!ð2Þ
It will be shown in the rest of the paper that the
LTSD is a robust feature defined as a long-term
spectral distance measure between speech and
noise. It will also be demonstrated that using long-
term speech information increases the speechdetection robustness in adverse environments and,

J. Ram�ırez et al. / Speech Communication 42 (2004) 271–287 275
when compared to VAD algorithms based on
instantaneous measures of the SNR level, it will
enable formulating noise robust decision rules with
improved speech/non-speech discrimination.
2.2. LTSD distributions of speech and silence
In this section we study the distributions of the
LTSD as a function of the long-term window
length (N ) in order to clarify the motivations forthe algorithm proposed. A hand-labelled version
of the Spanish SDC database was used in the
analysis. This database contains recordings from
close-talking and distant microphones at different
driving conditions: (a) stopped car, motor run-
ning, (b) town traffic, low speed, rough road and
(c) high speed, good road. The most unfavourable
noise environment (i.e. high speed, good road) wasselected and recordings from the distant micro-
phone were considered. Thus, the N -order LTSD
was measured during speech and non-speech
periods, and the histogram and probability distri-
0 10 20 300
0.05
0.1
0.15
0.2
0.25
N= 0
LTSD
P(L
TS
D)
0 10 20 300
0.05
0.1
0.15
0.2
0.25
N= 6
LTSD
P(L
TS
D)
NoiseSpeech
NoiseSpeech
Fig. 1. Effect of the window length on the s
butions were built. The 8 kHz input signal was
decomposed into overlapping frames with a 10-ms
window shift. Fig. 1 shows the LTSD distributions
of speech and noise for N ¼ 0, 3, 6 and 9. It isderived from Fig. 1 that speech and noise distri-
butions are better separated when increasing the
order of the long-term window. The noise is highly
confined and exhibits a reduced variance, thus
leading to high non-speech hit rates. This fact can
be corroborated by calculating the classification
error of speech and noise for an optimal Bayes
classifier. Fig. 2 shows the classification errors as afunction of the window length N . The speech
classification error is approximately reduced by
half from 22% to 9% when the order of the VAD is
increased from 0 to 6 frames. This is motivated by
the separation of the LTSD distributions that
takes place when N is increased as shown in Fig. 1.
On the other hand, the increased speech detection
robustness is only prejudiced by a moderate in-crease in the speech detection error. According to
Fig. 2, the optimal value of the order of the VAD
0 10 20 300
0.05
0.1
0.15
0.2
0.25
N= 3
LTSD
P(L
TS
D)
0 10 20 300
0.05
0.1
0.15
0.2
0.25
N= 9
LTSD
P(L
TS
D)
NoiseSpeech
NoiseSpeech
peech/non-speech LTSD distributions.

0 1 2 3 4 5 6 7 8 9 100.06
0.08
0.1
0.12
0.14
0.16
0.18
0.2
0.22Classification error of Speech and NonSpeech periods
N
Err
or
NonSpeech Detection ErrorSpeech Detection Error
Fig. 2. Speech and non-speech detection error as a function of
the window length.
Initialization- Noise spectrum estimation- Optimal threshold calculation
Signal segmentation
Estimation of the LTSE
Computation of the LTSD
Decisionrule
VAD= 1
Hang-overscheme
VAD= 1
Noise spectrum update
LTSD
LTSD<
<
276 J. Ram�ırez et al. / Speech Communication 42 (2004) 271–287
would be N ¼ 6. As a conclusion, the use of long-term spectral divergence is beneficial for VAD
since it reduces importantly misclassification er-
rors.
VAD= 0
Fig. 3. Flowchart diagram of the proposed LTSE algorithm for
voice activity detection.
2.3. Definition of the LTSD VAD algorithm
A flowchart diagram of the proposed VAD
algorithm is shown in Fig. 3. The algorithm can be
described as follows. During a short initialization
period, the mean noise spectrum NðkÞ (k ¼0; 1; . . . ;NFFT� 1) is estimated by averaging the
noise spectrum magnitude. After the initializationperiod, the LTSE VAD algorithm decomposes the
input utterance into overlapped frames being their
spectrum, namely X ðk; lÞ, processed by means of a
ð2N þ 1Þ-frame window. The LTSD is obtained by
computing the LTSE by means of Eq. (1). The
VAD decision rule is based on the LTSD calcu-
lated using Eq. (2) as the deviation of the LTSE
with respect to the noise spectrum. Thus, thealgorithm has an N -frame delay since it makes a
decision for the l-th frame using a (2N þ 1)-frame
window around the l-th frame. On the other hand,
the first N frames of each utterance are assumed to
be non-speech periods being used for the initiali-
zation of the algorithm.
The LTSD defined by Eq. (2) is a biased mag-
nitude and needs to be compensated by a givenoffset. This value depends on the noise spectral
variance and the order of the VAD and can be
estimated during the initialization period or as-
sumed to take a fixed value. The VAD makes the
SND by comparing the unbiased LTSD to an
adaptive threshold c. The detection threshold is
adapted to the observed noise energy E. It is as-
sumed that the system will work at different noisy
conditions characterized by the energy of thebackground noise. Optimal thresholds c0 and c1can be determined for the system working in the
cleanest and noisiest conditions. These thresholds
define a linear VAD calibration curve that is used
during the initialization period for selecting an
adequate threshold c as a function of the noise
energy E:
c ¼c0 E6E0
c0�c1E0�E1
E þ c0 � c0�c11�E1=E0
E0 < E < E1
c1 EPE1
8><>: ð3Þ
where E0 and E1 are the energies of the back-ground noise for the cleanest and noisiest condi-

J. Ram�ırez et al. / Speech Communication 42 (2004) 271–287 277
tions that can be determined examining the speech
databases being used. A high speech/non-speech
discrimination is ensured with this model since
silence detection is improved at high and mediumSNR levels while maintaining a high precision
detecting speech periods under high noise condi-
tions.
The VAD is defined to be adaptive to time-
varying noise environments with the following
algorithm for updating the noise spectrum NðkÞduring non-speech periods being used:
Nðk; lÞ ¼
aNðk; l� 1Þ þ ð1� aÞNKðkÞif speech pause is detected
Nðk; l� 1Þotherwise
8>><>>: ð4Þ
where NK is the average spectrum magnitude over
a K-frame neighbourhood:
NKðkÞ ¼1
2K þ 1
XKj¼�K
X ðk; lþ jÞ ð5Þ
Finally, a hangover was found to be beneficial tomaintain a high accuracy detecting speech periods
at low SNR levels. Thus, the VAD delays the
speech to non-speech transition in order to prevent
low-energy word endings being misclassified as
silence. On the other hand, if the LTSD achieves a
given threshold LTSD0 the hangover mechanism is
turned off to improve non-speech detection when
the noise level is low. Thus, the LTSE VAD yieldsan excellent classification of speech and pause
periods. Examples of the operation of the LTSE
VAD on an utterance of the Spanish SDC data-
base are shown in Fig. 4a (N ¼ 6) and Fig. 4b
(N ¼ 0). The use of a long-term window for for-
mulating the decision rule reports quantifiable
benefits in speech/non-speech detection. It can be
seen that using a 6-frame window reduces thevariability of the LTSD in the absence of speech,
thus yielding to reduced noise variance and better
speech/non-speech discrimination. Speech detec-
tion is not affected by the smoothing process in-
volved in the long-term spectral estimation
algorithm and maintains good margins that cor-
rectly separate speech and pauses. On the other
hand, the inherent anticipation of the VAD deci-sion contributes to reduce speech clipping errors.
3. Experimental framework
Several experiments are commonly conducted
to evaluate the performance of VAD algorithms.The analysis is normally focused on the deter-
mination of misclassification errors at different
SNR levels (Beritelli et al., 2002; Marzinzik and
Kollmeier, 2002), and the influence of the VAD
zdecision on speech processing systems (Bouquin-
Jeannes and Faucon, 1995; Karray and Martin,
2003). The experimental framework and the
objective performance tests conducted to evaluatethe proposed algorithm are described in this sec-
tion.
3.1. Speech/non-speech discrimination analysis
First, the proposed VAD was evaluated in
terms of the ability to discriminate between speech
and pause periods at different SNR levels. The
original AURORA-2 database (Hirsch and Pe-arce, 2000) was used in this analysis since it uses
the clean TIdigits database consisting of sequences
of up to seven connected digits spoken by Ameri-
can English talkers as source speech, and a selec-
tion of eight different real-world noises that have
been artificially added to the speech at SNRs of 20,
15, 10, 5, 0 and )5 dB. These noisy signals have
been recorded at different places (suburban train,crowd of people (babble), car, exhibition hall,
restaurant, street, airport and train station), and
were selected to represent the most probable
application scenarios for telecommunication ter-
minals. In the discrimination analysis, the clean
TIdigits database was used to manually label each
utterance as speech or non-speech frames for ref-
erence. Detection performance as a function of theSNR was assessed in terms of the non-speech hit-
rate (HR0) and the speech hit-rate (HR1) defined
as the fraction of all actual pause or speech frames
that are correctly detected as pause or speech
frames, respectively:
HR0 ¼ N0;0
N ref0
HR1 ¼ N1;1
N ref1
ð6Þ
where N ref0 and N ref
1 are the number of real non-speech and speech frames in the whole database,

0 200 400 600 800 1000 12000
5
10
15
20
25
30
frame
LTS
D
0 1 2 3 4 5 6 7 8 9
x 104
–2
–1
0
1
2
3x 10
4
n
x(n)
(a)
0 200 400 600 800 1000 1200–10
0
10
20
30
frame
LTS
D
0 1 2 3 4 5 6 7 8 9
x 104
–2
–1
0
1
2
3x 10
4
x(n)
n(b)
Fig. 4. VAD output for an utterance of the Spanish SpeechDat-Car database (recording conditions: high speed, good road, distant
microphone). (a) N ¼ 6, (b) N ¼ 0.
278 J. Ram�ırez et al. / Speech Communication 42 (2004) 271–287
respectively, while N0;0 and N1;1 are the number of
non-speech and speech frames correctly classified.
The LTSE VAD decomposes the input signalsample at 8 kHz into overlapping frames with a
10-ms shift. Thus, a 13-frame long-term window
and NFFT ¼ 256 was found to be good choices
for the noise conditions being studied. Optimal
detection threshold c0 ¼ 6 dB and c1 ¼ 2:5 dB

J. Ram�ırez et al. / Speech Communication 42 (2004) 271–287 279
were determined for clean and noisy conditions,
respectively, while the threshold calibration curve
was defined between E0 ¼ 30 dB (low noise energy)
and E1 ¼ 50 dB (high noise energy). The hangovermechanism delays the speech to non-speech VAD
transition during 8 frames while it is deactivated
when the LTSD exceeds 25 dB. The offset is fixed
and equal to 5 dB. Finally, it is used a forgotten
factor a ¼ 0:95, and a 3-frame neighbourhood
(K ¼ 3) for the noise update algorithm.
Fig. 5 provides the results of this analysis and
compares the proposed LTSE VAD algorithm tostandard G.729, AMR and AFE VADs in terms of
non-speech hit-rate (Fig. 5a) and speech hit-rate
(Fig. 5b) for clean conditions and SNR levels
ranging from 20 to )5 dB. Note that results for the
two VADs defined in the AFE DSR standard
(ETSI, 2002) for estimating the noise spectrum in
the Wiener filtering stage and non-speech frame-
dropping are provided. Note that the resultsshown in Fig. 5 are averaged values for the entire
set of noises. Thus, the following conclusions can
0
10
20
30
40
50
60
70
80
90
100
Clean 20 dB 15 dB 10 dB 5 dB 0 dB -5 dBSNR
HR
0 (%
)
LTSEG.729AMR1AMR2AFE (FD)AFE (WF)
(a)
50
55
60
65
70
75
80
85
90
95
100
Clean 20 dB 15 dB 10 dB 5 dB 0 dB -5 dBSNR
HR
1 (%
)
LTSEG.729AMR1AMR2AFE (FD)AFE (WF)
(b)
Fig. 5. Speech/non-speech discrimination analysis: (a) non-
speech hit-rate (HR0), (b) speech hit rate (HR1).
be derived from Fig. 5 about the behaviour of the
different VADs analysed:
(i) G.729VADsuffers poor speech detection accu-racy with the increasing noise level while non-
speech detection is good in clean conditions
(85%) and poor (20%) in noisy conditions.
(ii) AMR1 yields an extreme conservative behav-
iour with high speech detection accuracy for
the whole range of SNR levels but very poor
non-speech detection results at increasing
noise levels. Although AMR1 seems to be wellsuited for speech detection at unfavourable
noise conditions, its extremely conservative
behaviour degrades its non-speech detection
accuracy being HR0 less than 10% below 10
dB, making it less useful in a practical speech
processing system.
(iii) AMR2 leads to considerable improvements
over G.729 and AMR1 yielding better non-speech detection accuracy while still suffering
fast degradation of the speech detection abil-
ity at unfavourable noisy conditions.
(iv) The VAD used in the AFE standard for esti-
mating the noise spectrum in the Wiener filter-
ing stage is based in the full energy band and
yields a poor speech detection performance
with a fast decay of the speech hit-rate atlow SNR values. On the other hand, the
VAD used in the AFE for frame-dropping
achieves a high accuracy in speech detection
but moderate results in non-speech detection.
(v) LTSE achieves the best compromise among
the different VADs tested. It obtains a good
behaviour in detecting non-speech periods as
well as exhibits a slow decay in performanceat unfavourable noise conditions in speech
detection.
Table 1 summarizes the advantages provided
by the LTSE-based VAD over the different VAD
methods being evaluated by comparing them in
terms of the average speech/non-speech hit-rates.
LTSE yields a 47.28% HR0 average value, while
the G.729, AMR1, AMR2, WF and FD AFE
VADs yield 31.77%, 31.31%, 42.77%, 57.68% and28.74%, respectively. On the other hand, LTSE
attains a 98.15% HR1 average value in speech

Table 1
Average speech/non-speech hit rates for SNR levels ranging from clean conditions to )5 dB
VAD G.729 AMR1 AMR2 AFE (WF) AFE (FD) LTSE
HR0 (%) 31.77 31.31 42.77 57.68 28.74 47.28
HR1 (%) 93.00 98.18 93.76 88.72 97.70 98.15
280 J. Ram�ırez et al. / Speech Communication 42 (2004) 271–287
detection while G.729, AMR1, AMR2, WF andFD AFE VADs provide 93.00%, 98.18%, 93.76%,
88.72% and 97.70%, respectively. Frequently
VADs avoid losing speech periods leading to an
extremely conservative behaviour in detecting
speech pauses (for instance, the AMR1 VAD).
Thus, in order to correctly describe the VAD
performance, both parameters have to be consid-
ered. Thus, considering together speech and non-speech hit-rates, the proposed VAD yielded the
best results when compared to the most represen-
tative VADs analysed.
3.2. Receiver operating characteristic curves
An additional test was conducted to comparespeech detection performance by means of the
ROC curves (Madisetti and Williams, 1999), a
frequently used methodology in communications
based on the hit and error detection probabilities
(Marzinzik and Kollmeier, 2002), that completely
describes the VAD error rate. The AURORA
subset of the original Spanish SDC database
(Moreno et al., 2000) was used in this analysis.This database contains 4914 recordings using
close-talking and distant microphones from more
than 160 speakers. As in the whole SDC database,
the files are categorized into three noisy condi-
tions: quiet, low noisy and highly noisy conditions,
which represent different driving conditions and
average SNR values of 12, 9 and 5 dB.
The non-speech hit rate (HR0) and the falsealarm rate (FAR0 ¼ 100)HR1) were determined
in each noise condition for the proposed LTSE
VAD and the G.729, AMR1, AMR2, and AFE
VADs, which were used as a reference. For the
calculation of the false-alarm rate as well as the hit
rate, the ‘‘real’’ speech frames and ‘‘real’’ speech
pauses were determined by hand-labelling the
database on the close-talking microphone. Thenon-speech hit rate (HR0) as a function of
the false alarm rate (FAR0 ¼ 100)HR1) for0 < c6 10 dB is shown in Fig. 6 for recordings
from the distant microphone in quiet, low and
high noisy conditions. The working point of the
adaptive LTSE, G.729, AMR and the recently
approved AFE VADs (ETSI, 2002) are also in-
cluded. It can be derived from these plots that:
(i) The working point of the G.729 VAD shifts tothe right in the ROC space with decreasing
SNR, while the proposed algorithm is less af-
fected by the increasing level of background
noise.
(ii) AMR1 VAD works on a low false alarm rate
point of the ROC space but it exhibits poor
non-speech hit rate.
(iii) AMR2 VAD yields clear advantages overG.729 and AMR1 exhibiting important
reduction in the false alarm rate when com-
pared to G.729 and increase in the non-speech
hit rate over AMR1.
(iv) WF AFE VAD yields good non-speech detec-
tion accuracy but works on a high false alarm
rate point on the ROC space. It suffers rapid
performance degradation when the drivingconditions get noisier. On the other hand,
FD AFE VAD has been planned to be conser-
vative since it is only used in the DSR stan-
dard for frame-dropping. Thus, it exhibits
poor non-speech detection accuracy working
on a low false alarm rate point of the ROC
space.
(v) LTSE VAD yields the lowest false alarm ratefor a fixed non-speech hit rate and also, the
highest non-speech hit rate for a given false
alarm rate. The ability of the adaptive LTSE
VAD to tune the detection threshold by
means the algorithm described in Eq. (3) en-
ables working on the optimal point of the
ROC curve for different noisy conditions.
Thus, the algorithm automatically selects the

0
20
40
60
80
100
0 5 10 15 20
FALSE ALARM RATE (FAR0)
PA
US
E H
IT R
AT
E (
HR
0)
LTSE VADG.729AMR1AMR2ADAPT. LTSE VAD [(30,8) (50,3.25)]AFE (FD)AFE (WF)
(a)
0
20
40
60
80
100
0 10 20 30 40
FALSE ALARM RATE (FAR0)
PA
US
E H
IT R
AT
E (
HR
0)
LTSE VADG.729AMR1AMR2ADAPT. LTSE VAD [(30,8) (50,3.25)]AFE (FD)AFE (WF)
(b)
0
20
40
60
80
100
0 10 20 30 40 50 60
FALSE ALARM RATE (FAR0)
PA
US
E H
IT R
AT
E (
HR
0)
LTSE VADG.729AMR1AMR2ADAPT. LTSE VAD [(30,8) (50,3.25)]AFE (FD)AFE (WF)
(c)
Fig. 6. ROC curves: (a) stopped car, motor running, (b) town
traffic, low speed rough road, (c) high speed, good road.
J. Ram�ırez et al. / Speech Communication 42 (2004) 271–287 281
appropriate decision threshold for a given
noisy condition in a similar way as it is carried
out in the AMR (option 1) standard.
Thus, the adaptive LTSE VAD provides a
sustained improvement in both speech pause hit
rate and false alarm rate over G.729 and AMRVAD being the gains especially important over the
G.729 VAD. The label ½ð30; 8Þð50; 3:25Þ indicatesadequate points ½ðE0; c0Þ; ðE1; c1Þ describing the
VAD linear threshold tuning in Eq. (3). The pro-
posed VAD yields the best speech pause detectionaccuracy, important reduction of the false alarm
rate when compared to G.729, and comparable
speech detection accuracy when compared to
AMR VADs. In general, the false alarm rates can
be decreased by changing threshold criteria in the
algorithm�s decision rules with the corresponding
decrease of the hit rates.
3.3. Influence of the VAD on a speech recognition
system
Although the discrimination analysis or the
ROC curves are effective to evaluate a given
algorithm, the influence of the VAD in a speech
recognition system was also studied. Many au-
thors claim that VADs are well compared by
evaluating speech recognition performance (Woo
et al., 2000) since non-efficient SND is an impor-
tant source of the degradation of recognitionperformance in noisy environments (Karray and
Martin, 2003). There are two clear motivations for
that: (i) noise parameters such as its spectrum are
updated during non-speech periods being the
speech enhancement system strongly influenced by
the quality of the noise estimation, and (ii) frame-
dropping, a frequently used technique in speech
recognition to reduce the number of insertion er-rors caused by the noise, is based on the VAD
decision and speech misclassification errors lead to
loss of speech, thus causing irrecoverable deletion
errors.
The reference framework (Base) is the ETSI
AURORA project for distributed speech recog-
nition (ETSI, 2000) while the recognizer is based
on the hidden Markov model toolkit softwarepackage (Young et al., 2001). The task consists
on recognizing connected digits which are mod-
elled as whole word hidden Markov models with
the following parameters: 16 states per word,
simple left-to-right models, mixture of 3 Gaus-
sians per state and only the variances of all
acoustic coefficients (no full covariance matrix)
while speech pause models consist of three stateswith a mixture of 6 Gaussians per state. The

FeatureExtraction
(Base)
Recognizer(HTK)
Noisyspeech
Noisyspeech Wiener
FilteringRecognizer
(HTK)
(a)
(b)
Noisyspeech
VAD(noise estimation)
WienerFiltering
Framedropping
Recognizer(HTK)
(c)
VAD(frame dropping)
VAD(noise estimation)
Fig. 7. Speech recognition systems used to evaluate the pro-
posed VAD. (a) Reference recognition system. (b) Enhanced
speech recognition system incorporating Wiener filtering as
noise suppression method. The VAD is used for estimating the
noise spectrum during non-speech periods. (c) Enhanced speech
recognition system incorporating Wiener filtering as noise
suppression method and frame dropping. The VADs are used
for noise spectrum estimation in the Wiener filtering stage and
for frame dropping.
282 J. Ram�ırez et al. / Speech Communication 42 (2004) 271–287
39-parameter feature vector consists of 12 ceps-
tral coefficients (without the zero-order coeffi-
cient), the logarithmic frame energy plus the
corresponding delta and acceleration coefficients.Two training modes are defined for the experi-
ments conducted on the AURORA-2 data-
base: (i) training on clean data only (clean
training), and (ii) training on clean and noisy
data (multi-condition training). For the AUR-
ORA-3 SpeechDat-Car databases, the so-called
well-matched (WM), medium-mismatch (MM)
and high-mismatch (HM) conditions are used.These databases contain recordings from the
close-talking and distant microphones. In WM
condition, both close-talking and hands-free
microphones are used for training and testing. In
MM condition, both training and testing are
performed using the hands-free microphone
recordings. In HM condition, training is done
using close-talking microphone material from alldriving conditions while testing is done using
hands-free microphone material taken for low
noise and high noise driving conditions. Finally,
recognition performance is assessed in terms of
the word accuracy (WAcc) that considers dele-
tion, substitution and insertion errors.
The influence of the VAD decision on the per-
formance of different feature extraction schemeswas studied. The first approach (shown in Fig. 7b)
incorporates Wiener filtering (WF) to the Base
system as noise suppression method. The second
feature extraction algorithm that was evaluated
uses Wiener filtering and non-speech frame drop-
ping as shown in Fig. 7c. In this preliminary set of
experiments, a simple noise reduction algorithm
based on Wiener filtering was used in order toclearly show the influence of the VAD on the
system performance. The algorithm has been
implemented as described for the first stage of the
Wiener filtering in the AFE (ETSI, 2002). No
other mismatch reduction techniques already
present in the AFE standard (waveform processing
or blind equalization) have been considered since
they are not affected by the VAD decision and canmask the impact of the VAD precision on the
overall system performance. In the next section,
results for a full version of the AFE will be pre-
sented.
Table 2 shows the AURORA-2 recognition re-
sults as a function of the SNR for the system
shown in Fig. 7a (Base), as well as for thespeech enhancement systems shown in Fig. 7b
(Base +WF) and Fig. 7c (Base +WF+FD), when
G.729, AMR, AFE, and LTSE are used as VAD
algorithms. These results were averaged over the
three test sets of the AURORA-2 recognition
experiments. An estimation of the 95% confidence
interval (CI) is also provided. Notice that, partic-
ularly, for the recognition experiments based onthe AFE VADs, we have used the same configu-
ration used in the standard (ETSI, 2002) with
different VADs for WF and FD. The same feature
extraction scheme was used for training and test-
ing. Only exact speech periods are kept in the FD
stage and consequently, all the frames classified by
the VAD as non-speech are discarded. FD has
impact on the training of silence models since less

Table 2
Average word accuracy for the AURORA-2 database
System Base Base+WF Base+WF+FD
VAD used None G.729 AMR1 AMR2 AFE LTSE G.729 AMR1 AMR2 AFE LTSE
(a) Clean training
Clean 99.03 98.81 98.80 98.81 98.77 98.84 98.41 97.87 98.63 98.78 99.12
20 dB 94.19 87.70 97.09 97.23 97.68 97.48 83.46 96.83 96.72 97.82 98.14
15 dB 85.41 75.23 92.05 94.61 95.19 95.17 71.76 92.03 93.76 95.28 96.39
10 dB 66.19 59.01 74.24 87.50 87.29 88.71 59.05 71.65 86.36 88.67 91.45
5 dB 39.28 40.30 44.29 71.01 66.05 72.38 43.52 40.66 70.97 71.55 77.06
0 dB 17.38 23.43 23.82 41.28 30.31 42.51 27.63 23.88 44.58 41.78 48.37
)5 dB 8.65 13.05 12.09 13.65 4.97 14.78 14.94 14.05 18.87 16.23 20.40
Average 60.49 57.13 66.30 78.33 75.30 79.25 57.08 65.01 78.48 79.02 82.28
CI (95%) ±0.24 ±0.24 ±0.23 ±0.20 ±0.21 ±0.20 ±0.24 ±0.23 ±0.20 ±0.20 ±0.19
(b) Multi-condition training
Clean 98.48 98.16 98.30 98.51 97.86 98.43 97.50 96.67 98.12 98.39 98.78
20 dB 97.39 93.96 97.04 97.86 97.60 97.94 96.05 96.90 97.57 97.98 98.50
15 dB 96.34 89.51 95.18 96.97 96.56 97.10 94.82 95.52 96.58 96.94 97.67
10 dB 93.88 81.69 91.90 94.43 93.98 94.64 91.23 91.76 93.80 93.63 95.53
5 dB 85.70 68.44 80.77 87.27 86.41 87.52 81.14 80.24 85.72 85.32 88.40
0 dB 59.02 42.58 53.29 65.45 64.63 66.32 54.50 53.36 62.81 63.89 67.09
)5 dB 24.47 18.54 23.47 30.31 28.78 31.33 23.73 23.29 27.92 30.80 32.68
Average 86.47 75.24 83.64 88.40 87.84 88.70 83.55 83.56 87.29 87.55 89.44
CI (95%) ±0.17 ±0.21 ±0.18 ±0.16 ±0.16 ±0.15 ±0.18 ±0.18 ±0.16 ±0.16 ±0.15
J. Ram�ırez et al. / Speech Communication 42 (2004) 271–287 283
non-speech frames are available for training.However, if FD is effective enough, few non-
speech periods will be handled by the recognizer in
testing and consequently, little influence will have
the silence models on the speech recognition per-
formance. The proposed VAD outperforms the
standard G.729, AMR1, AMR2 and AFE VADs
when used for WF and also, when the VAD is used
for removing non-speech frames. Note that theVAD decision is used in the WF stage for esti-
mating the noise spectrum during non-speech
periods, and a good estimation of the SNR is
critical for an efficient application of the noise
reduction algorithm. In this way, the energy-based
WF AFE VAD suffers fast performance degrada-
tion in speech detection as shown in Fig. 5b, thus
leading to numerous recognition errors and thecorresponding increase of the word error rate, as
shown in Table 2a. On the other hand, FD is
strongly influenced by the performance of the
VAD and an efficient VAD for robust speech
recognition needs a compromise between speech
and non-speech detection accuracy. When the
VAD suffers a rapid performance degradation
under severe noise conditions it losses too manyspeech frames and leads to numerous deletion er-
rors; if the VAD does not correctly identify non-
speech periods it causes numerous insertion errors
the corresponding FD performance degradation.
The best recognition performance is obtained
when the proposed LTSE VAD is used for WF
and FD. Thus, in clean training (Table 2a) the
reductions of the word error rate were 58.71%,49.36%, 17.66% and 15.54% over G.729, AMR1,
AMR2 and AFE VADs, respectively, while in
multi-condition training (Table 2b) the reductions
were of up to 35.81%, 35.77%, 16.92% and 15.18%.
Note that FD yields better results for the speech
recognition system trained on clean speech. Thus,
the reference recognizer yields a 60.49% average
WAcc while the enhanced speech recognizer basedon the proposed LTSE VAD obtains an 82.28%
average value. This is motivated by the fact that
models trained using clean speech does not ade-
quately model noise processes, and normally cause
insertion errors during non-speech periods. Thus,
removing efficiently speech pauses will lead to a
significant reduction of this error source. On the
284 J. Ram�ırez et al. / Speech Communication 42 (2004) 271–287
other hand, noise is well modelled when models
are trained using noisy speech and the speech
recognition system tends itself to reduce the
number of insertion errors in multi-conditiontraining as shown in Table 2a. Concretely, the
reference recognizer yields an 86.47% average
WAcc while the enhanced speech recognizer based
on the proposed LTSE VAD obtains an 89.44%
average value. On the other hand, since in the
worst case CI is 0.24% we can conclude that our
VAD method provides better results than the
VADs examined and that the improvements areespecially important in low SNR conditions. Fi-
nally, Table 3 compares the word accuracy results
averaged for clean and multi-condition style train-
ing modes to the performance of the recognition
system using the hand-labelling database. These
results show that the performance of the proposed
algorithm is very close to that of the manually
tagged database. In all test sets, the pro-posed VAD algorithm is observed to outperform
Table 4
Average word accuracy for the SpeechDat-Car databases
System Base Base +WF
VAD used None G.729 AMR1 AMR2 AFE
Finnish WM 92.74 93.27 93.66 95.52 94.28
MM 80.51 75.99 78.93 75.51 78.52
HM 40.53 50.81 40.95 55.41 55.05
Average 71.26 73.36 71.18 75.48 75.95
Spanish WM 92.94 89.83 85.48 91.24 89.71
MM 83.31 79.62 79.31 81.44 76.12
HM 51.55 66.59 56.39 70.14 68.84
Average 75.93 78.68 73.73 80.94 78.22
German WM 91.20 90.60 90.20 93.13 91.48
MM 81.04 82.94 77.67 86.02 84.11
HM 73.17 78.40 70.40 83.07 82.01
Average 81.80 83.98 79.42 87.41 85.87
Average 76.33 78.67 74.78 81.28 80.01
CI (95%) ±0.44 ±0.42 ±0.45 ±0.40 ±0.41
Table 3
AURORA 2 recognition result summary
VAD used G.729 AMR1 AMR2
Base+WF 66.19 74.97 83.37
Base+WF+FD 70.32 74.29 82.89
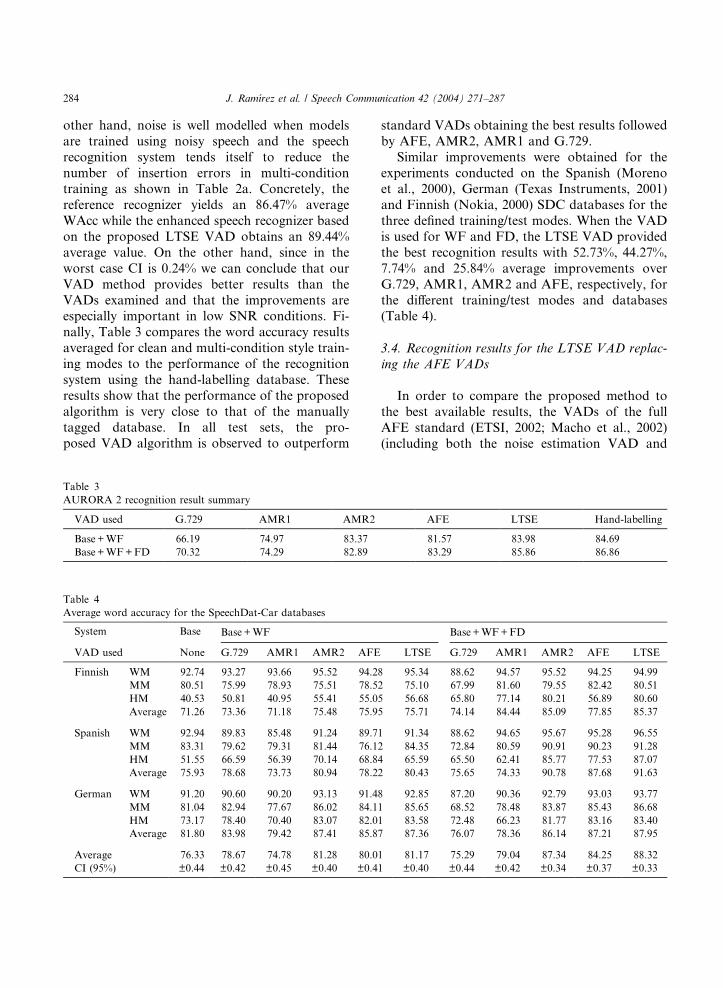
standard VADs obtaining the best results followed
by AFE, AMR2, AMR1 and G.729.
Similar improvements were obtained for the
experiments conducted on the Spanish (Morenoet al., 2000), German (Texas Instruments, 2001)
and Finnish (Nokia, 2000) SDC databases for the
three defined training/test modes. When the VAD
is used for WF and FD, the LTSE VAD provided
the best recognition results with 52.73%, 44.27%,
7.74% and 25.84% average improvements over
G.729, AMR1, AMR2 and AFE, respectively, for
the different training/test modes and databases(Table 4).
3.4. Recognition results for the LTSE VAD replac-
ing the AFE VADs
In order to compare the proposed method to
the best available results, the VADs of the full
AFE standard (ETSI, 2002; Macho et al., 2002)
(including both the noise estimation VAD and
Base+WF+FD
LTSE G.729 AMR1 AMR2 AFE LTSE
95.34 88.62 94.57 95.52 94.25 94.99
75.10 67.99 81.60 79.55 82.42 80.51
56.68 65.80 77.14 80.21 56.89 80.60
75.71 74.14 84.44 85.09 77.85 85.37
91.34 88.62 94.65 95.67 95.28 96.55
84.35 72.84 80.59 90.91 90.23 91.28
65.59 65.50 62.41 85.77 77.53 87.07
80.43 75.65 74.33 90.78 87.68 91.63
92.85 87.20 90.36 92.79 93.03 93.77
85.65 68.52 78.48 83.87 85.43 86.68
83.58 72.48 66.23 81.77 83.16 83.40
87.36 76.07 78.36 86.14 87.21 87.95
81.17 75.29 79.04 87.34 84.25 88.32
±0.40 ±0.44 ±0.42 ±0.34 ±0.37 ±0.33
AFE LTSE Hand-labelling
81.57 83.98 84.69
83.29 85.86 86.86
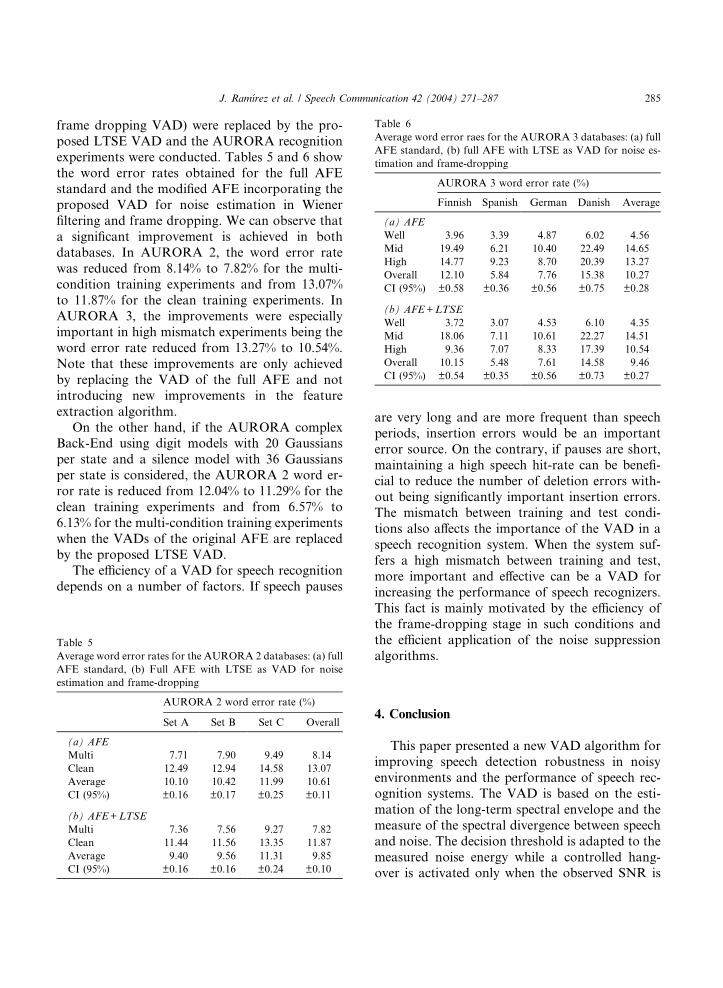
Table 6
Average word error raes for the AURORA 3 databases: (a) full
AFE standard, (b) full AFE with LTSE as VAD for noise es-
timation and frame-dropping
AURORA 3 word error rate (%)
Finnish Spanish German Danish Average
(a) AFE
Well 3.96 3.39 4.87 6.02 4.56
Mid 19.49 6.21 10.40 22.49 14.65
High 14.77 9.23 8.70 20.39 13.27
Overall 12.10 5.84 7.76 15.38 10.27
CI (95%) ±0.58 ±0.36 ±0.56 ±0.75 ±0.28
(b) AFE+LTSE
Well 3.72 3.07 4.53 6.10 4.35
Mid 18.06 7.11 10.61 22.27 14.51
High 9.36 7.07 8.33 17.39 10.54
Overall 10.15 5.48 7.61 14.58 9.46
CI (95%) ±0.54 ±0.35 ±0.56 ±0.73 ±0.27
J. Ram�ırez et al. / Speech Communication 42 (2004) 271–287 285
frame dropping VAD) were replaced by the pro-
posed LTSE VAD and the AURORA recognition
experiments were conducted. Tables 5 and 6 show
the word error rates obtained for the full AFEstandard and the modified AFE incorporating the
proposed VAD for noise estimation in Wiener
filtering and frame dropping. We can observe that
a significant improvement is achieved in both
databases. In AURORA 2, the word error rate
was reduced from 8.14% to 7.82% for the multi-
condition training experiments and from 13.07%
to 11.87% for the clean training experiments. InAURORA 3, the improvements were especially
important in high mismatch experiments being the
word error rate reduced from 13.27% to 10.54%.
Note that these improvements are only achieved
by replacing the VAD of the full AFE and not
introducing new improvements in the feature
extraction algorithm.
On the other hand, if the AURORA complexBack-End using digit models with 20 Gaussians
per state and a silence model with 36 Gaussians
per state is considered, the AURORA 2 word er-
ror rate is reduced from 12.04% to 11.29% for the
clean training experiments and from 6.57% to
6.13% for the multi-condition training experiments
when the VADs of the original AFE are replaced
by the proposed LTSE VAD.The efficiency of a VAD for speech recognition
depends on a number of factors. If speech pauses
Table 5
Average word error rates for the AURORA 2 databases: (a) full
AFE standard, (b) Full AFE with LTSE as VAD for noise
estimation and frame-dropping
AURORA 2 word error rate (%)
Set A Set B Set C Overall
(a) AFE
Multi 7.71 7.90 9.49 8.14
Clean 12.49 12.94 14.58 13.07
Average 10.10 10.42 11.99 10.61
CI (95%) ±0.16 ±0.17 ±0.25 ±0.11
(b) AFE+LTSE
Multi 7.36 7.56 9.27 7.82
Clean 11.44 11.56 13.35 11.87
Average 9.40 9.56 11.31 9.85
CI (95%) ±0.16 ±0.16 ±0.24 ±0.10
are very long and are more frequent than speech
periods, insertion errors would be an important
error source. On the contrary, if pauses are short,
maintaining a high speech hit-rate can be benefi-
cial to reduce the number of deletion errors with-out being significantly important insertion errors.
The mismatch between training and test condi-
tions also affects the importance of the VAD in a
speech recognition system. When the system suf-
fers a high mismatch between training and test,
more important and effective can be a VAD for
increasing the performance of speech recognizers.
This fact is mainly motivated by the efficiency ofthe frame-dropping stage in such conditions and
the efficient application of the noise suppression
algorithms.
4. Conclusion
This paper presented a new VAD algorithm for
improving speech detection robustness in noisy
environments and the performance of speech rec-
ognition systems. The VAD is based on the esti-
mation of the long-term spectral envelope and the
measure of the spectral divergence between speech
and noise. The decision threshold is adapted to the
measured noise energy while a controlled hang-over is activated only when the observed SNR is

286 J. Ram�ırez et al. / Speech Communication 42 (2004) 271–287
low. It was shown by analysing the distribution
probabilities of the long-term spectral divergence
that, using long-term information about the
speech signal is beneficial for improving speechdetection accuracy and minimizing misclassifica-
tion errors.
A discrimination analysis using the AURORA-
2 speech database was conducted to assess the
performance of the proposed algorithm and to
compare it to standard VADs such as ITU
G.729B, AMR, and the recently approved ad-
vanced front-end standard for distributed speechrecognition. The LTSE-based VAD obtained the
best behaviour in detecting non-speech periods
and was the most precise in detecting speech
periods exhibiting slow performance degradation
at unfavourable noise conditions.
An analysis of the VAD ROC curves was also
conducted using the Spanish SDC database. The
ability of the adaptive LTSE VAD to tune thedetection threshold enabled working on the opti-
mal point of the ROC curve for different noisy
conditions. The adaptive LTSE VAD provided a
sustained improvement in both non-speech hit rate
and false alarm rate over G.729 and AMR VAD
being the gains particularly important over the
G.729 VAD. The working point of the G.729
algorithm shifts to the right in the ROC space withdecreasing SNR, while the proposed algorithm is
less affected by the increasing level of background
noise. On the other hand, it has been shown that
the AFE VADs yield poor speech/non-speech
discrimination. Particularly, WF AFE VAD yields
good non-speech detection accuracy but works on
a high false alarm rate point on the ROC space,
thus suffering rapid performance degradationwhen the driving conditions get noisier. On the
other hand, FD AFE VAD is only used in the
DSR standard for frame dropping and has been
planned to be conservative exhibiting poor non-
speech detection accuracy and working on a low
false alarm rate point of the ROC space.
It was also studied the influence of the VAD in
a speech recognition system. The proposed VADoutperformed the standard G.729, AMR1, AMR2
and AFE VADs when the VAD decision is used
for estimating the noise spectrum in Wiener fil-
tering and when the VAD is employed for non-
speech frame dropping. Particularly, when the
feature extraction algorithm was based on Wiener
filtering and frame-drooping, and the models weretrained using clean speech, the proposed LTSE
VAD leaded to word error rate reductions of up to
58.71%, 49.36%, 17.66% and 15.54% over G.729,
AMR1, AMR2 and AFE VADs, respectively,
while the advantages were of up to 35.81%,
35.77%, 16.92% and 15.18% when the models were
trained using noisy speech. Similar improvements
were obtained for the experiments conducted onthe SpeechDat-Car databases. It was also shown
that the performance of the proposed algorithm is
very close to that of the manually tagged database.
The proposed VAD was also compared to the
AFE VADs using the full AFE standard as feature
extraction algorithm. When the proposed VAD
replaced the VADs of the AFE standard, a sig-
nificant reduction of the word error rate was ob-tained in both clean and multi-condition training
experiments and also for the SpeechDat-Car data-
bases.
Acknowledgement
This work has been supported by the Spanish
Government under TIC2001-3323 research project.
References
Benyassine, A., Shlomot, E., Su, H., Massaloux, D., Lamblin,
C., Petit, J., 1997. ITU-T recommendation G.729 Annex B:
a silence compression scheme for use with G.729 optimized
for V.70 digital simultaneous voice and data applications.
IEEE Comm. Magazine 35 (9), 64–73.
Berouti, M., Schwartz, R., Makhoul, J., 1979. Enhancement of
speech corrupted by acoustic noise. In: Internat. Conf. on
Acoust. Speech Signal Process., pp. 208–211.
Beritelli, F., Casale, S., Cavallaro, A., 1998. A robust voice
activity detector for wireless communications using soft
computing. IEEE J. Select. Areas Comm. 16 (9), 1818–
1829.
Beritelli, F., Casale, S., Rugeri, G., Serrano, S., 2002. Perfor-
mance evaluation and comparison ofG.729/AMR/fuzzy voice
activity detectors. IEEE Signal Process. Lett. 9 (3), 85–88.

J. Ram�ırez et al. / Speech Communication 42 (2004) 271–287 287
Boll, S.F., 1979. Suppression of acoustic noise in speech using
spectral subtraction. IEEE Trans. Acoust. Speech Signal
Process. 27, 113–120.
Bouquin-Jeannes, R.L., Faucon, G., 1994. Proposal of a voice
activity detector for noise reduction. Electron. Lett. 30 (12),
930–932.
Bouquin-Jeannes, R.L., Faucon, G., 1995. Study of voice
activity detector and its influence on a noise reduction
system. Speech Comm. 16, 245–254.
Cho, Y.D., Kondoz, A., 2001. Analysis and improvement of a
statistical model-based voice activity detector. IEEE Signal
Process. Lett. 8 (10), 276–278.
Cho, Y.D., Al-Naimi, K., Kondoz, A., 2001a. Improved voice
activity detection based on a smoothed statistical likelihood
ratio. In: Internat. Conf. on Acoust. Speech Signal Process.,
Vol. 2, pp. 737–740.
Cho, Y.D., Al-Naimi, K., Kondoz, A., 2001b. Mixed decision-
based noise adaptation for speech enhancement. Electron.
Lett. 37 (8), 540–542.
ETSI EN 301 708 recommendation, 1999. Voice activity
detector (VAD) for adaptive multi-rate (AMR) speech
traffic channels.
ETSI ES 201 108 recommendation, 2000. Speech processing,
transmission and quality aspects (STQ); distributed speech
recognition; front-end feature extraction algorithm; com-
pression algorithms.
ETSI ES 202 050 recommendation, 2002. Speech processing,
transmission and quality aspects (STQ); distributed speech
recognition; advanced front-end feature extraction algo-
rithm; compression algorithms.
Freeman, D.K., Cosier, G., Southcott, C.B., Boyd, I., 1989.
The voice activity detector for the PAN-European digital
cellular mobile telephone service. In: Internat. Conf. on
Acoust. Speech Signal Process., Vol. 1, pp. 369–372.
Hirsch, H.G., Pearce, D., 2000. The AURORA experimental
framework for the performance evaluation of speech
recognition systems under noise conditions. In: ISCA
ITRW ASR2000: Automatic Speech Recognition: Chal-
lenges for the Next Millennium.
Itoh, K., Mizushima, M., 1997. Environmental noise reduction
based on speech/non-speech identification for hearing aids.
In: Internat. Conf. on Acoust. Speech Signal Process., Vol.
1, pp. 419–422.
ITU-T recommendation G.729-Annex B, 1996. A silence
compression scheme for G.729 optimized for terminals
conforming to recommendation V.70.
Karray, L., Martin, A., 2003. Towards improving speech
detection robustness for speech recognition in adverse
environment. Speech Comm. 40 (3), 261–276.
Macho, D., Mauuary, L., Noe, B., Cheng, Y.M., Ealey, D.,
Jouvet, D., Kelleher, H., Pearce, D., Saadoun, F., 2002.
Evaluation of a noise-robust DSR front-end on AURORA
databases. In: Proc. 7th Internat. Conf. on Spoken Lan-
guage Process. (ICSLP 2002), pp. 17–20.
Madisetti, V., Williams, D.B., 1999. Digital Signal Processing
Handbook. CRC/IEEE Press.
Martin, R., 1993. An efficient algorithm to estimate the
instantaneous SNR of speech signals. In: Eurospeech, Vol.
1, pp. 1093–1096.
Marzinzik, M., Kollmeier, B., 2002. Speech pause detection for
noise spectrum estimation by tracking power envelope
dynamics. IEEE Trans. Speech Audio Process. 10 (2),
109–118.
Moreno, A., Borge, L., Christoph, D., Gael, R., Khalid, C.,
Stephan, E., Jeffrey, A., 2000. SpeechDat-Car: a large
speech database for automotive environments. In: Proc. II
LREC.
Nemer, E., Goubran, R., Mahmoud, S., 2001. Robust voice
activity detection using higher-order statistics in the LPC
residual domain. IEEE Trans. Speech Audio Process. 9 (3),
217–231.
Nokia, 2000. Baseline results for subset of SpeechDat-Car
Finnish Database for ETSI STQ WI008 advanced front-end
evaluation, http://icslp2002.colorado.edu/special_sessions/
aurora/references/aurora_ref3.pdf.
Sangwan, A., Chiranth, M.C., Jamadagni, H.S., Sah, R.,
Prasad, R.V., Gaurav, V., 2002. VAD techniques for real-
time speech transmission on the Internet. In: IEEE Internat.
Conf. on High-Speed Networks and Multimedia Comm.,
pp. 46–50.
Sohn, J., Sung, W., 1998. A voice activity detector employing
soft decision based noise spectrum adaptation. In: Internat.
Conf. on Acoust. Speech Signal Process., Vol. 1, pp. 365–
368.
Sohn, J., Kim, N.S., Sung, W., 1999. A statistical model-based
voice activity detection. IEEE Signal Process. Lett. 6 (1),
1–3.
Texas Instruments, 2001. Description and baseline results for
the subset of the SpeechDat-Car German Database used for
ETSI STQ AURORA WI008 advanced DSR front-end
evaluation, http://icslp2002.colorado.edu/special_sessions/
aurora/references/aurora_ref6.pdf.
Woo, K., Yang, T., Park, K., Lee, C., 2000. Robust voice
activity detection algorithm for estimating noise spectrum.
Electron. Lett. 36 (2), 180–181.
Young, S., Evermann, G., Kershaw, D., Moore, G., Odell, J.,
Ollason, D., Valtchev, V., Woodland, P., 2001. The HTK
Book (for HTK Version 3.1).


