Embed Size (px)
Citation preview

Copyright 2004 American Forest & Paper Association.
All rights are reserved. This document or any part thereof may not be copied or reproduced without permission in writing from the American Forest & Paper Association.
Paper Recycling:
Quality is Key to Long-term Success
A report compiled by The American Forest & Paper Association
March 2004
The American Forest & Paper Association
America’s Forest & Paper People— Improving Tomorrow’s Environment Today™

Copyright 2004 American Forest & Paper Association.
All rights are reserved. This document or any part thereof may not be copied or reproduced without permission in writing from the American Forest & Paper Association.
Table of Contents 1 Foreword 2 Jaakko Pöyry/SERA Single Stream Total Cost Analysis Study 3 AF&PA Recovered Fiber Quality Study Executive Summary 4 Paper Recycling: Quality is the Key
to Long-Term Success

Copyright 2004 American Forest & Paper Association.
All rights are reserved. This document or any part thereof may not be copied or reproduced without permission in writing from the American Forest & Paper Association.
Foreword
his report is comprised of three components. Part One is the Jaakko Poyry/SERA Single Stream Total Cost Analysis study commissioned by the American Forest & Paper
Association in July 2003. The purpose of the study is to better understand the impact of recycling processes on a system-wide, cost basis. Part Two is the Executive Summary from the AF&PA Recovered Fiber Quality Study, which was undertaken by R.W. Beck in October 2002. This study looked at rates of prohibitives and outthrows in recycling programs nationwide. Part Three is a summary piece written by the AF&PA Recovered Fiber Executive Committee which ties the finding of the two aforementioned studies together into a summary on the need for quality in paper recovery systems. As a whole, the three pieces are meant to present yet an additional paper in the ongoing debate around paper recovery and the need for quality in recycling systems. Our understanding of the impact of recycling systems on recovered paper streams is growing and information will continue to be studied and shared as it is gathered. For additional information on this compilation or on AF&PA’s efforts to increase recovery of high-quality paper, please contact AF&PA at 202-463-2700.
2
T

SERA
SKUMATZ ECONOMIC RESEARCH ASSOCIATES
SINGLE STREAM RECYCLING – TOTAL COST ANALYSIS
Prepared for:
The American Forest & Paper Association
Prepared by:
Jaakko Pöyry Consulting (JPC Consulting) 580 W rd loor hite Plains Road, 3 F
Tarrytown, NY 10591 Phone: 2-4411 914/332-4497 FAX: 914/33
Email: [email protected] Principal Investigator: David Null
Skumatz Economic Research Associates, Inc. (SERA)
762 Eldorado Drive, Superior, CO 80027 Phone 1177 : 303/494-1178 FAX: 303/494-
Email: [email protected] Principal Investigator: Lisa A. Skumatz, Ph.D.
January 7, 2004

Copyright © 2003 American Forest & Paper Association
All rights are reserved. This document or any part thereof may not be copied or reproduced without permission in writing from the American Forest & Paper Association.
. SINGLE STREAM RECYCLING – TOTAL COST ANALYSIS Jaakko Poyry Consulting and Skumatz Economic Research Associates
Report Prepared for the American Forest & Paper Association
SERA
ii

ORGANIZATION OF THE REPORT I. EXECUTIVE SUMMARY ............................................................................................................................................... 1
A. Background................................................................................................................................................................. 1 D. Detailed Results by Stage....................................................................................................................................... 2
II. CONTEXT FOR THE STUDY ...................................................................................................................................... 5 A. Background................................................................................................................................................................. 5 B. Objectives ................................................................................................................................................................... 6 A. Measurement Techniques ........................................................................................................................................ 7 B. Data Collection ........................................................................................................................................................... 7
IV. COLLECTION RESULTS: RECYCLING AND COSTS........................................................................................ 9 A. Comparison of Average Recycling / Cost Changes and Community Differences ........................................... 9 B. Statistical Analysis of SS Collection Tonnage / Recycling Results .................................................................. 10 C. Pre-Post SS Recycling and Cost Changes ......................................................................................................... 11 D. Analysis of Collection Cost Impacts...................................................................................................................... 11
V. PROCESSING ANALYSIS: TONNAGE, COST, AND INTERVIEW RESULTS .............................................. 13 A. Approach, Background, and Data Issues ............................................................................................................ 13 B. Pre-Post Tonnage and Cost Analysis / Results .................................................................................................. 13 C. Net Tonnage and Costs ........................................................................................................................................ 13
VI. MILLS / END-USER ANALYSIS: METHODOLOGY AND STUDY ISSUES .................................................. 16 A. Mills / End-User Approach...................................................................................................................................... 16 B. Quality of SS and DS Recovered Fiber Assumption Used Within the Analysis ............................................. 16 C. Mill Sampling and Interview Approach ................................................................................................................. 18 D. Discussion of Types of Cost Impacts Incurred by Mills ..................................................................................... 19
VII. MILLS / END-USER ANALYSIS: COST AND INTERVIEW RESULTS .......................................................... 22 A. Description of Mill Interview Sample ..................................................................................................................... 22 B. Qualitative Discussion of Mill Interview Results .................................................................................................. 23 C. Analysis of Mill Cost Impacts ................................................................................................................................. 26 D. Estimated SS Impact to U.S. Paper Industry ...................................................................................................... 30
VIII. OVERALL RESULTS AND IMPLICATIONS....................................................................................................... 32 A. Comparison of Impacts Across the Three Stages .............................................................................................. 32 B. Cost and Benefits Valuation across the Three Stages ..................................................................................... 32 C. Summary................................................................................................................................................................... 33
Glossary............................................................................................................................................................................ 34
. SINGLE STREAM RECYCLING – TOTAL COST ANALYSISJaakko Poyry Consulting and Skumatz Economic Research Associates
Report Prepared for the American Forest & Paper Association
SERA
iii

Acknowledgements: Thanks to Charles Bicknell, Blake Bear, Karen Imbierowicz, Rose Woods, and Leah Fuchs of SERA for their dedicated assistance in preparing this report. Thanks for guidance and advice from Mary Cesar of Forestweb.com, Jerry Powell of Resource Recycling Magazine, and Steve Apotheker, Portland Metro. Thanks to the more than 200 communities and nearly 50 MRFs that provided invaluable data to support the estimation work for the collection and processing analyses. Also thanks to the mills and members of AF&PA’s Recovered Fiber Executive Committee for their enthusiastic participation.
. SINGLE STREAM RECYCLING – TOTAL COST ANALYSISJaakko Poyry Consulting and Skumatz Economic Research Associates
Report Prepared for the American Forest & Paper Association
SERA
iv

I. EXECUTIVE SUMMARY
A. Background While communities believe the adoption of single stream curbside collection reduces costs and increase volumes, pulp and paper mills believe their recovered fiber quality is negatively impacted, directly increasing costs. A study commissioned by the American Forest & Paper Association (AF&PA) in 2002,1 showed that prohibitives (any material that, if it exceeds allowed limits, would make recycled paper unusable at the grade specified) were significantly higher for recovered fiber collected in Single Stream (SS) systems (programs where all recyclables are collected in one container) compared to traditional Dual Stream (DS) curbside systems (where paper is collected in a bin separate from other recyclables). To date, little or no work has been completed to assess the system-wide cost impacts of SS versus DS systems. Consequently, the AF&PA commissioned a study to address the following objective: Assess the impacts on recovered fiber costs and recovered paper volumes at three stages – collection, processing, and papermaking – for SS and modified single stream (MSS) programs compared to DS programs. Jaakko Pöyry Consulting (JPC) of Tarrytown, NY and Skumatz Economic Research Associates, Inc. (SERA) of Superior, CO were selected to analyze these impacts. SERA addressed the collection / processing stages of SS and JPC focused on the mill economics associated with SS collection. The work was conducted by the JPC/SERA team between June and October, 2003. B. Key Findings The JPC/SERA analysis found cost savings for collection, but cost increases to processors and mills. Overall, the cost difference for operating a SS program versus a DS program is:
• Savings of $10-20/ton for collection. • Additional cost of $5-15/ton for processing. • Increased cost of $5-13/ton of recovered fiber at paper mills. • An average net increase of $3/ton system wide.
After collection and processing, we estimated that there was a net increase of all materials recovered in curbside recycling of 1-3 percentage points. However, because of the higher level of prohibitives in recovered fiber from SS programs as found in an R.W. Beck study commissioned by AF&PA in 2002, approximately 1% more recovered fiber would be required to generate the same quantity of recycled paper and board. The net after residue removals at the mills could not be estimated, so no overall conclusion can be drawn regarding paper volumes specifically. C. Approach The research involved analysis of three stages surrounding SS, MSS and DS systems – and ultimately derived a “market” or value chain analysis.
. SINGLE STREAM RECYCLING – TOTAL COST ANALYSISJaakko Poyry Consulting and Skumatz Economic Research Associates
Report Prepared for the American Forest & Paper Association
SERA
11. “Recovered Fiber Quality Study,” Prepared for the American Forest & Paper Association by R.W. Beck, October 2002.
• For the collection stage, the study entailed analyzing costs and net tonnages for a large number of SS, MSS, and DS programs – separate from the effects of demographics and other collection program differences. SERA interviewed just under 100 SS and MSS programs, along with more than 100 DS programs for comparison.
• For the processing stage, the research compared the costs and net tonnages for SS facilities compared to non-SS facilities. More than 45 material recovery facilities (MRFs) were examined by SERA, including 2 site visits.
• For the mill stage, the analysis entailed examining the impacts in terms of increased recovered fiber costs, increased investment, revenue losses, and increased operating costs. To estimate the costs associated with SS over DS fiber, 3 paper / board segments were studied that utilize the majority of old newspapers (ONP) and residential mixed paper (RMP), the primary grades of recovered fiber collected through curb-side programs. During the study, JPC interviewed 24 mills, representing a significant share of the market capacity.
Interviews and site visits were conducted between May and September 2003. D. Detailed Results by Stage Collection
• Single stream collection is becoming increasingly common. The economic benefits at the collection stage have been the primary driver of this growth. The results showed that single stream added about 2-5 percentage points of new recycling collected;2 however, net tonnage increases were smaller after accounting for changes in contamination. Recycling program savings varied between 5% and 25% depending on the productivity of the program prior to conversion.
Processing Significant investments in SS MRFs have been made across the nation, including facilities in California, Arizona, Illinois, Ohio, Virginia, and North Carolina. Additionally, a corporate commitment to SS has been made by several large collection / processing companies, nationwide and regionally. The JPC/SERA study found:
• Processing costs are higher, on average, but vary considerably based on age of facility, age and type of equipment, number of processing steps, and other factors.
• Newer SS facilities appear to produce materials that meet and exceed the quality of many of the poorer / older DS facilities.
• DS facilities tend to be older; if retrofitted with similar equipment, then contamination at new DS facilities might be lower than those achieved at new SS facilities.
On average, contamination at single stream facilities is higher than dual stream facilities; although there is considerable variation by age and type of processing facility. This reduces the recycling tonnage gains after collection and processing to a net increase of 1-3 percentage points. Papermaking Since much of the paper industry is still trying to understand the quality differences between SS and DS, and few mills regularly measure quality of recovered fiber in a comprehensive way, the 2002 AF&PA study served as a basis for quality in the absence of any mill-specific data on quality. Within
2. Expressed as recycled tons/generation, where generation includes the sum of disposal, recycling, and other diversion.
. 2
SINGLE STREAM RECYCLING – TOTAL COST ANALYSISJaakko Poyry Consulting and Skumatz Economic Research Associates
Report Prepared for the American Forest & Paper Association
SERA

that study, ONP prohibitives were measured to be 2.0% and 3.3% for DS and SS, respectively; RMP
ing
ortion of this cost is due to the fact that, according to the R.W. Beck study, mills would need to buy rial.
se for these producers is roughly 55%. he average cost for recycled board mills is about $4.50/ton of recycled board. Again, note that only
of
ducers (particularly board producers) can use a mixture of curbside material within their
rocess, the estimated cost impact of SS over DS is 6-18% of the purchased fiber cost, averaging
get one
prohibitives were measured to be 1.1% and 1.7% for DS and SS, respectively. The analysis shows that if SS were implemented universally across all curbside collection, assumthe quality differences per the 2002 R.W. Beck study, the total industry cost for the U.S. mills producing grades that utilize curbside ONP and RMP will increase about $50 million per year. A pmore recovered fiber, and ultimately dispose of more rejects, due to the lower quality of SS mate The impact on newsprint producers that use some recycled fiber is estimated to average about $3.50/ton of newsprint. Note that average recovered fiber uTa portion of their fiber is from curbside collected materials. Expressed on the basis of curbside recovered fiber, the impact is estimated to be $5 and $13/tonrecovered fiber for newsprint and recycled board produced, respectively, averaging about $8/ton. ONP and RMP delivered prices to a mill have generally ranged between $40 and $100/ton on a historical trend basis, depending mainly on grade, region and freight considerations. Rememberingthat prop11%. Results: Costs The impact on the total value chain was calculated. JPC/SERA computed the cost per ton to ton of materials to the mill. The net cost across all three stages is estimated to increase about $3/ton of recovered fiber.
Net Cost Impact – Total Value Chain
Curbside Collection Processing Pulping Paper-
makingPaper &
paperboard products
Households
Other recyclables
Virgin fibers
Avg. Costs Differences by Value Chain Segment US$/ton of ONP/RMP
$3 (0 - 8) $8 (5 -13)$10 (5 -15)Cost increase with SS
$15 (10 - 20) vings with SS
System Net Pulping / PapermakingProcessingCollection –
$3 (0 - 8) $8 (5 -13)$10 (5 -15)Cost increase with SS
$15 (10 - 20) vings with SS
System Net Pulping / PapermakingProcessingCollection Cost saCost sa
The results showed that SS did not save money on a system-wide basis. If anything, it was somewhat more expensive than DS. Moving to SS increased net volumes of materials going into
. SINGLE STREAM RECYCLING – TOTAL COST ANALYSISJaakko Poyry Consulting and Skumatz Economic Research Associates
Report Prepared for the American Forest & Paper Association
SERA
3

recycling markets. Finally, our results show a cost savings for collection was more than offset by increases in costs to processors and mills.
e points in net recycled tonnage after collection and processing3. A separate AF&PA study indicates that there may be about 1 percentage point higher prohibitives from SS systems over DS, which may reduce the mill-usable recycled tonnage somewhat from the figures found in this study.
Results: Volume
The results of this study show there is an increase of about 1-3 percentag
. SINGLE STREAM RECYCLING – TOTAL COST ANALYSISJaakko Poyry Consulting and Skumatz Economic Research Associates
Report Prepared for the American Forest & Paper Association
SERA
43. Expressed as a percent of residential tonnage generated.

II. CONTEXT FOR THE STUDY
A. Background Many communities are looking for methods to decrease recycling program costs, boost efficiencies, and increase sustainability. Improving recovery rates and collection efficiencies are two key ways to accomplish this goal. Curbside recycling programs have changed from collecting separate streams for each material, to two streams, paper and commingled containers (Dual Stream or DS). Research shows that the reduction of the number of streams has three basic effects:
• Increasing the amount of material collected at the curb, • Decreasing the associated net program costs and the costs of collection, and 4 • Increasing the amount of contaminants, prohibitives, and outthrows in recycling materials.
Defining Collection Options Studied
Curbside Recycling Approach
Single StreamFiber and ALL containers
commingled in the same compartment on the collection vehicle
Dual StreamFiber and containers are placedin separate truck compartments
Modified Single StreamFiber kept separate from glass,
or glass not collected.
Curbside Recycling Approach
Single StreamFiber and ALL containers
commingled in the same compartment on the collection vehicle
Dual StreamFiber and containers are placedin separate truck compartments
Modified Single StreamFiber kept separate from glass,
or glass not collected.
Previous studies on the effects of SS programs indicated efficiencies, but have led to varied conclusions.5 Most of these studies were conducted before the widespread adoption of SS collection. Furthermore, the focus was often limited to the collection side of the picture. Some studies looked beyond collection to processing, brokers, and others in the chain; but the focus was not highly quantitative.6 On the end-user or mill side, AF&PA undertook a study in 2002.7 This study analyzed the composition of actual bales of recovered fiber being received by mills from both
4 Skumatz, Lisa A., Ph.D., “Nationwide Diversion Rate Study—Quantitative Effects of Program Choices on Recycling and Green Waste Diversion: Beyond Case Studies,” Skumatz Economic Research Associates, Inc. (SERA), Seattle, Washington, July 1996. 5 “A Comparative Analysis of Applied Recycling Collection Methods in Saint Paul,” Prepared for Saint Paul Neighborhood Energy Consortium by Eureka! Recycling, May 2002. ; Skumatz, Lisa A., Ph.D., “Achieving 50% in California: Analysis of Recycling, Diversion, and Cost-Effectiveness,” Skumatz Economic Research Associates, Inc., Seattle, WA, Prepared for California Chapters of SWANA, Sacramento, CA, April, 1999.; “1999 Residential Recycling Pilot Projects,” Prepared for Washington County, City of Portland, Clackamas County, Metro by Environmental Practices, Portland, OR, March 1999.; “Report of the Metro Solid Waste Advisory Subcommittee on Contamination and Loss of Recyclables,” Solid Waste Advisory Subcommittee, Portland, OR, February, 2003. 6 Kinsella, Susan, “Single Stream: An Investigation into the Interaction Between Single Stream Recycling Systems and Recycled Paper Manufacturing,” Prepared by Conservatree for The Sonoma County Waste Management Agency, CA, March, 2003.
. SINGLE STREAM RECYCLING – TOTAL COST ANALYSISJaakko Poyry Consulting and Skumatz Economic Research Associates
Report Prepared for the American Forest & Paper Association
SERA
57 “Recovered Fiber Quality Study,” Prepared by R.W. Beck for the American Forest & Paper Association, October, 2002.

SS and non-SS facilities. Previous studies examined collection, but a broader perspective including collection, processing, and use of recyclables is needed to understand the impacts of SS on each of
e players involved in the entire recycling loop.
. Objectives
t) ollection, processing, and papermaking – for SS and MSS programs
ompared to DS programs.
. Research Teams and Roles
JPC E•
le cycling
• -use impacts by interviewing mills. The Principal Investigator for this work was David Null.
sessed and modeled the impacts on the tal value chain to derive an overall market assessment.
th B The American Forest & Paper Association (AF&PA) selected a team consisting of Jaakko Pöyry (JPC) and Skumatz Economic Research Associates, Inc. (SERA) to produce an independent anddefensible study that fully analyzes the financial, diversion, and market impacts of SS versus DS collection of recyclables. This study focuses on assessing recovered fiber tonnages (gross and neand costs at three stages – cc C
/S RA independently analyzed the following segments of the recycling chain: SERA examined collection and processing by interviewing cities and MRFs, and used statistical modeling to examine the impacts on tonnage, contamination, and costs attributabto the change to SS / MSS systems. SERA also examined the impacts on other restreams beyond paper. Principal Investigator for this work was Dr. Lisa Skumatz. JPC examined paper markets, pulp and papermaking, and end
The firms completed their respective findings and jointly asto
Industry Value Chain
Collection Processing
Pulping Papermaking
SERA focus JP focus
p products
commercial, other
Households
Collection
recyclables
Virgin fibers
Collection Processing
Pulping Papermaking
SERA focus JP focus
p products
commercial, other
Households
Collection
recyclables
Virgin fibers
marketmarket
Industrial, Industrial, Other Other
Paper & Paper & aperboardaperboard
Curbside Curbside
Other Other Export Export
. SINGLE STREAM RECYCLING – TOTAL COST ANALYSISJaakko Poyry Consulting and Skumatz Economic Research Associates
Report Prepared for the American Forest & Paper Association
SERA
6

III. COLLECTION AND PROCESSING: METHODOLOGY AND DATA COLLECTION
A. Measurement Techniques SERA investigated effects attributable to SS recycling both on the collection and processing levels. Analysis groups included: • •
SS vs. DS Pre-post comparisons for communities before and after SS implementation (“Pre-Post” conversion).
Rather than relying on simple comparisons or case studies of SS and DS communities, which produce biased results, we used enhanced statistical techniques that are specifically designed to reliably isolate the SS impacts. The study examined the recycling and diversion rates after statistically “controlling for” demographic and program design differences (collection frequency, materials accepted, etc.) known to affect recycling program performance. SERA has conducted similar analyses in the past and demonstrated the reliability of the technique and key factors influencing performance and cost.8 The technique:
• Used data from multiple and varied communities, assuring results were not anomalies; • Used results from hundreds of years of program operating experience; • Used proven statistical techniques to sort the influences of differing factors between
communities and programs; • Supported analysis of patterns to determine whether community features (urban versus
rural, etc) resulted in systematic impacts; and • Produced information showing the reliability of our findings.
Finally, SERA examined differences in curbside program costs per ton to determine the financial impacts of the SS program. B. Data Collection SERA collected program design, performance, and demographic information from almost 100 SS and MSS communities.9 A list of regions with SS programs was constructed, and a sample of communities and MRFs from those areas were selected to interview. SERA also maintains in-house samples that are representative of the U.S. from which a DS collection sample was drawn. This information was further supplemented with 1) reports, conference proceedings, networking, and literature, and 2) community data gathered from several sources – most notably SERA’s database of 1,100 community programs, as well as new data collected for the project. Detailed interviews with communities generally took several calls to complete. Demographic data was largely gathered from census databases. Table 1 provides an overview of the types of information collected.
8 The multivariate regression analysis we used here were applied successfully by SERA in many previous studies, including: Nationwide diversion rate study (also included yard waste programs, RR 9/96), California analysis of recycling impacts and costs (also yard waste, RR 8/99, 9/99), including construction of cost curves, Rhode Island recycling container analysis, Iowa recycling and bottle bill analysis, Massachusetts recycling cost-effectiveness analysis (also yard waste 2001), and analysis of outreach and education expenditures (RR 8/01).
. SINGLE STREAM RECYCLING – TOTAL COST ANALYSISJaakko Poyry Consulting and Skumatz Economic Research Associates
Report Prepared for the American Forest & Paper Association
SERA
7
9 In previous work, SERA collected key data from 70 SS communities, several hundred non-SS communities, and from a dozen MRFs. We updated and augmented this information and used it in the analysis for this report.

Table 1: Data Collected for Collection and Processing Analyses Collection Processing • Households served • Collection arrangement (hauler, municipality, etc.) • Collection method for recycling (manual, semi- or fully-
automated) • Recycling collection frequency • Materials included • Container size, type • Year of program change or year the program went into
place • Other programs in place • Program cost (equipment / capital and operational)
covering collection cost, processing, transport, etc. • Outreach / educational expenditures • Tonnage disposed • Tonnage recycled (by material, where available), and
paper / non-paper tonnages • Garbage and recycling charges • Disposal and recycling / processing tip fees • Demographic and other data • Bottle bill versus non-bottle bill states • Pre-Post data
• Age of facility, age of key equipment / design
• SS versus DS, or both (with estimated shares)
• Capacity, shifts, throughput • Technology and equipment • Operational details (conveyor depth,
speed), processes used • Processing level for various streams • Tonnages for paper and non-paper
recovered materials • Information on grades including at least
mixed paper, #6 ONP, #7 ONP, and #8 ONP
• Contamination levels and related issues • Operating cost, covering yield, labor,
energy disposal, maintenance, etc. • Capital cost, covering equipment, etc. • Value / prices of paper and materials at
different quality levels • Conversion Costs and Pre-Post data • Location / region of country • Local demographics • Other
. SINGLE STREAM RECYCLING – TOTAL COST ANALYSISJaakko Poyry Consulting and Skumatz Economic Research Associates
Report Prepared for the American Forest & Paper Association
SERA
8
IV. COLLECTION RESULTS: RECYCLING AND COSTS
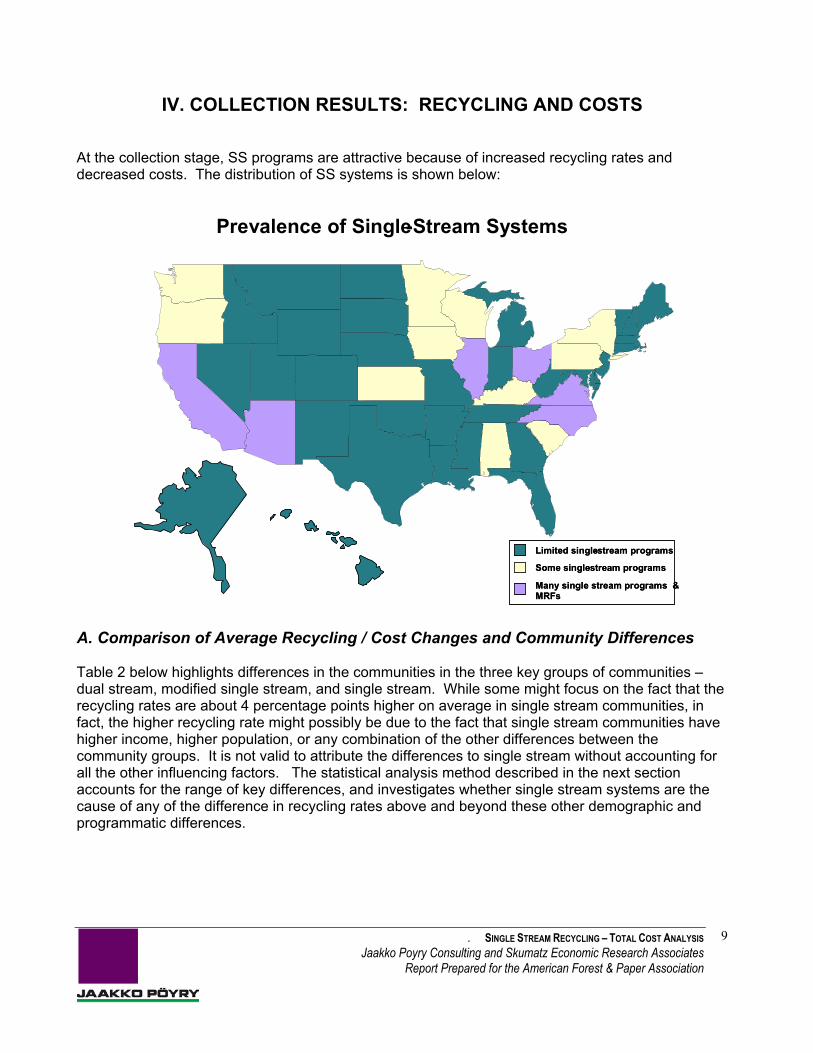
At the collection stage, SS programs are attractive because of increased recycling rates and decreased costs. The distribution of SS systems is shown below:
Prevalence of Single - Stream Systems
Limited single - stream programs
Some single - stream programs
Many single stream programs & MRFs
Limited single - stream programs
Some single - stream programs
Many single stream programs & MRFs
A. Comparison of Average Recycling / Cost Changes and Community Differences Table 2 below highlights differences in the communities in the three key groups of communities – dual stream, modified single stream, and single stream. While some might focus on the fact that the recycling rates are about 4 percentage points higher on average in single stream communities, in fact, the higher recycling rate might possibly be due to the fact that single stream communities have higher income, higher population, or any combination of the other differences between the community groups. It is not valid to attribute the differences to single stream without accounting for all the other influencing factors. The statistical analysis method described in the next section accounts for the range of key differences, and investigates whether single stream systems are the cause of any of the difference in recycling rates above and beyond these other demographic and programmatic differences.
. SINGLE STREAM RECYCLING – TOTAL COST ANALYSISJaakko Poyry Consulting and Skumatz Economic Research Associates
Report Prepared for the American Forest & Paper Association
SERA
9
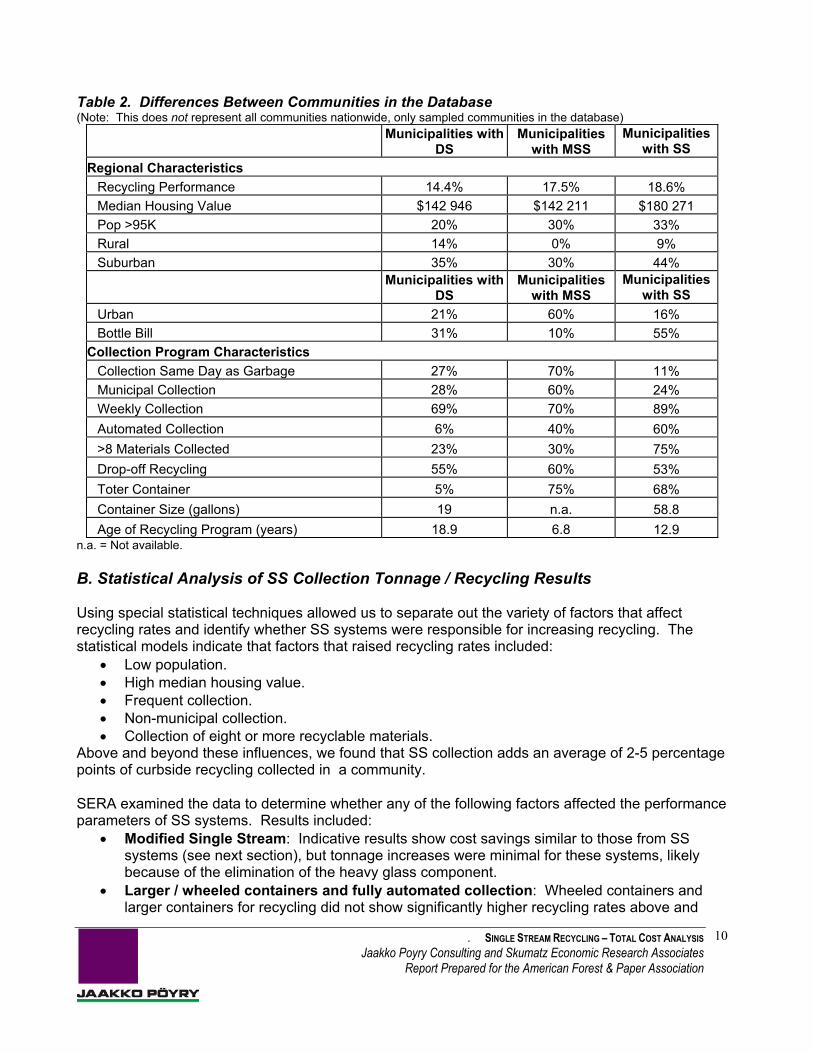
Table 2. Differences Between Communities in the Database (Note: This does not represent all communities nationwide, only sampled communities in the database)
Municipalities with
DS Municipalities
with MSS Municipalities
with SS Regional Characteristics
Recycling Performance 14.4% 17.5% 18.6% Median Housing Value $142 946 $142 211 $180 271 Pop >95K 20% 30% 33% Rural 14% 0% 9% Suburban 35% 30% 44%
Municipalities with
DS Municipalities
with MSS Municipalities
with SS Urban 21% 60% 16% Bottle Bill 31% 10% 55%
Collection Program Characteristics Collection Same Day as Garbage 27% 70% 11% Municipal Collection 28% 60% 24% Weekly Collection 69% 70% 89% Automated Collection 6% 40% 60% >8 Materials Collected 23% 30% 75% Drop-off Recycling 55% 60% 53% Toter Container 5% 75% 68% Container Size (gallons) 19 n.a. 58.8 Age of Recycling Program (years) 18.9 6.8 12.9
n.a. = Not available. B. Statistical Analysis of SS Collection Tonnage / Recycling Results Using special statistical techniques allowed us to separate out the variety of factors that affect recycling rates and identify whether SS systems were responsible for increasing recycling. The statistical models indicate that factors that raised recycling rates included:
• Low population. • High median housing value. • Frequent collection. • Non-municipal collection. • Collection of eight or more recyclable materials.
Above and beyond these influences, we found that SS collection adds an average of 2-5 percentage points of curbside recycling collected in a community. SERA examined the data to determine whether any of the following factors affected the performance parameters of SS systems. Results included:
• Modified Single Stream: Indicative results show cost savings similar to those from SS systems (see next section), but tonnage increases were minimal for these systems, likely because of the elimination of the heavy glass component.
• Larger / wheeled containers and fully automated collection: Wheeled containers and larger containers for recycling did not show significantly higher recycling rates above and
. SINGLE STREAM RECYCLING – TOTAL COST ANALYSISJaakko Poyry Consulting and Skumatz Economic Research Associates
Report Prepared for the American Forest & Paper Association
SERA
10

beyond the increases from SS. No increase in tons for automation was found either; however, nearly all SS systems use automated, wheeled carts, so disentangling separate effects from SS is difficult statistically. There was some evidence that cities with wheeled containers seemed to have slightly higher costs.
• Bottle Bill States: No differences in impacts were found for bottle bill versus non-bottle bill states until the effects of more aggressive bottle bill legislation was included. When distinctions were made for bottle bill states that used 10-cent deposits or included more enhanced container lists, indicative results showed a fairly consistent negative impact on tonnage recycled through the curbside programs.
C. Pre-Post SS Recycling and Cost Changes Only a small sample of communities was available that had recycling and / or cost data for periods both before and after SS implementation. All nine communities reported increased recycling rates at levels similar to the results reported earlier (about 16%, ranging from 7-34%, and 12% in terms of lbs/household). For a household, the average increase in recycling reported by six communities after SS implementation is an average of 110 lbs, with a minimum reported increase of 12 lbs and a maximum of 250 lbs. However, these changes in the recycling rates may reflect modifications in collection frequency, an increase in container size, or an increase in the amount of recycling education, rather than the switch to SS. Because the Pre-Post analysis compares the start-up performance and costs of a SS program to an established DS program, the findings are not a reliable indicator of the differences between established SS and DS programs. It should be noted that three out of four communities for our limited sample that had pre-post information noted their costs increased after introducing SS, an average of 9%. The cost increases may be attributed to initial purchase costs of automated trucks or containers. The Pre-Post findings are less reliable than the results derived from the statistical work because of the very small sample sizes. D. Analysis of Collection Cost Impacts Few communities were able to report cost information for their programs, making the results from this section less robust than the recycling percentage analyses. However, the analysis indicates there are several factors that consistently lowered costs:
• Larger populations. • Less frequent collection. • Collection of at least 8 materials. • Collection provided by the municipality.10
Beyond these factors, SS tended to show lower collection costs than other collection systems. The analysis indicated:
• Collection cost savings were between 5% and 25% depending on prior system. • Savings of approximately $10-20/ton of recyclables collected in SS communities. • Individual results vary from zero savings to significant decreases; some communities show
an initial increase in costs from container purchases, but savings from collection. • Some communities concurrently decreased collection frequency, but after removing that
effect, savings were still attributable to SS collection. • Haulers report increased productivity of staff and truck operation, resulting in fleet and staff
decreases.
. SINGLE STREAM RECYCLING – TOTAL COST ANALYSISJaakko Poyry Consulting and Skumatz Economic Research Associates
Report Prepared for the American Forest & Paper Association
SERA
1110 Fully automated collection was often associated with lower costs, but was not as consistent as the other factors.

In summary, the myriad variations in collection programs, community demographics, and other factors make it impossible to rely on a simple comparison to analyze the recycling and cost impacts of SS collection. Using appropriate statistical analysis of collection data shows that SS results in anoverall increase in community recycling rates, and a decrease in collection costs. However, this isonly part of the picture – the following sections examine the impacts on othe
r phases of the value chain, ultimately allowing a “net” analysis of the impacts of SS programs.
. SINGLE STREAM RECYCLING – TOTAL COST ANALYSISJaakko Poyry Consulting and Skumatz Economic Research Associates
Report Prepared for the American Forest & Paper Association
SERA
12

V. PROCESSING ANALYSIS: TONNAGE, COST, AND INTERVIEW RESULTS
A. Approach, Background, and Data Issues Structured interviews were conducted with large and small processing facility managers to gather quantitative data on systems, costs, volume, contamination, and other differences between SS and DS facilities. During interviews, we requested data or best estimates, and engaged in candid dialogs on relative sizes of impacts, strengths and weaknesses of their own and other facilities, and information on issues and influencing factors.11 While it is recognized that these facilities managers have a vested interest in making their own facility look as good as possible, we gathered information from a variety of locations, interviewed large players and outside parties, and augmented the information with published data to try to identify and control for this potential tendency. Published data were also used as a source for some information on DS facilities.12 B. Pre-Post Tonnage and Cost Analysis / Results The variations in facilities made it difficult to conduct as statistical a study as the analysis of community programs; however, we were able to draw meaningful conclusions with a reliance mostly on Pre-Post analysis and detailed interviews. Our detailed analysis of the MRF interview shows:
• Costs: Data from MRFs show that the processing costs due to changing from DS to SS increases between $5-$25/ton, with an average about $10/ton. The increases vary for new versus old facilities and other factors.
• MRF Processing Fees: Only half of the 10 cases from which we received information on Pre-Post changes in MRF reported fee increases; the other half reported leaving fees unchanged. The increases ranged from $0-$12/ton, and averaged $2.75/ton increase. In percentage terms, the increases ranged from 0-25%, with an average of 7% increase.
• Quantities: All other things being constant, contamination levels were somewhat higher for SS facilities.13 Thus, while facilities received 2-5 percentage points of material, more contaminants were removed during processing, so the net increase in recycled materials after collection and processing was 1-3 percentage points.14 Results from a separate AF&PA study indicates mill-usable tonnage may be further reduced (by perhaps 1 percentage point of recovered fiber) after paper mill residues are taken into account.
C. Net Tonnage and Costs This study relied on reported contamination figures to assess changes associated with SS collection; the JPC/SERA study did not include budget to do field inspection of bales. The best quantitative information on quality may be the 2002 AF&PA study15 in which a sample of paper bales coming into mills was sorted. The study showed an increase in prohibitives for SS systems over 11 Note that in the analyses, we weighted the results from facilities handling larger volumes of tons more heavily than small facilities. 12 “2001-2002 Directory of Materials Recovery Facilities in the United States,“ Governmental Advisory Associates, Inc., 2003. 13 In some facilities, container lines were replaced at the same time as the conversion to SS. The resulting lower contamination from container lines mitigates some of the increase from SS conversion, accounting for some of the variation in the changes in contamination levels reported by different facilities. 14 For clarification, the 2-5 (and 1-3) percentage point figures refer to an increase as a percent of total tonnage collected and recycled from the residential sector, not as a percentage increase over previous recycling or recovered tons.
. SINGLE STREAM RECYCLING – TOTAL COST ANALYSISJaakko Poyry Consulting and Skumatz Economic Research Associates
Report Prepared for the American Forest & Paper Association
SERA
1315 “Recovered Fiber Quality Study,” Prepared for the American Forest & Paper Association by R.W. Beck, October 2002.

levels from DS sources. Prohibitives for ONP increased from about 1.5% for DS bales to 2.5% from SS, and from 0.7% for DS to 1.4% for SS for residential mixed paper. However, the contamination of paper bales is only one component of the contamination issue. Identifying “net” new tons to market from SS requires examining contamination from other streams and the overall tonnage of materials that were removed and disposed as part of the MRF processing. Information from the detailed interviews and published MRF data allowed overall contamination levels to be estimated. However, note that these estimates are computed based on secondary data reports, which were gathered promising confidentiality, but were not separately verified using on-site inspections. Data from 23 SS MRFs shows an average contamination level of 14.4% (9.9% using an average weighted by tons). Eighty percent of the facilities had contamination levels between 5-24%. The results from 28 DS MRFs reporting contamination show an average contamination level of 6.8% (and the average was the same for weighted and unweighted data). Eighty percent of these facilities showed contamination levels between 2-11%. This implies that on average, contamination levels are about 3-8 percentage points higher in SS facilities compared to DS MRFs, ranging from about 3-13% (comparing high and low range values), and were about 3 percentage points higher weighted by tons. The net results for tonnage and costs for a hypothetical community with 100,000 tons per year for residential generation are shown in Table 3, which provides an illustration of the impacts. Table 3. Computing Net Recycling Tonnage Changes Under Single Stream
Under DS system (Pre)
Under SS system (Post)
Tons generated 100,000 100,000 Tons recycled collected curbside 15,000 18,000 Recycling rate reported by town 15% 18% Assumed contamination rate (removed during processing)
7% 10-14%
Net tons recycled and processed 13,950 15,480-16,200 (11-16% net increase)
Net recycling rate (after removing contamination) 13.9% 15.5-16.2% (1.5-2.2 percentage points added)
Reviewing the cost impacts shows that for a hypothetical community that generated 100,000 residential tons, the community might report an increase of 3 percentage points of recycling. However, after the removal of contaminants during MRF processing, the net increase in recycling would be about 2 percentage points and may be subject to further reductions at the mill stage. The cost per ton to operate a SS facility is typically in the range of 10% greater than a multiple stream facility with a similar level of technology. However, ascertaining the cost to convert a facility to SS processing is difficult to quantify because many facilities implement other investments and upgrades above and beyond those needed solely to operate as a SS processor.
. 14
The findings indicate that the quality of material produced at the MRF depends more on the quality of the incoming stream, age and type of processing equipment, whether container lines were upgraded, number of processing steps used, quality / concern of the on-site processing managers, and similar factors – not solely on whether the facility is SS or DS. In addition, quality is also
SINGLE STREAM RECYCLING – TOTAL COST ANALYSISJaakko Poyry Consulting and Skumatz Economic Research Associates
Report Prepared for the American Forest & Paper Association
SERA

influenced by education of residents, acceptance of downgrading by cities and uneven definitions / acceptance, export market and willingness to take variety of materials, and other factors.16
. 15
16. MSS seemed to show lower contamination levels than SS, but data from these systems was limited. However, for SS systems, no MRF reported receiving a lower price for paper grades because of prohibitives / quality issues, which may be partly due to downgrading of bales (full #7 price instead of reduced #8 price), variations in what is accepted as ONP, or other factors. Some facilities stopped sorting paper because of lower paper prices.
SINGLE STREAM RECYCLING – TOTAL COST ANALYSISJaakko Poyry Consulting and Skumatz Economic Research Associates
Report Prepared for the American Forest & Paper Association
SERA

VI. MILLS / END-USER ANALYSIS: METHODOLOGY AND STUDY ISSUES A. Mills / End-User Approach Measuring cost differences between using SS and DS fiber within pulping and papermaking operations is a difficult undertaking for a variety of reasons. Direct “before and after” or side-by-side comparisons are usually not possible. In addition to the differences in mills inherent to their design, operation or product mix, several other factors exist which increase the complexity of measuring cost differences associated with using SS recovered fiber. Such factors include:
• Many mills use a combination of “virgin” and recycled fibers. Curbside collected recovered fiber (RCP) may only comprise a portion of the recycled fiber, depending on fiber type(s).
• Mills cannot easily identify, nor do they track the collection methods of their incoming recovered fiber.
• Frequently, the curbside recovered fiber utilized at a mill is comprised of a mixture of both DD and DS recycled fiber, coming from a large number of local and regional suppliers.
• Mill personnel have a low understanding of how much of the fiber comes from SS versus DS systems.
• The increasing consumption of SS recovered fiber has changed gradually, resulting in a gradual shift in processing costs.
Without the ability to use a “before and after” or side-by-side approach, direct comparisons between different mills, or the same mill at different points in time are usually not possible to evaluate the cost impacts that using SS over DS fiber will have on a mill. Mill personnel can, however, estimate the expected impacts if asked to assume that all curbside material is of a certain quality level. Defining two quality levels, representing SS and DS, allows mills to estimate cost differences between using SS and DS fiber. B. Quality of SS and DS Recovered Fiber Assumption Used Within the Analysis Most mills using recycled fiber do not thoroughly measure the quality of their incoming recovered fiber. Virtually no purchasing decisions with respect to quality are made on the basis of whether fiber comes from a SS or DS source, but rather if the supplier meets minimum quality requirements. Such a “pass or fail” decision is usually based on previous experience with a supplier, or visual inspection of an incoming load, but, with few exceptions, is not based on rigorous quality testing performed by the mill. Due to this limited mill data and experience, quality of SS recovered fiber vis-à-vis DS was defined per the 2002 AF&PA study. This study is the most comprehensive, representative, and statistically rigorous study available on the quality of SS and DS recovered fiber. Results of prohibitive levels measured within the 2002 AF&PA Study indicate that:
• SS ONP contains a higher percentage of prohibitives than DS ONP (3.3% versus 2.0%). • SS RMP contains a higher percentage of prohibitives than DS RMP (1.7% versus 1.1%).
. SINGLE STREAM RECYCLING – TOTAL COST ANALYSISJaakko Poyry Consulting and Skumatz Economic Research Associates
Report Prepared for the American Forest & Paper Association
SERA
16

Prohibitive Levels by RCP Source
0
0.5
1
1.5
2
2.5
3
3.5
DS-ONP SS-ONP DS-RMP SS-RMPRCP Source
Proh
ibiti
ve L
evel
(% b
y w
eigh
t)Non-recyc lable paper P lasticMetal GlassOther Fines
1.7%
1.1%
3.3%
2.0%
Source: Recovered Fiber Quality Study, R.W. Beck for AF&PA (2002) The 2002 AF&PA analysis also indicates that total outthrows in SS ONP are lower than DS. Differences in pulping / deinking technology could impact which fibers are retained for papermaking, affecting yield, product quality and other operational parameters.
ONP Outthrows Comparison – SS versus DS
6.4%
1.0%
3.3%2.4% 2.1%
1.2%
9.6%
1.2%
3.0%
1.1%
2.7%
22.5%
16.8%
4.0% 4.0%4.2%
0%
5%
10%
15%
20%
25%
Magazines &Catalogues
Directories,Telephone &
Other
White OfficePaper
Junk Mail &ColoredPaper
Paperboard& Paper
Packaging
Hardbound &Paperback
Books
Corrugatedand Kraft
TotalOutthrows
Single-Stream Dual-Stream
Source: Recovered Fiber Quality Study, R.W. Beck for AF&PA (2002) Virtually no difference is seen in the total amount of recyclable paper present in SS or DS residential mixed paper, although individual categories show distinct differences. When RMP is used for production of board grades, virtually all recyclable paper is utilized in the sheet. When used in deinking systems feeding newsprint or tissue production, pulping or washing technologies can impact the amount of fiber retained. Most notably, drum pulping technology will reject most
. SINGLE STREAM RECYCLING – TOTAL COST ANALYSISJaakko Poyry Consulting and Skumatz Economic Research Associates
Report Prepared for the American Forest & Paper Association
SERA
17

. 18
corrugated and kraft papers, and deinking washing systems result in a yield loss when using papers with high pigment c
A cross-section of major U.S. consuming mills of ONP and RMP within these segments was selected for interviews and analysis. Mills sampled were based on:
Fiber Executive Committee members
ontent such as magazines and catalogues.
RMP Recyclable Paper Composition – SS versus DS
98.4%
0.5%
5.6%4.5%1.9%
9.3%
43.0%
25.5%
8.1%
98.8%
12.3%12.3%
1.5%0.6%
7.0%
74.2%
1.3%1.7%0%
10%
20%
30%
40%
50%
60%
70%
80%
90%
100%
ONP Magazines&
Catalogues
Directories,Telephone
& Other
WhiteOfficePaper
Junk Mail &ColoredPaper
Paperboard& Paper
Packaging
Hardbound&
PaperbackBooks
Corrugatedand Kraft
TotalRecyclable
Paper
Single-Stream Dual-Stream
Source: Recovery Fiber Quality Study, R.W. Beck for AF&PA (2002) C. Mill Sampling and Interview Approach Three paper / paperboard grade segments – newsprint, tissue and recycled paperboard – were elected for analysis based on their relatively high use of ONP and RMP.
500
1000
1500
2000
2500
3000
3500
4000
Mixed GradesONP
- 2002 Consumption of ONP & Mixed grades (1000 st/a) -
20
40
60
80
100
Virgin FiberRecycled Fiber
-Furnish Composition -
s 0 0 Source: 2003 AF&PA Annual Statistical Summary, Recovered Paper Utilization
PaperboardNewsprint Paperboard Tissue Other Grades Newsprint Recycled Tissue
• Input from AF&PA Recovered
SINGLE STREAM RECYCLING – TOTAL COST ANALYSISJaakko Poyry Consulting and Skumatz Economic Research Associates
Report Prepared for the American Forest & Paper Association
SERA

• Regions of the U.S. where SS has presence Willingness to be interviewed •
• Use of recycled fiber from curbside programs as a proportion of total fiber used, and
cts of overall recovered fiber quality in recent years has
rovided a foundation of understanding. JPC approached the issue by conducting numerous terviews using the following app
therefore the potential impact that SS would have on the mill While the majority of corporations and mills have virtually no empirical data regarding the impaSS recovered fiber, the general decline inpin roach: •
Experience with SS Mills were asked to compar e differences between the time period when SS recovered fiber was used and the time period when DS recovered fiber was used.
Limited or no experience with SS JPC defined the quality of DS and SS recovered fiber. Mills were asked “What if” questions pertainin
•
• g to the impacts they believe would occur should the mill experience a change from DS to SS recovered fiber at the quality levels defined.
Two approaches used depending on mill experience
“Expert” Interviews JPC interviewed mill personnel having expertise i• n one or more mill
superintendents, paper mill superintendents, procurement managers, maintenance managers, and general managers.
• JPC visited tw
operations. Mill personnel interviewed included deinking
o paper mills during the interview process.
Corporate Management and Sponsors • JPC discussed the issue, approach and best sources of data and
experience with appropriate “corporate” personnel to identify “experts.”
Production costs are impacted in four general ways as mills deal with different quality levels of rec
er grades / costs
f these costs as the quality of recovered fiber changes. The specific approach at each mill varies depending on the grades produced, recovered fiber availability, deinking process, etc.
D. Discussion of Types of Cost Impacts Incurred by Mills
overed fiber: • recovered fib• Investment costs • Revenue • Operational costs
Mills use a combination of approaches to optimize the effect o
. SINGLE STREAM RECYCLING – TOTAL COST ANALYSISJaakko Poyry Consulting and Skumatz Economic Research Associates
Report Prepared for the American Forest & Paper Association
SERA
19

1. Recovered Fiber Grades / Process Design
(Capital Investment)
2. Investment Costs 3. Revenue Recovered Fiber Mix and
Cost (by grade, source or quality
level, matching to end
4. Operational Costs
Chemicals, Energy, etc.
Yield, Landfill costs
Labor
Sorting
Deinking / papermaking Lost sales Lower prices Complaints
Downtime, Lost productionMaintenance Requirements
A certain hierarchy of these costs exists which allow mills to incorporate a variety of solutions to mitigate poorer quality recovered fiber. Since the impacts of one category could offset or eliminate those within another, mills learn to implement a variety of operational changes through time in order to optimize or minimize the negative cost impacts. Generally, revenue impacts are the most expensive for a mill to take, and therefore usually the least preferred. Switching to higher quality (and cost) recovered fiber may return the mill to its “baseline” operations, but this too is viewed as being a short-term solution that is too expensive to maintain. Over the long-term, mills will make process and operational adjustments to minimize the cost of using a more expensive recovered fiber whenever possible. Long-term decisions also usually include some type of investment within the mill in order to use lower quality recovered fiber.
. 20
Mill financial impacts with poorer quality recovered fiber
Revenue
Recovered Fiber
Grades/ Cost
Potential to over-invest
Operational Sorting$/ton
Investment
Short-term “reactions”
Long-term decisions and philosophies
SINGLE STREAM RECYCLING – TOTAL COST ANALYSISJaakko Poyry Consulting and Skumatz Economic Research Associates
Report Prepared for the American Forest & Paper Association
SERA

Through time, mills learn to adapt to SS and optimize their strategy to overcome quality differences in recovered fiber. When faced with the reality of steadily declining quality of recovered fiber, mills optimize their operating approach, including the need for investment, in order to minimize admanufacturing costs. Due to the steady decline in recovered fiber quality of the past several yearmany mills have already begun to learn how to optimize their operation in order to minimize additional costs. Through the course of interviews conducted in this analysis, mills were able toshare their experiences with using different operating approaches to deal with lower quality recovered fiber. However, since most of these experiences are based on a gradu
ditional s,
al decline in covered fiber quality or the shift from DS to SS for only a portion of their recovered fiber utilized,
stimated impacts for a wholesale shift to SS are to a large degree speculative.
ree
Sub-optimal Semi-optimal Optimal
RevenueRCP Grade/MixOperationalInvestment
Production cost differential, SS versus DS
$/ton
Most mills are here or here
. SINGLE STREAM RECYCLING – TOTAL COST ANALYSISJaakko Poyry Consulting and Skumatz Economic Research Associates
Report Prepared for the American Forest & Paper Association
SERA
21

VII. MILLS / END-USER ANALYSIS: COST AND INTERVIEW RESULTS
A. Description of Mill Interview Sample Three paper / paperboard grade segments – newsprint, tissue and recycled paperboard – were selected for analysis based on their relatively high use of ONP and RMP. A cross-section of major U.S. consuming mills of ONP and RMP within these segments was selected for interviews and analysis. Interviews were conducted with 24 mills, and 2 mills were visited for a “first-hand” observation of how operations are affected by deterioration in recovered fiber quality.
Interviews Completed by Paper Grade
0 2 4 6 8 10 12
Tissue
Newsprint
Recycled Board
- Number of mills interviewed -
Interview results from recycled board and newsprint mills were generally consistent regarding the impact that SS, or “dirtier” fiber would have on their operations. These results provided a foundation from which to estimate effects on recycled board and newsprint mills. Estimating the potential impact SS would have on tissue mills proved much more difficult due to the low amount of residentially collected grades used relative to higher quality recovered fiber, as well as confidentiality concerns expressed by producers. For these reasons, the impact of SS on the tissue industry has been roughly estimated in a manner different than recycled board or newsprint, but consistent with the findings from within these two grades. Mills within the interview sample are using a varying degree of SS fiber today. Hence, the approach used within this study was to ask mills to estimate how manufacturing costs would change given a switch from DS to SS fiber. A similar approach was employed for mills using a mix of DS and SS, in that mills were asked to estimate costs if the entire recovered fiber stream was composed of SS fiber.
. SINGLE STREAM RECYCLING – TOTAL COST ANALYSISJaakko Poyry Consulting and Skumatz Economic Research Associates
Report Prepared for the American Forest & Paper Association
SERA
22

Only one mill within the interview sample is using SS exclusively today. Some are using only DS or a e collection method used for their recovered
ber.
able 4. Furnish Compositi Sample
r Interviewed
combination of SS and DS, while others do not know thfi T on of Interview Source of Fiber fo Mills Single Stream Other Unknown Newsprint 29% 53% 18% Recycled Board 10% 80% 10% B. Qualitative Discussion of Mill Interview Results Differences in mill configuration, grades produced and operating philosophy introduce significant
ifferences when comparing cost impacts of increased contamination between mills. Since no two mills are designed nor operate identically, results for each mill are unique. Some of these differences include:
ted on “per ton” basis • Fib
cled content and proportion of residential fiber used
• Millal batch, conventional continuous, drum)
ailable for recovered fiber
• Paper/board grades produced cteristics (strength, brightness, cleanliness requirements)
• Management / operating philosophies o Fiber procurement
o Capital
l product quality levels would need to be maintained at present levels or etter. Adjustments would be necessary in other areas of the papermaking process to mitigate an
ue.
d
• Capacity o Downtime or lost production o Fixed and “semi-variable” annualized costs represener source o Percent recyo Capability to substitute virgin fiber for recycled fiber o Design capacity versus utilization of fiber systems configuration o Pulping technology (conventiono De-trashing, screening and cleaning technologies o Deinking technology (washing and / or flotation) o Paper machine configurationso On-site warehousing avo Utility services present at a mill (water, sewer, landfill) o Technical ages of equipment
o Physical chara
o Sorting at mill
Mill Findings: Revenue Impacts Most mills believe finabincreasing level of contaminants within the recovered fiber stream. For these mills, no impact would be seen on reven
. SINGLE STREAM RECYCLING – TOTAL COST ANALYSISJaakko Poyry Consulting and Skumatz Economic Research Associates
Report Prepared for the American Forest & Paper Association
SERA
23

. 24
Among mills that felt an impact would be seen in the revenue category, a few different reasons were cited, in
• • ees believe that complaints would increase. Unclear to mills is at
what point additional complaints or a degradation of quality would lead to lost business. ss
od-grade applications, however redicting this effect quantitatively became difficult for mills to do.
arameters. Furthermore, since mills pay delivery costs from the seller’s dock, differences in freight
rades purchased and utilized within a mill is viewed as a short-rm solution. Rather than “sweetening the furnish,” long-term viability is believed to require
n
r on a pass / fail basis, and use it almost immediately within their rocess. Minimal quantitative testing is done to incoming wastepaper, relying more on visual
when pressed to do so by the mill. efore changing suppliers, mills tend to show patience in allowing a supplier to try to improve
ant variability in fiber quality observed for DS and SS, lthough few have empirical data to support this assertion.
l cost impacts fall into three broad categories: materials, labor and productivity. Mills xpect a cost increase in more than one, but not necessarily all of these categories.
Materia
• ortionately with the higher level of rejects.
cluding:
• Some mills felt product prices could be impacted as a result of being forced to downgrade final product quality. Alternatively, a few mills might have to produce lowered value products. A portion of the interview
These mills felt that quality could deteriorate below a certain threshold level, causing a loof customers or orders.
Increased metal contamination is of particular concern within fop Mill Findings: Recovered Fiber Grade/Price Cost Impacts Mills interviewees do not believe they benefit from the lower price for SS compared to DS of the same basic grade. Current recovered fiber pricing structure is based on established qualitypcosts can be significant for suppliers providing similar quality. Given transportation costs and other factors, recovered fiber prices do not appear to be highly responsive to quality variations. Increasing the quality of wastepaper gteadditional investment to overcome lower quality. Such investment is related to the stock preparatio(pulpers, screening / cleaning) area. Mills with limited on-site warehousing do not have the ability to blend fiber of varying quality. The vast majority of mills accept fibepinspection for contaminants. A small handful of mills have instituted rigorous quality testing from which to judge supplier quality. Suppliers of wastepaper are responsive to improving qualityBquality. Mills also report that there is significa
ill Findings: Operational Cost Impacts M Operationae
ls
• Yield – increased contamination levels require increased rejects, directly increasing recovered fiber fiber consumption and cost. Landfill costs – increase prop
SINGLE STREAM RECYCLING – TOTAL COST ANALYSISJaakko Poyry Consulting and Skumatz Economic Research Associates
Report Prepared for the American Forest & Paper Association
SERA

• Maintenance materials – primarily wear items such as screen baskets, pulper rotors and extraction plates, pump impellers, cleaner cones, pipes, valves, etc. This impact is difficult for mills to estimate accurately. Chemicals – pulping, deinking, bleaching or water treatment are the major areas expected to increase. Minimal to no impact is expected for many mills.
t
Labor
• Additional personnel – an increase in headcount due to personnel needed to sort and / or or incoming wastepaper.
• Overtime – required for maintenance or clean-up costs following a significant fiber-related
• rtion of the interview sample. Productivity
• Costs within this category are associated with lost production due to fiber-related operational problems. These effects are mill-specific, depending on:
et
perational costs increase gradually with increasing prohibitives until some major event happens or equipment failure.) Once an event like this occurs,
osts can increase exponentially. Through the course of mill interviews, it became very difficult to
t, in
leaning stages. Even considering these recent investments, manufacturing
•
• Water usage and energy – minimal impact expected, except in cases where new equipmenwould need to be installed.
monit
operational event within the stock preparation area. Labor costs were found to increase for a very small propo
o Range in lost production expected, including several mills expecting no lost production.
Costs are measured in terms of mill-specific contribution potential. (Contribution = Nosales – Variable costs)
O(i.e. several hours of fiber-related downtimecestimate at what point (or quality level) these events might occur or what true costs would be associated with them. Mill Findings: Investment Cost Impacts Mills assume that recycled pulp quality provided to papermaking operations must remain constanspite of decreasing recovered fiber quality. Consequently, a pulping operation must adapt in severalways to provide consistent quality to papermaking operations. Lower quality fiber would be expected to warrant capital investment at several mills. All of the equipment suggested to be necessary is
ithin the pulping and screening / cleaning areas. w Some producers have made investments within the last five years that position a mill to operate using lower quality fiber. Such investments include drum pulpers, modifications to existing pulpers,
r additional screening / cocost economics are still expected to worsen within other cost categories. Investment in pulping technology is viewed by some producers as a double-edged sword. As millsupgrade equipment to process lower quality fiber, some interviewees think it could contribute to an
verall decline in quality. o
. SINGLE STREAM RECYCLING – TOTAL COST ANALYSISJaakko Poyry Consulting and Skumatz Economic Research Associates
Report Prepared for the American Forest & Paper Association
SERA
25

Investment costs within this analysis have been calculated on a “per ton” basis, assuming initial vestment amounts estimated by mills participating in the analysis. These investment costs are
t,
ewsprint Producers
hrough the course of seven mill interviews with producers of recycled-content newsprint, the sing SS over DS fiber. This production
ifferential captures the add ing sS to SS. Estimat osts for the interview ple range form $3-1 ton of
rage of $5/ton O
ditional Newsprint M acturing Costs fo ver DS – Per ton o
ONP)
incomprised of two components within the cost modeling, including depreciation (initial investmendepreciated over 20 year life) and cost of capital (average net book value, 8% cost of capital). C. Analysis of Mill Cost Impacts N Tmanufacturing cost differential was estimated for mills ud itional manufactur costs incurred by mills a suming a 100% conversion from D
an aveed c sam 1 per
ONP, with NP. Table 5. Ad anuf r S oS f ONP Newsprint Production Cost Differential (US$/ton Industry Average Interview Sample Low Interview Sample HighRCP Grade/Mix $0 N/A N/A Revenue 0.30 $0 $7.30 Operational 3.70 2.60 5.80 Investment 1.00 0 3.11 Total* $5.00 $3.20 $10.60 *Note: Total low and high refer to mill totals of all cost categories. N/A = Not Applicable.
hese estimTa
ates were extrapolated across the entire U.S. recycled-content newsprint industry and re presented in the following cost / supply curve. The cost curves are summarized to a “cash” level,
including recovered fiber grade / mix, revenue and operational impacts, and a full cost level which includes cash costs and estimated capital charges required for a 100% conversion from DS to SS. The weighted average “discount” depicted in the chart refers to the level at which SS would need to be priced lower than DS for mills to offset the additional costs they incur within their manufacturing operations.
. SINGLE STREAM RECYCLING – TOTAL COST ANALYSISJaakko Poyry Consulting and Skumatz Economic Research Associates
Report Prepared for the American Forest & Paper Association
SERA
26

Additional Newsprint Industry Costs for SS over DS – Per ton of ONP
0.00
2.00
4.00
6.00
8.00
10.00
12.00
0 500 1000 1500 2000 2500
- Estimated "discount" required to SS ONP (US$/ton)
- Cumulative ONP consumption, 1,000 tons/yr
Weighted average = ~$5/ton ONP
Note: Additional costs assume 100% conversion from DS to SS
= Results from mill interview
Cash costs + capital charges
Cash costs
When additional costs to use SS over DS are measured per ton of product produced, the impact varies depending on the recycled content of the finished sheet. The estimated industry average of $3.50/ton newsprint applies to 4.3 million tons of annual capacity, compared to total U.S. newsprint capacity of 5.9 million tons.
Additional Newsprint Industry Costs for SS over DS – Per ton of Newsprint
0.00
2.00
4.00
6.00
8.00
10.00
12.00
0 500 1000 1500 2000
- Newsprint production cost differential (US$/ton)
- Cumulative newsprint cap
Weighted average = ~$3.50/ton newsprint
= Results from mill interview
Cash costs + capital charges
Cash costs
Jaakko P
SERA
Note: Additional costs assume 100% conversion from DS to SS
2500 3000 3500 4000acity, 1,000 tons/yr -
. SINGLE STREAM RECYCLING – TOTAL COST ANALYSISoyry Consulting and Skumatz Economic Research Associates Report Prepared for the American Forest & Paper Association
27

Additional manufacturing costs incurred when mills use SS over DS show a high level obetween percent recycled content and costs measured per ton of newsprint produced. Hypothetically, the production cost differen
f correlation
tial to use SS if all production was 100% recycled would e approximately $6.50/ton of newsprint.
b
0.00
2.00
4.00
6.00
8.00
10.00
12.00
0% 20% 40% 60% 80% 100% 120%
Interviewed MillsExtrapolated Mills
- Newsprint production cost differential (US$/ton)
- Percent recycled content -Recycled Board Producers Through the course of nine mill interviews with producers of recycled board, the manufacturing cost differential was estimated for mills using SS over DS fiber. This production differential captures the additional manufacturing costs incurred by mills assuming a 100% conversion from DS to SS. Estimated costs for the interview sample range form $4-42/ton of ONP/RMP, with an average of $13/ton of ONP/RMP.
. SINGLE STREAM RECYCLING – TOTAL COST ANALYSISJaakko Poyry Consulting and Skumatz Economic Research Associates
Report Prepared for the American Forest & Paper Association
SERA
28

Table 6. Additional Recycled Board Manufacturing Costs for SS over DS – Per ton of ONP/RMP Recycled Board Production Cost Differential (US$/ton ONP/RMP) Industry Average Interview Sample Low Interview Sample HighRCP Grade/Mix $0 N/A N/A Revenue 0.90 $0 $3.00 Operational 10.00 4.40 23.70 Investment 2.50 0 20.20 Total* $13.40 $4.40 $41.90 *Note: Total low and high refer to mill totals of all cost categories. N/A = Not Applicable. These estimates were extrapolated across the entire U.S. recycled board industry and are presented in the following cost / supply curve. The cost curves are summarized to a “cash” level, including recovered fiber grade / mix, revenue and operational impacts, and a full cost level which includes cash costs and estimated capital charges required for a 100% conversion from DS to SS. The following chart shows the incremental cost that a range of mills incur when using SS as opposed to DS recovered paper as a fiber source.
Additional Recycled Board Industry Costs for SS over DS – Per ton of ONP / RMP
0.00
5.00
10.00
15.00
20.00
25.00
30.00
35.00
40.00
45.00
0 200 400 600 800 1000 1200 1400 1600 1800
- Estimated "discount" required to SS ONP/RMP (US$/ton)
- Cumulative ONP/RMP consumption, 1,000 tons/yr -
= Results from mill interview
Note: Additional costs assume 100% conversion from DS to SS
Cash costs + capital chargesWeighted average = ~$13/ton ONP/RMP
Cash costs
When additional costs to use SS over DS are measured per ton of product produced, the impact varies depending on the amount of recycled fiber in the finished sheet coming from curbside collection programs, as opposed recovered fiber coming from other collection sources. Estimated
dditional manufacturing costs to use SS recovered fiber over DS are $4.50/ton recycled board. a
. SINGLE STREAM RECYCLING – TOTAL COST ANALYSISJaakko Poyry Consulting and Skumatz Economic Research Associates
Report Prepared for the American Forest & Paper Association
SERA
29

Additional Recycled Board Industry Costs for SS over DS – Per ton of Recycled Board
0.00
1.00
2.00
3.00
4.00
5.00
6.00
7.00
8.00
0 1000 2000 3000 4000 5000
- Recycled board production cost differential (US$/ton)
- Cumulative recycled board capacity, 1,000 tons/yr -
= Results from mill interview
Note: Additional costs assume 100% conversion from DS to SS
Cash costs + capital charges Weighted average = ~$4.50/ton recycled board
Cash costs
D. Estimated SS Impact to U.S. Paper Industry Assuming 100% conversion from DS to SS, the estimated annual impact to the U.S. paper industry would be roughly $50 million. This impact, when measured on the basis of finished paper or board, amounts to a manufacturing cost increase of roughly $3.50 to $4.50/ton with outliers above and below this “average.”
Estimated impact – difficult to measure within this study
5,700
4,300
Capacity (1000 st/a)
$48 - $51 million
10,800 Total
1,900 Varies Other Grades
$7 - $10 million
1,800 51% Tissue
$26 million $4.50 3,500 100% Recycled Board
$15 million $3.50 3,600 56% Recycled-Content News
Total Impact ($ per year)
Cost Impact ($/st product)
ONP/RMP Used
Level of Recovered Fiber Content
Although difficult to measure within this study, limited interviews would suggest that the effects in tissue and other grades using ONP and RMP would be similar in many ways to those seen in the
. SINGLE STREAM RECYCLING – TOTAL COST ANALYSISJaakko Poyry Consulting and Skumatz Economic Research Associates
Report Prepared for the American Forest & Paper Association
SERA
30

newsprint and recycled board industry. Using AF&PA’s statistical summary of recovered fiber consumption, the cost impact is estimated based on the consumption of ONP and mixed papewithin these grade segments. Since mixed paper includes many grades outside of RMP, the residentially collected portion of mixed paper was assumed to be 2-5% for tissue, and 10
r
-40% for ther grades. These assumptions lead to the annual cost impact range of $7-10 million.
o
. SINGLE STREAM RECYCLING – TOTAL COST ANALYSISJaakko Poyry Consulting and Skumatz Economic Research Associates
Report Prepared for the American Forest & Paper Association
SERA
31

VIII. OVERALL RESULTS AND IMPLICATIONS A. Comparison of Impacts Across the Three Stages Single stream collection programs have a clear impact on all stages of the recycling process. The volume and per-ton cost differences are:
• An increase of 2-5 percentage points of community curbside recycling rates (20% increase in gross recycling tons collected).
• Net increase of 1-3 percentage points in community curbside recycling rates after removal of contaminants during processing.
• Further removal of contaminants at the mills reduces recovered fiber available by about 1%, based on the results of a previous AF&PA study.
• Costs of $10-20 per ton less to collect. • Costs of $5-15 per ton more to process. • Costs of $5-$13 per ton of recovered fiber more to address problems at the mills.
The figure below summarizes the results and shows that a net, system wide, cost of about $3 per ton of recovered fiber.
Net Cost Impact – Total Value Chain
Curbside Collection Processing Pulping Paper-
makingPaper &
paperboard products
Households
Other recyclables
Virgin fibers
Avg. Costs Differences by Value Chain Segment US$/ton of ONP/RMP
$15 (10 - 20) Cost savings with SS
System Net Pulping / PapermakingProcessing Collection –
$15 (10 - 20) Cost savings with SS
System Net Pulping / PapermakingProcessing Collection
$3 (0 - 8) $8 (5 -13)$10 (5 - 15)Cost increase with SS
$3 (0 - 8) $8 (5 -13)$10 (5 - 15)Cost increase with SS
B. Cost and Benefits Valuation across the Three Stages Assuming that 6-7 million tons of recovered fiber from curbside is used at U.S. mills, total impacts for complete conversion to SS across the three stages are as follows:
• Communities save $90-105 million in paper related collection costs. • Processing costs increase by about $60-70 million. • The cost to mills increase $48-51 million. • A net cost across the value chain of $18-$21 million. This includes savings for communities,
but significant additional costs to processors and mills.
. SINGLE STREAM RECYCLING – TOTAL COST ANALYSISJaakko Poyry Consulting and Skumatz Economic Research Associates
Report Prepared for the American Forest & Paper Association
SERA
32

C. Summary Single stream has been a controversial issue in recycling for several years. Significant commitments by waste haulers behind this system have increased the number of SS facilities and programs nationwide. Single stream saves money at the curb (about $15/ton), but costs more at processing (about $10/ton) and mill stages (about $8/ton) for a net cost through the value chain of $3/ton. It is estimated there was a net increase of all materials recovered in curbside recycling programs of 1-3 percentage points, however a study conducted by R.W. Beck for the AF&PA also found that residues at the mill level increased. Communities, with their focus on cost-cutting and collection, see savings and an increase in tons, providing a chance for budget-strapped cities to increase recycling rates and improve cost-effectiveness. Processors see increased costs; older facilities see increased residues, but investment in new facilities by these actors continues, and contamination at new facilities is more comparable with (and in some cases better than) older DS facilities. Mills, which are finding it very difficult to earn their cost of capital and are facing increased global competition, see increased costs and gain no offsetting rewards, making their situation further challenging. On the other hand, haulers and processors may not be fully aware that SS increases mill costs and, therefore, have not taken steps to assure consistent high quality of SS materials.
. SINGLE STREAM RECYCLING – TOTAL COST ANALYSISJaakko Poyry Consulting and Skumatz Economic Research Associates
Report Prepared for the American Forest & Paper Association
SERA
33

. SINGLE STREAM RECYCLING – TOTAL COST ANALYSIS Jaakko Poyry Consulting and Skumatz Economic Research Associates
Report Prepared for the American Forest & Paper Association
34
SERA
Glossary Dual Stream: (DS) Fiber and containers are placed in separate truck compartments. Material Recovery Facilities: (MRF) Facility in which material collected for recycling is separated or processed into various streams for further use. Material which cannot be recycled or has no recycling value is also removed. Old Newspaper: (ONP) ONP #6, #7, & #8 are defined by the Institute of Scrap Recycling Industries, Inc.17 as follows:
ONP #6 News: Consists of newspaper as typically generated from news drives and curb-side collections.
Prohibitive materials may not exceed...........................1% Total Outthrows may not exceed..................................5%
ONP #7 News, Deink Quality: Consists of sorted, fresh newspapers, not sunburned, containing not more than the normal percentage of rotogravure and colored sections. May contain magazines.
Prohibitive materials.................................None permitted Total Outthrows may not exceed.......................... ¼ of 1%
ONP #8 Special News Deink Quality: Consists of sorted, fresh newspapers, not sunburned, free from magazines, white blank, pressroom over-issues, and paper other than news, containing not more than the normal percentage of rotogravure and colored sections. This grade must be tare-free.
Prohibitive materials.................................None permitted Total Outthrows may not exceed.......................... ¼ of 1%
Outthrows: Material which must be removed from paper delivered to a mill before the paper is ecycled / repulped. r
Modified Single Stream: (MSS) A single stream program in which glass is kept separate from iber, or glass is not collected. f
Prohibitives: Any materials which by their presence in a packing of paper stock, in excess of the specification amount allowed, will make the fiber unusable as the grade specified. Or, any materials hat may be damaging to equipment. t
ecovered Fiber: All forms of paper fiber collected for recycling. R
Residential Mixed Paper: (RMP) Mixture of various qualities of paper collected from residential sources, including newsprint, magazines, corrugated and paperboard containers, and other grades.
MP is usually viewed as being of lower quality than most other forms of recycled fiber. R
esidue: Material disposed of as trash after all recyclable material is sorted from the stream. R Single Stream: (SS) Fiber and all rigid containers commingled in the same compartment in the ollection vehicle. c
17 “Scrap Specifications Circular 2003,” Institute of Scrap Recycling Inc., 2003.

AF&PA Recovered Fiber Quality Study Executive Summary Methodology R.W. Beck worked with AF&PA's Paper Recycling Group to organize and guide a fiber quality field study (Study) with mill companies by collecting and analyzing paper samples obtained from 60 U.S. curbside recycling programs. Eight companies participated in sampling paper at 13 locations using procedures defined by R. W. Beck. Each 250-350 lb. sample was sorted into 27 paper and prohibitives categories and weighed. A total of 235 usable samples were obtained, representing four source categories: Single-Stream ONP, Dual-Stream ONP, Single-Stream RMP, and Dual- Stream RMP. R. W. Beck statistically analyzed the data to determine the mean composition of materials in each category at a 90 percent confidence level. Results Single-Stream vs. Dual-Stream ONP ONP from single-stream programs is different compared to ONP from dual-stream program to a measurable level of statistical significance. Single-stream ONP contained: n More ONP (79.9% vs. 75.6%) n Significantly less OCC (1.2% vs. 2.7%) n Significantly less other recyclable paper (15.6% vs. 19.8%) Single stream ONP contained a noticeably higher percentage of prohibitives (3.3% vs. 2.0%): n Twice as much non-recyclable paper (0.8% vs. 0.4%) n Over twice as much plastics, by weight (1.1% vs. 0.5%) and over three times the bag points (173.9 vs. 47.9); n Almost 40 percent more metal (0.5% vs. 0.3%) n Slightly less glass and fines (0.5% vs. 0.6%) n Twice as much other prohibitives (0.4% vs. 0.2%) While both ONP categories contained #6, #7 and #8 ONP samples, the single-stream ONP was predominantly #7 while the dual-stream ONP was predominantly #8. Neither the #7 nor #8 ONP single-stream or dual-stream material sampled met the ISRI specification for those grades. Single Stream vs. Dual Stream RMP Compared to dual-stream RMP, single stream RMP contained: n Significantly less ONP (43.0% vs. 74.2%) n More than twice as much OCC (25.5% vs. 12.3%) n More than twice as much other recyclable paper (29.9% vs. 12.3%) The single-stream RMP had more prohibitives than dual-stream RMP (1.8% vs. 1.1%): n Over twice as much plastic, by weight (0.5% vs. 0.2%) and nearly twice as much by bag points (96.8vs. 58.1); n Twice as much glass and fines (0.4% vs. 0.2%) n The same amount of non-recyclable paper and metal (0.5% and 0.1%) n Twice as much other prohibitives (0.2% vs. 0.1%)
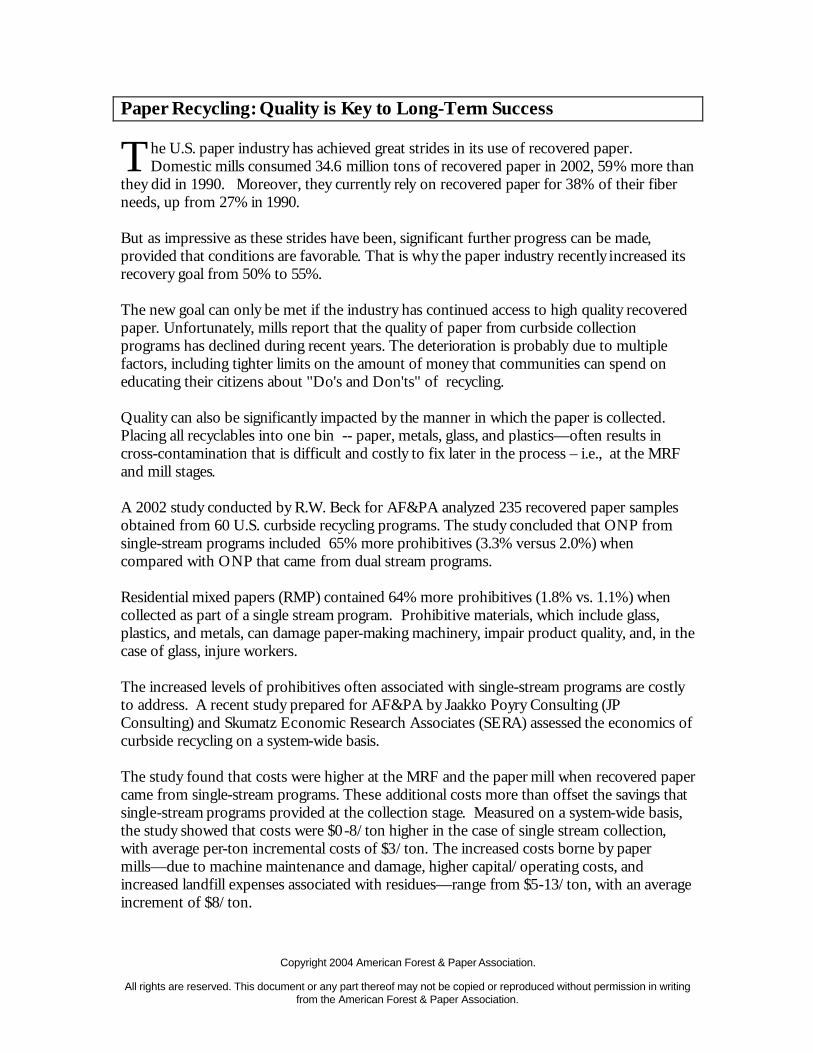
Copyright 2004 American Forest & Paper Association.
All rights are reserved. This document or any part thereof may not be copied or reproduced without permission in writing from the American Forest & Paper Association.
Paper Recycling: Quality is Key to Long-Term Success
he U.S. paper industry has achieved great strides in its use of recovered paper. Domestic mills consumed 34.6 million tons of recovered paper in 2002, 59% more than
they did in 1990. Moreover, they currently rely on recovered paper for 38% of their fiber needs, up from 27% in 1990. But as impressive as these strides have been, significant further progress can be made, provided that conditions are favorable. That is why the paper industry recently increased its recovery goal from 50% to 55%. The new goal can only be met if the industry has continued access to high quality recovered paper. Unfortunately, mills report that the quality of paper from curbside collection programs has declined during recent years. The deterioration is probably due to multiple factors, including tighter limits on the amount of money that communities can spend on educating their citizens about "Do's and Don'ts" of recycling. Quality can also be significantly impacted by the manner in which the paper is collected. Placing all recyclables into one bin -- paper, metals, glass, and plastics—often results in cross-contamination that is difficult and costly to fix later in the process – i.e., at the MRF and mill stages. A 2002 study conducted by R.W. Beck for AF&PA analyzed 235 recovered paper samples obtained from 60 U.S. curbside recycling programs. The study concluded that ONP from single-stream programs included 65% more prohibitives (3.3% versus 2.0%) when compared with ONP that came from dual stream programs. Residential mixed papers (RMP) contained 64% more prohibitives (1.8% vs. 1.1%) when collected as part of a single stream program. Prohibitive materials, which include glass, plastics, and metals, can damage paper-making machinery, impair product quality, and, in the case of glass, injure workers. The increased levels of prohibitives often associated with single-stream programs are costly to address. A recent study prepared for AF&PA by Jaakko Poyry Consulting (JP Consulting) and Skumatz Economic Research Associates (SERA) assessed the economics of curbside recycling on a system-wide basis. The study found that costs were higher at the MRF and the paper mill when recovered paper came from single-stream programs. These additional costs more than offset the savings that single-stream programs provided at the collection stage. Measured on a system-wide basis, the study showed that costs were $0 -8/ton higher in the case of single stream collection, with average per-ton incremental costs of $3/ton. The increased costs borne by paper mills—due to machine maintenance and damage, higher capital/operating costs, and increased landfill expenses associated with residues—range from $5-13/ton, with an average increment of $8/ton.
T

Copyright 2004 American Forest & Paper Association.
All rights are reserved. This document or any part thereof may not be copied or reproduced without permission in writing from the American Forest & Paper Association.
Cost increases of this magnitude can cause the economic balance to shift away from recycling, making it much more difficult for the industry to continue to expand its use of recovered paper. This is especially true since many recycling mills have been facing economic pressures during recent years. Indeed, 24 100% recycled paper/paperboard mills have permanently closed their doors since early 1998. Higher costs associated with reduced recovered paper quality may force additional recycled mills to close. Other studies have shown that single stream may not be cost-effective after a full accounting has been performed. Assessing data spanning four neighborhoods (2,000 households) over a fourteen-month period, a study performed by Eureka Recycling concluded that single stream does not make economic sense for the City of Saint Paul, Minnesota. The study concluded that, although more tons were collected under the single stream approach, this seeming benefit was more than offset by higher residual rates—i.e., more of what was collected was ultimately discarded. It also found that while single stream is less costly to operate, the cost differential was more than offset by lower revenue per ton and higher residual rates.
Is single stream really the correct answer for the long term? Collection costs may decline under single stream, but system-wide expenses increase. This makes recycling less viable and may lead to future reductions in recovered paper demand. Moreover, with single stream more residues need to be pulled out at the MRF and paper mill, which is expensive and results in more residues going to landfills. In conclusion, the economics of recycling can only work if the recovered paper arriving at the mill is of good quality. And since quality begins at the point of collection, we urge local governments, haulers, and MRF owners to take the quality needs of their recovered fiber customers into account when organizing collection and processing programs for their communities.