Embed Size (px)
Citation preview
e-ifc No. 18, December 2008 2
herbaceous plants (Atkinson, 1980); apple trees on dwarfing r o o t s t o c k s h a v e par t icu lar ly low-density root systems (Neilsen et al., 1997). C o n s e q u e n t l y , increased efficiency in nutrient supply requires timely and precise placement with high retention in the main rooting zone (Neilsen and Neilsen, 2008).
Parchomchuk et al. (1993) reported that fertigating with acidifying fertilizers through a drip system can lead to leaching and hence depletion of K and other soluble bases to a depth of 30 cm beneath the emitter after only a few years of application. Potassium can be effectively applied via fertigation, using various K sources, such as potassium chloride (KCl, or MOP), potassium sulfate (K2SO4, or SOP), potassium nitrate (KNO3) and mono-potassium phosphate (KH2PO4, or MKP). Selection of K salt is based on market availability, price, effect on salinity, solubility and the application system used (Kafkafi et al., 2001). Simple tables for calculating N, P and K fertigation based on low concentration solutions made in field conditions are available (Lupin et al., 1966). Daily K fertigation from mid-June to mid-August (northern hemisphere summer) at 15 g/tree/yr maintained a higher K concentration in the soil solution as well as leaf K concentrations above deficiency levels. Fruit yield, fruit size, titratable acidity and red color at harvest all increased in the apple cultivars “Gala” , “Fuj i” , “Fies ta” , and “Spartan” (Neilsen et al., 2004b). In these experiments reported by Neilsen it appears that the form of K fertilizer has little effect on tree response.
Fertigation of apples is widely practiced throughout the world. In Canada, Israel
I Fertigation management in young apple trees in Shandong, China Y. Peng(1), P. Shiqi(2), T. Youguo(2), S. Ivanova(3), and H. Magen(4).
Introduction
Apple production in Shandong Province, eastern China, occupies 305,000 ha, approximately 20 per cent of the country’s total apple area in 2007. Average yields in the region were 23.8 mt/ha, higher than the national average for the same year (14.2 mt/ha). Recently, a large area has been developed for apple cultivation in provinces of the north-west China (Gansu, Shaanxi, Ningxia and more).
The leading varieties in the Shandong Province are Red Fuji, Red General, Gala and Jonagold. The typical irrigation and fertilization management practices used in Shandong for growing apples include: furrow and flood irrigation, application of manure and basal fertilizer in grooves encircling the trees after harvest or in the following early spring, and top-dressed fertilizer application broadcast with three or four splits during the growing period of the tree. These traditional methods of irrigation and fertilization make water and fertilizer use inefficient.
In irrigated horticultural production systems, precision in the application of water and nutrients can be achieved by fertigation (Scaife and Bar-Yosef, 1995; Bar-Yosef, 1999; Haynes, 1985; Neilsen et al., 1999). Deciduous fruit trees are typically characterized by a low rooting density, several orders of magnitude lower than that of
Research findings
Optimizing Crop Nutrition
and other countries where apple receives irrigation, fertigation is a common practice for supplying nitrogen and potassium, and to a lesser extent, phosphorus.
The aim of the IPI-NATESC experiment reported here was to evaluate the effectiveness of fertigation with dry soluble nitrogen and potassium fertilizer in an apple orchard under the brown soil (cambisols) conditions in Shandong province. This paper presents the results of three years (2004-2007) of fertigation in young apple trees starting one year before taking the first commercial yield. The objectives of the work were to test the effect of the fertigation system in its ability to deliver optimal amounts of water and nutrients and the effect of various amounts of nitrogen, and potassium supplied as dry and fertigated nutrients on tree development, and yield and quality of apples.
Materials and methods
Experimental site
A full fertigation system was installed at the Penglai orchard, which is located in the east of Shandong province, near Yantai city. This city lies on the southeastern coast of the Bohai sea, 500 km to the north-east of Jinan, the
(1) Corresponding author. Yan Peng ([email protected]), Soil and Fertilizer Technology Extension Station, Shandong province, China.
(2) National Agro-Tech Extension and Service Center (NATESC) MOA, China.
(3) International Plant Nutrition Institute (IPNI), Moscow, Russia.
(4) International Potash Institute (IPI), Horgen, Switzerland.
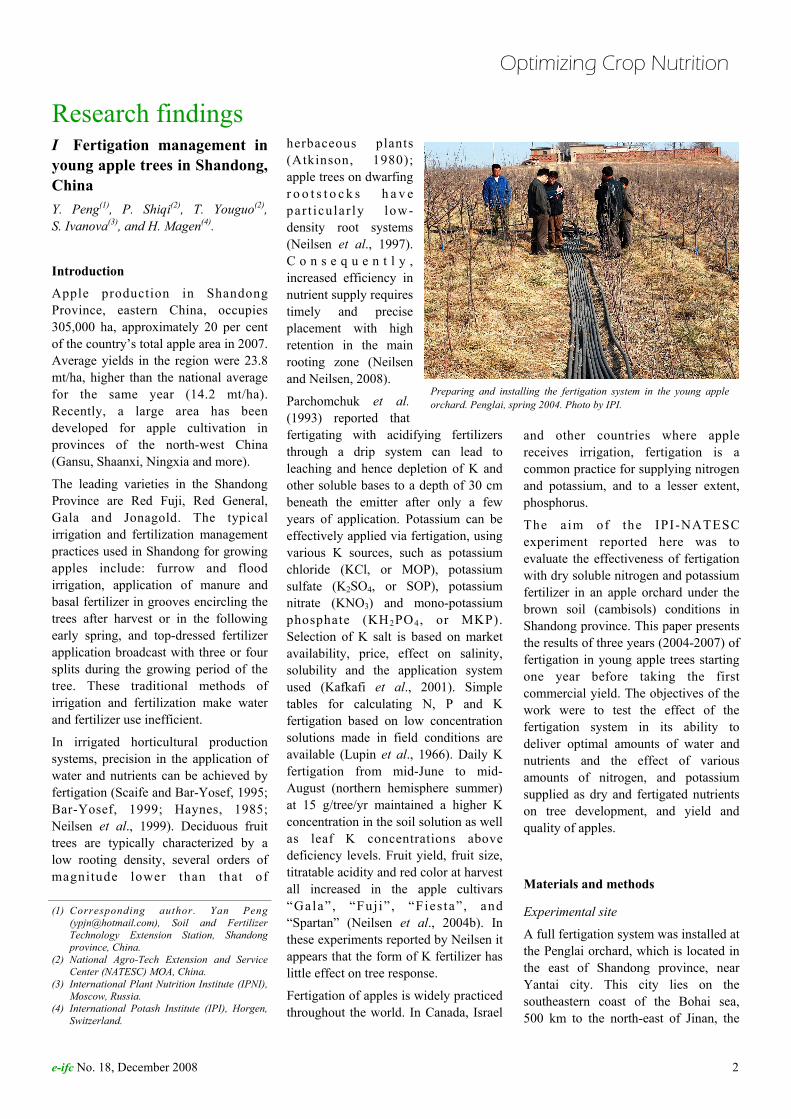
Preparing and installing the fertigation system in the young apple orchard. Penglai, spring 2004. Photo by IPI.
e-ifc No. 18, December 2008 3
matter (OM) and pH before the experiment started are given in Table 1.
Farmyard Manure (FYM)
FYM (composted poultry litter) was added to all the treatments at 1,700 kg/ha every year, in spring or autumn. The analysis of the applied manure is shown in Table 2.
Irrigation and quality of water
The irrigation system used was a “micro irrigation system” (MIS) designed especially for this experiment so that each treatment was operated separately and monitored at the control head (see photo left). The water head of the system was typically 15 m, which allowed delivery of the precise amount of water and nutrients to each treatment. The jet emitters were positioned along the line of trees, one jet near each tree with a discharge rate of 70 L/h. The wetted diameter was 3.4 m in 2004 which was extended to 4m in 2005 and 2006 because of the increase in tree crown.
Irrigation started in early April and ended at mid July; at this time, irrigation was supplied in order to reach field capacity (21%, w/w). Irrigation quantity and scheduling was made in accordance with the daily readings of four tensiometer stations (a station at each replication with two tensiometers in each, at depths of 30 and 60 cm) and with data from a class A evaporation
Research findings
Optimizing Crop Nutrition
capital of the Province (see map). The climate in the region is defined as “a monsoon climate of the temperate zone”, the annual average temperature is 12°C, with an average rainfall of 642 mm/yr, an average evaporation rate (class A pan) of 1,140 mm/yr, and a frost-free period of approximately 200 days and 2,826 hr of sunshine per year.
The apple variety used in the study was “red general” (arbor), originating from Japan. Trees were planted in the year 2000 and the experiment begun four years later. The density of planting was 3.0 m x 5.0 m, with a total of 667 trees/ha. Each replicate consisted of five trees, and buffer lines and trees were used between the replicates.
The soil type is loamy and classified as an “initial brown earth” on light sloping land, 80-90 cm deep. The following physiochemical properties were recorded: field capacity of 21.5 per cent (w/w), bulk density 1.41 g/cm3 and CEC of 13.7-21.6 cmol/kg soil. Available nutrient contents, soil organic
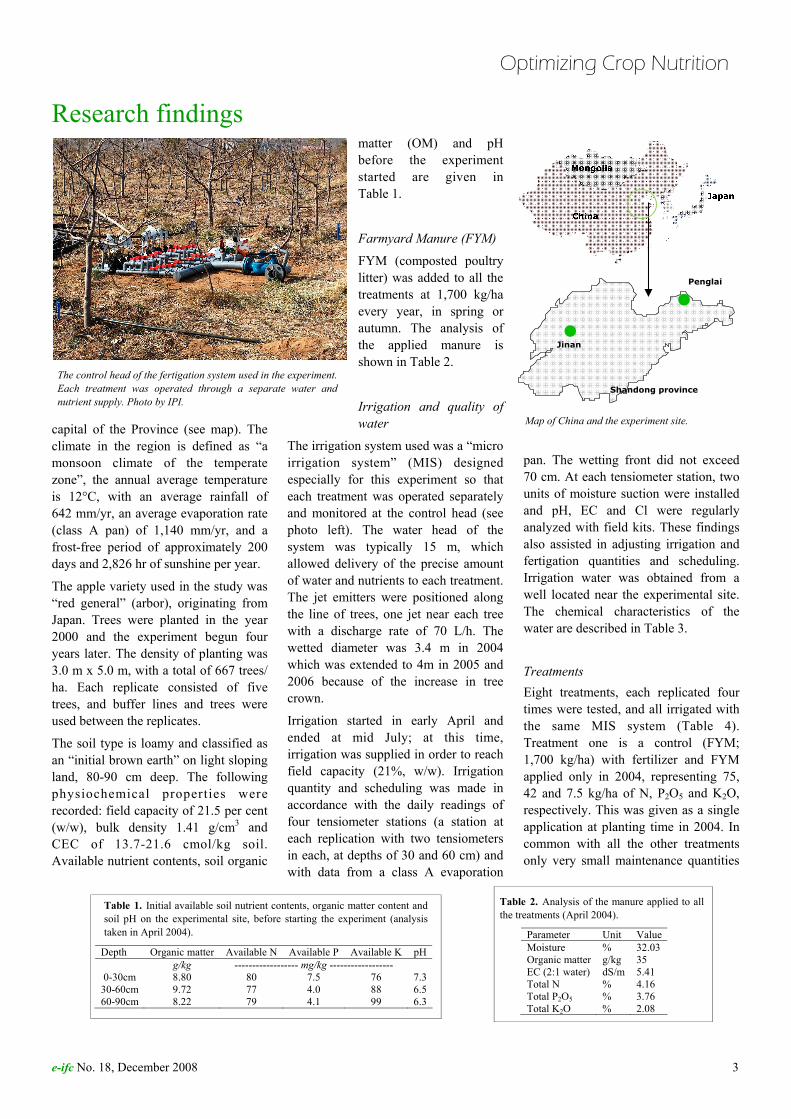
The control head of the fertigation system used in the experiment. Each treatment was operated through a separate water and nutrient supply. Photo by IPI.
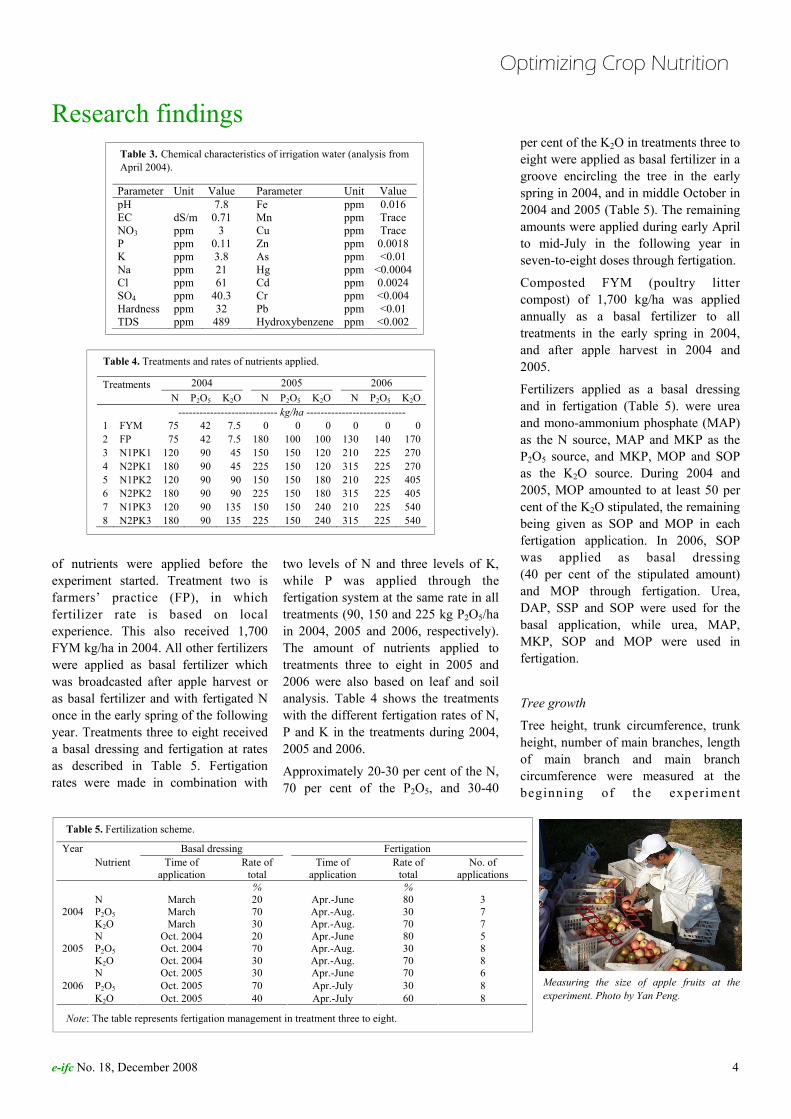
Map of China and the experiment site.
Penglai
Jinan
Shandong province
Table 2. Analysis of the manure applied to all the treatments (April 2004).
Parameter Unit Value Moisture % 32.03 Organic matter g/kg 35 EC (2:1 water) dS/m 5.41 Total N % 4.16 Total P2O5 % 3.76 Total K2O % 2.08
pan. The wetting front did not exceed 70 cm. At each tensiometer station, two units of moisture suction were installed and pH, EC and Cl were regularly analyzed with field kits. These findings also assisted in adjusting irrigation and fertigation quantities and scheduling. Irrigation water was obtained from a well located near the experimental site. The chemical characteristics of the water are described in Table 3.
Treatments Eight treatments, each replicated four times were tested, and all irrigated with the same MIS system (Table 4). Treatment one is a control (FYM; 1,700 kg/ha) with fertilizer and FYM applied only in 2004, representing 75, 42 and 7.5 kg/ha of N, P2O5 and K2O, respectively. This was given as a single application at planting time in 2004. In common with all the other treatments only very small maintenance quantities
Table 1. Initial available soil nutrient contents, organic matter content and soil pH on the experimental site, before starting the experiment (analysis taken in April 2004).
Depth Organic matter Available N Available P Available K pH g/kg ------------------ mg/kg ------------------ 0-30cm 8.80 80 7.5 76 7.3 30-60cm 9.72 77 4.0 88 6.5 60-90cm 8.22 79 4.1 99 6.3
e-ifc No. 18, December 2008 4
per cent of the K2O in treatments three to eight were applied as basal fertilizer in a groove encircling the tree in the early spring in 2004, and in middle October in 2004 and 2005 (Table 5). The remaining amounts were applied during early April to mid-July in the following year in seven-to-eight doses through fertigation.
Composted FYM (poultry litter compost) of 1,700 kg/ha was applied annually as a basal fertilizer to all treatments in the early spring in 2004, and after apple harvest in 2004 and 2005.
Fertilizers applied as a basal dressing and in fertigation (Table 5). were urea and mono-ammonium phosphate (MAP) as the N source, MAP and MKP as the P2O5 source, and MKP, MOP and SOP as the K2O source. During 2004 and 2005, MOP amounted to at least 50 per cent of the K2O stipulated, the remaining being given as SOP and MOP in each fertigation application. In 2006, SOP was applied as basal dressing (40 per cent of the stipulated amount) and MOP through fertigation. Urea, DAP, SSP and SOP were used for the basal application, while urea, MAP, MKP, SOP and MOP were used in fertigation.
Tree growth
Tree height, trunk circumference, trunk height, number of main branches, length of main branch and main branch circumference were measured at the beginning of the experiment
Research findings
Optimizing Crop Nutrition
of nutrients were applied before the experiment started. Treatment two is farmers’ practice (FP), in which fertilizer rate is based on local experience. This also received 1,700 FYM kg/ha in 2004. All other fertilizers were applied as basal fertilizer which was broadcasted after apple harvest or as basal fertilizer and with fertigated N once in the early spring of the following year. Treatments three to eight received a basal dressing and fertigation at rates as described in Table 5. Fertigation rates were made in combination with
two levels of N and three levels of K, while P was applied through the fertigation system at the same rate in all treatments (90, 150 and 225 kg P2O5/ha in 2004, 2005 and 2006, respectively). The amount of nutrients applied to treatments three to eight in 2005 and 2006 were also based on leaf and soil analysis. Table 4 shows the treatments with the different fertigation rates of N, P and K in the treatments during 2004, 2005 and 2006.
Approximately 20-30 per cent of the N, 70 per cent of the P2O5, and 30-40
Table 5. Fertilization scheme.
Note: The table represents fertigation management in treatment three to eight.
Year Basal dressing Fertigation Nutrient Time of
application Rate of
total Time of
application Rate of
total No. of
applications % %
N March 20 Apr.-June 80 3 P2O5 March 70 Apr.-Aug. 30 7 2004 K2O March 30 Apr.-Aug. 70 7 N Oct. 2004 20 Apr.-June 80 5 P2O5 Oct. 2004 70 Apr.-Aug. 30 8 2005 K2O Oct. 2004 30 Apr.-Aug. 70 8 N Oct. 2005 30 Apr.-June 70 6 P2O5 Oct. 2005 70 Apr.-July 30 8 2006 K2O Oct. 2005 40 Apr.-July 60 8
Table 3. Chemical characteristics of irrigation water (analysis from April 2004).
Parameter Unit Value Parameter Unit Value pH 7.8 Fe ppm 0.016 EC dS/m 0.71 Mn ppm Trace NO3 ppm 3 Cu ppm Trace P ppm 0.11 Zn ppm 0.0018 K ppm 3.8 As ppm <0.01 Na ppm 21 Hg ppm <0.0004Cl ppm 61 Cd ppm 0.0024 SO4 ppm 40.3 Cr ppm <0.004 Hardness ppm 32 Pb ppm <0.01 TDS ppm 489 Hydroxybenzene ppm <0.002
Table 4. Treatments and rates of nutrients applied.
Treatments 2004 2005 2006 N P2O5 K2O N P2O5 K2O N P2O5 K2O
---------------------------- kg/ha ---------------------------- 1 FYM 75 42 7.5 0 0 0 0 0 0 2 FP 75 42 7.5 180 100 100 130 140 170 3 N1PK1 120 90 45 150 150 120 210 225 270 4 N2PK1 180 90 45 225 150 120 315 225 270 5 N1PK2 120 90 90 150 150 180 210 225 405 6 N2PK2 180 90 90 225 150 180 315 225 405 7 N1PK3 120 90 135 150 150 240 210 225 540 8 N2PK3 180 90 135 225 150 240 315 225 540
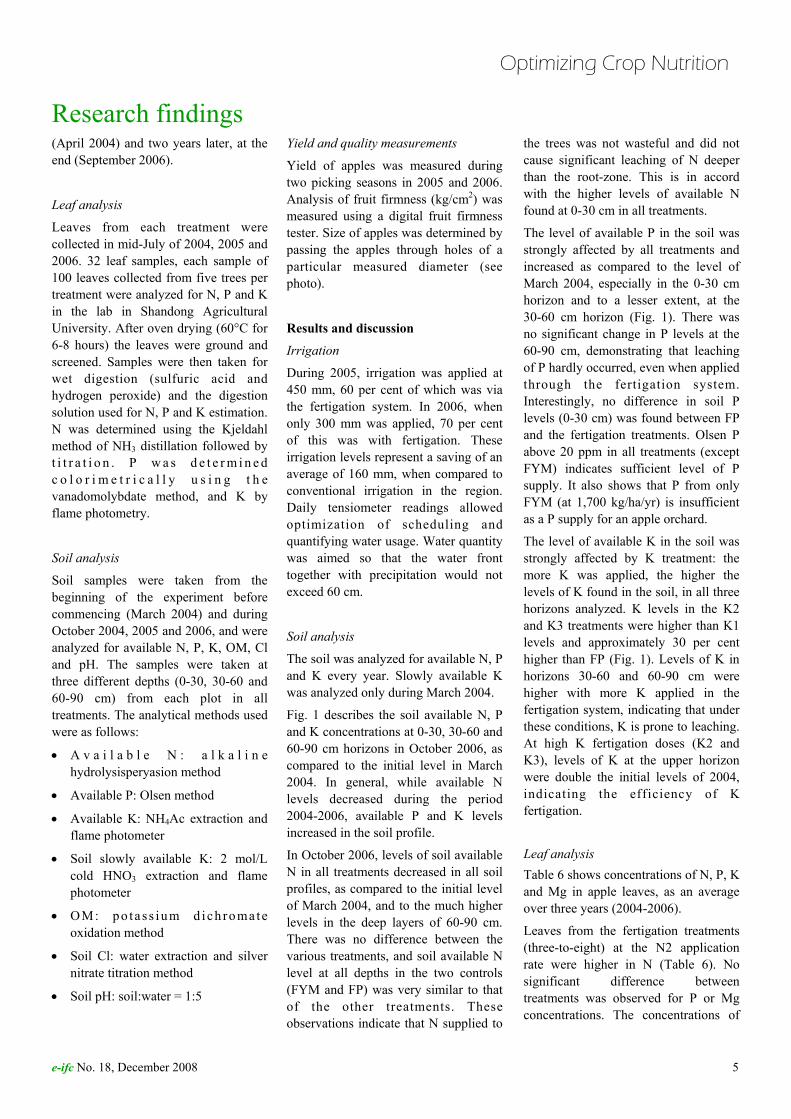
Measuring the size of apple fruits at the experiment. Photo by Yan Peng.
e-ifc No. 18, December 2008 5
Yield and quality measurements
Yield of apples was measured during two picking seasons in 2005 and 2006. Analysis of fruit firmness (kg/cm2) was measured using a digital fruit firmness tester. Size of apples was determined by passing the apples through holes of a particular measured diameter (see photo).
Results and discussion
Irrigation
During 2005, irrigation was applied at 450 mm, 60 per cent of which was via the fertigation system. In 2006, when only 300 mm was applied, 70 per cent of this was with fertigation. These irrigation levels represent a saving of an average of 160 mm, when compared to conventional irrigation in the region. Daily tensiometer readings allowed optimization of scheduling and quantifying water usage. Water quantity was aimed so that the water front together with precipitation would not exceed 60 cm.
Soil analysis
The soil was analyzed for available N, P and K every year. Slowly available K was analyzed only during March 2004.
Fig. 1 describes the soil available N, P and K concentrations at 0-30, 30-60 and 60-90 cm horizons in October 2006, as compared to the initial level in March 2004. In general, while available N levels decreased during the period 2004-2006, available P and K levels increased in the soil profile.
In October 2006, levels of soil available N in all treatments decreased in all soil profiles, as compared to the initial level of March 2004, and to the much higher levels in the deep layers of 60-90 cm. There was no difference between the various treatments, and soil available N level at all depths in the two controls (FYM and FP) was very similar to that of the other treatments. These observations indicate that N supplied to
the trees was not wasteful and did not cause significant leaching of N deeper than the root-zone. This is in accord with the higher levels of available N found at 0-30 cm in all treatments.
The level of available P in the soil was strongly affected by all treatments and increased as compared to the level of March 2004, especially in the 0-30 cm horizon and to a lesser extent, at the 30-60 cm horizon (Fig. 1). There was no significant change in P levels at the 60-90 cm, demonstrating that leaching of P hardly occurred, even when applied through the fertigation system. Interestingly, no difference in soil P levels (0-30 cm) was found between FP and the fertigation treatments. Olsen P above 20 ppm in all treatments (except FYM) indicates sufficient level of P supply. It also shows that P from only FYM (at 1,700 kg/ha/yr) is insufficient as a P supply for an apple orchard.
The level of available K in the soil was strongly affected by K treatment: the more K was applied, the higher the levels of K found in the soil, in all three horizons analyzed. K levels in the K2 and K3 treatments were higher than K1 levels and approximately 30 per cent higher than FP (Fig. 1). Levels of K in horizons 30-60 and 60-90 cm were higher with more K applied in the fertigation system, indicating that under these conditions, K is prone to leaching. At high K fertigation doses (K2 and K3), levels of K at the upper horizon were double the initial levels of 2004, indicating the efficiency of K fertigation.
Leaf analysis Table 6 shows concentrations of N, P, K and Mg in apple leaves, as an average over three years (2004-2006).
Leaves from the fertigation treatments (three-to-eight) at the N2 application rate were higher in N (Table 6). No significant difference between treatments was observed for P or Mg concentrations. The concentrations of
Research findings
Optimizing Crop Nutrition
(April 2004) and two years later, at the end (September 2006).
Leaf analysis
Leaves from each treatment were collected in mid-July of 2004, 2005 and 2006. 32 leaf samples, each sample of 100 leaves collected from five trees per treatment were analyzed for N, P and K in the lab in Shandong Agricultural University. After oven drying (60°C for 6-8 hours) the leaves were ground and screened. Samples were then taken for wet digestion (sulfuric acid and hydrogen peroxide) and the digestion solution used for N, P and K estimation. N was determined using the Kjeldahl method of NH3 distillation followed by t i t r a t i o n . P w a s d e t e r m i n e d c o l o r i m e t r i c a l l y u s i n g t h e vanadomolybdate method, and K by flame photometry.
Soil analysis
Soil samples were taken from the beginning of the experiment before commencing (March 2004) and during October 2004, 2005 and 2006, and were analyzed for available N, P, K, OM, Cl and pH. The samples were taken at three different depths (0-30, 30-60 and 60-90 cm) from each plot in all treatments. The analytical methods used were as follows:
• A v a i l a b l e N : a l k a l i n e hydrolysisperyasion method
• Available P: Olsen method
• Available K: NH4Ac extraction and flame photometer
• Soil slowly available K: 2 mol/L cold HNO3 extraction and flame photometer
• OM: po ta ss ium d ich romate oxidation method
• Soil Cl: water extraction and silver nitrate titration method
• Soil pH: soil:water = 1:5

e-ifc No. 18, December 2008 6
development places a high K demand on the leaves causing a progressive seasonal decrease in leaf K concentration to values which can be as much as 30-50 per cent below the optimal value (Veberič et al., 2005). Besides the fertigation treatments, the time at which the leaves were harvested – in this case mid-July – could have markedly affected the K concentration. Potassium concentration was highest in treatments six and eight (N2PK2 and N2PK3, 0.95 and 0.93 per cent, respectively) while treatment one, with no added mineral N, P and K, presented the lowest K level (0.71 per cent). This can be explained by the fact that the generous FYM application was significant in supplying N, P, and Mg, but not K.
Because the level of available K in the 0-30 cm zone of the soil increased from 2004 to 2006 (Fig. 1), we compared the soil K data to that of the K in leaves, during the same period. Fig. 2 shows the relationship between available soil K in 0-30, 30-60 and 60-90 cm to leaf K. The figure clearly shows that the correlation between this relationship was highest in the upper soil layers: R2=0.6775 in the 0-30 cm horizon and R2=0.758 in the 30-60 cm horizon, whereas at 60-90 cm there was no clear correlation. This high correlation between available soil K in the top soil and leaf K concentration provides strong evidence for the benefit of K fertigation which enriches the upper soil horizon in supplying K to the tree.
apple leaves with reported optimal values in the region of one per cent DM (Ebert, 2009). It has to be taken into account, however, that apple fruit
Research findings
Optimizing Crop Nutrition
these elements in the leaves of all treatments are above the critical deficiency levels, although the values for K appear to be relatively low for
Table 6. N, P, K and Mg concentrations (% DM) in leaves of apple trees (average of three years, 2004-2006).
Treatment N P K Mg ---------- % DM ---------- 1 FYM 2.31 0.16 0.71 0.42 2 FP 2.32 0.15 0.82 0.41 3 N1PK1 2.39 0.15 0.81 0.43 4 N2PK1 2.43 0.15 0.85 0.44 5 N1PK2 2.41 0.16 0.83 0.43 6 N2PK2 2.43 0.16 0.95 0.43 7 N1PK3 2.43 0.17 0.83 0.44 8 N2PK3 2.48 0.16 0.93 0.43
Fig. 1. Levels of soil available N, P and K in the various treatments in March 2004 (left bars) and October 2006.
0
5
10
15
20
25
30
P (m
g/kg
)
0
20
40
60
80
100
Mrz 04 FYM FP N1PK1 N2PK1 N1PK2 N2PK2 N1PK3 N2PK3
N (m
g/kg
)
0
20
40
60
80
100
120
140
160
180
K (m
g/kg
)
0-30 cm30-60 cm60-90 cm
P
N
K
Mar-04

e-ifc No. 18, December 2008 7
Research findings
Optimizing Crop Nutrition
Growth of trees
Tree height and trunk circumference were measured at the beginning of the experiment (2004) and 2.5 years later, at the end (2006). The difference (2004-2006) in trunk circumference and tree height is shown in Table 7. No significant differences were found among the treatments; moreover, no correlation was found between these two parameters and apple fruit yield.
Yield
The yield in 2005 (the first commercial yield of the orchard) was low, between 360 to 1,000 kg/ha. While treatment one (FYM) had the lowest yield, the differences between the various treatments with mineral fertilizers and fertigation were not significant (Table 8), except for treatment six (N2PK2), which was significantly higher than other treatments (1,005 kg/ha).
In the following year (2006) a commercial yield was obtained (Table 8). Clearly, the application of only OM (treatment one) is not sufficient to produce reasonable yields, and the addition of fertilizers contributes significantly to yields (treatments two-to-eight). Fertigation treatments (three-to-eight), were in general, better than farmers’ practice (treatment two), especially those treatments with high N and K (N2PK3).
In 2005, application of N in treatment two (FP) was higher than N1 in the fertigation treatments, and K levels were similar, which explains the
Table 7. Change in trunk circumference and tree height between 2004-2006.
Fig. 3. Correlation between concentration of N, P and K in apple tree leaves and yield (2006).
Treatment Change in growth between 2004-2006 Trunk circumference Tree height ------------------- cm ------------------- 1 FYM 13.5 145.5 2 FP 15.0 151.3 3 N1PK1 12.5 135.1 4 N2PK1 16.1 137.0 5 N1PK2 14.4 152.8 6 N2PK2 15.7 161.8 7 N1PK3 15.5 162.1 8 N2PK3 14.0 160.2
marginal yield response to fertigation in 2005. In 2006, N1 and K levels in the fertigation treatments were much higher than treatment two, which explains the stronger yield effect for fertigation treatments in 2006. The best treatment in 2006 (N2PK3) with a yield of 6,226 kg/ha achieved double the yield of the farmers’ practice treatment. When large amounts of N were applied (N2 treatments), K3 was superior to K1 and K2, demonstrating the need for balance in the nutrients applied.
N2 was superior to N1 in both 2005 and 2006 at approximately 10 per cent.
Increased K levels in 2006 contributed an additional yield of approximately 33 per cent.
The relationship between N, P and K in leaves and yield in 2006 is shown in Fig. 3. R2 values for N (0.24) and P (0.02) are much lower than R2 of K (0.63). This strong relation between K concentration in leaves and the effect of K level in the upper soil profiles (Fig. 2) allows for optimization of the fertilization practices, aiming to reach K concentration of >0.8 in DM of leaves.
Fig. 2. Correlation between soil K in three horizons (0-30, 30-60 and 60-90 cm) and K in apple tree leaves.
0-30 cmR2 = 0.6775
30-60 cmR2 = 0.758
0.3
0.4
0.5
0.6
0.7
0.8
0.9
1
70 90 110 130 150 170 190
K level in soil (mg/kg)
K le
vel i
n le
aves
(%)
0-30 cm30-60 cm60-90 cm
K; R2 = 0.63
N; R2 = 0.24
P; R2 = 0.02
0
2,000
4,000
6,000
8,000
0.05 0.35 0.65 0.95 1.25 1.55 1.85 2.15 2.45 2.75
N, P, K concentration in leaves (% DM)
Yie
ld (k
g/ha
)
e-ifc No. 18, December 2008 8
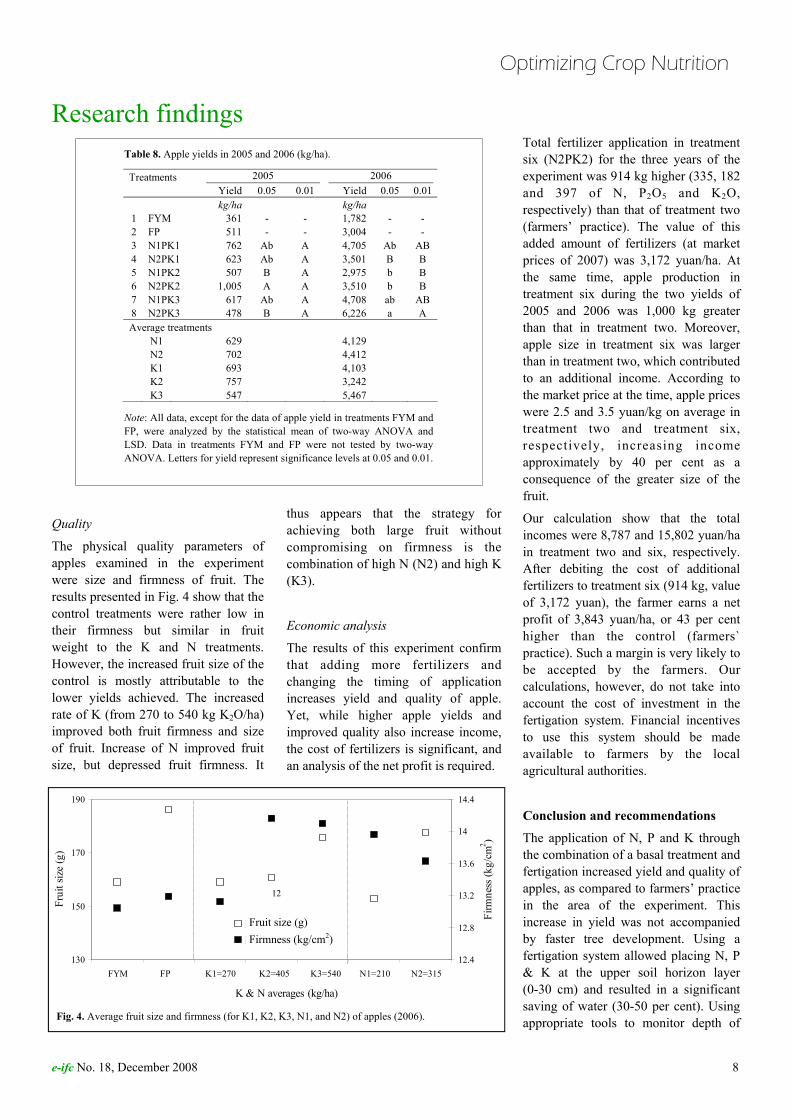
thus appears that the strategy for achieving both large fruit without compromising on firmness is the combination of high N (N2) and high K (K3).
Economic analysis
The results of this experiment confirm that adding more fertilizers and changing the timing of application increases yield and quality of apple. Yet, while higher apple yields and improved quality also increase income, the cost of fertilizers is significant, and an analysis of the net profit is required.
Total fertilizer application in treatment six (N2PK2) for the three years of the experiment was 914 kg higher (335, 182 and 397 of N, P2O5 and K2O, respectively) than that of treatment two (farmers’ practice). The value of this added amount of fertilizers (at market prices of 2007) was 3,172 yuan/ha. At the same time, apple production in treatment six during the two yields of 2005 and 2006 was 1,000 kg greater than that in treatment two. Moreover, apple size in treatment six was larger than in treatment two, which contributed to an additional income. According to the market price at the time, apple prices were 2.5 and 3.5 yuan/kg on average in treatment two and treatment six, respectively, increasing income approximately by 40 per cent as a consequence of the greater size of the fruit.
Our calculation show that the total incomes were 8,787 and 15,802 yuan/ha in treatment two and six, respectively. After debiting the cost of additional fertilizers to treatment six (914 kg, value of 3,172 yuan), the farmer earns a net profit of 3,843 yuan/ha, or 43 per cent higher than the control (farmers` practice). Such a margin is very likely to be accepted by the farmers. Our calculations, however, do not take into account the cost of investment in the fertigation system. Financial incentives to use this system should be made available to farmers by the local agricultural authorities.
Conclusion and recommendations
The application of N, P and K through the combination of a basal treatment and fertigation increased yield and quality of apples, as compared to farmers’ practice in the area of the experiment. This increase in yield was not accompanied by faster tree development. Using a fertigation system allowed placing N, P & K at the upper soil horizon layer (0-30 cm) and resulted in a significant saving of water (30-50 per cent). Using appropriate tools to monitor depth of
Research findings
Optimizing Crop Nutrition
Quality
The physical quality parameters of apples examined in the experiment were size and firmness of fruit. The results presented in Fig. 4 show that the control treatments were rather low in their firmness but similar in fruit weight to the K and N treatments. However, the increased fruit size of the control is mostly attributable to the lower yields achieved. The increased rate of K (from 270 to 540 kg K2O/ha) improved both fruit firmness and size of fruit. Increase of N improved fruit size, but depressed fruit firmness. It
Table 8. Apple yields in 2005 and 2006 (kg/ha).
Note: All data, except for the data of apple yield in treatments FYM and FP, were analyzed by the statistical mean of two-way ANOVA and LSD. Data in treatments FYM and FP were not tested by two-way ANOVA. Letters for yield represent significance levels at 0.05 and 0.01.
Treatments 2005 2006 Yield 0.05 0.01 Yield 0.05 0.01 kg/ha kg/ha
1 FYM 361 - - 1,782 - - 2 FP 511 - - 3,004 - - 3 N1PK1 762 Ab A 4,705 Ab AB 4 N2PK1 623 Ab A 3,501 B B 5 N1PK2 507 B A 2,975 b B 6 N2PK2 1,005 A A 3,510 b B 7 N1PK3 617 Ab A 4,708 ab AB 8 N2PK3 478 B A 6,226 a A Average treatments N1 629 4,129 N2 702 4,412 K1 693 4,103 K2 757 3,242 K3 547 5,467
Fig. 4. Average fruit size and firmness (for K1, K2, K3, N1, and N2) of apples (2006).
130
150
170
190
K & N averages (kg/ha)
Frui
t siz
e (g
)
12.4
12.8
13.2
13.6
14
14.4
Firm
ness
(kg/
cm2 )
Fruit size (g)Firmness (kg/cm2)
FYM FP K1=270 K2=405 K3=540 N1=210 N2=315
12
Fruit size (g) Firmness (kg/cm2)

e-ifc No. 18, December 2008 9
obtained with high rate of N and K. It is recommended that in orchards where there is a potential for achieving large fruit with high N levels, that appropriate and special care is to be given to K nutrition, in order to supplement the size with firm fruit.
These agronomical recommendations are followed by economic analysis showing that on an average, due to higher yield and quality, best treatments with fertigation (N2PK2) bring an additional 40 per cent in net income for the farmer.
References
Atkinson, D. 1980. The distribution and effectiveness of the roots of tree crops. Horticultural Review 2:424-490.
Bar-Yosef, B. 1999. Advances in fertigation. Advances in Agronomy 65:1-76.
Ebert, G. 2009. Fertilising for high yield and quality: Pome and stone fruits of the temperate zone. IPI Bulletin No. 19. International Potash Institute ( IPI) , Horgen , Switzer land. ISBN 978-3-9523243-6-3 (in press).
Haynes, R.J. 1985. Principles of fertilizer use for trickle irrigated crops. Fert. Res. 6:235-255.
Kafkafi, U., G. Xu, P. Imas, H. Magen, and J. Tarchitzky. 2001. Potassium and chloride in crops and soils: The role of potassium chloride fertilizer in crop nutrition. IPI Research Topic No. 22. 220 p. International Potash Institute (IPI), Horgen, Switzerland.
Lupin, M., H. Magen, and Z. Gambash. 1996. Preparation of solid fertilizer based solution fertilizers under grass root field conditions. Fertiliser News, The Fertilizer Association of India (FAI), 41:69-72.
Neilsen G.H., D. Neilsen, and F.J. Peryea. 1999. Response of soil and irrigated fruit trees to fertigation or broadcast applications of nitrogen, phosphorus and potassium.
Hort. Technology 9:393-401.
Neilsen, D., P. Millard, G.H. Neilsen, and E.J. Hogue. 1997. Sources of N used for leaf growth in a high density apple (Malus domestica) orchard irrigated with ammonium nitrate solution. Tree Physiology 17:733-739.
Neilsen, G.H., D. Neilsen, L.C. Herbert, and E.J. Hogue. 2004. Response of apple to fertigation of N and K under conditions susceptible to the development of K deficiency. Journal of the American Society for Horticultural Science 129:26-31.
Neilsen, D., and G.H. Neilsen. 2008. Fertigation of deciduous fruit trees: apple and sweet cherry. In: IPI proceedings: selected papers p r e s e n t e d a t t h e j o i n t I P I - N A T E S C - C A U - C A A S International Symposium on Fertigation, Beijing, China, 2005 (in press).
Pacific Agri-Food Research Centre, Summerland B.C. Canada.
Parchomchuk, P., G.H. Neilsen, and E.H. Hogue. 1993. Effects of drip fertigation of NH4-N and P on soil pH and cation leaching. Canadian Journal of Soil Science 73:157-164.
Scaife, A., and B. Bar-Yosef. 1995. Fertilizing for high yield and quality vegetables. IPI Bulletin No. 13, International Potash Institute (IPI), Horgen, Switzerland.
Veberič, R. D. Vodnik, and F. Štampar. 2005. Influence of foliar-applied phosphorus and potassium on photosynthesis and transpiration of ‘Golden Delicious’ apple leaves (Malus domestica Borkh.). Acta agriculturae Slovenica, 85-1, maj 2005 str. 143-155. ■
Research findings
Optimizing Crop Nutrition
wetted zone and level of nutrients in the soil profile is highly recommended.
Taking the yield, quality and leaf nutrient concentration of apple response to the different treatments into account, the appropriate rate of N applied for apple tree fertigation in this area of brown earth soil is 180-460g/tree/yr for three-to-six year-old trees respectively, and the rate should be increased gradually with tree growth over that period. The recommended ratio of N: P2O5:K2O is 1:0.75-1.0:1.5-1.8 on newly-cultivated soil.
Basal fertilization is recommended to be integrated with fertigation: 20-30 per cent of total N rate should be applied as basal fertilizer after harvest, 30 per cent of N through fertigation at early spring and rest in three-to-four fertigation applications before flower-bud differentiation (end of June). For potassium, 20-40 per cent of the total K2O should be applied as basal dressing in autumn, after harvest, as SOP, and the remainder as MOP in fertigation in six-to-eight applications during spring-summer. The number of MOP applications in fertigation may be reduced, but concentration applied should not exceed 0.4 kg MOP/m3 ( e q u i v a l e n t t o 2 4 0 p p m ) . Approximately 70 to 100 per cent of total P2O5 can be applied as base fertilizer. If P is fertigated, it should be split equally between spring and summer fertigation.
From samples obtained over the years o f t h e e x p e r i m e n t , l e a f K concentrations were found to correlate well with available soil K values. During 2006, when commercial yields were obtained, a high correlation was also obtained between leaf K concentration and yield. In mature trees, a K level of >0.8 per cent is recommended for maximum yield, however, the parameter of leaf K for diagnosis of adequacy of nutrition of young trees in the region should be studied in greater detail.
Maximum fruit size and firmness were


![Annual Report 2006 Annual Report 2006 [2.7 MB]](https://img.dokumen.tips/doc/110x75/586b796d1a28ab063d8c0594/annual-report-2006-annual-report-2006-27-mb.jpg)


![Descargar la publicación. Documento PDF [2.7 MB]](https://img.dokumen.tips/doc/110x75/586f4dbe1a28ab3c168bb518/descargar-la-publicacion-documento-pdf-27-mb.jpg)


