Embed Size (px)
Citation preview

Printed on recycled paper stock, using soy inks.
E N V I R O N M E N T D E P A R T M E N T P A P E R S
Susta inab le Deve lopment V ice Pres idency
Environment DepartmentT H E W O R L D B A N K
1818 H Street, NWWashington, D.C. 20433Telephone: 202-473-3641Facsimile: 202-477-0565
Paper number 120
Environmental Economics Series
Biodiversity, Ecosystem Services, and Climate Change
The Economic Problem
Charles Perrings
November 2010

Papers in this series are not formal publications of the World Bank. They are circulated to encourage thought and discussion. The use and citation of this paper should take this into account. The views expressed are those of the authors and should not be attributed to the World Bank. This book is available on-line from the Environment Department of the World Bank at: www.worldbank.org/environmentaleconomics
Biodiversity, Ecosystem Services, and Climate Change The Economic Problem
Charles Perrings
The World Bank environmenT deparTmenT
November 2010
© The International Bank for Reconstructionand Development/THE WORLD BANK1818 H Street, N.W.Washington, D.C. 20433, U.S.A.
Manufactured in the United States of AmericaFirst published November 2010
Design: Jim CantrellCover photos: © Hidajet Delic-Degi / The World Bank Photo Library. Bosnia and Herzegovina; farm and forest land.

iiiEnvironmental Economics Series
Contents
Executive Summary 1
Chapter 1 — Introduction 3
Chapter 2 — Biodiversity and Climate Change 5
Chapter 3 — Estimating the Value of Biodiversity-Related Changes in Ecosystem Services 11
Chapter 4 — Re-evaluating Biodiversity and Climate Change 15
Chapter 5 — Discussion and Conclusions 23
Appendix — Developments in the Economics of Biodiversity and Ecosystem Services 27
References 33
Figures 1 Impact of climate change on the invasibility of ecosystems 7 2 Quantile regression results for climate and the threatened status of birds, plants, reptiles and mammals
showing the impact of quantiles (horizontal axis) on the climate coefficient (vertical axis) 17 3 The relation between outbreaks of notifiable animal diseases and value at risk, 1996–2004 20
Table 1 Economic losses to introduced pests in crops, pastures, and forests in the United States, United Kingdom,
Australia, South Africa, India, and Brazil (billion dollars per year) 19


1Environmental Economics Series
Executive Summary
Climate change is both a cause and an effect of biodiversity change. Climate change is amongst the most important determinants of change in the distribution and abundance of
species in both managed ecosystems such as agriculture, production forests, cities and many coastal zones, and natural terrestrial and marine ecosystems. Climate change is also an effect of land uses that generate greenhouse gases (CO2, CH4, N2O) and of alteration in biological stocks of carbon in terrestrial and marine system (green and blue carbon).
Biodiversity change affects the flow of ecosystem services—the benefits that people get from ecosystems. These benefits include the Millennium Assessment’s provisioning services (production of foods, fuels, fibers, water, genetic resources), cultural services (recreation, spiritual and aesthetic satisfaction, scientific information), and regulating services (controlling variability in production, pests and pathogens, environmental hazards, and many key environmental processes).
Amongst the ecosystem services supported by biodiversity is climate regulation. One effect of the conversion of forests to agricultural production, for example, is an increase in carbon emissions from land clearance and a decrease in sequestered carbon. Both effects increase the rate of climate change. At the same time, our ability to adapt to climate change depends on the diversity of species within functional groups. If the species in a particular functional group (e.g., domesticated grains) include some that are suited to conditions expected to occur with climate change,
the cost of adaptation to climate change will be low. Biodiversity loss increases both the severity of climate change and our ability to adapt to it. Neither effect is signaled in current prices. Both are external to existing markets.
The economics of biodiversity-climate linkages deals with these externalities. There are two tasks. One is to identify the causal connections between biodiversity change, climate change and the production of ecosystem services. A second is to identify the marginal value of climate-related changes in biodiversity.
The role of living organisms in the production and sequestration of greenhouse gases is reasonably well understood. The consequences for climate of changes in the extent of tropical forests, or phytoplankton in the oceans are already incorporated in general circulation models. Ecologists also agree that climate change is already changing the world’s biota. It is affecting species distributions and abundance, the timing of reproduction in animals and plants, animal and bird migration patterns, and the frequency and severity of pest and disease outbreaks. Species are moving from lower to higher elevations, and from lower to higher latitudes. Species that are unable to move are at risk. At the same time, changes in the world’s biota from other causes are affecting the ability of ecosystems to adapt to climate change. The simplification of many ecosystems to make them more ‘useful’ to people reduces their flexibility. By eliminating species that are ‘redundant’ given current climatic conditions and current uses, we have reduced the capacity of many ecosystems to function if climatic conditions change.

Environment Department Papers2
Biodiversity, Ecosystem Services, and Climate Change — The Economic Problem
Although science has made progress in understanding and modeling the linkages between the structure of ecosystems, biodiversity and the production of ecosystem services, there are few studies of the two-way interactions between biodiversity and climate change. There are some studies of one-way linkages, and an increasing interest in the role of biodiversity in adaptation to climate change. Understanding and modeling the interactions between biodiversity and climate change is one of the fundamental scientific challenges of the next decade.
For similar reasons we do not have good estimates of the marginal value of climate-related biodiversity change. The current assessment, TEEB, has used existing studies to estimate the mean value of both the macroclimatic regulation offered by terrestrial carbon sequestration, and the change in provisioning and cultural services offered by forest systems. Although its findings are very preliminary, they are also instructive. TEEB suggests that the mean values of forest ecosystem services, in US$/ha/year, are dominated by regulatory functions: specifically regulation of climate ($1,965), water flows ($1,360), and soil erosion ($694). The mean value of other services combined—timber and non-timber forest products, food, water, genetic information, pharmaceuticals ($1,313) is less than the value of water flow regulation alone.
This indicates the existence of substantial off-site benefits to forest conservation that are not currently captured by forest landowners. We would expect these benefits to vary with the value at risk from climate change, flooding, water-pollution or soil loss. Since value at risk is closely linked to income, we would also expect priorities to differ between low-income and high-income countries. The evidence suggests that for many of the poorest countries, current priorities
are strongly focused on enhancing rural incomes, and that this comes at a cost to biodiversity. The most recent research on the linkages between threats to biodiversity and income finds that once climate, land area, population density (pressure) and the land area under protection is controlled for, there is a strong positive relation between income and species under threat amongst the poorest countries. This reflects the fact that the poorest countries are also strongly agrarian. In such countries, income growth depends both on the extensive growth of agriculture (the expansion of agricultural lands into more ‘marginal’ areas that are otherwise habitat for wild species) and on agricultural intensification (the progressive simplification of agroecosystems as pests, predators and competitors are ‘weeded out’ of the system).
The signing of the CBD’s ‘Nagoya Protocol on Access to Genetic Resources and the Fair and Equitable Sharing of Benefits Arising from their Utilization’ is an important step towards equity in the distribution of the benefits of genetic resources and traditional knowledge. It does not, however, address the broader benefits—the ecosystem services—supported by biodiversity. Where the ecosystem services at risk affect people in all countries, there are potential gains from trade in ecosystem services reflected in payments for ecosystem services such as the REDD and REDD plus schemes. However, in order to estimate the benefits to be had from such schemes it will be important to develop more robust, probabilistic models of the longer term consequences of biodiversity change than are currently available. It will also be important to develop the observation, monitoring and reporting systems that will enable us to keep track of changes in biodiversity and its impact on the aggregates recorded in the national income accounts.

3Environmental Economics Series
Climate change is both a cause and an effect of biodiversity change. Along with anthropogenic dispersion, climate change is the main driver of change in the geographical distribution of
both beneficial and harmful species—crops, livestock, harvested wild species, pests, predators and pathogens. And the capacity of ecosystems to adapt to climate change depends on the diversity of species they currently support. Climate change is also a consequence of the way which biological resources are converted into useful goods and services, and especially of the way in which grasslands and forests are converted into croplands. The production of biological resources for foods, fuels and fibers, and the conversion of forests and grasslands for agriculture both directly affect emissions of several greenhouse gases (GHGs). Changes in stocks of biomass also affect the volume of sequestered carbon. It follows that options for the mitigation of climate change include the management of both GHG emissions from productive processes and carbon sequestration, while options for adaptation to climate change center include the management of biodiversity for ecosystem resilience.
This paper considers the connection between climate, biodiversity and ecosystem services. The impact of climate change on human wellbeing is measured by the change in ecosystem services caused by climate-related change in biodiversity. Similarly, the role of species richness and abundance in climate change mitigation or adaptation is measured by the change in the climate-related services of biodiversity. The categories of ecosystem services are those applied in the Millennium Ecosystem Assessment (Millennium Ecosystem Assessment 2005a). The paper first considers how climate and biodiversity have been linked in recent attempts to link the two things. From the side of the natural sciences, this covers the consequences of climate change for various dimensions of biodiversity. From the side of the social sciences, it covers the value of biodiversity in the carbon cycle. It then uses insights from the economic treatment of the relation between biodiversity and ecosystem services to re-evaluate the connection between biodiversity and climate change, and to draw conclusions for climate policy.
Introduction1

5Environmental Economics Series
There is widespread recognition that climate change and biodiversity are linked. Most obviously, by changing the environmental conditions within which species exist, climate
change induces an adaptive response on the part of species. An extensive literature over the last two decades has described this effect on both species and ecosystems (Peters and Lovejoy 1994, Lovejoy and Hannah 2006, Willis and Bhagwat 2009). Much of this is summarized in the international biodiversity and climate assessments at various scales (Gitay and others 2002, Steffen and others 2010, Karl and others 2009, Millennium Ecosystem Assessment 2005a, Millennium Ecosystem Assessment 2005b).
The broad conclusions of this literature are that climate change is already inducing an adaptive response on the part of the world’s biota. It includes changes in species distributions and abundance, changes in the timing of reproduction in animals and plants, changes in animal and bird migration patterns, and changes in the frequency and severity of pest and disease outbreaks. Some of these effects are the direct result of changes in temperature, precipitation, sea level or storm surges. Others are the indirect effect of changes in, for example, the frequency of fire. In general, species are moving from lower to higher elevations, and from lower to higher latitudes, although the rapidity of the response varies very considerably. In any given ecosystem, changes in the frequency and intensity of disturbances determine the rate at which plant and animal assemblages will change.
From a conservation perspective, the critical feature of climate change is that it differentially affects the probability that species will be driven to extinction. It has been argued that the risk of extinction is likely to increase for many species that are already vulnerable (Thomas and others 2004), in part because of the time it takes for many species to adjust to climate change (Menéndez and others 2006). While the impact of climate change on extinction probabilities remains contentious (Willis and Bhagwat 2009), this is the effect that motivates the conservation community most strongly.
Outside the conservation community there is greater concern for the potential impacts of climate change on the species that most directly affect agriculture (the production of foods, fuels and fibers) and health (of humans, animals and plants). In agroecosystems, climate change is expected to have a number of direct effects. In the USA, although a number of crops are expected to respond positively to higher levels of carbon dioxide and moderate increases in mean temperature, so too will weeds, diseases and insect pests. More extreme increases in mean temperature and rainfall variability are both expected to reduce crop growth and yields. Forage quality in rangelands is expected to decline with increasing carbon dioxide concentration because of the effects it has on plant nitrogen and protein content, while livestock are generally expected to be adversely affected by increased temperature, disease, and weather extremes (Karl and others 2009).
2
Biodiversity and Climate Change

Environment Department Papers6
Biodiversity, Ecosystem Services, and Climate Change — The Economic Problem
In other parts of the world the effect of climate change on agriculture are expected to be more severe. A recent attempt to simulate the consequences of two scenarios of climate change using a model of global agriculture concluded that the net effects of climate change on agriculture would generally be negative, and would be strongly negative in many developing countries (Nelson and others 2009). The authors argue that in developing countries, climate change will induce yield declines for the most important crops especially in South Asia; that irrigated yields for all crops in South Asia will fall; that price increases for rice, wheat, maize, soybeans, and meat prices will reduce the growth in meat consumption slightly and cereals consumption significantly; and that calorie availability in 2050 will decline relative to 2000 levels in all developing countries. Since around half of all economically active people in developing countries are dependent on agriculture, and since 75 percent of the world’s poor live in rural areas, this suggests that the effects of climate change on agriculture are likely to have a disproportionate effect in developing countries.
The impacts of climate induced biodiversity change on human animal and plant health are of concern because of the potentially high cost associated with both emerging zoonotic diseases, and changes in the distribution of existing disease vectors. Changes in agricultural practices have been strongly implicated in the emergence of a number of zoonotic diseases (Daszak and others 2004, Daszak and others 2006). The IPCC’s fourth assessment report highlighted the impact of climate change on the distribution of a number of infectious disease vectors, and the seasonal distribution of some allergenic pollen species (Confalonieri and others 2007). For example, the climatic basis for changes in the distribution of the main dengue fever vector Stegomyia has been modeled, and turns out to map well into the observed disease distribution (Hopp and Foley 2003). Diseases that were previously limited to low latitudes have spread to higher latitudes. Insect-borne diseases such as trypanosomosis and anaplasmosis are now found in parts of the world where their
vectors have never been found in the past. Climate, in association with land use change, has been associated with global increases in morbidity and mortality from emergent parasitic diseases. Other diseases affected by climate change include leishmaniasis, cryptosporidiosis, giardiasis, schistosomiasis, lariasis, onchocerciasis, and loiasis (Patz and others 2000, Jones and others 2008).
Changes in the distribution of diseases and disease vectors are problematic because they involve a disassociation between the pathogen and its natural controllers. The disruption of the community of organisms that keeps a pathogen in check allows it to spread rapidly. For the same reason, climate change is expected to increase the frequency with which species across a wide range of taxa are able to spread outside their home range. A recent study of the implications of climate change for the potential invasibility of all terrestrial ecosystems concluded that a high proportion of existing ecosystems will become vulnerable to invasion by species from elsewhere under even moderate climate change scenarios. Using the Hadley HadCM3, B1 scenario, for example, (Thomas and Ohlemüller 2010) identified the areas of the world sharing a common climate but not sharing the same pest controllers (being more than 1,000 km distant) in 1945 and 2045. The results, indicated in Figure 1, imply that under climate change virtually all ecosystems will be vulnerable to invasion.
Among marine systems, coral reefs are thought to be particularly vulnerable to climate change. Temperature increases and ocean acidification are expected to compromise carbonate accretion putting corals increasingly at risk. They are also expected to exacerbate the effects of other anthropogenic stresses (from pollution and overexploitation) (Hoegh-Guldberg and others 2007). Nor are coral reefs the only marine ecosystems likely to be affected by climate change. Experimental work combined with climate linked models of ocean acidification suggests that significant changes in pterapod communities could occur in high latitudes within decades (Orr and others 2005).

7Environmental Economics Series
Biodiversity and Climate Change
To get a measure of the importance of these various physical impacts, economists have attempted to estimate the value of the resulting change in ecosystem services, using the classification of services suggested by the Millennium Ecosystem Assessment (Millennium Ecosystem Assessment 2005a). The MA distinguished four broad benefit streams: provisioning services, cultural services, supporting services and regulating services.
Provisioning services cover the products of renewable biotic resources including foods, fibers, fuels, water, biochemicals, medicines, pharmaceuticals, as well as the genetic material of interest to the CBD. The production, processing and consumption of these things all have consequences both for the net emission of greenhouse gases, and for the capacity of the system to accommodate the effects of climate change.
Cultural services comprise a range of largely non-consumptive uses of the environment including the spiritual, religious, aesthetic and inspirational wellbeing that people derive from the ‘natural’ world; the value to science of the opportunity to study and learn from that world; and the market benefits of recreation and tourism. While some of these activities—particularly recreation and tourism—have significant implications for GHG emissions, many have relatively little impact.
Supporting services comprise the main ecosystem processes that underpin all other services such as soil formation, photosynthesis, primary production, nutrient, and water cycling. The concern over climate change is primarily a concern over the atmospheric consequences of changes in the carbon cycle These services play out at very different spatial and temporal scales, extending from the local to the global, and over
Figure 1 Impact of climate change on the invasibility of ecosystems
Source: Adapted from Thomas and Ohlemüller 2010.
Most climates of this type occurred <1000 km away: RESISTANT
Climate within 1000km
Invasibility index 1945
Invasibility index 2045
Most climates of this type occurred >1000 km away: INVASIBLE
0.00 - 0.100.11 - 0.200.21 - 0.300.31 - 0.400.41 - 0.500.51 - 0.600.61 - 0.700.71 - 0.800.81 - 0.900.91 - 1.00

Environment Department Papers8
Biodiversity, Ecosystem Services, and Climate Change — The Economic Problem
time periods that range from seconds to hundreds of years.
Finally, the regulating services were defined by the MA to include air quality regulation, climate regulation, hydrological regulation, erosion regulation or soil stabilization, water purification and waste treatment, disease regulation, pest regulation and natural hazard regulation. More generally, they comprise the benefits of biodiversity in moderating the effects of environmental variation on the production of those things that people care about directly. They limit the effect of stresses and shocks to the system. As with the supporting services they operate at widely differing spatial and temporal scales. So, for example, the morphological variety of plants in an alpine meadow offers strictly local benefits in terms of reduced soil erosion, while the genetic diversity of crops in global agriculture offers a global benefit in terms of a lower spatial correlation of the risks posed by climate or disease. Both macro- and micro-climatic regulation are examples of the regulating services.
In principle, evaluation of the biological causes of climate change requires estimation of the multiple ways in which the production, processing and consumption of foods fuels and fibers are associated with climate drivers—emissions of GHGs. Combustion of fossil fuels is the dominant source of CO2, but agriculture is a major source of CH4 and N2O. In the USA, for example, agricultural activities were responsible for emissions of 427.5 Tg CO2 Eq. in 2008, or 6.1 percent of total U.S. greenhouse gas emissions. CH4 emissions from enteric fermentation and manure management accounted for one third of CH4 emissions from all anthropogenic activities. Fertilizer application accounted for around two thirds of N2O emissions. Biofuels—biodiesel, bioethanol, wood, charcoal—accounted for 4.4 per cent of CO2 production from energy. Partially offsetting these emissions, Net CO2 Flux from land use and land use change, including forestry, reduced net emissions by 13.5 percent (U.S. Environmental Protection Agency 2010).
In addition to these direct sources of CO2 flux from biofuels, agriculture and forestry, many of the activities that add value to foods, fuels and fibers are associated with fossil fuels based energy use, and consequently generate emissions as a by product. In the USA, again, the largest single source of CO2 emissions from fossil fuel combustion by end-use sector in 2008 was transport (1790 Tg CO2 Eq.), followed by industry (1511 Tg CO2 Eq), residential (1185 Tg CO2 Eq) and commercial activity (1045 Tg CO2 Eq) (U.S. Environmental Protection Agency 2010).
The research problem in all cases is to identify the production functions that connect changes in biodiversity to changes in ecosystem services and human wellbeing. The Millennium Assessment’s evaluation of biodiversity through the services it offers (Millennium Ecosystem Assessment 2005a) is the approach that economists have traditionally taken to the problem (Perrings and others 1992). In this approach, biodiversity change is evaluated in terms of its implications for: a) the production of foods, fuels, fibers, water, genetic material and chemical compounds; b) human, animal and plant health; c) recreation, renewal, aesthetic and spiritual satisfaction, and d) its role in buffering many ecological processes and functions against the effects of environmental variation. The approach recognizes that change in the diversity of species is a source of both benefits and costs. Many of the benefits that people derive from ecosystems—especially managed productive systems—require reductions in the abundance of pests, predators, pathogens and competitors. We wish to eliminate HIV AIDS and SARS, smallpox and rinderpest at the same time as we wish to save the panda, the bald eagle, the ring-tailed lemur or the giant redwood. The mix of species that maximizes delivery of one ecosystem service, seldom maximizes delivery of other services. There are trade-offs involved. In particular, the diversity of species that maximizes carbon sequestration can be much lower than the diversity of species that maximizes the flow of genetic information (Polasky and others 2005, Nelson and others 2008).

9Environmental Economics Series
Biodiversity and Climate Change
The way that economists have approached the problem of modeling the effect of biodiversity change on the production of ecosystem services is described in an appendix. In all cases the central challenge is to specify an appropriate set of production functions that link biodiversity—which one can think about as a set of biological assets—to the production of the things that
people care about. Including climate change as either cause or effect of biodiversity change means including either the biodiversity effects of climate change or the impact of biodiversity on climate change in the relevant set of production functions. While this may be hard to do, the approach itself is quite straightforward.


11Environmental Economics Series
The value of individual species in this approach derives from the value of the goods and services they produce. Similarly, the value of biodiversity—the composition of species—
derives from the complementarity and substitutability between species in the supply of ecosystem services over a range of environmental conditions. In other words, biodiversity has a portfolio effect on the risks attaching the supply of ecosystem services. The approach accordingly requires specification of production functions that embed the ecosystem processes and ecological functions that connect biodiversity and ecosystem services. This has posed significant challenges to both ecological and economic science. While the last two decades have seen real advances in understanding of biodiversity-ecological functioning-ecosystem services relationships, this is still very much work in progress. (Vitousek and Hooper 1993) speculative projection of the impact on ecological functioning of biodiversity loss has stimulated a whole new field of ecology, many of the results of which are reported in (Loreau and others 2002) and (Naeem and others 2009). This has led to a deeper understanding of the role of species in ecological functioning, and the relation between ecological functioning and the production of ecosystem services. Species are related through functional traits that make them more or less ‘redundant’ in executing particular ecological functions. Individual species are highly redundant (near perfect functional substitutes for other species) if they share a full set of traits with those other species, Conversely, they are ‘singular’ if they possess a unique set of traits (Naeem 1998). Species are also related through ecological interactions—trophic
relationships, competition, parasitism, facilitation and so on—that make them more or less complementary in executing ecological functions (Thebault and Loreau 2006).
Understanding the value of species that support particular ecological functions requires an understanding of both their substitutability and complementarity in the performance of those functions. It also requires an understanding of the way in which the simplification of ecosystems for agriculture, forestry, fisheries etc affects both the functions they perform and the interactions between functions. The simplification of agroecosystems to privilege particular crops or livestock strains necessarily affects the array of services that system delivers, partly because the number of functions performed increases with the number of species (Hector and Bagchi 2007), and partly because each species in a system typically performs multiple functions (Díaz and others 2009). Ecosystems are systems of ‘joint production’. Individual systems generate multiple services. It follows that part of the cost of simplification is the ecosystem services foregone as a result. Industrial agriculture has significantly increased yields per hectare, but has also significantly reduced a range of other ecosystem services including water supply, water quality, habitat provision, pollination, soil erosion control (Millennium Ecosystem Assessment 2005a).
Superimposing the commodity-specific production functions that relate output of marketed commodities to both marketed inputs and the underlying ecological processes adds another layer of complexity. Not
3
Estimating the Value of Biodiversity-Related Changes in Ecosystem Services

Environment Department Papers12
Biodiversity, Ecosystem Services, and Climate Change — The Economic Problem
surprisingly, the specification and estimation of ecological-economic production functions that capture both the jointness of the production of ecosystem services, the interactions between services, and the impact of changes in the relative abundance of species is still in its infancy.
Evaluation of the impacts of climate change on biological resources and biodiversity requires estimation of the consequential changes in the production of ecosystem services. This includes changes induced by alteration of environmental conditions reflected, for example, in the changing costs of agriculture, forestry and fisheries. It also includes changes in a set of non-marketed ecosystem services. The current assessment of the economics of ecosystems and biodiversity (TEEB) has addressed the problem of identifying the biodiversity-mediated impact of climate change by developing a database of valuation studies, and reporting the distribution of the estimated values associated with the ecosystem services affected by climate change. It is not the purpose of this paper to review this material. It is sufficient to note that the value estimates reported are marginal, instrumental, anthropocentric, individual-based and subjective, context and state-dependent (Goulder and Kennedy 1997, Heal and others 2005). Moreover, for the most part, ecosystem services are valued through their impact on the production of commodities or non-marketed effects that are directly valued by people (Barbier 1994, Barbier 2007, Barbier 2000, Mäler 1974), and the value of ecosystems as natural assets derives from the services they produce (Barbier 2008). The TEEB exercise is at an early stage, but for illustration has taken two systems—coral reefs and forests—to provide preliminary estimates of the value of climate-related ecosystem services.
In the case of coral reefs, for example, the consequences of climate change are measured by the benefits yielded by these systems in terms of fisheries, tourism, shoreline protection and cultural (aesthetic) value at risk from climate change (TEEB 2009). Its interim conclusions
on this system indicate that two types of benefit are dominant: one being tourism, recreation and amenity, the other being coastal protection. The mean marginal value of ecosystem services in US$/ha/year generated using this method was $86,524 for tourism, recreation and amenity, and $25,200 for moderation of storm events. By contrast, the mean marginal value of food production (fisheries) was only $470 (TEEB 2009). While this disparity is almost certainly an artifact of the approach adopted (it averages over studies rather than systems) it does illustrate an important feature of the value estimates attaching to all ecosystem services: that measures of people’s marginal willingness to pay to acquire an ecosystem service reflect both their preferences for that service relative to others, and their income level. Willingness to pay is as much a measure of ability to pay as it is a measure of preference. The people who depend on coral reefs for fisheries are not the same as the people who access coral reefs for pleasure. They come from different countries, they have fewer assets and they have lower income. An additional qualification noted by TEEB is that there may be discontinuities (threshold effects) in the impact of climate on systems like coral reefs. That is, small changes in temperature or acidity may induce the system to flip from one state to another (Hughes and others 2003). In the neighborhood of such thresholds, the marginal value of such changes may be substantial (TEEB 2009).
In the case of forests, TEEB (2009) includes a preliminary assessment of the value of a full set of ecosystem services deriving from tropical forests. Once again, the methodology involves identification of mean and maximum values of ecosystem services in US$/ha/year derived from a set of valuation studies. Although the results are preliminary, they are instructive. The 2007 value of tropical forests is dominated by regulatory functions: specifically regulation of climate ($1,965), water flows ($1,360), and soil erosion ($694). The mean value of other services combined—timber and non-timber forest products, food, water, genetic

13Environmental Economics Series
Estimating the Value of Biodiversity-Related Changes in Ecosystem Services
information, pharmaceuticals ($1,313) is less than the value of water flow regulation alone (TEEB 2009).
The dramatic difference between the estimates of the value of tropical forests and coral reefs is worrying, and signals the dangers inherent in the estimation method applied. But what is interesting about the TEEB estimates for tropical forests is the dominance of regulatory services. These are services that confer benefits on people at a range of different spatial scales, but almost always at scales that extend beyond the forest itself. While the regulation of soil erosion and water supply would be expected to benefit people within the same river basin, carbon sequestration benefits people everywhere. Just as is the case of coral reefs, the low relative value of the provisioning and cultural services associated with tropical forests also reflects differences in the income and endowments of people living inside and outside the forest. TEEB makes the point that some 90 percent of people defined to be in poverty by reference to one or other of the commonly used head count measures depend on tropical forests for their livelihood.
Progress on understanding the role of biodiversity in securing the regulating services has been less certain than in the case of the provisioning and cultural services. One reason for this may be that the MA interpreted the regulating services in a rather restrictive way. Perrings and others (1992) had reported the argument that biodiversity had a role to play in maintaining the stability and resilience of ecosystems, and hence that part of the value of biodiversity lay in its role in enabling the system to maintain functionality over a range of environmental conditions. In the MA (2005), this dimension of the value of biodiversity was reflected in the identification of a set of buffering services that included, e.g., storm buffering, erosion control, flood control and so on, and the generic link between biodiversity and variability in the supply of directly valued goods and services was lost. The value of biodiversity, in this respect, is the value of a portfolio of biological assets in managing the supply risks attaching
to the provisioning and cultural services. It stems from peoples’ aversion to risks—i.e., is higher the more risk averse people are.
Within the ecological literature, the problem has been approached through the stability of ecological processes (Griffin and others 2009). However, the issues are far from settled. There is consensus that species richness enhances the mean magnitude of many ecosystem services (Hooper and others 2005, Balvanera and others 2006, Cardinale and others 2006), but the effect of species richness on the stability of those services is contested (Hooper and others 2005). Two mechanisms have been proposed. One is statistical averaging (Doak and others 1998), which depends on the fact that the sum of many randomly and independently variable phenomena is less variable than the average. The strength of this effect depends on how the variances of populations scale with their means (Tilman and others 1998). The second is the ‘insurance hypothesis’, by which interspecific niche differentiation causes species to respond differently to environmental fluctuations (Mcnaughton 1977, Naeem and Li 1997). The insurance hypothesis requires functional redundancy by which loss of individual species within a functional group can occur without affecting performance of the function (Lavorel and Garnier 2002).
The general point here is that wherever species or ecosystems (habitat) are identified in the functions that describe productive activity, it is possible to identify their marginal impact on output of valued goods and services. While there is still a long way to go before we have unified models of the biodiversity-ecological functioning relationships used by ecologists and the extended bioeconomic models used by economists, the steps that have been taken during the last decade seem to be in the right direction.
There are two implications for the valuation of biodiversity change. First, the marginal value of an incremental change in the abundance of any species other than those that are directly exploited is a derived

Environment Department Papers14
Biodiversity, Ecosystem Services, and Climate Change — The Economic Problem
value. Second, derivation of that value requires specification of the production functions that connect indirectly exploited species to directly valued goods or services. Whether one uses market prices, revealed or stated preference methods to obtain an estimate of willingness to pay for the directly valued goods or services is more or less irrelevant. The important point is that a production function is then needed to estimate
the value of a marginal change in the biodiversity that supports the directly valued good or service. For example, (Allen and Loomis 2006) use estimates of willingness-to-pay for the conservation of higher trophic-level species, obtained using stated preference methods, to derive estimates of implicit willingness-to-pay for the conservation of species lower down the food chain.

15Environmental Economics Series
To estimate the value of climate-related biodiversity change, we need to understand (a) the impact of land use change on climate and the other structural characteristics of the
system that affect biodiversity, (b) the effect this has on the functional diversity of species, and (c) the consequences of change in the functional diversity of species for the ecosystem services that people care directly about—such as the supply of foods, fuels and fibers, pharmaceuticals, scientific information, genetic resources, recreation, tourism, amenity and spiritual satisfaction. The greater the diversity of species within functional groups, the greater will be the capacity of the system to continue to produce valuable services under climate change.
One challenge in estimating the value of climate-related biodiversity change, is that we do not have general models of interactions between the biosphere, the hydrosphere and the atmosphere, and the social system. The models developed by environmental economists (described in the appendix) all focus on individual components of the general system, and include only a limited set of feedbacks. The models used to estimate the economic impacts of climate change are similarly highly simplified, but they do attempt to capture at least some of the biodiversity-mediated costs of climate change. (Mendelsohn and others 1998) estimated impacts for agriculture, forestry, energy, water and coastal zones. (Tol 2002) extended this to include impacts on other ecosystems, as well as mortality from vector-borne disease, and (Nordhaus and Boyer 2000) added, in addition, impacts of pollution and effects on recreation.
Estimates of the long-term global damage cost associated with climate change vary significantly, lying anywhere between zero to 11 percent of global GDP. The damage estimates derive from the IPCC’s integrated assessment models, which are unable to incorporate activity changes induced by feedbacks within the socio-economic system. Stern argued that all models omitted potentially important impacts, and that taking these into account would likely increase cost estimates substantially. In particular, he estimated that inclusion of non-market impacts on the environment and human health would increase the total cost of business as usual climate change from 5 percent to 11 percent of GDP, excluding ‘socially contingent’ impacts such as social and political instability (Stern 2006).
The Fourth Assessment Report of the IPCC reported significant improvements in the capacity to predict changes in land cover and species richness associated with climate change, appealing to results from climate envelope modeling (niche-based, or bioclimatic modeling) and dynamic global vegetation modeling (Parry and others 2007). However, the same limitations on the capacity to model interactions between the social and biogeophysical system apply. It is not yet possible to use the integrated assessment modeling approaches of the IPCC to project, with confidence, the magnitude of the global effects of biodiversity change as it impacts climate change, or of the effects of climate change on biodiversity. Current models of the global economic impacts of climate change are useful in identifying areas where impacts may be significant, but we are not able to use them to estimate the value of climate-related biodiversity change. We are in a better position to
4
Re-evaluating Biodiversity and Climate Change

Environment Department Papers16
Biodiversity, Ecosystem Services, and Climate Change — The Economic Problem
undertake partial equilibrium analyses of the long run consequences of climate change in particular sectors or biomes (TEEB 2009), but even here value estimates are highly uncertain.
A second implication of the ecosystem services approach is that the extent to which the biodiversity effects of land use or climate are taken into account depends on the value at risk—the expected marginal cost of changes in biodiversity. If the value at risk from a reduction in functional diversity is low, decision-makers will have little incentive to avoid it. It may well be that the value at risk from the perspective of local communities is different from the value at risk from the perspective of more distant communities—that there are spatial externalities. But the general point still holds. The costs of biodiversity change determine the weight given to it in the decision process. This fact is at the core of the interaction between climate change, biodiversity and poverty.
Since the Brundtland Report (World Commission on Environment and Development 1987) argued that there existed a causal connection between environmental change and a large literature has examined the empirical relation between per capita income (GDP or GNI) and a range of indicators of environmental change (Stern 1998, Stern 2004, Stern and Common 2001) for reviews of the literature and the econometric methods it employs). An inverted ‘U’ shaped relation between per capita income and various measures of environmental quality was found using both cross-sectional and panel data (Cole and others 1997, Stern and Common 2001).
The implication of this is that economic growth in poor countries is associated with the worsening of the environmental conditions measured by those indicators. The relation does not, however, hold for all environmental indicators. For some indicators it is monotonically increasing in income (e.g., carbon dioxide or municipal waste). For others it is monotonically decreasing (e.g., fecal coliform in
drinking water). For others still it has been found to have more than one turning point. Moreover, even where the best fit is given by a quadratic function—the inverted ‘U’—there are wide differences in estimates of the value of per capita income at which further growth is associated with an improvement in the indicator. The evidence is sufficiently ambiguous that few general conclusions can be drawn, but Markandya (2000, 2001) argued that even if poverty alleviation might not enhance environmental quality, and may in fact increase stress on the environment, environmental protection would frequently benefit the poor.
The relation between threats to biodiversity and income growth in this literature has generally been approached through deforestation, and has found little evidence for an inverted ‘U’ shaped relation between income and that variable (Dietz and Adger 2003, Majumdar and others 2006, Mills and Waite 2009). In order to test the relation between income and the threat to biodiversity without relying on forest area as a proxy, Perrings and Halkos (2010) modeled the relation between Gross National Income (GNI) per capita per capita and threats to each of four taxonomic groups—mammals, birds, plants and reptiles—while controlling for the effects of climate, population density, land area and protected area status. Using the number of species in each taxonomic group under threat (according to the 2004 IUCN Red List) as the response variable, they modeled the impact of GNI per capita in a sample of 73 countries. Controls included climate, total and protected land area, and (human) population density. Climate was measured by a dummy variable indicating whether a country fell wholly or partly in the Koppen-Geiger equatorial climates. Land area controlled for the effect of country size, and the percentage of land area under protection controlled for the availability of refugia. Population stress was proxied by population density.
They found that once climate, land area, population density (pressure) and the land area under protection, the relation between income and species under threat

17Environmental Economics Series
Re-evaluating Biodiversity and Climate Change
turns out to be strongly quadratic for all terrestrial species. The turning points are different for different taxonomic groups but all models provided a good fit to the data, and satisfied a range of diagnostic tests. The sensitivity of the climate effect to the degree of threat was then evaluated by estimating a set of quantile regression models, the results of which are shown in Figure 2 which reports both quantile (shaded areas) and OLS estimates (lines) with 95 percent confidence intervals for the effect of climate on all taxonomic groups. For three of the four taxonomic groups—mammals, birds and reptiles—the quantile regression models are consistent with the OLS models. However, for plants, it is clear that the impact of climate on the threatened status of species is sensitive to the level of threat. The effect of climate on the threatened status of species is greater, the greater the level of threat (Perrings and Halkos 2010).
The general implication of their result is that in the poorest countries, income growth is strongly correlated with increasing levels of threat to biodiversity. This reflects the fact that the poorest countries are also strongly agrarian. In such countries, income growth depends both on the extensive growth of agriculture (the expansion of agricultural lands into more ‘marginal’ areas that are otherwise habitat for wild species) and on agricultural intensification (the progressive simplification of the agroecosystem as pests, predators and competitors are ‘weeded out’ of the system). While there is the potential to design agroecosystems in ways that reduce the biodiversity/agricultural output trade-off (Jackson and others 2007, Brussaard and others 2010, Jackson and others 2010), the empirical evidence is that in low-income countries increasing agricultural output has the highest priority, and that consequential impacts on wild species is regarded as a reasonable cost of that activity.
(continued)
Figure 2 Quantile regression results for climate and the threatened status of birds, plants, reptiles and mammals showing the impact of quantiles (horizontal axis) on the climate coefficient (vertical axis)
Birds Plants

Environment Department Papers18
Biodiversity, Ecosystem Services, and Climate Change — The Economic Problem
Source: Perrings and Halkos (2010).
Figure 2 Quantile regression results for climate and the threatened status of birds, plants, reptiles and mammals showing the impact of quantiles (horizontal axis) on the climate coefficient (vertical axis) (continued)
rePtiles MaMMals
In terms of the models of biodiversity described in the appendix (Brock and Xepapadeas 2002, Brock and others 2010), these two trends imply the homogenization of the system, a reduction in niche differentiation, and hence a reduction in species richness. The existence of a turning point indicates that at some level of per capita incomes and at some level of biodiversity threat the marginal value of land committed to biodiversity conservation dominates the marginal value of land committed to agriculture, inducing a change in the allocation of land resources to allow greater niche differentiation. One dimension of this is the establishment of reserve areas characterized by high levels of heterogeneity (whether in a few large heterogeneous areas or a number of smaller areas distributed across an ecological gradient). A second dimension is the establishment of separate niches within existing agroecosystems (through, for example, the promotion of riparian corridors).
The evidence on the biosecurity dimensions of the problem is similarly different in developed and developing countries. If we take trade-related pest
and pathogen risks, the fact that developed countries have higher levels of imports means that they are more exposed to the risk of introductions. At the same time, the likelihood that introduced species will establish and spread depends on the public health, sanitary and phytosanitary efforts undertaken by a country. Since public health, sanitary and phytosanitary effort will increase up to the point at which the marginal benefit (damage avoided) is equal to the marginal cost of that effort, we would expect greater levels of effort in countries where the value at risk is higher. So while developed countries are more exposed, they also invest more in public health, sanitary and phytosanitary measures.
The result of this is that developing countries are generally more exposed to damaging pests and pathogens. For example, Pimentel’s (2001) estimates of the damage costs associated with introduced plant pests in a selection of developed and less developed countries in the 1990s are reproduced in Table 1. Invasive species caused estimated damage costs equal to 53 percent of agricultural GDP in the USA, 31 percent in the UK

19Environmental Economics Series
Re-evaluating Biodiversity and Climate Change
Notes: a. Pasture losses included in crop losses.b. Losses due to English starlings and English sparrows (Pimentel and others 2000).c. Calculated damage losses from the European rabbit.d. Emmerson and McCulloch (1994).
Source: Pimentel and others (2001).
Table 1 Economic losses to introduced pests in crops, pastures, and forests in the United States, United Kingdom, Australia, South Africa, India, and Brazil (billion dollars per year)
Introduced pest United States United Kingdom Australia South Africa India Brazil Total
Weeds
Crops 27.9 1.4 1.8 1.5 37.8 17.0a 87.4
Pastures 6.0 – 0.6 – 0.92 – 7.52
Vertebrates
Crops 1.0b 1.2c 0.2d – – – 2.4
Arthropods
Crops 15.9 0.96 0.94 1.0 16.8 8.5 44.1
Forests 2.1 – – – – – 2.1
Plant pathogens
Crops 23.5 2.0 2.7 1.8 35.5 17.1 82.6
Forests 2.1 – – – – – 2.1
Total 78.5 5.56 6.24 4.3 91.02 42.6 228.72
and 48 percent in Australia. By contrast damage costs in South Africa, India and Brazil were estimated to be, respectively, 96 percent, 78 percent and 112 percent of agricultural GDP. The different exposure is particularly easy to see in the case of animal diseases, as is the difference in response.
Until recently the World Animal Health Organization (Office Internationale Epizootic – OIE) categorized the species reported to it according to both their rate of spread and potential damage. One category, List A species, comprised transmissible diseases with the potential for very serious and rapid spread, significant damage costs and potentially major negative effects on public health. A second category, List B species, comprised transmissible diseases with slightly less significant damage costs. Analysis of the relation between the number of outbreaks within each category of disease and the value at risk indicates that whereas outbreaks of most diseases (i.e., List B diseases)
increased with the volume of imports, outbreaks of List A diseases decreased (Perrings and others 2010b)(also see Figure 3). The implication is that for these classes of pests countries in which the value at risk is high implement sufficiently stringent sanitary measures to offset the pest risk associated with high levels of imports.
Since the general perception (reported above) is that poor countries are more dependent on biodiversity, and therefore more heavily impacted by climate induced biodiversity change, these results raise important questions. The general perception is reflected in recent estimates of inclusive wealth (wealth inclusive of natural assets—including environmental assets not subject to well defined property rights) (World Bank 2006).
By the World Bank wealth estimates, low-income countries are significantly more dependent on natural capital than middle- and high-income countries. More

Environment Department Papers20
Biodiversity, Ecosystem Services, and Climate Change — The Economic Problem
Figure 3 The relation between outbreaks of notifiable animal diseases and value at risk, 1996–2004
List B disease outbreaks and value at risk, 1994−2004
List A diseases and value at risk, 1994−2004
List
B d
isea
ses
noti�
ed to
the
OIE
List
A d
isea
se o
utbr
eaks
not
i�ed
to th
e O
IE
Per capita agricultural GDP
Per capita agricultural GDP
Source: Data sourced from the OIE and COMTRADE data bases.

21Environmental Economics Series
Re-evaluating Biodiversity and Climate Change
particularly, natural capital is estimated to account for 26 percent of per capita wealth in low-income countries, but only 2 percent in high-income countries (World Bank 2006). This reflects the relative share of agriculture, forestry and minerals in GDP, and the fact that assets designed to add value to natural resources are excluded. It also reflects the greater share of the labor force employed in these sectors in low-income countries. Yet the value at risk from declining functional diversity in agriculture reflects the value added in industries based on processing of biological resources. Similarly the value at risk from invasive pests and pathogens reflects both the value added in affected sectors and the incomes of people whose health and livelihood is under threat.
In fact, the key climate-related ecosystem services supported by biodiversity are all regulating services, whose importance depends in part on the value at risk and in part on the factors threatening that value. They include:
Macroclimatic regulation (through carbon seques-•tration and the management of albedo effects)Microclimatic regulation (through local canopy •effects)Hydrological regulation (mitigation of the •hydrological impacts of climate change through watershed protection)Soil regulation (mitigation of the consequences •of climate change for erosion through vegetation cover)Maintenance of adaptive capacity (through in •situ conservation of the diversity of functional groups—including land races and wild relatives).
All these services are also jointly produced with provisioning, cultural or supporting services. In fact, it is a characteristic feature of ecosystems, that the biodiversity each supports offers an array of benefits at quite different spatial and temporal scales. (Perrings and Gadgil 2003) referred to the ‘layered’ public goods supported by the biodiversity in any one location,
arguing that conservation yields a range of benefits in addition to the protection of the global gene pool. In particular, it supports ecosystem services that are local public goods. These are less sensitive to species richness or endemism, and more closely connected to the productivity and resilience of managed, productive ecosystems. They argued that any conservation strategy ignoring the local public good potentially compromises the capacity of local systems to support the people who are most directly dependent on them. So, for example, biodiversity conservation in agricultural systems implies protection of enough inter-specific and intra-specific diversity to underwrite the productivity of the system. This involves a number of often quite localized services: the operation of the hydrological cycle including flood control and water supply, waste assimilation, recycling of nutrients, conservation and regeneration of soils, pollination of crops and so on. It follows that financial incentives to local landholders should reflect both the global and the local public goods secured through biodiversity conservation.
The best current indicator of our collective willingness-to-pay for environmental public goods are the systems of payments for ecosystem services (PES) being devised to support a range of ecosystem services (Arriagada 2008, Arriagada and Perrings 2009, Engel and others 2008, Ferraro and Kiss 2007, Ferraro and Simpson 2002, Pagiola 2008, Swart 2003, Wunder 2007, Wunder and others 2008). PES schemes are intended to induce landowners to incorporate the marginal value of changes in ecosystem services into their financial decisions (Rojas and Aylward 2003). In parts of the world they already have a long history. In Europe, for example, the Common Agricultural Policy (CAP) began operating in 1962, and agro-environment schemes have been supported under that policy since they were introduced in the CAP reforms of 1992. These schemes encourage farmers to conserve agricultural soil, improve water quality, manage fisheries, and protect wilderness on private lands (European Commission Directorate-General for Agriculture and Rural Development 2007).
Environment Department Papers22
Biodiversity, Ecosystem Services, and Climate Change — The Economic Problem
Hundreds of PES schemes are currently being implemented covering four main ecosystem services: watershed protection, carbon sequestration, landscape amenity, and biodiversity conservation. Many current PES schemes are local level arrangements and derive from the spontaneous emergence of private markets. Such schemes tend to be modest in scale, and to be focused on nature-based tourism and the protection of small watersheds. Larger PES schemes tend to be government driven, working at the state and provincial level (e.g., in Australia, Brazil, China, and USA), or at national level (e.g., Colombia, Costa Rica, China, and Mexico) (Arriagada and Perrings 2009). In Costa Rica, for example, the Program of Payments for Environmental Services (PSA) is the oldest program of payments for ecosystem services in the tropics. It is designed conserve forests in order to assure a range of ecosystem services, and has had a statistically significant and positive effect on the establishment of new forest (i.e., positive effect on forest gain and net deforestation) (Arriagada 2008). It has also positive effect in areas not currently protected by the program (i.e., positive spillover effects) that have increased both carbon sequestration and soil stabilization.
Because ecosystem services tend to be jointly produced, PES schemes that are service-specific—i.e., that offer incentives to produce one of a number of non-marketed ecosystem services—are likely to be inefficient. Since financial flows for greenhouse gas emission reductions from REDD could reach up to US$30 billion a year the scheme has the potential to achieve meaningful reductions in carbon emissions/enhancement of carbon sequestration whilst also generating ancillary services and maintaining the resilience of local systems to climate shocks. While the scheme is being piloted in nine countries—Democratic Republic of Congo,
Tanzania, Zambia, Indonesia, Papua New Guinea, Viet Nam, Bolivia, Panama and Paraguay—it is expected to be rolled out to all developing countries.
In the initial phases of the scheme, however, the lack of conditionality in payments makes it unlikely that it will be efficient. This is exacerbated by the fact that REDD is likely to include official development assistance that will be independent of carbon emissions or sequestration (Dutschke and Angelsen 2008, Blom and others 2010). The intention, however, is to move in phases towards a state where payments are conditional on observed performance (Angelsen and others 2009). Since climate related ecosystem services do span a number of public goods at several scales, efficiency of the program will rest on its capacity to accommodate more than just carbon emissions. It will, in particular, need to be able to address the institutional issues that lie behind the market failure it sets out to address—especially the problem of property rights and the governance of common pool resources (Miles and Kapos 2008, Phelps and others 2010).
In the case of the REDD scheme, the original focus on carbon sequestration was problematic for exactly this reason. The expansion of the scheme to include a range of other services—REDD plus—may reduce the risk that it will be inefficient, but in the absence of mechanisms to convert REDD payments to a range of service-specific incentives to land-users, this is not at all certain. In other cases there are attempts to ‘bundle’ various services together for sale, or to combine payments from multiple buyers. In the forest sector, for example, governments have initiated PES schemes that simultaneously protect biodiversity or landscape beauty, watershed protection and carbon sequestration (Wunder and others 2008, Engel and others 2008).
23Environmental Economics Series
The point was made in the introduction to this paper that climate change is both a cause and an effect of biodiversity change. It is one of the main drivers of change in the distribution
of both beneficial and harmful species. It is also a consequence of the way that people use biological resources, and structure ecosystems. The production and use of biological resources for foods, fuels and fibers and the way in which the landscape is structured have direct impacts on carbon sources and sinks and, at the same time, indirect impacts on the capacity of ecosystems to adapt to changes in climate. We do not yet have good measures of the value of biodiversity as either a cause or an effect of climate change. The Stern Review conjectured that the effects of climate change on human health and ecosystems (other than agriculture, forest and coastal systems) may be as much as 6 percent of global GDP, raising the long-run annual cost to 11 percent of GDP. At the same time the IPCC estimates that halting the reduction in carbon sequestration in forests (green carbon), mangroves, marshes, sea grasses and macroalgae (blue carbon) could reduce net-emissions by 25 percent (Metz and others 2007), yielding a benefit in terms of averted losses of nearly 3 percent of global GDP by the Stern estimates. The point here is that however the economic losses of climate change are calculated, a very substantial part of those losses are biodiversity related.
The point has also been made that biodiversity is much more than the macro fauna and macro flora that attract the attention of the conservation community. Every ecosystem service depends on some combination of species. The number and diversity of species associated
with particular services varies widely, but in almost all cases greater species diversity means that the supply of ecosystem services may be maintained over a wider range of conditions. Hence, the value of functional diversity under climate change is the capacity it gives to adapt successfully. This is well understood in sectors based on provisioning services, like agriculture, horticulture, aquaculture and forestry, and is what motivates the establishment of both ex situ germ plasm collections and in situ conservation of wild relatives, landraces, and traditional breeds. It is much less well understood in other sectors. Yet reducing the diversity of the functional groups that underpin particular ecosystem services necessarily reduces the capacity to supply those services over a range of environmental conditions.
Since climate change is expected to increase the variance in temperature and precipitation to the point where environmental conditions that are now extremely rare become commonplace, keeping the crop genetic diversity, the pest predators, the pathogen controllers, and the watershed protectors in place provides insurance in conditions when commercial cover may fail. As agriculture becomes increasingly homogenized, for example, so the spatial correlation of agricultural risks increases, while the capacity to pool those risks reduces. The capacity to adapt to climate change is, however, critical to the costs it may be expected to impose. The biggest difference between the damage estimates deriving from the Mendelsohn, Tol and Nordhaus models, for example, stems from Mendelsohn and others’ assumption that adaptation would compensate for almost all damage costs,
5
Discussion and Conclusions

Environment Department Papers24
Biodiversity, Ecosystem Services, and Climate Change — The Economic Problem
implying a value of up to 5 percent of global GDP. As Stern points out, however, this ignores difficulties that other ecosystems have in transitioning between states. The rapidity with which farmers are able to substitute crops in field is unlikely to be matched in the adaptive responses of most taxa. Indeed, the expectation that climate change will lead to an increase in extinction rates is driven almost entirely by estimates of the rate of adaptive response. Nevertheless, Pearce’s estimates of damage costs per ton of carbon with and without adaptation (based on Mendelsohn) indicated that costs could be reduced by a factor of up to ten at a 3 percent discount rate, and could be completely reversed at a 5 percent discount rate (Pearce 2003). The potential benefits of maintaining the biological capacity to adapt to climate change are substantial.
Two other conclusions are important to highlight, both relating to the treatment of the feedback effects of land use change mediated through the general circulation system. One concerns the effect of income differences on the treatment of feedbacks (often cast as an equity issue). The other concerns the role of incentives and market creation (an efficiency issue). Both the climate and ecosystem assessments have emphasized that current trends are likely to impact people in poor countries more than people in rich countries (Pachauri and Reisinger 2007, Millennium Ecosystem Assessment 2005a). This is partly because of the regional distribution of changes in temperature and precipitation, but is more directly because people in poor countries have fewer resources to support adaptation.
The link between poverty, biodiversity and climate change identified in this paper is slightly different. It is that decision-makers may be expected to invest in current biodiversity conservation up to the point where the discounted value of future damage avoided offsets the additional cost it involves. It therefore reflects the value at risk. If the value at risk is low, then investment in biodiversity conservation will also be low. There are many reasons why value at risk may be lower in some
countries than others, including differences in discount rates and differences in the share of the benefits of conservation that can be captured within the country. But income differences are one important determinant of this. Other things being equal, poor countries may be expected to commit fewer resources to biodiversity conservation than rich countries just because the value of the damage (the loss of income) avoided is lower. The signing of the CBD’s ‘Nagoya Protocol on Access to Genetic Resources and the Fair and Equitable Sharing of Benefits Arising from their Utilization’ may be an important step towards equity in the distribution of the benefits of genetic resources and traditional knowledge. It does not, however, address the broader benefits—the ecosystem services—supported by biodiversity.
Leaving aside the equity implications of a distribution of income that generates this as an outcome, if the benefits of biodiversity conservation accrue to people elsewhere, it offers at least the potential for gains from trade in ecosystem services. Efficiency may then be improved by creating markets for the distributed benefits of local conservation. Of the many options currently being considered, the REDD scheme may be best fitted to address the interdependence of biodiversity and climate change. However, it is critically important that the creation of markets to serve climate change mitigation and adaptation does not neglect the range of ecosystem services that are co-produced with carbon sequestration. Focusing payments for ecosystem services on carbon sequestration to the exclusion of other ecosystem services would likely result in externalities no less damaging than those they are set up to address.
The interactions between climate and biodiversity change pose significant challenges for science. Our capacity to model the feedbacks between biodiversity, the structure of ecosystems and the production of ecosystem services is quite limited. This is partly a problem of scale, and partly a problem of process. Feedbacks operating through the general circulation system operate at very different spatial and temporal

25Environmental Economics Series
Discussion and Conclusions
scales than feedbacks operating through the structure and function of specific ecosystems. They are also less relevant to individual decision-makers, even though in aggregate they drive the global process. In the absence of a price mechanism, individual decision-makers have little direct incentive to take the effects of their actions into account. But feedbacks operating through the general circulation system still generate some signals—through collective environmental governance mechanisms, multilateral environmental agreements and the like—and these do affect private behavior.
Modeling the problem requires specification of the social process just as it does specification of the biophysical interactions. Moreover, the data required to fit the models include not just observations on the atmosphere and biosphere (earth observations), but also observations on the social system and what may be termed the social precursors of environmental change. Understanding and predicting anthropogenic environmental change depends on the capacity to observe the phenomena that drive future changes in land use, ecosystem management and species dispersal. These include the relative prices that determine private resource allocation decisions, the evolution of the regulatory framework, the social norms that direct individuals towards or away from particular choices, and the technological developments that open up new options. All have the capacity to generate field effects that it is important to understand.
There are also important implications for the monitoring systems that need to be put in place, requiring extension of current efforts to generate interoperable earth observation systems to include observations on the social dimensions of the system.
Since the observations need to be able to record changes not only in the physical measures of system performance but also in their importance for people, they need to include observations on value. Efforts to extend the system of national accounts to record changes in the value of ecosystems and their components (Lange 2007, Matete and Hassan 2006, Ferreira and others 2008, Perrings and Vincent 2003) should accordingly be encouraged.
Finally, it is worth underlining the fact that the climate and adaptive capacity externalities of biodiversity change are a very significant part of the climate change problem. Despite the growing attention to adaptation, this has not been fully appreciated. Although it may not currently be possible to put a reliable value on the impact of functional diversity for the adaptive capacity of the system, it is certainly large—several percentage points of global GDP. Maintenance of the functional diversity of pest and pathogen controllers is as important here as maintenance of the functional diversity of organisms supporting both the provisioning services and the more fundamental ecosystem processes that underpin life support. This warrants a significantly enhanced effort across sectors, both to estimate the future consequences of current activities that threaten both sequestration and adaptive capacity and to identify instruments to address the problem. Since a number of the interactions that most affect human wellbeing involve transboundary flows, this is an argument both for supporting the proposed Intergovernmental Science-Policy Platform for Biodiversity and Ecosystem Services (IPBES), and for ensuring that the data it gathers include observations on changes not just in biodiversity and ecosystems, but also in the social precursors of environmental change.


27Environmental Economics Series
Appendix — Developments in the Economics of Biodiversity and Ecosystem Services
The canonical bioeconomic models developed by Clark to understand the exploitation of marine mammals and fisheries (Clark 1979) clarified the conditions required for the optimal
extraction of particular populations, establishing the capital theoretic basis for exploiting biological stocks. But they did not address the problem of biodiversity change. The extension of this work to consider the exploitation of multiple species has addressed one—albeit important—dimension of the biodiversity problem. There is now a body of literature exploring the optimal management of systems in which multiple species of differing value are exploited directly or indirectly (Tilman and others 2005, Eichner and Pethig 2005, Brock and Xepapadeas 2002, Perrings and Walker 1997, Perrings and Walker 2005).
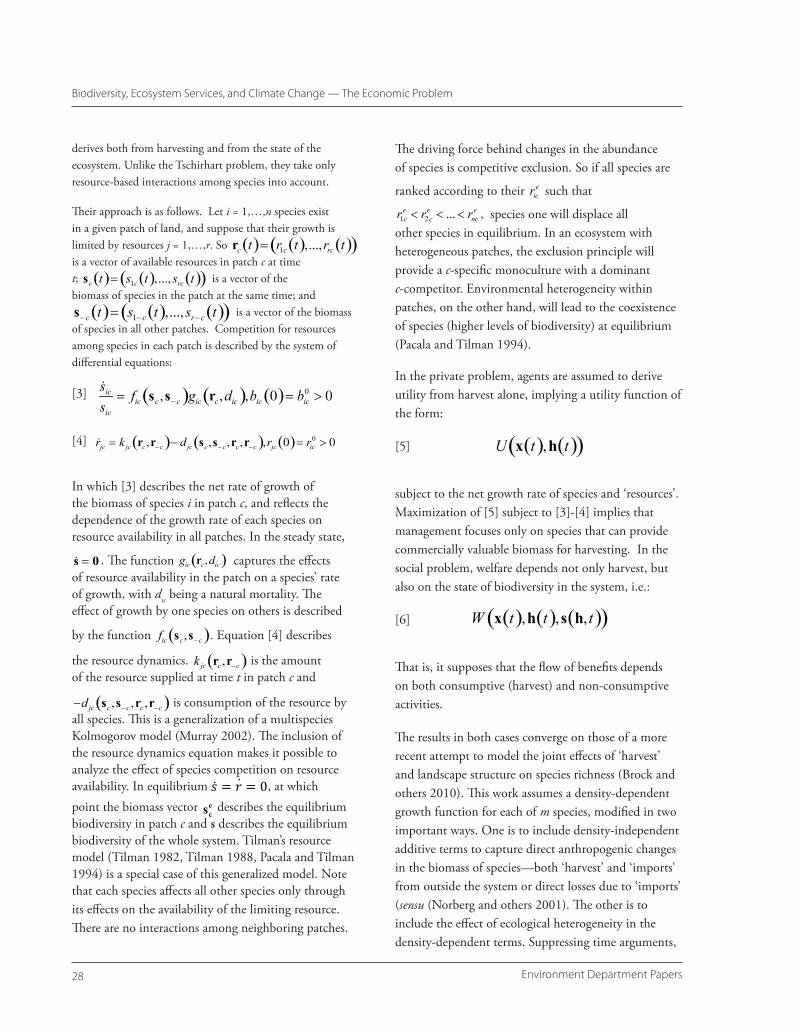
The most general approach to the problem has been the work of Tschirhart and colleagues. They have used a modified computable general equilibrium (CGE) model of predator-prey and competitive relationships applied to an Alaskan marine food web and the Alaskan economy (Finnoff and Tschirhart 2003, Finnoff and Tschirhart 2003a), an early twentieth century rodent invasion in California (Kim and others 2007), invasions of sea lamprey in the Great Lakes, invasions of leafy spurge in the Western U.S., and plant competition generally (Finnoff and Tschirhart 2005). Within this work, the conservation problem has been modeled by identifying demand for the level of biodiversity in a system relative to some reference level. (Eichner and Tschirhart 2007) for example, introduce a measure labeled the divergence from ‘natural biodiversity’—the reference point:
[1]
In which, s is a measure of deviation from the reference point—‘natural’ biodiversity in this case, h is a vector of consumption (effort that reduces the abundance of each species), N is the total number of species, ni(h) is the population of species i as a function of consumptive use, and ni(0) is the ‘natural’ steady-state population of species i. If there is no consumptive use, then h = 0 and s = 0. They assume that the desired value of this measure is zero, and that this is independent native species richness. Society is assumed to have preferences over the reference state, along with manufactured goods and the consumption of species, implying a welfare function of the form:
[2]
where x is a vector of manufactured goods, and other variables are as previously described. The general equilibrium ecosystem model captures the interactive effects of changes in the abundance of particular species.
In a variation on the same theme, Brock and Xepapapdeas (2002) identify the difference between the outcomes associated with the privately and socially optimal management of a system in which private decision-makers focus on the management of individual patches, but social welfare depends on the composition of all patches. As in the Tschirhart problem, welfare
s = s h( )= −ni h( )− ni 0( )
ni 0( )
i=1
N
∑2
W x,h,s h( )( )
Environment Department Papers28
Biodiversity, Ecosystem Services, and Climate Change — The Economic Problem
derives both from harvesting and from the state of the ecosystem. Unlike the Tschirhart problem, they take only resource-based interactions among species into account.
Their approach is as follows. Let i = 1,…,n species exist in a given patch of land, and suppose that their growth is limited by resources j = 1,…,r. So rc t( )= r1c t( ),...,rrc t( )( ) is a vector of available resources in patch c at time t; sc t( )= s1c t( ),..., src t( )( ) is a vector of the biomass of species in the patch at the same time; and s−c t( )= s1−c t( ),..., sr −c t( )( ) is a vector of the biomass of species in all other patches. Competition for resources among species in each patch is described by the system of differential equations:
[3]
[4]
In which [3] describes the net rate of growth of the biomass of species i in patch c, and reflects the dependence of the growth rate of each species on resource availability in all patches. In the steady state,
s = 0 . The function gic rc ,dic( ) captures the effects of resource availability in the patch on a species’ rate of growth, with dic being a natural mortality. The effect of growth by one species on others is described
by the function fic sc ,s−c( ). Equation [4] describes
the resource dynamics. kjc rc ,r−c( ) is the amount
of the resource supplied at time t in patch c and
−djc sc ,s−c ,rc ,r−c( ) is consumption of the resource by all species. This is a generalization of a multispecies Kolmogorov model (Murray 2002). The inclusion of the resource dynamics equation makes it possible to analyze the effect of species competition on resource availability. In equilibrium
Attached, please find for your review a PDF of the above paper. Here are some questions I have and some help that need: 1. Title page, see blue text at bottom, which URL should I put?
2. page 19, Table1: in the Soth Africa column, the row that reads "-e". Is something missing?
DROP the “e” so only “-“ remains
3. page 20, Fig. 3: Should "list A" appear above "list B"? What is the legend for the x-axis in the List B
chart? SAME legend in both figures
4. page 28, left col., see equation in blue ---- part of it overlaps and is illegible
5. pages 28 and 29 --- there are two equations numbered 6. Any problem with renumbering the second 6 to 7, and correcting all numbering thereafter (including in text)?
PLEASE Re-number
6. page 29, equation in blue, part overlaps and is illegible
7. page 29, second and third equations in blue, some symbols changed when placed into the
typesetting software
K /i m
Lemi
8. page 29, equation #7, one symbol did not convert and became a "d" in the superscript "-dt"
9. page 31, equation #10, overlapping letters
10. page 31, equation #11, this one went totally awry when placed in typesetting softeware
11. page 31, small equation just below #11 in blue, also symbols did not translate
, at which point the biomass vector sc
e describes the equilibrium biodiversity in patch c and s describes the equilibrium biodiversity of the whole system. Tilman’s resource model (Tilman 1982, Tilman 1988, Pacala and Tilman 1994) is a special case of this generalized model. Note that each species affects all other species only through its effects on the availability of the limiting resource. There are no interactions among neighboring patches.
The driving force behind changes in the abundance of species is competitive exclusion. So if all species are
ranked according to their rice such that
r1ce < r2c
e < ... < rnce , species one will displace all
other species in equilibrium. In an ecosystem with heterogeneous patches, the exclusion principle will provide a c-specific monoculture with a dominant c-competitor. Environmental heterogeneity within patches, on the other hand, will lead to the coexistence of species (higher levels of biodiversity) at equilibrium (Pacala and Tilman 1994).
In the private problem, agents are assumed to derive utility from harvest alone, implying a utility function of the form:
[5]
subject to the net growth rate of species and ‘resources’. Maximization of [5] subject to [3]-[4] implies that management focuses only on species that can provide commercially valuable biomass for harvesting. In the social problem, welfare depends not only harvest, but also on the state of biodiversity in the system, i.e.:
[6]
That is, it supposes that the flow of benefits depends on both consumptive (harvest) and non-consumptive activities.
The results in both cases converge on those of a more recent attempt to model the joint effects of ‘harvest’ and landscape structure on species richness (Brock and others 2010). This work assumes a density-dependent growth function for each of m species, modified in two important ways. One is to include density-independent additive terms to capture direct anthropogenic changes in the biomass of species—both ‘harvest’ and ‘imports’ from outside the system or direct losses due to ‘imports’ (sensu (Norberg and others 2001). The other is to include the effect of ecological heterogeneity in the density-dependent terms. Suppressing time arguments,
sic
sic
= fic sc ,s−c( )gic rc ,dic( ),bic 0( )= bic0 > 0
rjc = kjc rc ,r−c( )− djc sc ,s−c ,rc ,r−c( ),rjc 0( )= ric
0 > 0 U x t( ),h t( )( )
W x t( ),h t( ),s h,t( )( )
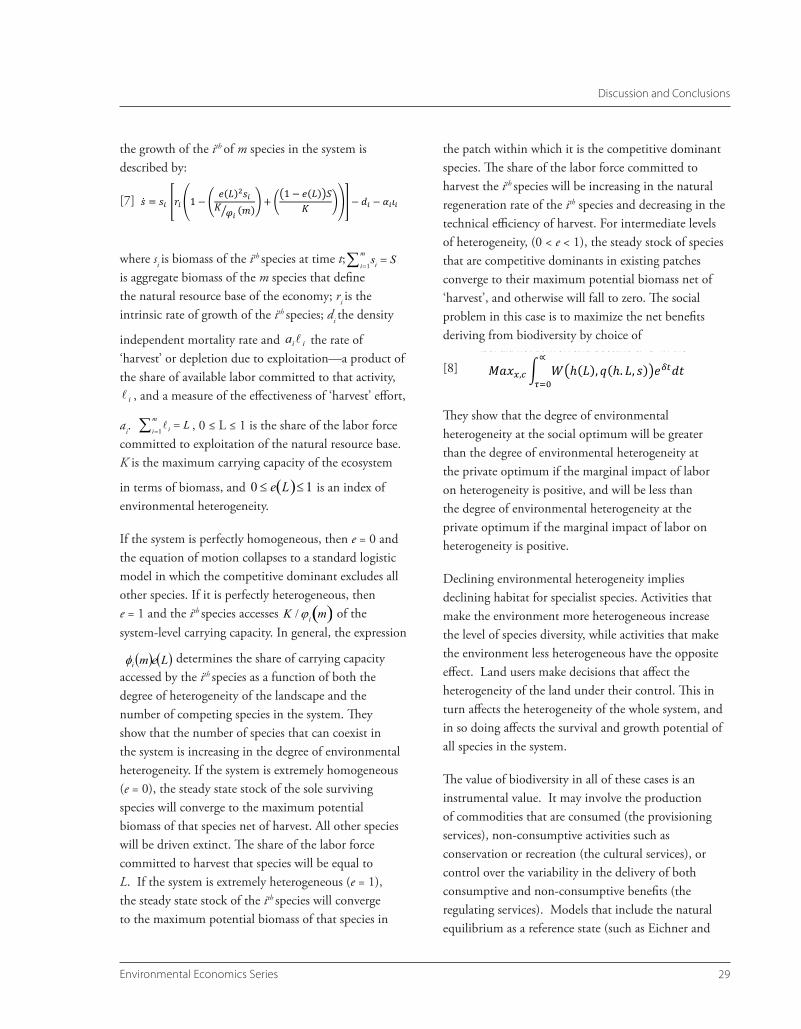
29Environmental Economics Series
Discussion and Conclusions
Attached, please find for your review a PDF of the above paper. Here are some questions I have and some help that need: 1. Title page, see blue text at bottom, which URL should I put?
2. page 19, Table1: in the Soth Africa column, the row that reads "-e". Is something missing?
DROP the “e” so only “-“ remains
3. page 20, Fig. 3: Should "list A" appear above "list B"? What is the legend for the x-axis in the List B
chart? SAME legend in both figures
4. page 28, left col., see equation in blue ---- part of it overlaps and is illegible
5. pages 28 and 29 --- there are two equations numbered 6. Any problem with renumbering the second 6 to 7, and correcting all numbering thereafter (including in text)?
PLEASE Re-number
6. page 29, equation in blue, part overlaps and is illegible
7. page 29, second and third equations in blue, some symbols changed when placed into the
typesetting software
K /i m
Lemi
8. page 29, equation #7, one symbol did not convert and became a "d" in the superscript "-dt"
9. page 31, equation #10, overlapping letters
10. page 31, equation #11, this one went totally awry when placed in typesetting softeware
11. page 31, small equation just below #11 in blue, also symbols did not translate
the growth of the ith of m species in the system is described by:
[7]
where si is biomass of the ith species at time t;
sii=1
m∑ = S is aggregate biomass of the m species that define the natural resource base of the economy; ri is the intrinsic rate of growth of the ith species; di the density
independent mortality rate and iia the rate of ‘harvest’ or depletion due to exploitation—a product of the share of available labor committed to that activity,
i , and a measure of the effectiveness of ‘harvest’ effort,
ai. ii=1
m∑ = L , 0 ≤ L ≤ 1 is the share of the labor force committed to exploitation of the natural resource base. K is the maximum carrying capacity of the ecosystem
in terms of biomass, and 0 ≤ e L( )≤ 1 is an index of environmental heterogeneity.
If the system is perfectly homogeneous, then e = 0 and the equation of motion collapses to a standard logistic model in which the competitive dominant excludes all other species. If it is perfectly heterogeneous, then e = 1 and the ith species accesses
Attached, please find for your review a PDF of the above paper. Here are some questions I have and some help that need: 1. Title page, see blue text at bottom, which URL should I put?
2. page 19, Table1: in the Soth Africa column, the row that reads "-e". Is something missing?
DROP the “e” so only “-“ remains
3. page 20, Fig. 3: Should "list A" appear above "list B"? What is the legend for the x-axis in the List B
chart? SAME legend in both figures
4. page 28, left col., see equation in blue ---- part of it overlaps and is illegible
5. pages 28 and 29 --- there are two equations numbered 6. Any problem with renumbering the second 6 to 7, and correcting all numbering thereafter (including in text)?
PLEASE Re-number
6. page 29, equation in blue, part overlaps and is illegible
7. page 29, second and third equations in blue, some symbols changed when placed into the
typesetting software
K /i m
Lemi
8. page 29, equation #7, one symbol did not convert and became a "d" in the superscript "-dt"
9. page 31, equation #10, overlapping letters
10. page 31, equation #11, this one went totally awry when placed in typesetting softeware
11. page 31, small equation just below #11 in blue, also symbols did not translate
of the system-level carrying capacity. In general, the expression
Attached, please find for your review a PDF of the above paper. Here are some questions I have and some help that need: 1. Title page, see blue text at bottom, which URL should I put?
2. page 19, Table1: in the Soth Africa column, the row that reads "-e". Is something missing?
DROP the “e” so only “-“ remains
3. page 20, Fig. 3: Should "list A" appear above "list B"? What is the legend for the x-axis in the List B
chart? SAME legend in both figures
4. page 28, left col., see equation in blue ---- part of it overlaps and is illegible
5. pages 28 and 29 --- there are two equations numbered 6. Any problem with renumbering the second 6 to 7, and correcting all numbering thereafter (including in text)?
PLEASE Re-number
6. page 29, equation in blue, part overlaps and is illegible
7. page 29, second and third equations in blue, some symbols changed when placed into the
typesetting software
K /i m
Lemi
8. page 29, equation #7, one symbol did not convert and became a "d" in the superscript "-dt"
9. page 31, equation #10, overlapping letters
10. page 31, equation #11, this one went totally awry when placed in typesetting softeware
11. page 31, small equation just below #11 in blue, also symbols did not translate
determines the share of carrying capacity accessed by the ith species as a function of both the degree of heterogeneity of the landscape and the number of competing species in the system. They show that the number of species that can coexist in the system is increasing in the degree of environmental heterogeneity. If the system is extremely homogeneous (e = 0), the steady state stock of the sole surviving species will converge to the maximum potential biomass of that species net of harvest. All other species will be driven extinct. The share of the labor force committed to harvest that species will be equal to L. If the system is extremely heterogeneous (e = 1), the steady state stock of the ith species will converge to the maximum potential biomass of that species in
the patch within which it is the competitive dominant species. The share of the labor force committed to harvest the ith species will be increasing in the natural regeneration rate of the ith species and decreasing in the technical efficiency of harvest. For intermediate levels of heterogeneity, (0 < e < 1), the steady stock of species that are competitive dominants in existing patches converge to their maximum potential biomass net of ‘harvest’, and otherwise will fall to zero. The social problem in this case is to maximize the net benefits deriving from biodiversity by choice of
[8]
They show that the degree of environmental heterogeneity at the social optimum will be greater than the degree of environmental heterogeneity at the private optimum if the marginal impact of labor on heterogeneity is positive, and will be less than the degree of environmental heterogeneity at the private optimum if the marginal impact of labor on heterogeneity is positive.
Declining environmental heterogeneity implies declining habitat for specialist species. Activities that make the environment more heterogeneous increase the level of species diversity, while activities that make the environment less heterogeneous have the opposite effect. Land users make decisions that affect the heterogeneity of the land under their control. This in turn affects the heterogeneity of the whole system, and in so doing affects the survival and growth potential of all species in the system.
The value of biodiversity in all of these cases is an instrumental value. It may involve the production of commodities that are consumed (the provisioning services), non-consumptive activities such as conservation or recreation (the cultural services), or control over the variability in the delivery of both consumptive and non-consumptive benefits (the regulating services). Models that include the natural equilibrium as a reference state (such as Eichner and

Environment Department Papers30
Biodiversity, Ecosystem Services, and Climate Change — The Economic Problem
Tschirhart 2007, or Brock and Xepapadeas 2002) represent an attempt to model the conservationists’ problem directly. But it is also possible to see the conservation value of biodiversity as a service analogous to the scientific, aesthetic or recreational value of biodiversity.
In agroecosystems unsupported by formal insurance markets, economic research on the same problem shows that farmers opt to insure against output (or price) failure by increasing the genetic diversity of crops. For example, (Smale and others 1998) found crop genetic diversity in wheat production in the Punjab to be positively correlated with mean yields and negatively correlated with the variance of yields. (Di Falco and Perrings 2005, Di Falco and Perrings 2003) found a similar relation in a study of cereals production in southern Italy—but also found that relation to be weakened by access to financial support from the European Union (Di Falco and Perrings 2005). In an extension of this work, (Di Falco and Chavas 2007) considered the effect of crop genetic diversity on the skewness of yields in Sicily as a way of capturing the downside risk. The general form of the problem addressed in this last paper is:
[9]
where q x,s,v( ) describes agricultural output as a function of marketed inputs, x, crop genetic diversity, s, and a random set of environmental conditions, v.
c x,s( ) is a cost function, and r s( ) is a risk premium equal to the farmers’ willingness to pay to eliminate risk—i.e., to replace random profit by mean profit. In other words the maximand is the certainty equivalent net benefit of agricultural production: the expected net return less the cost of private risk (Pratt 1964). The risk premium depends on all moments of the profit distribution, but is approximated by the following:
[10]
where Mi = E p − E p( )( )i is the ith moment of the profit
distribution, and where r2 is the standard Arrow-Pratt coefficient of absolute risk aversion. Using this model they found a similarly negative relation between diversity and the skewness of yields. They also found that the strength of the effect was inversely related to the level of pesticide use. That is, pesticides use offered an alternative way to manage the risk of crop failure. But other things being equal, the greater the variability in environmental conditions recorded in the vector v, the greater the value of the crop genetic diversity in the vector s.
It can be argued that the financial benefits of higher levels of in situ crop genetic diversity are likely to be felt most strongly in developing countries, where there is little scope for insuring against crop failure, crop pests and crop diseases, or where there is little scope to manage the variability in supply through the application of fertilizers and pesticides. In an increasingly integrated global system the diversity of the biological resources used to support many production systems is frequently highly distributed, held in ex situ collections in different locations, while plant and animal breeding processes or the genetic manipulation of plant material is separated from process of production. Nevertheless, in both developed and developing countries, for many of the ecosystem services produced jointly with foods, fuels and fibers alike—such as water supply, soil stabilization, habitat provision or pest predation—maintenance of in situ diversity can stabilize the delivery of those services in similar ways to that modeled by di Falco and others. While the work has not been done to estimate the value of biodiversity to the delivery of uninsured or uninsurable ecosystem services, it is transparent that it too will be sensitive to the risk aversion of the affected community.
A second dimension of the relation between biodiversity and risk is problem of pests and pathogens. Not all species contribute positively to human wellbeing. Just as the production of foods, fuels and
Maxx,sE pq x,s,v( )( )− c x,s( )− r s( )
r ≈12
r2M 2 +16
r3M 3

31Environmental Economics Series
Discussion and Conclusions
Attached, please find for your review a PDF of the above paper. Here are some questions I have and some help that need: 1. Title page, see blue text at bottom, which URL should I put?
2. page 19, Table1: in the Soth Africa column, the row that reads "-e". Is something missing?
DROP the “e” so only “-“ remains
3. page 20, Fig. 3: Should "list A" appear above "list B"? What is the legend for the x-axis in the List B
chart? SAME legend in both figures
4. page 28, left col., see equation in blue ---- part of it overlaps and is illegible
5. pages 28 and 29 --- there are two equations numbered 6. Any problem with renumbering the second 6 to 7, and correcting all numbering thereafter (including in text)?
PLEASE Re-number
6. page 29, equation in blue, part overlaps and is illegible
7. page 29, second and third equations in blue, some symbols changed when placed into the
typesetting software
K /i m
Lemi
8. page 29, equation #7, one symbol did not convert and became a "d" in the superscript "-dt"
9. page 31, equation #10, overlapping letters
10. page 31, equation #11, this one went totally awry when placed in typesetting softeware
11. page 31, small equation just below #11 in blue, also symbols did not translate
fibers depends on the simplification of ecosystems managed for that purpose, so the promotion of human, animal and plant health depends on the exclusion of harmful pathogens. Moreover, just as the closer integration of world markets for foods, fuels and fibers has increased the dispersion rate of agricultural pests and pathogens (Mcneely 2001, Rweyemamu and Astudillo 2002, Karesh and others 2005, Perrings and others 2005, Fevre and others 2006), so the development of tourism and the closer integration of world markets for many services has increased the dispersion rate of human pathogens (Tatem and others 2006, Smith 2008). Recent examples include the emergence of diseases such as H5NI (Kilpatrick and others 2006), West Nile virus (Lanciotti and others 1999), SARS (Guan and others 2003). Work to date has shown a positive relationship between the opening of new markets or trade routes and the introduction of new species, and between the growth in trade volumes (the frequency of introduction) and the probability that introduced species will establish and spread (Cassey and others 2004, Semmens and others 2004, Dalmazzone 2000, Vila and Pujadas 2001). Moreover, the volume and direction of trade turn out to be good empirical predictors of which introduced species are likely to become invasive (Levine and D’antonio 2003, Costello and others 2007), and which countries are the most likely sources of zoonoses (Pavlin and others 2009, Smith and others 2009a).
Within the literature as it has developed over the last decade, this problem has been modeled in two ways: by extension of the compartmental Susceptible, Infected, Recovered (SIR) models developed in epidemiology, and by adaptation of the bioeconomic models developed to explore the consequences of harvest. In the first approach, it is recognized that public responses to the emergence of some pathogen will affect the dynamics of that disease directly (Ginsberg and others 2009), but by altering the cost of the activities involved, it will also change behavior in ways that alter the risks of other activities (Smith and others 2009b). People will switch travel destinations, exporters will switch
commodities or markets. In fact, changes in EID risks are frequently an incidental or unforeseen ‘external’ consequence of private decisions or public policies on emerging diseases (Gersovitz and Hammer 2003, Klein and others 2009, Horan and Wolf 2005, Horan and others 2008).
In the simplest (single pathogen) case individuals face a problem of the form
[11]
subject to the disease dynamics specified by an SIR model,
[12]
where ν and µ are per capita recovery and mortality rates. The transmission rate, ß , is a time-varying function of the factors that drive the frequency of contact between susceptible and infected individuals and the likelihood that contact results in infection. More particularly
12. page 32, equation #13, some overlap of text occurs
13. The author/date style of the References is not quite correct, but it is close enough. so in the interest of expediency, I am leaving them as is.
OK
is the product of two
functions. The contact function, c ⋅( ) , is the rate at which individuals make contacts. Those contacts are a source of positive utility to the people concerned, but will involve infected individuals with probability I/N. The infection likelihood function b ⋅( ) is the probability that contact with an infectious agent will result in an infection.
As in many other cases where individual behavior affects the risks confronting society, people typically choose less vaccination or treatment for themselves than would be socially desirable. This is because they neglect the impact that their behavior has on the health risks to others (Gersovitz and Hammer 2004, Sandler 2004). The public optimization problem in such cases involves the selection of measures to limit either contact or the infection likelihood. Examples include social distancing through, for example, quarantine, imposed contact reductions, or travel restrictions (Nuno and others 2007, Smith and others 2009b).

Environment Department Papers32
Biodiversity, Ecosystem Services, and Climate Change — The Economic Problem
A more widely used approach in the economic literature involves an extension of the bioeconomic harvesting model in either an optimal control or dynamic programming framework (Olson and Roy 2002, Olson 2006, Lovell and others 2006, Sharov and others 1998, Sharov and others 2002). Interventions include actions to prevent introductions (Horan and others 2002, Sumner and others 2005), to control established species (Eisworth and Johnson 2002), or to undertake both prevention and control (Finnoff and Tschirhart 2005, Finnoff and Tschirhart 2007, Leung and others 2002, Olson and Roy 2005). (Polasky 2010) adds detection of established species that have not yet become a nuisance.
There is no standard for models of this type, but the following example (from (Perrings and others 2010a) illustrates the general form of the problem. It is assumed that susceptible hosts (flaura or fauna) are elements in the vector of species that describes a country’s resource base, s. The equation of motion for hosts infected with the ith of n potentially invasive pathogens in an importing country takes the form:
[13]
where h(t) is harvest of the species, fi is the density-dependent growth of the infected population in the
importing country; and pi t( )− qi t( )( )M t( ) is the density independent growth of the infected population through
imports. This is increasing in imports M, pji t( )M t( )
being the probability that M units of imports will introduce pathogen i, and decreasing in sanitary and phytosanitary (SPS) effort. Since SPS is an‘impure public good’ (it gives the provider a direct benefit, but also a non-exclusive indirect benefit to all others), it will typically be underprovided if left to the market. The social problem is to choose the level of SPS for all potentially invasive pathogens so as to maximize the expected present value of net benefits, E(W), from harvest and imports:
[14]
subject to [11]. δ , the discount rate, approximates the opportunity cost or growth potential of capital. They find that SPS effort is increasing in the potential marginal damage avoided (the marginal benefit of SPS measures), and is decreasing in the marginal cost of SPS effort. They also find SPS effort to be decreasing in the relative marginal growth rate of the pathogen. Indeed, there will be a positive optimal (steady state) level of inspection and interception only for pathogens that are ‘slow growing’ relative to the economy. If a pathogen is not controllable through the SPS measures applied to imports (because it is already established in the country) it will not be optimal to commit resources to SPS. While SPS effort will be greatest for species that are not yet established, but that are potentially highly damaging.
In all cases, the diversity of species that support one or more ecosystem services is described by the diversity of functional groups of species that have some role to play. These may be described in terms of a set of traits, rather than by the set of species involved, but the effect is the same. Given the set of species in the system and their relative abundance it is possible to identify the ecosystem services that may be produced. At the same time, since the set of species in the system depends on structural characteristics that are either the intended or unintended consequence of system ‘management’, it is possible to describe the implications of actions that affect biodiversity through the structural characteristics of the system. Such structural characteristics include both the heterogeneity that allows niche differentiation, and the impact of greenhouse gas emissions and land use change on climate. The value of anthropogenic change in environmental conditions is therefore the impact it has on the functional diversity of species, and hence on the flow of ecosystem services such species support. This will depend both on the complementarity and substitutability between species as inputs in the supply of ecosystem services, and on the impact of functional diversity on the capacity of the system to produce ecosystem services over a range of environmental conditions.
si = f i h t( ),si t( )( )+ pi t( )− qi t( )( )M t( )
12. page 32, equation #13, some overlap of text occurs
13. The author/date style of the References is not quite correct, but it is close enough. so in the interest of expediency, I am leaving them as is.
OK
33Environmental Economics Series
References
Allen, B. P. and Loomis, J. B. (2006) Deriving values for the ecological support function of wildlife: An indirect valuation approach. Ecological Economics, 56, 49-57.
Angelsen, A., Brown, S., Loisel, C., Peskett, L., Streck, C. and Zarin, D. (2009) Reducing Emissions from Deforestation and Forest Degradation (REDD): An Options Assessment Report. Meridian Institute, Washington D.C.
Arriagada, R. (2008) Private provision of public goods: applying matching methods to evaluate payments for ecosystem services in Costa Rica. Unpublished PhD dissertation. College of Natural Resources, North Carolina State University. Raleigh, NC.
Arriagada, R. and Perrings, C. (2009) Making Payments for Ecosystem Services Work. Ecosystem Services Economics Working Papers. Unitred Nations Environment Programme, Nairobia.
Balvanera, P., Pfisterer, A. B., Buchmann, N., He, J.-S., Nakashizuka, T., Raffaelli, D. and Schmid, B. (2006) Quantifying the evidence for biodiversity effects on ecosystem functioning and services. Ecology Letters, 9, 1146–1156.
Barbier, E. B. (1994) Valuing environmental functions: tropical wetlands. Land Economics, 70, 155-173.
Barbier, E. B. (2000) Valuing the environment as input: review of applications to mangrove-fishery linkages. Ecological Economics, 35, 47-61.
Barbier, E. B. (2007) Valuing ecosystem services as productive inputs. Economic Policy, 178-229.
Barbier, E. B. (2008) Ecosystems as natural assets. Foundations and Trends in Microeconomics, 4, 611–681
Blom, B., Sunderland, T. and Murdiyarso, D. (2010) Getting REDD to work locally: lessons learned from integrated conservation and development projects. . Environmental Science and Policy, 13, 164-172.
Brock, W. A., Kinzig, A. P. and Perrings, C. (2010) Modeling the Economics of Biodiversity and Environmental
Heterogeneity. Environmental and Resource Economics, 46, 43-58.
Brock, W. A. and Xepapadeas, A. (2002) Biodiversity management under uncertainty: Species selection and harvesting rules. Economic Theory for the Environment: Essays in Honour of Karl-Goran Maler (ed. by B. Kristrom and P. Dasgupta and K. Lofgren), pp 62-97. Edward Elgar, Cheltenham.
Cardinale, B. J., Srivastava, D. S., Duffy, J. E., Wright, J. P., Downing, A. L., Sankaran, M. and Jouseau, C. (2006) Effects of biodiversity on the functioning of trophic groups and ecosystems. Nature, 443, 989–992.
Cassey, P., Blackburn, T. M., Russel, G. J., Jones, K. E. and Lockwood, J. L. (2004) Influences on the transport and establishment of exotic bird species: an analysis of the parrots (Psittaciformes) of the world. Global Change Biology, 10, 417-426.
Clark, C. W. C., F.H. And Munro, G.R. (1979) The optimal exploitation of renewable resource stocks: problems of irreversible investment. Econometrica, 47, 25-47.
Cole, M. A., Rayner, A. J. and Bates, J. M. (1997) The Environmental Kuznets Curve: an empirical analysis. Environment and Development Economics, 2, 401-416.
Confalonieri, U., Menne, B., Akhtar, R., Ebi, K. L., Hauengue, M., Kovats, R. S., Revich, B. and Woodward, A. (2007) Human health. Climate Change 2007: Impacts, Adaptation and Vulnerability. Contribution of Working Group II. Fourth Assessment Report of the Intergovernmental Panel on Climate Change (ed. by M.L. Parry and O.F. Canziani and J.P. Palutikof and P.J. Van Der Linden and C.E. Hanson), pp 391-431. Cambridge University Press, Cambridge, UK, 391-431.
Costello, C., Springborn, M., Mcausland, C. and Solow, A. (2007) Unintended biological invasions: Does risk vary by trading partner? Journal of Environmental Economics and Management, 54, 262-276.
Dalmazzone, S. (2000) Economic factors affecting vulnerability to biological invasions. The Economics

Environment Department Papers34
Biodiversity, Ecosystem Services, and Climate Change — The Economic Problem
of Biological Invasions (ed. by C.W. Perrings, M. And Dalmazzone, S.), pp 17-30. Edward Elgar, Cheltenham.
Daszak, P., Plowright, R., Epstein, J. H., Pulliam, J., Rahman, S. A., Field, H. E., Smith, C. S., Olival, K. J., Luby, S., Halpin, K., Hyatt, A. D. and Cunningham, A. A. (2006) The emergence of Nipah and Hendra virus: pathogen dynamics across a wildlife-livestock-human continuum. Disease Ecology: Community structure and pathogen dynamics (ed. by S. Collinge and C. Ray), pp 186-201 Oxford University Press, Oxford.
Daszak, P., Tabor, G. M., Kilpatrick, A. M., Epstein, J. and Plowright, R. (2004) Conservation medicine and a new agenda for emerging diseases. Impact of Ecological Changes on Tropical Animal Health and Disease Control, 1026, 1-11.
Di Falco, S. and Chavas, J. P. (2007) On the role of crop biodiversity in the management of environmental risk. Biodiversity Economics: Principles, Methods, and Applications (ed. by A. Kontoleon and U. Pascual and T. Swanson), pp 581-593. Cambridge University Press, Cambridge.
Di Falco, S. and Perrings, C. (2003) Crop genetic diversity, productivity and stability of agroecosystems. A theoretical and empirical investigation. Scottish Journal of Political Economy, 50, 207-216.
Di Falco, S. and Perrings, C. (2005) Crop biodiversity, risk management and the implications of agricultural assistance. Ecological Economics, 55, 459-466.
Doak, D. F., Bigger, D., Harding-Smith, E., Marvier, M. A., O’malley, R. and Thomson, D. (1998) The statistical inevitability of stability–diversity relationships in community ecology. American Naturalist, 151, 264–276.
Dutschke, M. and Angelsen, A. (2008) How do we ensure permanence and assign liability? . Moving Ahead with REDD (ed. by A. Angelsen). CIFOR, Bogor.
Eichner, T. and Pethig, R. (2005) Ecosystem and economy: An integrated dynamic general equilibrium approach. Journal of Economics, 85, 213-249.
Eichner, T. and Tschirhart, J. (2007) Efficient ecosystem services and naturalness in an ecological economic model. Environmental and Resource Economics, 37, 733-755.
Eisworth, M. E. and Johnson, W. S. (2002) Managing nonindigenous invasive species: insights from dynamic analysis. Environmental and Resource Economics, 23, 319-342.
Engel, S., Pagiola, S. and Wunder, S. (2008) Designing payments for environmental services in theory and
practice: an overview of the issues. Ecological Economics, 65, 663-674.
European Commission Directorate-General for Agriculture and Rural Development. (2007) The Common Agricultural Policy explained. European Commission, Brussels.
Ferraro, P. and Kiss, A. (2007) Direct payments to conserve biodiversity. Science, 298, 1718-1719.
Ferraro, P. J. and Simpson, R. D. (2002) The cost-effectiveness of conservation payments. Land Economics, 78, 339-353.
Ferreira, S., Hamilton, K. and Vincent, J. R. (2008) Comprehensive Wealth and Future Consumption: Accounting for Population Growth. The World Bank Economic Review, 22, 233–248.
Fevre, E. M., Bronsvoort, B., Hamilton, K. A. and Cleaveland, S. (2006) Animal movements and the spread of infectious diseases. Trends in Microbiology, 14, 125-131.
Finnoff, D. and Tschirhart, J. (2003) Harvesting in an eight species ecosystem. Journal of Environmental Economics and Management, 45, 589-611.
Finnoff, D. and Tschirhart, J. (2003a) Protecting an endangered species while harvesting its prey in a general equilibrium ecosystem model. Land Economics, 79, 160-180.
Finnoff, D. and Tschirhart, J. (2005) Identifying, preventing, and controlling successful invasive plant speices using their phsyiological traits. Ecological Economics, 52, 397-416.
Finnoff, D. and Tschirhart, J. (2007) Linking dynamic economic and ecological general equilibrim models. University of Wyoming Department of Economics, Wyoming.
Gersovitz, M. and Hammer, J. S. (2003) Infectious diseases, public policy, and the marriage of economics and epidemiology. The World Bank Research Observer, 18, 129-157.
Gersovitz, M. and Hammer, J. S. (2004) The economical control of infectious diseases. The Economic Journal, 114, 1-27.
Ginsberg, J., Mohebbi, M., Patel, R., Brammer, L., Smolinski, M. and Brilliant, L. (2009) Detecting influenza epidemics using search engine query data. Nature, 457, 1012-1014.

35Environmental Economics Series
References
Gitay, H., Suarez, A., Watson, R. T. and Dokken, D. J. (2002) Climate Change and Biodiversity. IPCC Technical Paper. Intergovernmental Panel on Climate Change.
Goulder, L. H. and Kennedy, D. (1997) Valuing ecosystem services: philosophical bases and empirical methods. Nature’s Services: Societal Dependence on Natural Ecosystems (ed. by G.C. Daily), pp 23-47. Island Press, Washington, D.C.
Griffin, J. N., O’gorman, E. J., Emmerson, M. C., Jenkins, S. R., Klein, A.-M., Loreau, M. and Symstad, A. (2009) Biodiversity and the stability of ecosystem functioning. Biodiversity, Ecosystem Functioning, and Human Wellbeing: An Ecological and Economic Perspective (ed. by D.B. S. Naeem, A. Hector, M. Loreau, and C. Perrings), pp 78-93. Oxford University Press, Oxford.
Guan, Y., Zheng, B. J., He, Y. Q., Liu, X. L., Zhuang, Z. X., Cheung, C. L., Luo, S. W., Li, P. H., Zhang, L. J., Guan, Y. J., Butt, K. M., Wong, K. L., Chan, K. W., Lim, W., Shortridge, K. F., Yuen, K. Y., Peiris, J. S. M. and Poon, L. L. M. (2003) Isolation and characterization of viruses related to the SARS coronavirus from animals in Southern China. Science, 302, 276-278.
Heal, G. M., Barbier, E. B., Boyle, K. J., Covich, A. P., Gloss, S. P., Hershner, C. H., Hoehn, J. P., Pringle, C. M., Polasky, S., Segerson, K. and Shrader-Frechette, K. (2005) Valuing Ecosystem Services: Toward Better Environmental Decision Making, edn. The National Academies Press, Washington, D.C.
Hector, A. and Bagchi, R. (2007) Biodiversity and ecosystem multifunctionality. Nature, 448.
Hoegh-Guldberg, O., Mumby, P. J., Hooten, A. J., Steneck, R. S., Greenfield, P., Gomez, E., Harvell, C. D., Sale, P. F., Edwards, A. J., Caldeira, K., Knowlton, N., Eakin, C. M., Iglesias-Prieto, R., Muthiga, N., Bradbury, R. H., Dubi, A. and Hatziolos, M. E. (2007) Coral Reefs Under Rapid Climate Change and Ocean Acidification. Science, 318, 1737-1742.
Hooper, D. U., Chapin, F. S. I., Ewel, J. J., Hector, A., Inchausti, P., Lavorel, S., Lawton, J. H., Lodge, D. M., Loreau, M., Naeem, S., Schmid, B., Setälä, H., Symstad, A. J., Vandermeer, J. and Wardle, D. A. (2005) Effects of biodiversity on ecosystem functioning: a consensus of current knowledge. Ecological Monographs, 75, 3-35.
Hopp, M. J. and Foley, J. A. (2003) Worldwide fluctuations in dengue fever cases related to climate variability. Climate Research, 25, 85-94.
Horan, R., Shogren, J. F. and Gramig, B. (2008) Wildlife conservation payments to address habitat fragmentation
and disease risk. Environment and Development Economics, 13, 415-439.
Horan, R. and Wolf, C. (2005) The economics of managing infectious wildlife disease. American Journal of Agricultural Economics, 87, 537-551.
Horan, R. D., Perrings, C., Lupi, F. and Bulte, E. H. (2002) Biological pollution prevention strategies under ignorance: The case of invasive species. American Journal of Agricultural Economics, 84, 1303-1310.
Hughes, T. P., Baird, A. H., Bellwood, D. R., Card, M., Connolly, S. R., Folke, C., Grosberg, R., Hoegh-Guldberg, O., Jackson, J. B. C., Kleypas, J., Lough, J. M., Marshall, P., Nystrom, M., Palumbi, S. R., Pandolfi, J. M., Rosen, B. and Roughgarden, J. (2003) Climate change, human impacts, and the resilience of coral reefs. Science, 301, 929-933.
Jones, K. E., Patel, N. G., Levy, M. A., Storeygard, A., Balk, D., Gittleman, J. L. and Daszak, P. (2008) Global trends in emerging infectious diseases. Nature, 451, 990-3.
Karesh, W., Cook, R. A., Bennett, E. L. and Newcomb, J. (2005) Wildlife trade and global disease emergence. Emerging Infectious Diseases, 11, 1000-1002.
Karl, Thomas R. , Melillo, J. M. and Peterson, T. C. (2009) Global Climate Change Impacts in the United States. Cambridge University Press, Cambridge.
Kilpatrick, A. M., Chmura, A. A., Gibbons, D. W., Fleishcer, R. C., Marra, P. P. and Daszak, P. (2006) Predicting the global spread of H5N1 avian influenza, Proceedings of the National Academy of Sciences of the United States of America, 103, 19368-19373.
Kim, S., Tschirhart, J. and Buskirk, S. (2007) Reconstructing past population processes with general equilibrium models: House mice in Kern County, California. Ecological Modeling, 20, 235-248
Klein, C., Wilson, K., Watts, M., Stein, J., Berry, S., Carwardine, J., Smith, M. S., Mackey, B. and Possingham, H. (2009) Incorporating ecological and evolutionary processes into continental-scale conservation planning. Ecological Applications, 19, 206-217.
Lanciotti, R. S., Roehrig, J. T., Deubel, V., Smith, J., Parker, M., Steele, K., Crise, B., Volpe, K. E., Crabtree, M. B., Scherret, J. H., Hall, R. A., Mackenzie, J. S., Cropp, C. B., Panigrahy, B., Ostlund, E., Schmitt, B., Malkinson, M., Banet, C., Weissman, J., Komar, N., Savage, H. M., Stone, W., Mcnamara, T. and Gubler, D. J. (1999) Origin of the West Nile virus responsible for an outbreak of

Environment Department Papers36
Biodiversity, Ecosystem Services, and Climate Change — The Economic Problem
encephalitis in the northeastern United States. Science, 286, 2333-2337.
Lange, G.-M. (2007) Environmental accounting: Introducing the SEEA-2003. Ecological Economics, 61, 589-591.
Lavorel, S. and Garnier, E. (2002) Predicting changes in community composition and ecosystem functioning from plant traits: revisiting the Holy Grail. Functional Ecology, 16, 545–556.
Leung, B., Lodge, D. M., Finnoff, D., Shogren, J. F., Lewis, M. A. and Lamberti, G. (2002) An ounce of prevention or a pound of cure: bioeconomic risk analysis of invasive species. Royal Society of London, Biological Sciences, 269, 2407-2413.
Levine, J. M. and D’antonio, C. M. (2003) Forecasting biological invasions with increasing international trade. Conservation Biology, 17, 322-326.
Loreau, M., Naeem, S. and Inchausti, P. (2002) Biodiversity and Ecosystem Functioning: Synthesis and Perspectives. Oxford University Press, Oxford.
Lovejoy, T. E. and Hannah, L. J. (2006) Climate Change and Biodiversity. Yale University Press, New Haven, CT.
Lovell, S. J., Stone, S. F. and Fernandez, L. (2006) The economic impacts of aquatic invasive species: a review of the literature. Review of Agricultural and Resource Economics, 35, 195-208.
Mäler, K.-G. (1974) Environmental Economics: A Theoretical Inquiry, edn. Johns Hopkins Press, Baltimore.
Matete, M. and Hassan, R. (2006) Integrated ecological economics accounting approach to evaluation of inter-basin water transfers: An application to the Lesotho Highlands Water Project. Ecological Economics, 60, 246-259.
Mcnaughton, S. J. (1977) Diversity and stability of ecological communities: a comment on the role of empiricism in ecology. American Naturalist, 111, 515–525.
Mcneely, J. A. (2001) An introduction to human dimensions of invasive alien species. The Great Reshuffling. Human Dimensions of Invasive Alien Species (ed. by J.A. Mcneely), pp 5-20. IUCN, Gland.
Mendelsohn, R. O., Morrison, W. N., Schlesinger, M. E. and Andronova, N. G. (1998) Country-specific market impacts of climate change. Climatic Change, 45, 553-569.
Menéndez, R., González Megías, A., Hill, J. K., Braschler, B., Willis, S. G., Collingham, Y. C., Fox, R., Roy, D. B. and Thomas, C. D. (2006) Species richness changes lag
behind climate change. Proceedings of the Royal Society B, 273, 1465-1470.
Metz, B., Davidson, O. R., Bosch, P. R., Dave, R. and Meyer, L. A. (2007) Climate Change 2007: Mitigation of Climate Change Contribution of Working Group III to the Fourth Assessment Report of the Intergovernmental Panel on Climate Change, 2007 Cambridge University Press, Cambridge, UK.
Miles, L. and Kapos, V. (2008) Reducing greenhouse gas emissions from deforestation and forest degradation: Global land-use implications. Science, 320, 1454.
Millennium Ecosystem Assessment. (2005a) Ecosystems and Human Well-being: General Synthesis, edn. Island Press, Washington D.C.
Millennium Ecosystem Assessment, M. (2005b) Ecosystems and human well-being: current state and trends: findings of the condition and trends working group, edn. Island Press, Washington, D.C.
Murray, J. D. (2002) Mathematical Biology, edn. Springer, New York.
Naeem, S. (1998) Species redundancy and ecosystem reliability. Conservation Biology, 12, 39–45.
Naeem, S., Bunker, D., Hector, A., Loreau, M. and Perrings, C. (2009) Biodiversity, Ecosystem Functioning, and Human Wellbeing: An Ecological and Economic Perspective,. Oxford University Press.
Naeem, S. and Li, S. (1997) Biodiversity enhances ecosystem reliability. Nature, 390, 507-509.
Nelson, E., Polasky, S., Lewis, D. J., Plantinga, A. J., Lonsdorf, E., White, D., Bael, D. and Lawler, J. J. (2008) Efficiency of incentives to jointly increase carbon sequestration and species conservation on a landscape. Proceedings of the National Academy of Sciences USA, 105, 9471-9476.
Nelson, G. C., Rosegrant, M. W., Koo, J., Robertson, R., Sulser, T., Zhu, T., Ringler, C., Msangi, S., Palazzo, A., Batka, M., Magalhaes, M., Valmonte-Santos, R., Ewing, M. and Lee, D. (2009) Climate Change Impact on Agriculture and Costs of Adaptation. International Food Policy Research Institute, Washington, D.C.
Norberg, J., Swaney, D. P., Dushoff, J., Lin, J., Casagrandi, R. and Levin, S. A. (2001) Phenotypic diversity and ecosystem functioning in changing environments: a theoretical framework. Proceedings of the National Academy of Sceinces, 98, 11376-11381.

37Environmental Economics Series
References
Nordhaus, W. D. and Boyer, J. G. (2000) Warming the World: the Economics of the Greenhouse Effect, edn. MIT Press., Cambridge, MA.
Nuno, M. G., Chowell, G. and Gurnel, A. B. (2007) Assessing the role of basic control measures, antivirals and vaccine in curtailing pandemic influenza: scenarios for the US, UK and the Netherlands. Journal of the Royal Society Interface, 4, 505-521.
Olson, L. J. (2006) The economics of terrestrial invasive species: a review of the literature. . Review of Agricultural and Resource Economics, 35, 178-194.
Olson, L. J. and Roy, S. (2002) The economics of controlling a stochastic biological invasion. American Journal of Agricultural Economics, 84, 1311-1316.
Olson, L. J. and Roy, S. (2005) On prevention and control of an uncertain biological invasion. . Review of Agricultural Economics, 27, 491–497.
Orr, J. C., Fabry, V. J., Aumont, O., Bopp, L., Doney, S. C., Feely, R. A., Gnanadesikan, A., Gruber, N., Ishida, A., Joos, F., Key, R. M., Lindsay, K., Maier-Reimer, E., Matear, R., Monfray, P., Mouchet, A., Najjar, R. G., Plattner, G.-K., Rodgers, K. B., Sabine, C. L., Sarmiento, J. L., Schlitzer, R., Slater, R. D., Totterdell, I. J., Weirig, M.-F., Yamanaka, Y. and Yool, A. (2005) Anthropogenic ocean acidification over the twenty-first century and its impact on calcifying organisms. Nature, 437, 681-686.
Pacala, S. and Tilman, D. (1994) Limiting similarity in mechanistic and spatial models of plant competition in heterogeneous environments. The American Naturalist, 143, 222-257.
Pachauri, R. K. and Reisinger, A. (2007) Climate Change 2007: Synthesis Report - Contribution of Working Groups I, II and III to the Fourth Assessment Report of the Intergovernmental Panel on Climate Change. IPCC, Geneva.
Pagiola, S. (2008) Payments for Environmental Services in Costa Rica. Ecological Economics, 65, 712-724.
Parry, M. L., Canziani, O. F., Palutikof, J. P., Van Der Linden, P. J. and Hanson, C. E. (2007) Climate Change 2007: Impacts, Adaptation and Vulnerability.
Contribution of Working Group II to the Fourth Assessment Report of the Intergovernmental Panel on Climate Change, 2007. Cambridge University Press, Cambridge, UK.
Patz, J. A., Graczyk, T. K., Gellera, N. and Vittor, A. Y. (2000) Effects of environmental change on emerging parasitic diseases. International Journal for Parasitology, 30, 1395-1405.
Pavlin, B., Schloegel, L. M. and Daszak, P. (2009) Risk of Importing Zoonotic Diseases through Wildlife Trade, United States. Emerging Infectious Disease, 15, 1721-1726.
Pearce, D. W. (2003) The Social Cost of Carbon and its Policy Implications. Oxford Review of Economic Policy, 19, 362-384.
Perrings, C., Dehnen-Schmutz, K., Touza, J. and Williamson, M. (2005) How to manage biological invasions under globalization. Trends in Ecology and Evolution, 20, 212-215.
Perrings, C., Fenichel, E. and Kinzig, A. (2010a) Externalities of globalization: bioinvasions and trade. Bioinvasions and Globalization: Ecology, Economics, Management and Policy (ed. by C. Perrings and H. Mooney and M. Williamson). Oxford University Press, Oxford.
Perrings, C., Fenichel, E. and Kinzig, A. (2010b) Globalization and invasive alien species: trade, pests and pathogens. Globalization and Bioinvasions: Ecology, Economics, Management and Policy (ed. by C. Perrings and H.A. Mooney and M. Williamson), pp 42-55. Oxford University Press, Oxford.
Perrings, C., Folke, C. and Maler, K. G. (1992) The Ecology and Economics of Biodiversity Loss - the Research Agenda. Ambio, 21, 201-211.
Perrings, C. and Gadgil, M. (2003) Conserving biodiversity: reconciling local and global public benefits. Providing Global Public Goods: Managing Globalization (ed. by I. Kaul and P. Conceicao and K. Le Goulven and R.L. Mendoza), pp 532-555. Oxford University Press, Oxford.
Perrings, C. and Halkos, G. (2010) Biodiversity loss and income growth in poor countries: the evidence. ecoSERVICES Working Paper, ASU, Tempe.
Perrings, C. and Vincent, J. R. (2003) Natural resource accounting and economic development, Edward Elgar, Cheltenham.
Perrings, C. and Walker, B. (1997) Biodiversity, resilience and the control of ecological-economic systems: The case of fire-driven rangelands. Ecological Economics, 22, 73-83.
Perrings, C. and Walker, B. H. (2005) Conservation in the optimal use of rangelands. Ecological Economics, 49, 119-128.
Peters, R. L. and Lovejoy, T. E. (1994) Global Warming and Biological Diversity. Yale University Press, New Haven, CT.

Environment Department Papers38
Biodiversity, Ecosystem Services, and Climate Change — The Economic Problem
Phelps, J., Guerrero, M., Dalabajan, D., Young, B. and Webb, E. L. (2010) What makes a REDD country? Global Environmental Change 20, 322-332
Polasky, S. (2010) A Model of Prevention, Detection, and Control for Invasive Species. Globalization and Bioinvasions: Ecology, Economics, Management and Policy (ed. by C. Perrings and H. Mooney and M. Williamson), pp 100-109. Oxford University Press, Oxford.
Polasky, S., Nelson, E., Lonsdorf, E., Fackler, P. and Starfield, A. (2005) Conserving species in a working landscape: land use with biological and economic-objectives. Ecological Applications, 15, 2209-2209.
Pratt, J. W. (1964) Risk Aversion in the Small and in the Large. Econometrica, 32, 122-136.
Rojas, M. and Aylward, B. (2003) What are we learning from experiences with markets for environmental services in Costa Rica? A review and critique of the literature. International Institute for Environment and Development, London.
Rweyemamu, M. M. and Astudillo, V. M. (2002) Global perspective for foot and mouth disease control. Revue Scientifique Et Technique De L Office International Des Epizooties, 21, 765-773.
Sandler, T. (2004) Global Collective Action, edn. Cambridge University Press, Cambridge.
Semmens, B. X., Buhle, E. R., Salomon, A. K. and Pattengill-Semmens, C. V. (2004) A hotspot of non-native marine fishes: evidence for the aquarium trade as an invasion pathway. Marine Ecology Progress Series, 266, 239-244.
Sharov, A. A., Leonard, D., Liebhold, A. M. and Clemens, N. S. (2002) Evaluation of preventive treatments in low-density gypsy moth populations using pheromone traps. Journal of Economic Entomology, 95, 1205-1215.
Sharov, A. A., Liebhold, A. M. and Roberts, E. A. (1998) Optimizing the use of barrier zones to slow the spread of gypsy moth (Lepidoptera : Lymantriidae) in North America. Journal of Economic Entomology, 91, 165-174.
Smale, M., Hartell, J., Heisey, P. W. and Senauer, B. (1998) The contribution of genetic resources and diversity to wheat production in the Punjab of Pakistan. American Journal of Agricultural Economics, 80, 482-493.
Smith, K. F. (2008) U.S. regulation of live animal trade. Invited, Trade and Biological Resources News Digest. A publication of the International Centre for Trade and Sustainable Development, 3, 6-7.
Smith, K. F., Behrens, M., Schloegel, L. M., Marano, N., Burgiel, S. and Daszak, P. (2009a) Reducing the Risks of the Wildlife Trade. Science, 324, 594-595.
Smith, R. D., Keogh-Brown, M. R., Barnett, A. and Tait, J. (2009b) The economy-wide impact of pandemic influenza on the UK: a computable general equilibrium modelling experiment. British Medical Journal, 339, 10.1136/bmj.b4571.
Steffen, W., Burbidge, A. A., Hughes, L., Kitching, R., Lindenmayer, D., Musgrave, W., Stafford Smith, M. and Werner, P. A. (2010) Australia’s Biodiversity and Climate Change, CSIRO, Canberra.
Stern, D. I. (1998) Progress on the Environmental Kuznets Curve. Environment and Development Economics, 3, 381-394.
Stern, D. I. (2004) The rise and fall of the Environmental Kuznets Curve. World Development, 32, 1419-1439.
Stern, D. I. and Common, M. S. (2001) Is there an Environmental Kuznets Curve for sulphur. Journal of Environmental Economics and Management, 41, 162-178.
Stern, N. H. (2006) The Economics of Climate Change: The Stern Review, edn. Cambridge University Press, Cambridge, UK.
Sumner, D. A., Bervejillo, J. E. and Jarvis, L. S. (2005) Public policy, invasive species and animal disease management. International Food and Agribusiness Management Review 8, 78–97.
Swart, J. A. A. (2003) Will direct payments help biodiversity? Science, 299, 1981.
Tatem, A. J., Hay, S. S. and Rogers, D. J. (2006) Global traffic and disease vector dispersal. Proceedings of the National Academy of Sciences, 103, 6242–6247.
TEEB. (2009) TEEB Climate Issues Update. UNEP, Nairobi.
Thebault, E. and Loreau, M. (2006) The relationship between biodiversity and ecosystem functioning in food webs. Ecological Research, 21, 17-25.
Thomas, C. and Ohlemüller, R. (2010) Climate change and species distributions: an alien future? Bioinvasions and Globalization: Ecology, Economics, Management, and Policy (ed. by C. Perrings and H. Mooney and M. Williamson), pp 19-29. Oxford University Press, Oxford.
Thomas, C. D., Cameron, A., Green, R. E., Bakkenes, M., Beaumont, L. J., Collingham, Y. C., Erasmus, B. F. N., De Siqueira, M. F., Grainger, A., Hannah, L., Hughes, L., Huntley, B., Van Jaarsveld, A. S., Midgley, G. F.,

39Environmental Economics Series
References
Miles, L., Ortega-Huerta, M. A., Townsend Peterson, A., Phillips, O. L. and Williams, S. E. (2004) Extinction risk from climate change. Nature, 427, 145-148.
Tilman, D. (1982) Resource competition and community structure. Princeton University Press, Princeton.
Tilman, D. (1988) Plant strategies and the dynamics and structure of plant communities. Princeton University Press, Princeton.
Tilman, D., Lehman, C. L. and Bristow, C. E. (1998) Diversity–stability relationships: statistical inevitability or ecological consequence? American Naturalist, 151, 277–282.
Tilman, D., May, R. M., Polasky, S. and Lehman, C. L. (2005) Diversity, productivity and temporal stability in the economies of humans and nature. Journal of Environmental Economics and Management, 49, 405–426.
Tol, R. S. J. (2002) Estimates of the damage costs of climate change – part II: dynamic estimates. Environmental and Resource Economics, 21, 135-160.
U.S. Environmental Protection Agency. (2010) Inventory of U.S. Greenhouse Gas Emissions and Sinks: 1990 – 2008. U.S. Environmental Protection Agency, Washington DC.
Vila, M. and Pujadas, J. (2001) Land-use and socio-economic correlates of plant invasions in European and North African countries. Biological Conservation, 100, 397-401.
Vitousek, P. M. and Hooper, D. U. (1993) Biological diversity and terrestrial ecosystem biogeochemistry. Biodiversity and Ecosystem Function. (ed. by E.-D. Schulze and H.A. Mooney), pp 3-14. Springer-Verlag, Berlin.
Willis, K. J. and Bhagwat, S. A. (2009) Biodiversity and Climate Change. Science, 326, 806-807.
World Bank. (2006) Where is the wealth of nations? : measuring capital for the 21st century, edn. The World Bank, Washington, DC.
World Commission on Environment and Development. (1987) Our Common Future, edn. Island Press, Washington D.C.
Wunder, S. (2007) The efficiency of payments for environmental services in tropical conservation. Conservation Biology, 21, 48-58.
Wunder, S., Engel, S. and Pagiola, S. (2008) Taking stock: a comparative analysis of payments for environmental services programs in developed and developing countries. Ecological Economics, 65, 834-852.

Printed on recycled paper stock, using soy inks.
E N V I R O N M E N T D E P A R T M E N T P A P E R S
Susta inab le Deve lopment V ice Pres idency
Environment DepartmentT H E W O R L D B A N K
1818 H Street, NWWashington, D.C. 20433Telephone: 202-473-3641Facsimile: 202-477-0565
Paper number 120
Environmental Economics Series
Biodiversity, Ecosystem Services, and Climate Change
The Economic Problem
Charles Perrings
November 2010