Embed Size (px)
Citation preview

The 26th International Conference on Offshore Mechanics and Arctic Engineering June 10-15, 2007, San Diego, California USA
Paper No. OMAE2007-29450
ASSESSING THE EFFECTS OF IMPACT FORCES ON SUBSEA FLOWLINES AND PIPELINES
Chris Alexander
Stress Engineering Services, Inc. Houston, Texas
ABSTRACT Damage associated with external impact can be a critical component in operating subsea flowlines and pipelines. External damage typically involves impact with anchors, although consideration of dropped objects is also important. Historically, operators assess damage after it occurs in an attempt to determine and establish mechanical integrity. For more than 30 years research has been performed studying the effects of external damage on subsea pipelines. In recent years there has been an interest in proactively addressing the potential for damage and attempting to quantify the severity of damage in terms of impact energies associated with anchors and dropped objects. This paper presents insights garnered in assessing the severity of pipeline damage in the form of dents and gouges. Additionally, research associated with impact forces including experimental work is included as part of the presentation, as well as limit analysis techniques using finite element methods. The primary purpose of this paper is to communicate to offshore pipeline operators a methodology that can be employed to assess the severity of damage and quantify tolerance levels in terms of impact energy. INTRODUCTION One of the most significant challenges in operating offshore pipelines is assessing the effects of external damage. When a direct impact with a pipeline occurs, an operator is required to determine whether the pipeline should continue to operate, operate with reduced pressure, or completely shut down the pipeline. In an era where pressure exists to maximize throughput, there are few incentives for either reducing pressure or shutting down the line. As part of the decision making process, operators are routinely required to address the following: • Is the pipe damage of sufficient magnitude to warrant a shut
down condition? • If the damage is relatively minor, for how long can we continue
to operate the pipeline safely? • Who caused the damage and how was it done? • How much direct force was applied to the line? • To what extent (axially and transversely) has the pipeline
displaced and what local damage exists? • Was the pipeline lifted above the seafloor and if so, was the
height of sufficient magnitude to buckle the line? • What information is needed in interfacing with regulators? In an ideal world, an operator would have precise answers to all of these questions. The adage Information is the reduction of uncertainty is appropriate for this discussion.
Frequently, when significant damage occurs to a subsea pipeline, operators contract outside consultants to assist in assessing the damage. These individuals will draw from previous experience and possibly construct finite element models to determine such factors as the force required to displace or lift a pipeline. This paper addresses a range of subjects associated with external damage of pipelines by compiling insights and results from previous projects and studies. Topics of discussion include the following: • Background on defect types • Quantifying impact damage • Methods for assessing damage severity • Recommended guidelines for operators BACKGROUND One of the most critical elements in assessing pipeline damage involves classifying defects. There is a significant amount of information available in the open literature (see the References section of this paper). However, one of the challenges is collecting and organizing information in a manner that can be used to assess damage severity. This is one of the main purposes of this paper. The second purpose is to provide a systematic methodology for operators and pipeline service companies who are tasked with making decisions about what to do when pipeline damage occurs. Because of the extensive research that has been conducted world-wide relating to dented pipelines, it is possible to draw information required on a range of defect types. The driving motivation for many research programs is to develop a better understanding of damaged pipelines in an effort to characterize their behavior. As with many areas of engineering, the ability to accurately predict the response behavior of structures is important to ensure adequate safety and consistent performance. The complexities associated with damaged pipelines make this a challenging task. Material issues, corrosion, cyclic pressure conditions, soil-pipe interactions and complicated stress fields are but a few examples. Provided below are the major defect classifications that typically arise when assessing pipeline damage. • Plain dents • Constrained dents • Gouges • Mechanical damage • Wrinkles or kinks

Without going into great detail, it is possible to provide readers with a general sense of the relative severity of the above defect classes. Mechanical damage typically involves a dent with a gouge, as would be expected when an anchor impacts a pipeline and generates external metal loss along with local indentation. It is possible that the mechanical damage can fail either immediately or result in a delayed failure at some point in the future. The least severe of the preceding list is a plain dent (constrained and/or unconstrained), which is typically associated with local deformation of the pipe absent of any sharp kinks or wrinkles. These types of defects rarely fail due to pressure overload, but typically fail due to cyclic pressure service after relatively large cycle counts. Another comment worth noting is that often time wrinkles and kinks can pose a significant threat to pipeline integrity. The author was involved in a project several years ago that involved a 30-inch gas pipeline that had been subjected to external impact. A caliper tool showed a relatively benign dent; however, closer upon inspection from a diver it was clear that extremely sharp kinks existed in the area of impact. As a result, the operator was forced to cut out the damaged section from the pipe. Experimental and analytical results show that sharp kinks can fail in a relatively short period of time when subjected to cyclic pressures. QUANTIFYING IMPACT DAMAGE While a relatively large body of research exists on the effects of pipeline damage on the integrity of a pipeline system, what is absent to a large extent are discussions on what forces and energy levels were required to cause the types of damage of interest in this paper. Provided are discussions and methods for assessing how much force is required to dent a pipe. Additionally, information is provided on how much impact energy is required to generate a particular defect type. Estimating Dent Force In Palmer’s Subsea Pipeline Engineering book [15] a closed-form equation is provided for estimating the force required to cause a certain dent depth considering pipe geometry and material yield strength. Consider the following equation.
32
2
323
tYPU d ⋅
⋅=π
Where: Ud Vertical displacement (inches) P Dent force (kips) Y Material yield strength (ksi) t Pipe wall thickness (inches) To evaluate the accuracy of the above equation, data was extracted from a previous dent test program that included capturing force versus deflection during the indentation of a 12.75-inch x 0.375-inch, Grade X60 pipe to a depth of 15 percent of the pipe’s outer diameter (1.91 inches). Using the above equation, the force is calculated to be 110 kips. Figure 1 and Figure 2 show the test set-up and load-deflection data for the dent work. As noted in the latter figure, the force required to cause the target dent depth was approximately 114 kips. This load is within 5 percent of the calculated force. Although more complex formulations can be derived, it is clear that the preceding equation provides a reasonable accurate solution. It should also be noted that the above equation does not account for the effects of internal pressure at the time of indentation. One might be tempted to ask after having gone through this exercise, what is the point of knowing the force required to cause of particular
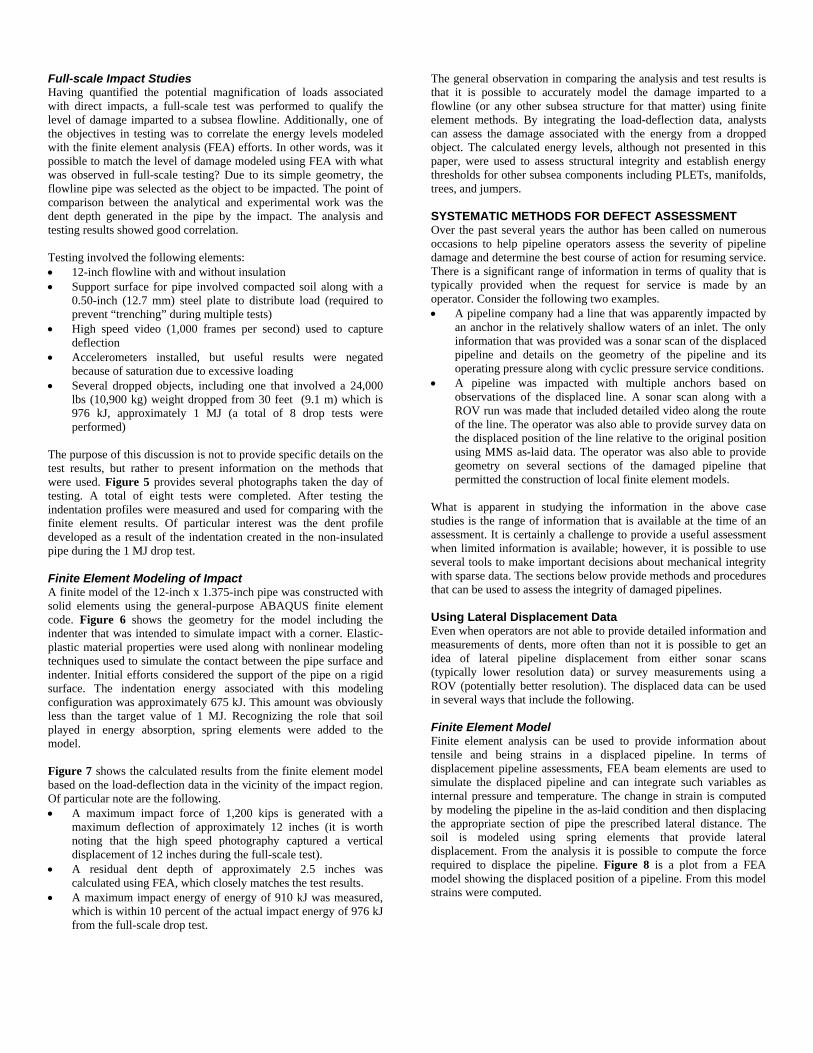
defect? More often than not, operators will have more information on the geometry of the dent than they will have regarding the indentation force. Dent depths are relative easy to get if the impacted surface of the pipe is accessible. ROVs can be used to measure not only dent depth, but also actual profiles (dent depth as a function of length). Once an indentation force is determined several pieces of information also become available including: (1) what type of object could have generated an impact force on this scale, (2) how much energy has been imparted to the pipeline, and (3) if the pipe has been moved it is possible to achieve a rudimentary estimate of how much displacement could be associated with the movement. Impact Mechanics Over the years there has been increased interest in assessing how much damage can be imparted to a subsea structure. Several in-depth studies have been conducted that include the use finite element models as well as full-scale testing. What is important about this discussion is that if an object is dropped from a platform, operators can more accurately assess the potential threat by understanding the relationship between impact energy and associated damage. Additionally, it is also possible using the insights and methodology presented in this paper to design protection systems for subsea pipelines subject to potential interactions with dropped objects. Experimental work performed by the author confirms that an amplification of 40 g’s is not unreasonable when considering impact force. Additionally, experimental work performed by Bharracharya et al [8] confirms the validity of this observation. The sections that following provide details on sub-scale and full-scale dropped object experiments, as well as finite element analyses used to simulate the test results on a 12-inch flowline pipe. By establishing correlation between experimental and analytical results, it was possible to model with confidence other subsea structures such as jumpers, manifolds, and trees. Sub-scale Impact Studies One of the questions posed early in the study of impacted objects was what magnification of load results when two objects impact one another. Most often this involves impact from a falling object on a stationary subsea component. To address this particular issue, a series of tests were performed to measure the impact force (in the form of acceleration) generated by a falling object. Results are presented for a steel mass having a weight of 150 lbs that was dropped from a height of 12 inches on the following surfaces: (1) non-insulated 12-inch diameter pipe (steel on steel), (2) non-insulated 12-inch diameter pipe in sand, and (3) non-insulated 12-inch diameter pipe placed on block supports spanning 4-feet. Figure 3 provides photographs showing certain elements of the test program. Note that a support trough was constructed to house the pipe and sand. A high speed data acquisition system was used to record accelerometers at a rate of 10,000 scans per second. Figure 4 plots the results from this particular test where the following are noted (the impact factor corresponds to the number of “g’s” measured by the accelerometer). • Impact factor of for steel on steel • Impact factor of 12 for steel on pipe in sand • Impact factor of 12 for steel on simple supports in sand Once this information was collected (quantification), the next phase of testing involved full-scale efforts to qualify the severity of an impact level corresponding to 1 MJ of energy.
Full-scale Impact Studies Having quantified the potential magnification of loads associated with direct impacts, a full-scale test was performed to qualify the level of damage imparted to a subsea flowline. Additionally, one of the objectives in testing was to correlate the energy levels modeled with the finite element analysis (FEA) efforts. In other words, was it possible to match the level of damage modeled using FEA with what was observed in full-scale testing? Due to its simple geometry, the flowline pipe was selected as the object to be impacted. The point of comparison between the analytical and experimental work was the dent depth generated in the pipe by the impact. The analysis and testing results showed good correlation. Testing involved the following elements: • 12-inch flowline with and without insulation • Support surface for pipe involved compacted soil along with a
0.50-inch (12.7 mm) steel plate to distribute load (required to prevent “trenching” during multiple tests)
• High speed video (1,000 frames per second) used to capture deflection
• Accelerometers installed, but useful results were negated because of saturation due to excessive loading
• Several dropped objects, including one that involved a 24,000 lbs (10,900 kg) weight dropped from 30 feet (9.1 m) which is 976 kJ, approximately 1 MJ (a total of 8 drop tests were performed)
The purpose of this discussion is not to provide specific details on the test results, but rather to present information on the methods that were used. Figure 5 provides several photographs taken the day of testing. A total of eight tests were completed. After testing the indentation profiles were measured and used for comparing with the finite element results. Of particular interest was the dent profile developed as a result of the indentation created in the non-insulated pipe during the 1 MJ drop test. Finite Element Modeling of Impact A finite model of the 12-inch x 1.375-inch pipe was constructed with solid elements using the general-purpose ABAQUS finite element code. Figure 6 shows the geometry for the model including the indenter that was intended to simulate impact with a corner. Elastic-plastic material properties were used along with nonlinear modeling techniques used to simulate the contact between the pipe surface and indenter. Initial efforts considered the support of the pipe on a rigid surface. The indentation energy associated with this modeling configuration was approximately 675 kJ. This amount was obviously less than the target value of 1 MJ. Recognizing the role that soil played in energy absorption, spring elements were added to the model. Figure 7 shows the calculated results from the finite element model based on the load-deflection data in the vicinity of the impact region. Of particular note are the following. • A maximum impact force of 1,200 kips is generated with a
maximum deflection of approximately 12 inches (it is worth noting that the high speed photography captured a vertical displacement of 12 inches during the full-scale test).
• A residual dent depth of approximately 2.5 inches was calculated using FEA, which closely matches the test results.
• A maximum impact energy of energy of 910 kJ was measured, which is within 10 percent of the actual impact energy of 976 kJ from the full-scale drop test.
The general observation in comparing the analysis and test results is that it is possible to accurately model the damage imparted to a flowline (or any other subsea structure for that matter) using finite element methods. By integrating the load-deflection data, analysts can assess the damage associated with the energy from a dropped object. The calculated energy levels, although not presented in this paper, were used to assess structural integrity and establish energy thresholds for other subsea components including PLETs, manifolds, trees, and jumpers. SYSTEMATIC METHODS FOR DEFECT ASSESSMENT Over the past several years the author has been called on numerous occasions to help pipeline operators assess the severity of pipeline damage and determine the best course of action for resuming service. There is a significant range of information in terms of quality that is typically provided when the request for service is made by an operator. Consider the following two examples. • A pipeline company had a line that was apparently impacted by
an anchor in the relatively shallow waters of an inlet. The only information that was provided was a sonar scan of the displaced pipeline and details on the geometry of the pipeline and its operating pressure along with cyclic pressure service conditions.
• A pipeline was impacted with multiple anchors based on observations of the displaced line. A sonar scan along with a ROV run was made that included detailed video along the route of the line. The operator was also able to provide survey data on the displaced position of the line relative to the original position using MMS as-laid data. The operator was also able to provide geometry on several sections of the damaged pipeline that permitted the construction of local finite element models.
What is apparent in studying the information in the above case studies is the range of information that is available at the time of an assessment. It is certainly a challenge to provide a useful assessment when limited information is available; however, it is possible to use several tools to make important decisions about mechanical integrity with sparse data. The sections below provide methods and procedures that can be used to assess the integrity of damaged pipelines. Using Lateral Displacement Data Even when operators are not able to provide detailed information and measurements of dents, more often than not it is possible to get an idea of lateral pipeline displacement from either sonar scans (typically lower resolution data) or survey measurements using a ROV (potentially better resolution). The displaced data can be used in several ways that include the following. Finite Element Model Finite element analysis can be used to provide information about tensile and being strains in a displaced pipeline. In terms of displacement pipeline assessments, FEA beam elements are used to simulate the displaced pipeline and can integrate such variables as internal pressure and temperature. The change in strain is computed by modeling the pipeline in the as-laid condition and then displacing the appropriate section of pipe the prescribed lateral distance. The soil is modeled using spring elements that provide lateral displacement. From the analysis it is possible to compute the force required to displace the pipeline. Figure 8 is a plot from a FEA model showing the displaced position of a pipeline. From this model strains were computed.

First Principle Bending Strain Calculations While it is not also possible or practical to construct a detailed finite element model of a damaged pipeline; it is possible to calculate bending strains based on the changing radius of curvature in a laterally displaced pipeline. Using a series of mathematic expressions to calculate radius of curvature, the estimate bending strain is calculated. Figure 9 provides a schematic showing the method for performing this type of assessment (equations based on law of sin and cosine). The authors highly recommend that this assessment method be performed once displacement data is available. An EXCEL spreadsheet can be programmed to accept the mathematical expressions that will permit the radius of curvature to be calculated as a function of axial position along the length of the line. Figure 10 is a plot that shows bending strain as a function of axial position along the line. What is impressive about this approach is that although its accuracy is somewhat limited, it provides an excellent first pass assessment of areas of the pipeline where elevated bending strains are likely to exist. Before any detailed investigations are performed, this method should be used to provide an overall assessment of damage to the pipeline. Using Dent Profile Data The greatest level of accuracy is achieved in assessing the severity of dented pipelines when inspection efforts determine the profile of the damaged section of pipe. Once this information is obtained, it is possible to perform a finite element analysis of the damaged area using elastic-plastic material properties to capture the residual stress state of the pipe. Cyclic pressure can be modeled in an effort to estimate the alternating stress in the damaged section of pipe. Provided below are steps involved in an example dent analysis using finite element methods. 1. Apply internal pressure of 1,026 psi to pipe (MAOP) 2. Move indenter vertically down into pipe 4.25 inches 3. Remove indenter to obtain residual dent (analysis resulted in
depth of 1.52 inches) 4. Remove internal pressure 5. Re-apply internal pressure of 1,026 psi Figure 11 shows the basic layout for the finite element model used to calculate local stress concentrations and Figure 12 contains several contour plots from the FEA model including Steps #1, 2, and 3. Assuming that shakedown to elastic action has occurred between Step #4 and #5 (condition at which no appreciable deformation of the dent is likely with continued pressure cycling), the alternating stress associated with MAOP can be calculated. This value can then be used as input into a fatigue curve to estimate remaining life associated with cyclic service conditions. It is the author’s observation that the vast majority of offshore pipeline damage may be described as plain dents, which typically fail due to fatigue. The fatigue life is normally governed by the alternating stresses due to cyclic pressure service, although it is possible that under extreme condition thermal loads could contribute. Integrating Experimental Data A significant body of data has been presented in previous sections of this paper. When called upon to perform defect assessments, the authors frequently draw from insights gained by previous research efforts. If the body of data is sufficiently large, it is possible for assessment efforts to compare the geometry for a particular defect
from an existing data point within the research data. Knowing the performance of the research data points under specific service conditions (e.g. static and/or cyclic pressure), the future performance of the damaged pipeline can be estimated, Greater accuracy in this effort is achieved when more information is known about both the research and actual damage. Examples include material properties (including toughness) cyclic pressure history, and geometry of the pipeline damage in the form of dent profile. RECOMMENDED GUIDELINES One of the primary purposes of this paper is to suggest for the pipeline industry a systematic approach for assessing defect severity. When done properly, it is possible to integrate important information such as survey data for a displaced pipeline and ROV videos showing images of damaged sections of a pipeline. Provided in Figure 13 is a flow chart that provides elements of a proposed process for integration of information into a pipeline damage assessment. The following steps are included in this effort. 1. Detect damaged section of pipe (usually via in-line inspection
methods or using a ROV) 2. Assess the severity 3. Determine acceptability by ranking relative severity if multiple
defects exist 4. Repair or remove the damaged section of pipeline 5. Restore service including hydrotesting required 6. Put line back in service and continue operation CONCLUSIONS The paper has provided a wide array of information on research efforts associated with studies on damaged pipelines. One of the great challenges in presenting such an extensive body of data is the potential for overwhelming the reader. While this was certainly not the intent of this paper, it is important to recognize that some form of research has likely been completed on every form of damaged pipeline imaginable. One of the great challenges for research is getting key findings of research efforts into the hands of those who can use them the most. To a certain extent, that has been the aim of this paper. By implementing the proposed methods included in this paper, operators can invoke a systematic process for assessing defect severity. Even applying the six step process outlined in Figure 13 is a good starting point. Another important consideration is that once damage has been detected, operators are encouraged to start collecting and cataloguing information as soon as possible. It has been the author’s observation that when this done, the likelihood for performing a successful damage assessment is greatly increased. REFERENCES [1] Alexander, C. R., Kiefner, J. F., and J. R. Fowler, Repair of
Dents Combined with Gouges Considering Cyclic Pressure Loading, 8th Annual International Energy Week Conference and Exhibition, Houston, Texas, January 1997.
[2] Alexander, C. R. and J. F. Kiefner, Effects of Smooth and Rock Dents on Liquid Petroleum Pipelines, API Publication 1156 (First Edition), American Petroleum Institute, Washington, D.C., November 1997.
[3] Alexander, C. R. and L. M. Connelly, Analytical Recreation of a Dent Profile Considering Varied Soil, Operating and Boundary Conditions, 1998 Energy Sources Technology Conference & Exhibition, Sheraton Astrodome Hotel, Houston, Texas, February 2-4, 1998.

[4] Alexander, C. R., Analysis of Dented Pipeline Considering
Constrained and Unconstrained Dent Configurations, 1999 Energy Sources Technology Conference & Exhibition, Sheraton Astrodome Hotel, Houston, Texas, February 1-3, 1999.
[5] American Society of Mechanical Engineers, Manual for Determining the Remaining Strength of Corroded Pipelines, ASME B31G-1991, New York, New York, 1991 edition.
[6] American Society of Mechanical Engineers, Liquid Transportation System for Hydrocarbons, Liquid Petroleum Gas, Anhydrous Ammonia and Alcohols, ASME B31.4, New York, New York, 1992 edition.
[7] American Society of Mechanical Engineers, Gas Transmission and Distribution Piping Systems, ASME B31.8, New York, New York, 1995 edition.
[8] Bharracharya, K.C., et al,, Impact Studies on Structural Components Using a Free-flight Drop Tower, Experimental Techniques, pages 52 – 58, March/April 2006.
[9] Fowler, J. R., C. R. Alexander, P.J. Kovach, and L.M. Connelly, Cyclic Pressure Fatigue Life of Pipelines with Plain Dents, Dents with Gouges, and Dents with Welds, Prepared by Stress Engineering Services for the Offshore and Onshore Applications Supervisory Committee of the Pipeline Research Committee, PR-201-9324, June 1994.
[10] Keating, P. B. and R. L. Hoffman, Fatigue Behavior of Dented Petroleum Pipelines (Task 4), Office to the Office of Pipeline Safety, U. S. Department of Transportation, Texas A&M University, May 1997.
[11] Kiefner, J. F., W. A. Bruce, and D. R. Stephens, Pipeline Repair Manual, Prepared for the Line Pipe Research Supervisory Committee of the Pipeline Research Committee, 1994.
[12] Kiefner, J. F., C. R. Alexander, and J. R. Fowler, Repair of Dents Containing Minor Scratches, Proceedings from Ninth Symposium on Pipeline Research, Houston, Texas, October, 1996.
[13] Maxey, W.A., Outside Force Defect Behavior, NG-18 Report No. 162, A.G.A. Catalog No. L51518, 1986.
[14] Palmer, A. and R. King, Subsea Pipeline Engineering, Pennwell, Tulsa, Oklahoma, 2003.
[15] Rosenfeld, M. J. Investigations of Dent Rerounding Behavior, Proceedings of the International Pipeline Conference, Vol. 1, pages 299-307, Calgary, Canada, 1998.
Figure 1 – Efforts associated with dent work including final dent depth

Figure 2 – Indentation force as a function of dent depth
Figure 3 – Experimental set-up for sub-scale testing
Indentation as a Function of DisplacementIndentation of a 12.75-inch x 0.406-inch, Grade X65 pipe using a 6-inch w ide f lat plate
Indentation depth of 15 percent (dent depth divided by pipe outside diameter)
0
20000
40000
60000
80000
100000
120000
0.00 0.50 1.00 1.50 2.00 2.50
Dent Depth (inches)
Dent
For
ce (l
bs)
Indentation of a 12.75-inch x 0.375-inch, Grade X60 pipe using a 6-inch wide flat plate.Indentation depth of 15 percent (dent depth divided by the pipe outside diameter)
150 lb weight above pipe
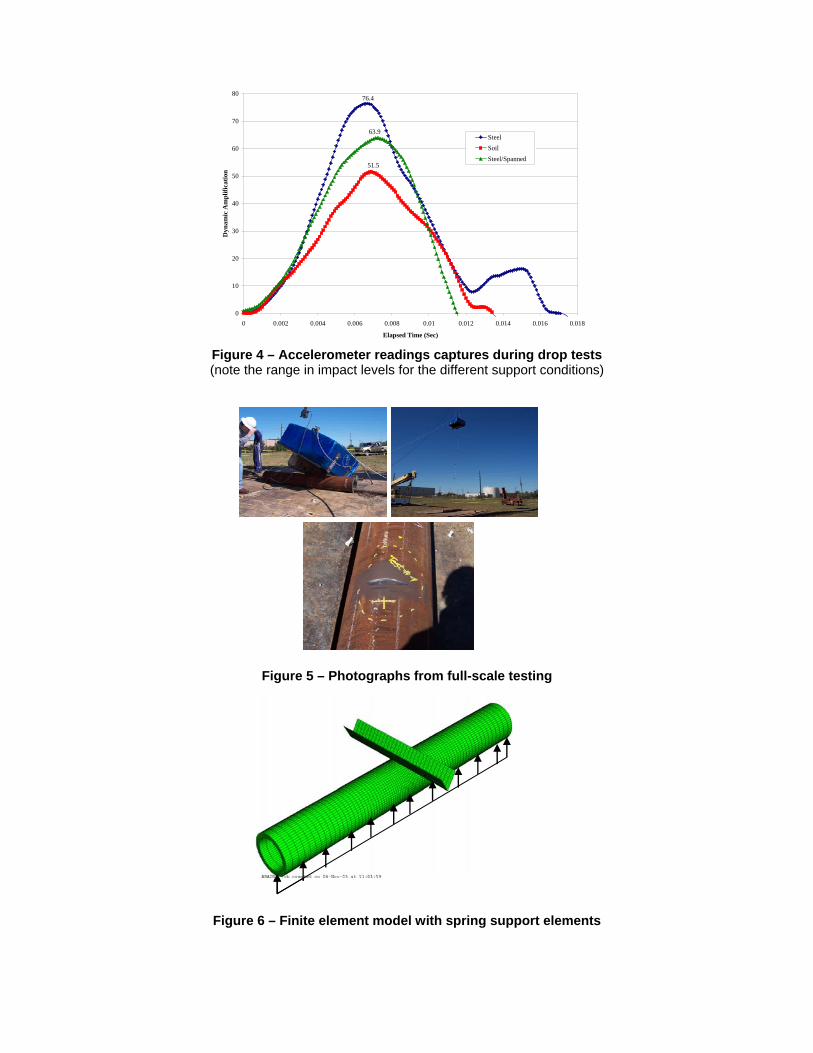
Figure 4 – Accelerometer readings captures during drop tests (note the range in impact levels for the different support conditions)
Figure 5 – Photographs from full-scale testing
Figure 6 – Finite element model with spring support elements
0
10
20
30
40
50
60
70
80
0 0.002 0.004 0.006 0.008 0.01 0.012 0.014 0.016 0.018
Elapsed Time (Sec)
Dyn
amic
Am
plifi
catio
n
SteelSoilSteel/Spanned
51.5
63.9
76.4

Figure 7 – Calculated force and energy results from finite element model
0
200
400
600
800
1000
1200
1400
-13-12-11-10-9-8-7-6-5-4-3-2-10
Deflection (in)
Forc
e (k
ip)
Finite Element Model ResultsSimulation of 24,000 lbs dropped from 30 feet on a 12.75-inch x 1.375-inch flowline
pipe having soil support modeled with a stiffness of 205 lbs/inch
Load versus Deflection Plot (1,200 kip maximum load)
Energy versus Deflection Plot (910 kJ maximum energy)
0
100
200
300
400
500
600
700
800
900
1000
-13-12-11-10-9-8-7-6-5-4-3-2-10
Deflection (in)
Ener
gy (K
J)

Figure 8 – Finite element model showing displaced position of pipeline
Figure 9 – Calculating bending strain using first principles
(t in the above formulation is the outer radius of the pipe)
212
212 )()( yyxxa −+−=
223
223 )()( yyxxb −+−=
213
213 )()( yyxxc −+−=
abcbaq
2
222 −+=
212 q
cR−
=
Rt
2=ε
a b
c
R
1
2
3
X
Y
Nodal points
a b
c
R
1
2
3
X
Y
Nodal points
r
X
Y
Rr
t
Nomenclaturee – Bending straint – Thickness of beamr – Radius of curvature (centerline)R – Radius of mandrel
2tR +=ρ

Figure 10 – Bending strain as a function of position calculated using curvature
Figure 11 – Methods for assessing dent damage using finite element methods
Strain as a Function of Position Along Pipeline
0
0.02
0.04
0.06
0.08
0.1
0.12
0.14
0.16
0.18
0.00 5000.00 10000.00 15000.00 20000.00 25000.00
Pipeline Position Measured from Southw est (fee t)
Ben
ding
Str
ain
base
d on
Cur
vatu
re
(per
cent
)
Indenter (12” long with 3” radius ends)
Analysis Steps:
1. Apply an internal pressure of 50% SMYS
2. Indent pipe with indenter to desired depth (and force)
3. Remove indenter (to achieve residual dent depth)
4. Remove pressure
5. (Typically) Calculate alternating stress to determine design fatigue life
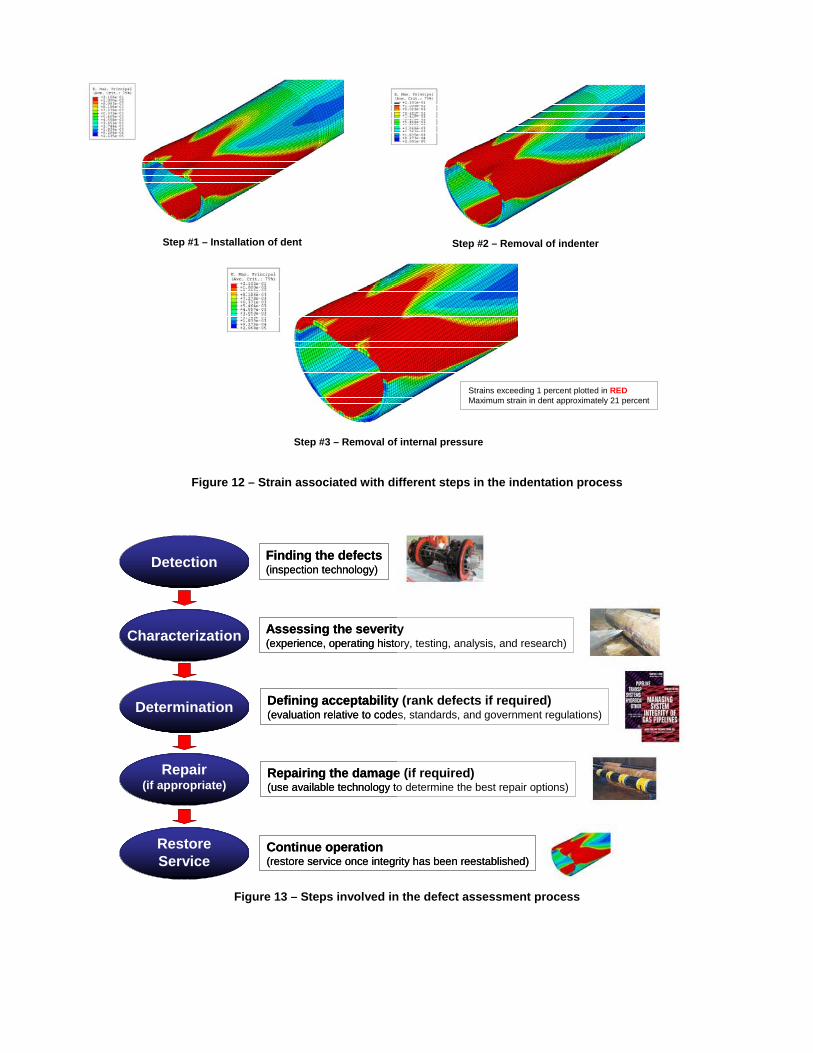
Figure 12 – Strain associated with different steps in the indentation process
Figure 13 – Steps involved in the defect assessment process
Step #1 – Installation of dent Step #2 – Removal of indenter
Step #3 – Removal of internal pressure
Strains exceeding 1 percent plotted in REDMaximum strain in dent approximately 21 percent
Detection
Characterization
Determination
Repair(if appropriate)
RestoreService
Finding the defects(inspection technology)
Assessing the severity(experience, operating history, testing, analysis, and research)
Defining acceptability (rank defects if required)(evaluation relative to codes, standards, and government regulations)
Repairing the damage (if required)(use available technology to determine the best repair options)
Continue operation(restore service once integrity has been reestablished)