Embed Size (px)
Citation preview
Copyright ©2008 by NACE International. Requests for permission to publish this manuscript in any form, in part or in whole must be in writing to NACE International, Copyright Division, 1440 South creek Drive, Houston, Texas 777084. The material presented and the views expressed in this paper are solely those of the author(s) and are not necessarily endorsed by the Association. Printed in the U.S.A.
Evaluation of Classification and Prioritization Criteria Based on the Results of Direct Examinations
S.M. Segall, P. Eng. R.A. Gummow, P. Eng.
Corrosion Service Company Limited 205 Riviera Drive
Markham, ON, Canada L3R 5J8
R.G. Reid, P. Eng. Union Gas Limited
A Spectra Energy Company 50 Keil Drive North
Chatham, ON, Canada N7M 5M1
ABSTRACT
The ECDA process requires a continuous effort from the pipeline operator to improve the reliability of classification and prioritization criteria.
Based on the results of the direct examinations, these criteria can be up-graded or down-graded as
part of the retrospective evaluation and the number of such re-evaluations can be used as criteria in the long-term assessment of the ECDA effectiveness.
This paper covers criteria evaluation and specific lessons learned by comparing the results of the
direct examinations with predictions based on indirect inspections and pre-assessment data collected on more than 30 gas pipelines in Ontario, Canada.
INTRODUCTION
The External Corrosion Direct Assessment (ECDA) as described in NACE Standard RP0502-20021
is a continuous improvement process of using existing data and the results of indirect inspection tech-niques, validated by a series of direct examinations, to identify and address locations where external “corrosion activity has occurred, is occurring, or may occur”.
The authors have addressed in previous papers2,3 various aspects related to indirect inspection
techniques and prioritization of multiple indications, as applied by Union Gas Limited (UGL) and Corrosion Service Company Limited (CSCL) to more than 30 gas pipelines in the Province of Ontario.
1
Paper No.
08143

This paper describes the results of direct examinations on three different pipelines, by comparing
the expectations derived from the pre-assessment data to the results of the indirect inspections. The impact of these findings on the classification and prioritization criteria for the specific line is then discussed.
THE CASE OF SHALLOW PITTING IN HIGH RESISTIVITY SOIL
An integrated CIPS/DCVG survey was conducted in 2005 on a 6" dia. pipeline in northern Ontario, protected by a mixed CP system (i.e. 6" lateral pipeline having its own dedicated magnesium anodes bonded into a main line protected by impressed current rectifiers). A moderate DCVG indication (i.e. 47.7%IR) in conjunction with a severe CIPS indication (i.e. -533 mVCSE) was identified at chainage 670.6 m, as shown in Figure 1.
-2500
-2000
-1500
-1000
-500
0500 550 600 650 700 750 800 850 900 950 1000
Chainage (m)
Pote
ntia
l (m
V)
-50
0
50
100
150
200
Gra
dien
t (m
V)ON Potential OFF Potential -1000 mV Criterion Lateral Gradient @ 3m
To S
tatio
n
TB4
Cased Crossing
Rocky Terrain
12.8
%IR
35.2-42.2%IR
26.6
-30.
4%IR47
.7%
IR
37.0
%IR
Anod
e
35.7
%IR37
.2%
IR
14.7
% IR
18.0
%IR
23.7
%IR
10.8
%IR
9.6%
IR
15.7
%IR
FIGURE 1 • 6" Line. Ch. 500 to 1000m. Integrated CIPS/DCVG Survey
The indication was prioritized as “Scheduled Action Required”, according to the prioritization criteria
summarized in Table 1. In this case, the intersecting cell between the 2nd row (DCVG-MD) with the 5th column (CIPS-SV) indicates that a location displaying a moderate DCVG indication in conjunction with a severe CIPS indication is prioritized as scheduled action required (S).
2

TABLE 1 • SUMMARY OF PRIORITIZATION CRITERIA. TWO INDICATIONS AT THE SAME LOCATION
Prioritization Prior History of Corrosion (PHC)
Close Interval Potential Survey (CIPS)
DC Interference (DCI)
AC Induced Corrosion (ACC)
SV MD MN Nil SV MD MN NI SV MD MN NI SV MD MN NI
Coating Holiday (DCVG
Indication) 1 2 3 4 5 6 7 8 9 10 11 12 17 18 19 20
DCVG-SV 1 I I S S I S S S I S S S N/A N/A N/A S
DCVG-MD 2 I S M M S S M M I S M M N/A N/A N/A M
DCVG-MN 3 M M M M S M M M I S M M I S M M
DCVG-BT 4 N N N N S M M N I S M N I S M N
DCVG-NI 5 N N N N N N N N I * N N N I * N N N
* Consider excavating short sections of line under severe risk of external corrosion, even if DCVG indications were not found. Legend: SV = Severe indication I = Immediate action required MD = Moderate indication S = Scheduled action required MN = Minor indication M = Suitable for monitoring BT = Below threshold N = No action required NI = No indication N/A = Not Applicable
The direct examination was performed in August 2006 and revealed a total of seven holidays. For
details, see Coating Inspection Map #1 (Figure 2) and Figures 3 and 4 (only holidays #1 and #2 shown).
2005 ECDA Program6" Gas Line
Chainage: 670.6 mDirect Examination #: 1
12:00
1:00
2:00
3:00
4:00
5:00
6:00
7:00
8:00
9:00
10:00
11:00
0m 1m 3m
12:00
1:00
2:00
3:00
4:00
5:00
6:00
7:00
8:00
9:00
10:00
11:00
Ch. 670.0m Ch. 673.1m
N
Coal Tar Enamel
0.4
#4
#1
#6
#7
LEGEND
Coating Not Removed
Coating Removed
BuriedPipe
0.82m
1.81.4 2.4
Coating Defect(Holiday)
3.12.8
WELD @Ch. 671.1m
Lim
it of
Liq
uid
Tar
Lim
it of
Liq
uid
Tar
#5
#2#3
#7
Coal Tar Enamel
FIGURE 2 • Coating Inspection Map #1
3
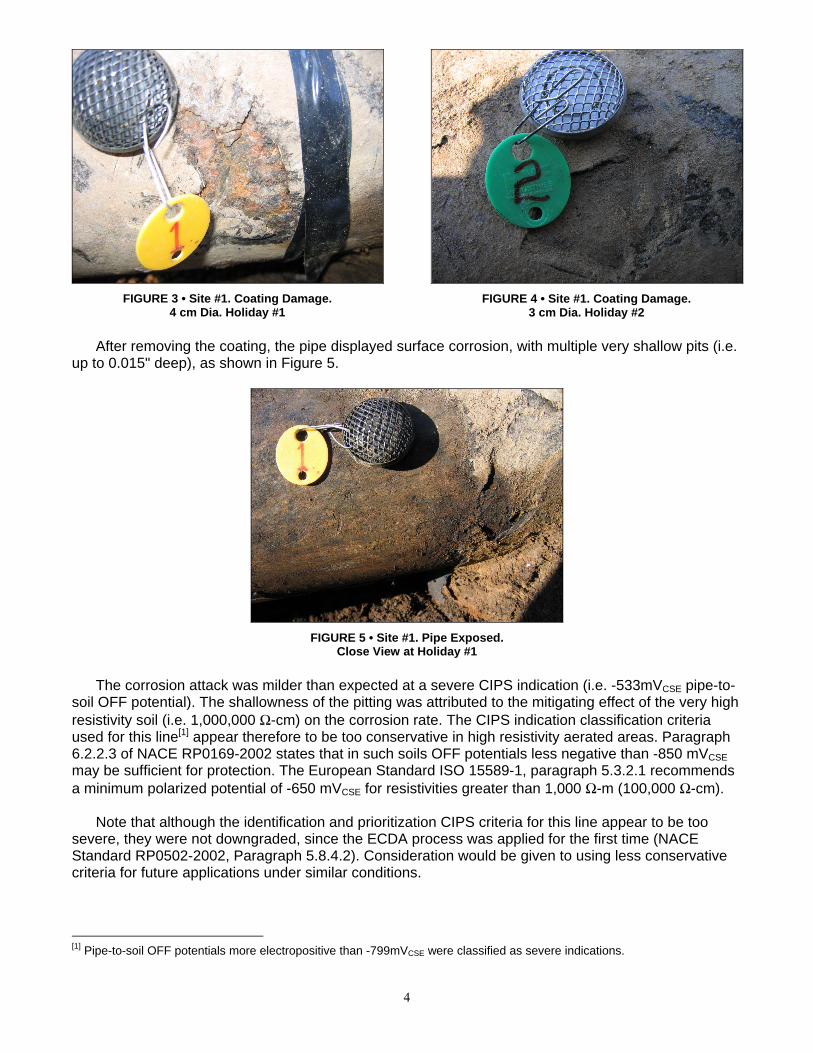
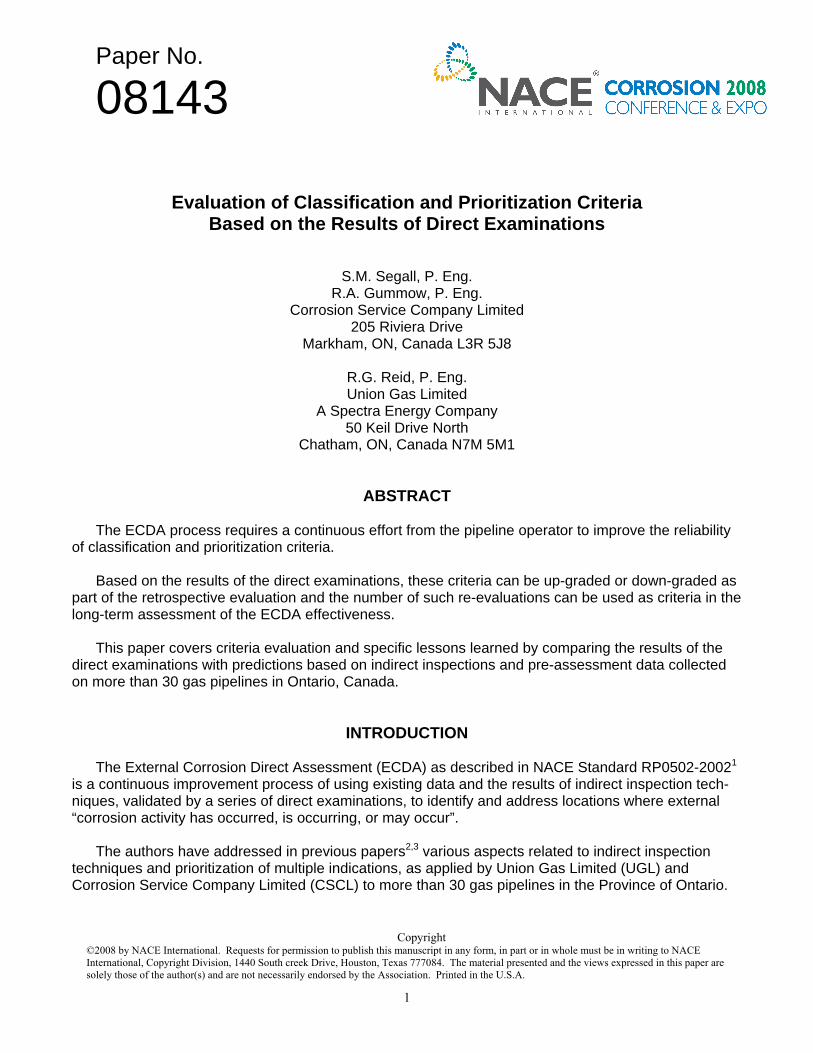
FIGURE 3 • Site #1. Coating Damage.
4 cm Dia. Holiday #1
FIGURE 4 • Site #1. Coating Damage.
3 cm Dia. Holiday #2
After removing the coating, the pipe displayed surface corrosion, with multiple very shallow pits (i.e. up to 0.015" deep), as shown in Figure 5.
FIGURE 5 • Site #1. Pipe Exposed.
Close View at Holiday #1
The corrosion attack was milder than expected at a severe CIPS indication (i.e. -533mVCSE pipe-to-soil OFF potential). The shallowness of the pitting was attributed to the mitigating effect of the very high resistivity soil (i.e. 1,000,000 Ω-cm) on the corrosion rate. The CIPS indication classification criteria used for this line[1] appear therefore to be too conservative in high resistivity aerated areas. Paragraph 6.2.2.3 of NACE RP0169-2002 states that in such soils OFF potentials less negative than -850 mVCSE may be sufficient for protection. The European Standard ISO 15589-1, paragraph 5.3.2.1 recommends a minimum polarized potential of -650 mVCSE for resistivities greater than 1,000 Ω-m (100,000 Ω-cm).
Note that although the identification and prioritization CIPS criteria for this line appear to be too
severe, they were not downgraded, since the ECDA process was applied for the first time (NACE Standard RP0502-2002, Paragraph 5.8.4.2). Consideration would be given to using less conservative criteria for future applications under similar conditions.
[1] Pipe-to-soil OFF potentials more electropositive than -799mVCSE were classified as severe indications.
4

THE CASE OF THE DEPLETED MAGNESIUM ANODE A moderate DCVG indication (i.e. 36.3%IR in conjunction with a minor CIPS indication (-903 mVCSE)
and a moderate DC interference (DCI) indication (i.e. 40 mV positive shift, with a foreign rectifier turned ON) were identified at chainage 306.00 m on an 8" gas pipeline protected by magnesium anodes (see Figure 6).
-2500
-2000
-1500
-1000
-500
0200 220 240 260 280 300 320 340 360 380 400
Chainage (m)
Pote
ntia
l (m
V)
-50
0
50
100
150
200
Gra
dien
t (m
V)
ON Potential OFF Potential -1000 mV Criterion Lateral Gradient @ 3m
30.3
%IR
Road X
24.2
%IR
19.7
%IR
17.9
%IR
37.5
%IR
Pipe
XM
g A
node
19.9
%IR
*
Road
* Possible magnesium anode
To S
MS
Fen
ce
PCS
Stat
ion
Fenc
eR
iser
DCI
36.3
%IR
FIGURE 6 • 8" Gas Line. Ch. 200 to 365m. Aligned CIPS/DCVG Data
The indication was prioritized as “Scheduled Action Required”, according to the prioritization criteria
summarized in Table 2. In this case, the intersecting cell between the 6th row (DCVG-MD & CIPS-MN) with the 6th column (DCI-MD) indicates that a location displaying a moderate DCVG indication in con-junction with a minor CIPS indication and a moderate DCI indication is prioritized as scheduled action required (S).
5

TABLE 2 • SUMMARY OF PRIORITIZATION CRITERIA. MULTIPLE INDICATIONS AT THE SAME LOCATION
Prioritization Prior History of Corrosion
(PHC) DC Interference
(DCI) AC Induced
Corrosion (ACC)
SV MD MN Nil SV MD MN NI SV MD MN NI
DC Voltage Gradient
Indication
Close Interval Potential Survey
Indication 1 2 3 4 5 6 7 8 9 10 11 12
CIPS-SV 1 I I I I I I I I N/A N/A N/A I
CIPS-MD 2 I I S S I S S S N/A N/A N/A S DCVG-SV
CIPS-MN 3 I I S S I S S S N/A N/A N/A S
CIPS-SV 4 I I I S I I I S N/A N/A N/A S
CIPS-MD 5 I I S S I S S S N/A N/A N/A S DCVG-MD
CIPS-MN 6 I S M M I S M M N/A N/A N/A M
CIPS-SV 7 I I S S I S S S I S S S
CIPS-MD 8 I S S S I S M M I S M M DCVG-MN
CIPS-MN 9 S M M M I S M M I S M M
CIPS-SV 10 I I S S I S S S I S S S
CIPS-MD 11 S S M M I S M M I S M M DCVG-BT
CIPS-MN 12 M M N N I S M N I S M N
CIPS-SV 13 I* N N N I* N N N I* N N N
CIPS-MD 14 I* N N N I* N N N I* N N N DCVG-NI
CIPS-MN 15 N N N N I* N N N I* N N N
* Consider excavating short sections of line under severe risk of external corrosion, even if DCVG indications were not found. Legend: SV = Severe indication I = Immediate action required MD = Moderate indication S = Scheduled action required MN = Minor indication M = Suitable for monitoring BT = Below threshold N = No action required NI = No indication N/A = Not Applicable
The direct examination was performed in July 2006 and revealed three coating holidays and a
depleted anode connected to the pipe. For details, see Coating Inspection Map #2 (Figure 7) and Figures 8 and 9 (only holiday #1 and the anode connection are shown).
6
2005 ECDA Program8" Gas Line
Chainage: 306.0mDirect Examination #: 2
12:00
1:00
2:00
3:00
4:00
5:00
6:00
7:00
8:00
9:00
10:00
11:00
0m 1m 2m 3m
12:00
1:00
2:00
3:00
4:00
5:00
6:00
7:00
8:00
9:00
10:00
11:00
Ch. 304.0m Ch. 307.5m
SITE #1(DE #1)
#1
Coating Not Removed
Coating Removed
LEGEND
Unexcavated
COAL TAR ENAMEL
N
Coating Defect
#3
Old Mg AnodeConnection
#2
COAL TAR ENAMEL
FIGURE 7 • Coating Inspection Map #2
FIGURE 8 • DE #2. Coating Damage.
Holiday #1 (Tag #2).
FIGURE 9 • DE #2. Connection of
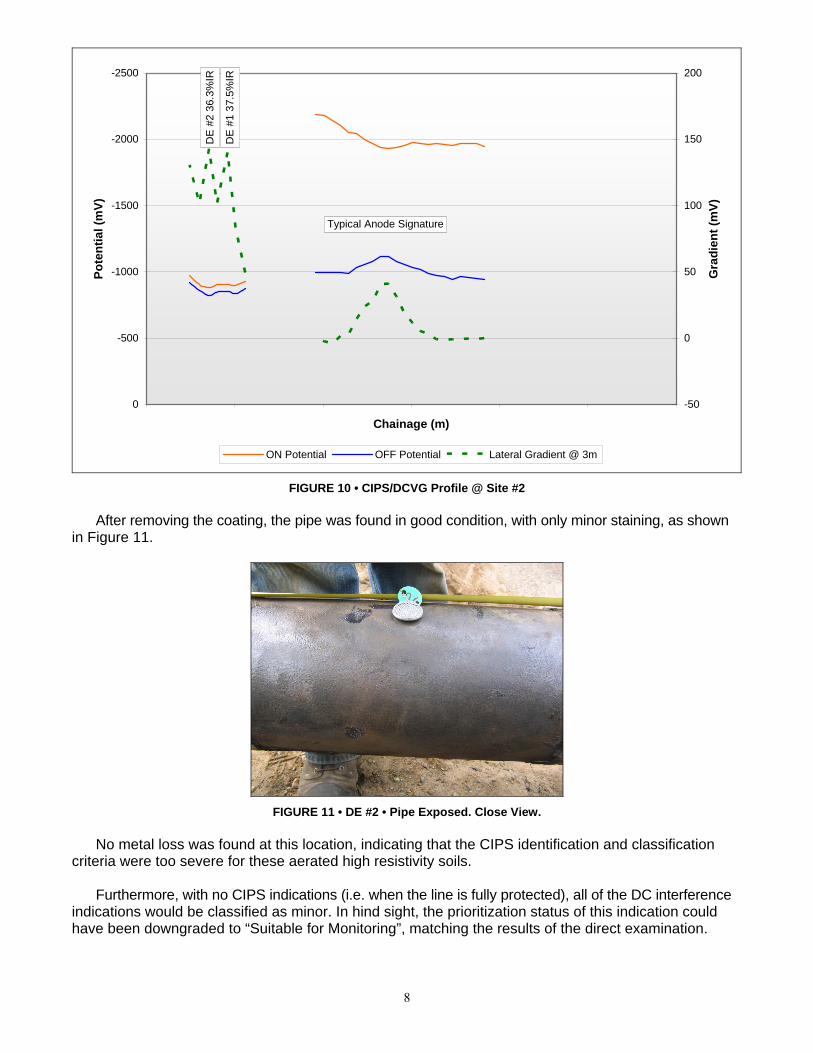
Depleted Magnesium Anode. The 36.3% IR is attributed in part to the depleted magnesium anode. Note that the CIPS/DCVG
profile displays a drop in the protection level in conjunction with a high voltage gradient (Figure 10), as opposed to an increase in the protection level in conjunction with a high gradient, typical for magnesium anodes.[2]
[2] A typical magnesium anode profile was added for reference.
7
-2500
-2000
-1500
-1000
-500
0
Chainage (m)
Pote
ntia
l (m
V)
-50
0
50
100
150
200
Gra
dien
t (m
V)
ON Potential OFF Potential Lateral Gradient @ 3m
DE
#2
36.3
%IR
Typical Anode SignatureD
E #
1 37
.5%
IR
FIGURE 10 • CIPS/DCVG Profile @ Site #2
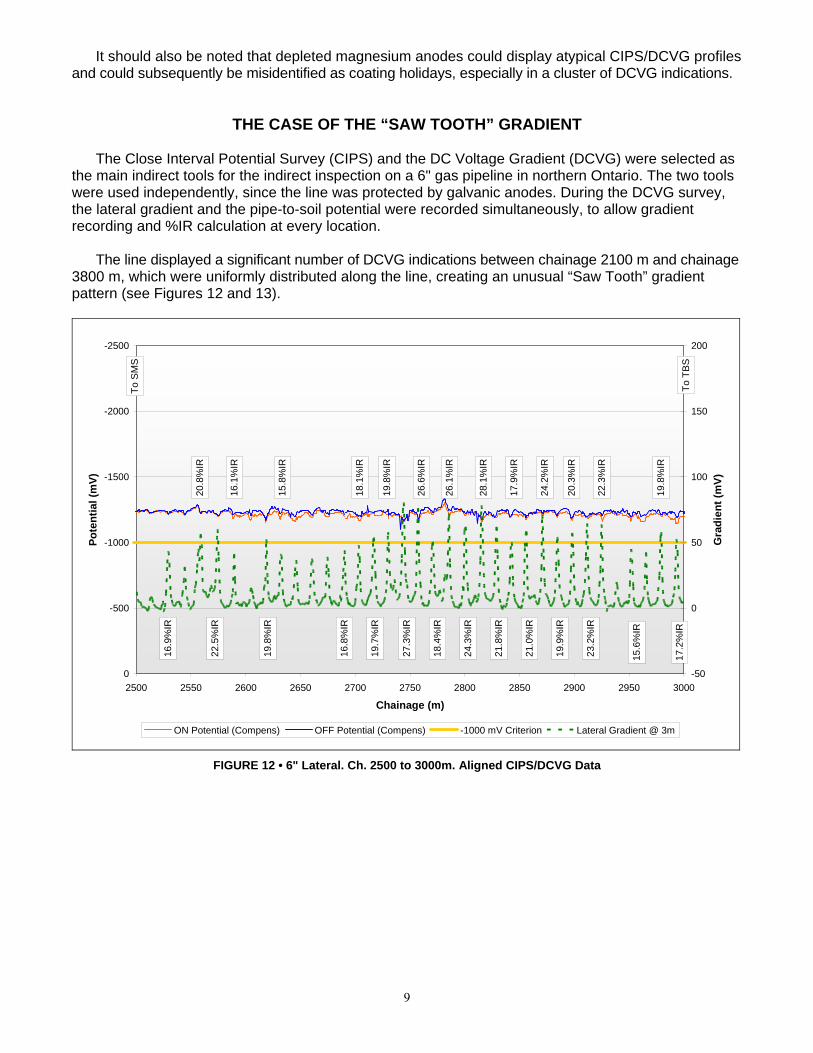
After removing the coating, the pipe was found in good condition, with only minor staining, as shown
in Figure 11.
FIGURE 11 • DE #2 • Pipe Exposed. Close View.
No metal loss was found at this location, indicating that the CIPS identification and classification
criteria were too severe for these aerated high resistivity soils. Furthermore, with no CIPS indications (i.e. when the line is fully protected), all of the DC interference
indications would be classified as minor. In hind sight, the prioritization status of this indication could have been downgraded to “Suitable for Monitoring”, matching the results of the direct examination.
8
It should also be noted that depleted magnesium anodes could display atypical CIPS/DCVG profiles and could subsequently be misidentified as coating holidays, especially in a cluster of DCVG indications.
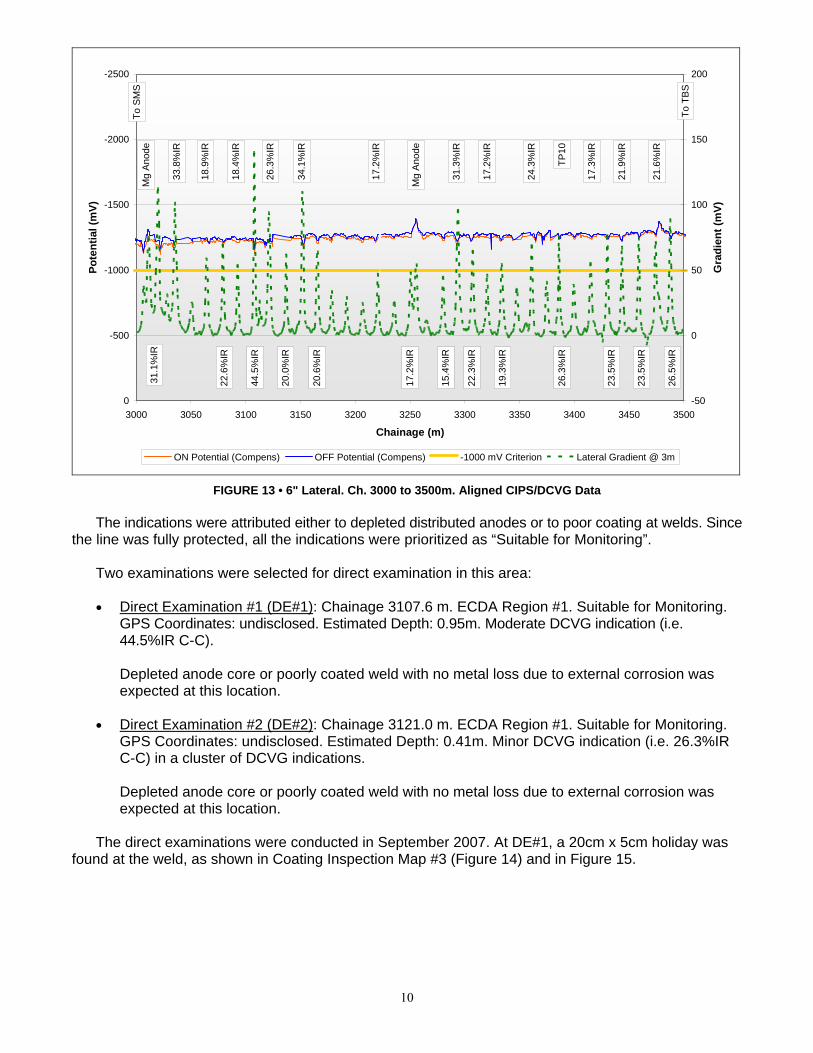
THE CASE OF THE “SAW TOOTH” GRADIENT The Close Interval Potential Survey (CIPS) and the DC Voltage Gradient (DCVG) were selected as
the main indirect tools for the indirect inspection on a 6" gas pipeline in northern Ontario. The two tools were used independently, since the line was protected by galvanic anodes. During the DCVG survey, the lateral gradient and the pipe-to-soil potential were recorded simultaneously, to allow gradient recording and %IR calculation at every location.
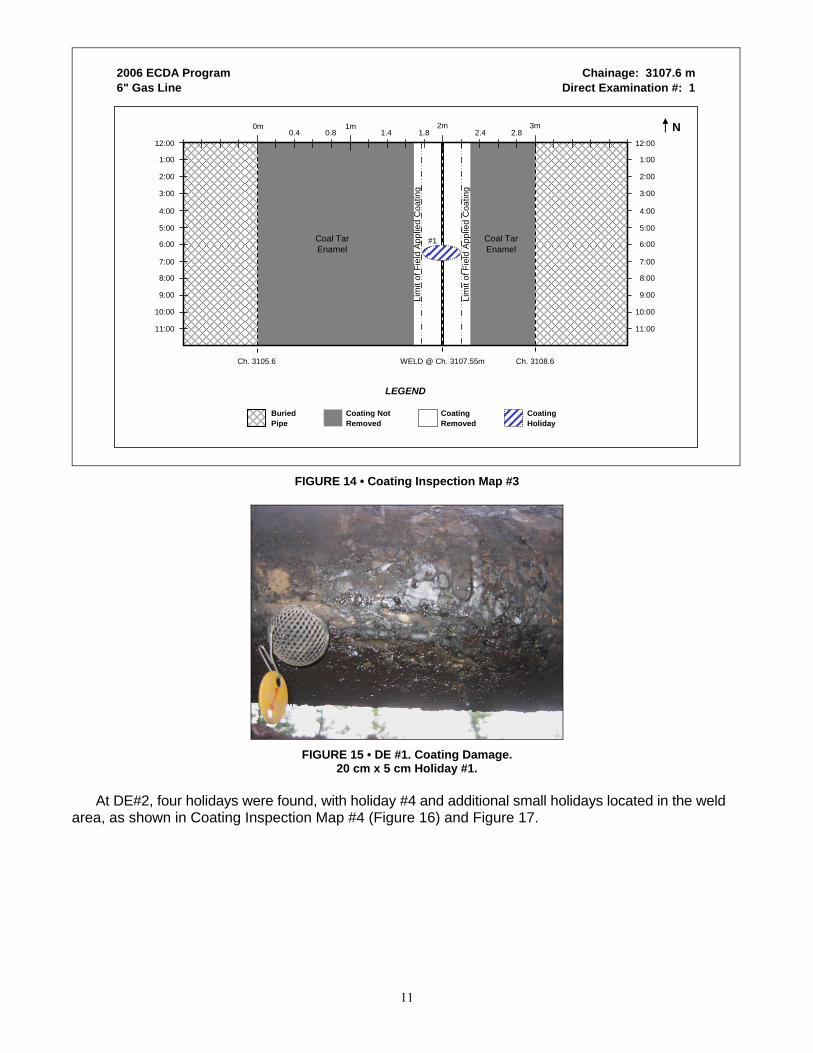
The line displayed a significant number of DCVG indications between chainage 2100 m and chainage
3800 m, which were uniformly distributed along the line, creating an unusual “Saw Tooth” gradient pattern (see Figures 12 and 13).
-2500
-2000
-1500
-1000
-500
02500 2550 2600 2650 2700 2750 2800 2850 2900 2950 3000
Chainage (m)
Pote
ntia
l (m
V)
-50
0
50
100
150
200
Gra
dien
t (m
V)ON Potential (Compens) OFF Potential (Compens) -1000 mV Criterion Lateral Gradient @ 3m
19.8
%IR
15.8
%IR
To S
MS
To T
BS
16.9
%IR
20.8
%IR
22.5
%IR
16.1
%IR
16.8
%IR
18.1
%IR
19.7
%IR
19.8
%IR
27.3
%IR
26.6
%IR
18.4
%IR
26.1
%IR
24.3
%IR
28.1
%IR
21.8
%IR
17.9
%IR
21.0
%IR
24.2
%IR
19.9
%IR
20.3
%IR
23.2
%IR
22.3
%IR
15.6
%IR
19.8
%IR
17.2
%IR
FIGURE 12 • 6" Lateral. Ch. 2500 to 3000m. Aligned CIPS/DCVG Data
9
-2500
-2000
-1500
-1000
-500
03000 3050 3100 3150 3200 3250 3300 3350 3400 3450 3500
Chainage (m)
Pote
ntia
l (m
V)
-50
0
50
100
150
200
Gra
dien
t (m
V)
ON Potential (Compens) OFF Potential (Compens) -1000 mV Criterion Lateral Gradient @ 3m
To S
MS
TP10
Mg
Anod
e
Mg
Anod
e
To T
BS
31.1
%IR
33.8
%IR
18.9
%IR
22.6
%IR
18.4
%IR
44.5
%IR
26.3
%IR
20.0
%IR
34.1
%IR
20.6
%IR
17.2
%IR
17.2
%IR
15.4
%IR
31.3
%IR
22.3
%IR
17.2
%IR
19.3
%IR
24.3
%IR
26.3
%IR
17.3
%IR
23.5
%IR
21.9
%IR
23.5
%IR
21.6
%IR
26.5
%IR
FIGURE 13 • 6" Lateral. Ch. 3000 to 3500m. Aligned CIPS/DCVG Data
The indications were attributed either to depleted distributed anodes or to poor coating at welds. Since
the line was fully protected, all the indications were prioritized as “Suitable for Monitoring”. Two examinations were selected for direct examination in this area: • Direct Examination #1 (DE#1): Chainage 3107.6 m. ECDA Region #1. Suitable for Monitoring.
GPS Coordinates: undisclosed. Estimated Depth: 0.95m. Moderate DCVG indication (i.e. 44.5%IR C-C).
Depleted anode core or poorly coated weld with no metal loss due to external corrosion was
expected at this location. • Direct Examination #2 (DE#2): Chainage 3121.0 m. ECDA Region #1. Suitable for Monitoring.
GPS Coordinates: undisclosed. Estimated Depth: 0.41m. Minor DCVG indication (i.e. 26.3%IR C-C) in a cluster of DCVG indications.
Depleted anode core or poorly coated weld with no metal loss due to external corrosion was
expected at this location. The direct examinations were conducted in September 2007. At DE#1, a 20cm x 5cm holiday was
found at the weld, as shown in Coating Inspection Map #3 (Figure 14) and in Figure 15.
10
2006 ECDA Program6" Gas Line
Chainage: 3107.6 mDirect Examination #: 1
12:00
1:00
2:00
3:00
4:00
5:00
6:00
7:00
8:00
9:00
10:00
11:00
0m 1m
12:00
1:00
2:00
3:00
4:00
5:00
6:00
7:00
8:00
9:00
10:00
11:00
Ch. 3105.6 Ch. 3108.6
N0.4
LEGEND
Coating Not Removed
Coating Removed
BuriedPipe
0.82m
1.81.4 2.4
WELD @ Ch. 3107.55m
Coating Holiday
2.8
Coal Tar Enamel
#1
3m
Lim
it of
Fie
ld A
pplie
d C
oatin
g
Lim
it of
Fie
ld A
pplie
d C
oatin
g
Coal Tar Enamel
FIGURE 14 • Coating Inspection Map #3
FIGURE 15 • DE #1. Coating Damage.
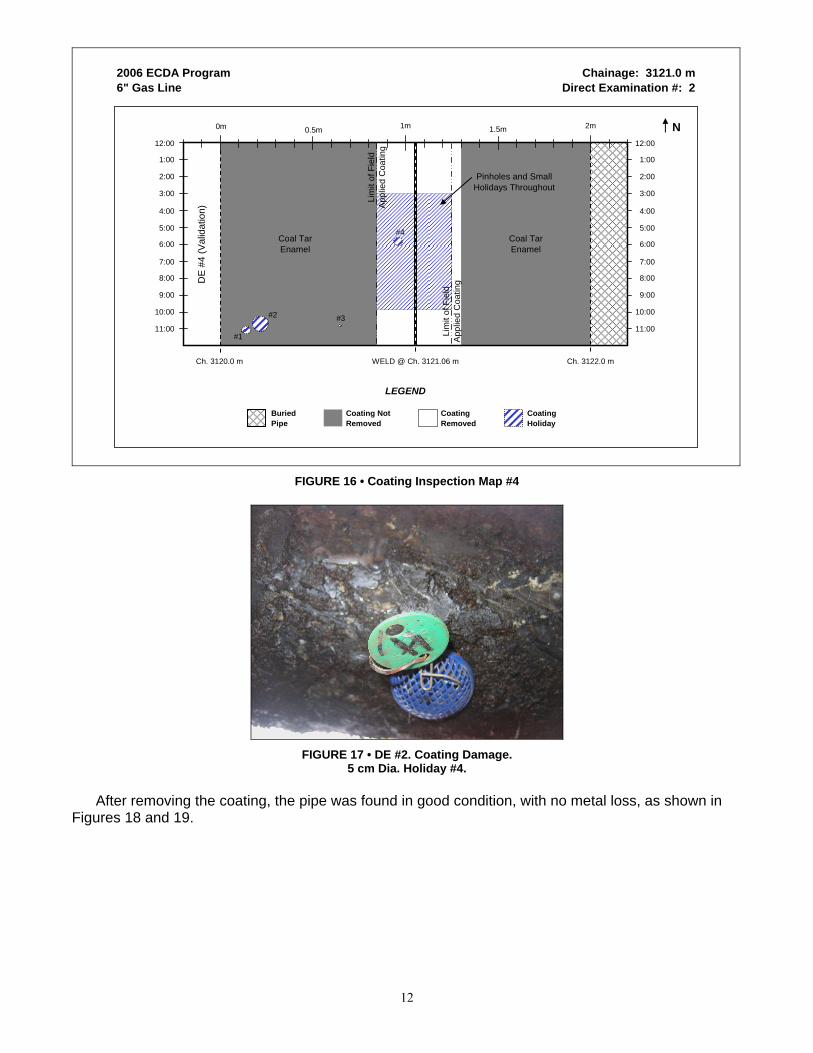
20 cm x 5 cm Holiday #1. At DE#2, four holidays were found, with holiday #4 and additional small holidays located in the weld
area, as shown in Coating Inspection Map #4 (Figure 16) and Figure 17.
11
2006 ECDA Program6" Gas Line
Chainage: 3121.0 mDirect Examination #: 2
DE
#4
(Val
idat
ion)
12:00
1:00
2:00
3:00
4:00
5:00
6:00
7:00
8:00
9:00
10:00
11:00
0m 0.5m
12:00
1:00
2:00
3:00
4:00
5:00
6:00
7:00
8:00
9:00
10:00
11:00
Ch. 3120.0 m Ch. 3122.0 m
N
LEGEND
Coating Not Removed
Coating Removed
BuriedPipe
1m
WELD @ Ch. 3121.06 m
Coating Holiday
Coal Tar Enamel
#4
1.5m
Lim
it of
Fie
ld
App
lied
Coa
ting
Coal Tar Enamel
2m
Lim
it of
Fie
ld
Appl
ied
Coa
ting
#2
#1
#3
Pinholes and SmallHolidays Throughout
FIGURE 16 • Coating Inspection Map #4
FIGURE 17 • DE #2. Coating Damage.
5 cm Dia. Holiday #4. After removing the coating, the pipe was found in good condition, with no metal loss, as shown in
Figures 18 and 19.
12
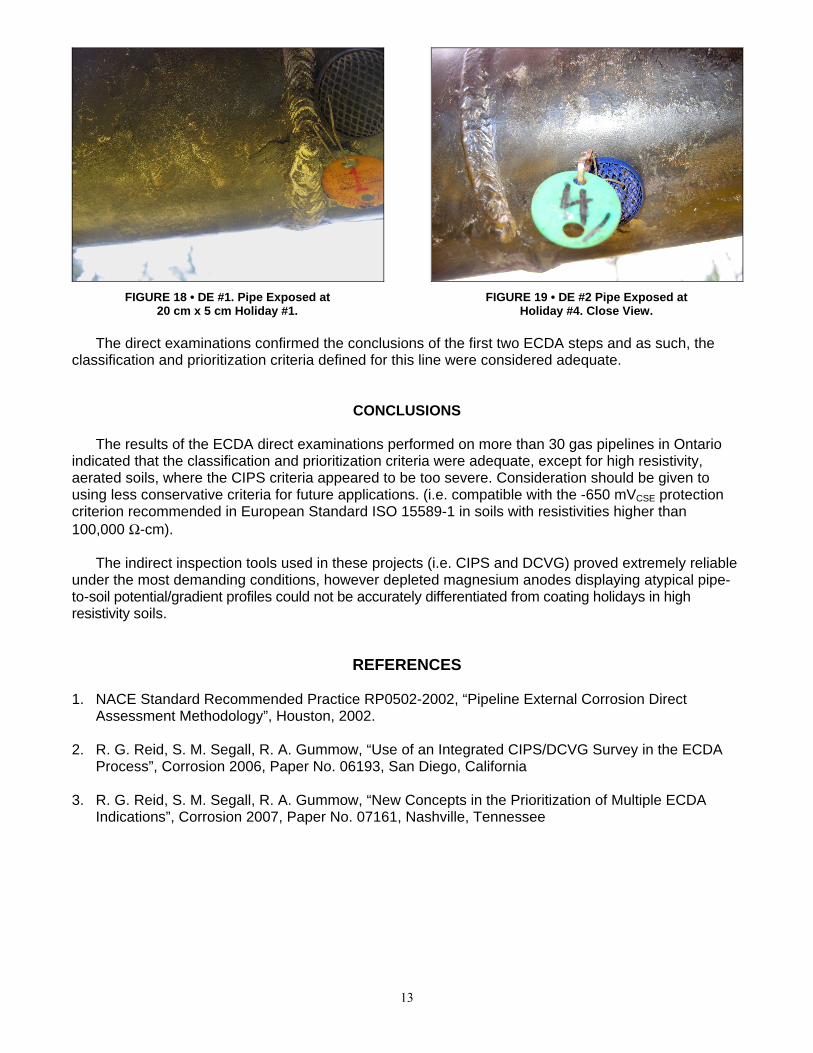
FIGURE 18 • DE #1. Pipe Exposed at
20 cm x 5 cm Holiday #1.
FIGURE 19 • DE #2 Pipe Exposed at
Holiday #4. Close View.
The direct examinations confirmed the conclusions of the first two ECDA steps and as such, the classification and prioritization criteria defined for this line were considered adequate.
CONCLUSIONS
The results of the ECDA direct examinations performed on more than 30 gas pipelines in Ontario indicated that the classification and prioritization criteria were adequate, except for high resistivity, aerated soils, where the CIPS criteria appeared to be too severe. Consideration should be given to using less conservative criteria for future applications. (i.e. compatible with the -650 mVCSE protection criterion recommended in European Standard ISO 15589-1 in soils with resistivities higher than 100,000 Ω-cm).
The indirect inspection tools used in these projects (i.e. CIPS and DCVG) proved extremely reliable
under the most demanding conditions, however depleted magnesium anodes displaying atypical pipe-to-soil potential/gradient profiles could not be accurately differentiated from coating holidays in high resistivity soils.
REFERENCES 1. NACE Standard Recommended Practice RP0502-2002, “Pipeline External Corrosion Direct
Assessment Methodology”, Houston, 2002. 2. R. G. Reid, S. M. Segall, R. A. Gummow, “Use of an Integrated CIPS/DCVG Survey in the ECDA
Process”, Corrosion 2006, Paper No. 06193, San Diego, California 3. R. G. Reid, S. M. Segall, R. A. Gummow, “New Concepts in the Prioritization of Multiple ECDA
Indications”, Corrosion 2007, Paper No. 07161, Nashville, Tennessee
13