Embed Size (px)
Citation preview
Letter Health Consultation PAPER MILL ROAD UNDEVELOPED TRACT
LAWRENCEVILLE GWINNETT COUNTY GEORGIA
DECEMBER 2 2008
US DEPARTMENT OF HEALTH AND HUMAN SERVICES Public Health Service
Agency for Toxic Substances and Disease Registry Division of Health Assessment and Consultation
Atlanta Georgia 30333
Health Consultation A Note of Explanation
An ATSDR health consultation is a verbal or written response from ATSDR to a specific request for information about health risks related to a specific site a chemical release or the presence of hazardous material In order to prevent or mitigate exposures a consultation may lead to specific actions such as restricting use of or replacing water supplies intensifying environmental sampling restricting site access or removing the contaminated material
In addition consultations may recommend additional public health actions such as conducting health surveillance activities to evaluate exposure or trends in adverse health outcomes conducting biological indicators of exposure studies to assess exposure and providing health education for health care providers and community members This concludes the health consultation process for this site unless additional information is obtained by ATSDR which in the Agencyrsquos opinion indicates a need to revise or append the conclusions previously issued
You May Contact ATSDR TOLL FREE at 1-800-CDC-INFO
or Visit our Home Page at httpwwwatsdrcdcgov
LETTER HEALTH CONSULTATION
PAPER MILL ROAD UNDEVELOPED TRACT
LAWRENCEVILLE GWINNETT COUNTY GEORGIA
Prepared By
Georgia Department of State Health Services Under Cooperative Agreement with the
US Department of Health and Human Services Agency for Toxic Substances and Disease Registry
B J Walker Commissioner
TheGeorgia Department of Human Resources Division of Public Health Sandra Elizabeth Ford MD MBA Acting Director 2 Peachtree Street NW Suite 15470 Atlanta Georgia 30303-3142 404-657-2700 FAX 404-657-6709
Date October 8 2008
Mike Kemp Unit Director Land Protection Branch Environmental Protection Division Georgia Department of Natural Resources 4220 International Pkwy Tradeport Offices Suite 104 Atlanta GA 30354
Dear Mr Kemp
This letter is in response to your request to evaluate the potential public health impacts from a closed unpermitted landfill site located off Paper Mill Road near the intersection of Springlake Road in Gwinnett County Georgia
To evaluate current soil and groundwater conditions GDPH reviewed the Laboratory Report for Paper Mill Road Phase II Environmental Site Assessment Sampling was conducted for the assessment in November 2006 to identify contamination in soil and groundwater at the Paper Mill Road site
Background Summary
In April 2008 the Georgia Environmental Protection Division (GEPD) contacted the Georgia Division of Public Health (GDPH) regarding a residentrsquos concerns about buried trash on her property and in land adjacent to her property During a site visit both GEPD and GDPH staff observed debris on the undeveloped parcel to the south and east and in a residentrsquos yard adjacent to the north end of the site On-site debris includes mostly household waste Debris on the residentrsquos property includes roofing tiles and other materials that may be from another source not associated with the site The site is not fenced and is easily accessible to the public
In November 2006 soil and groundwater samples collected on the undeveloped parcel showed several contaminants In March 2007 the parcel was listed on the GEPD Hazardous Site Inventory for lead above regulatory levels for soil and groundwater The Hazardous Site Inventory is a list of sites in Georgia where there has been a known or suspected release of a regulated substance above the reportable quantity and which have yet to show that they meet state clean-up standards
The closest residences are within 300 feet of the site Two municipal water supply wells and three private water wells are located approximately one mile from the site Additionally approximately 18 unused water wells are located within two miles of the site All residents living within one-half mile of the site use municipal water For related maps see Appendix A
Toxicological Evaluation
GDPH uses ATSDR comparison values to select contaminants that require further evaluation Comparison values (CVs) are concentrations of contaminants that can reasonably (and conservatively) be regarded as harmless assuming default conditions of exposure The CVs generally include ample safety factors to ensure protection of sensitive populations Because CVs do not represent thresholds of toxicity exposure to contaminant concentrations above CVs will not necessarily lead to adverse health effects
Soil Ten subsurface soil samples were collected on site and analyzed Lead was detected in one sample and polychlorinated biphenyls (PCB) were detected in two samples at levels above the federal soils screening value or the lowest CV
One on-site soil sample collected from the southeastern area of the site shows lead at 777 milligrams of lead per kilogram of soil (mgkg) however the other nine samples ranged from 2shy186 mgkg The average concentration of lead in the ten soil samples is 118 mgkg The EPA has established a residential soil screening value of 400 mgkg for lead This value is derived from a model and is considered to be protective of health and the environment For more information about EPAs soil screening value for lead visit wwwepagovsuperfundhealthconmediasoiluser
Two soil samples collected northern area of the site showed PCB above the lowest CV (04 mgkg) at 12 mgkg and 061 mgkg Although two soil samples showed PCB above the lowest CV it is not known whether residents are exposed to the area of contaminated soil frequently or for an extended period of time
Lead Exposure to elevated levels of lead can be potentially harmful to fetuses infants and young children ATSDR has not developed a CV for lead however they have developed a mathematical model designed to estimate blood lead levels in the body based upon exposure to actual concentrations of lead in soil along with exposure to lead from all sources
According to the Centers for Disease Control and Prevention a personrsquos blood lead level is a good indicator of recent exposure to lead and correlates well with health effects However lead concentrations in soil do not directly predict adverse health effects It is estimated that blood lead levels generally increase 3 to 7 micrograms of lead per deciliter of blood (ugdL) for every 1000 mgkg increase in soil lead concentrations CDC considers children to have an elevated blood lead level if the amount of lead in blood is 10 microgdL or greater Applying the ATSDR Lead Model to the highest lead concentration found in soil at the Paper Mill Road site shows that the estimated blood lead level from all sources can be up to 4 ugdL Therefore we conclude that
blood lead levels among persons exposed to lead in soil at Paper Mill Road is not expected to exceed a level that would pose a health risk
Groundwater One groundwater sample was collected on site Lead and arsenic were detected above CVs Groundwater data is limited because only one sample was collected and hydrogeological data is not yet available
Although lead and arsenic were detected in groundwater above comparison values toxicological evaluation for lead and arsenic in groundwater was not conducted because most residents use water from a municipal water supply and the nearest private drinking water well is approximately one mile from the site Therefore exposure to site related contaminants in groundwater is not likely
Conclusions
GDPH concludes that this site poses an Indeterminate Public Health Hazard for exposure to contaminants in soil and groundwater because there is not enough information to determine whether residents may be exposed to contaminants from the site The site has unlimited access which may result in exposure to contaminated soil Although residents use the municipal water supply there are residents living approximately one mile from the site using private water wells
Recommendations
Based on the available information GDPH recommends that GEPD oversees further site characterization to determine the extent of site related
contaminants Proper abandonment of unused wells
GDPH will review data as it becomes available and provide additional documents including a follow-up health consultation if appropriate If there are any questions regarding this health consultation please contact Julia McPeek Campbell (404) 657-5234
Sincerely
Julia McPeek Campbell Chemical Hazards Program Consultant State Environmental Health Section Division of Public Health Georgia Department of Human Resources
Cc Jason Metzger Georgia Environmental Protection Division John Tilden Bembrey Georgia Environmental Protection Division Joseph Sternberg East Metro Public Health District
REFERENCES
1 Environmental Conservation Laboratories Inc Laboratory Report Paper Mill Road Phase II ESA 121406
2 Agency for Toxicological Substances and Disease Registry Toxicological Profile for Polychlorinated Biphenyls 807
3 Agency for Toxicological Substances and Disease Registry Toxicological Profile for Lead 807
4 US Environmental Protection Agency Soil Screening Guidance Userrsquos Guide Publication 93554-23 796
5 Agency for Toxic Substances and Disease Registry Soil Comparison Values 102607
6 Agency for Toxic Substances and Disease Registry Water Comparison Values 102607
APPENDIX A SITE AND DEMOGRAPHIC MAPS
Gwinnett County Paper Mill Rd Undeveloped Parcel
APPENDIX B PROPER WATER WELL ABANDONMENT FACT SHEET
APPENDIX C ATSDR LEAD MODEL
Numerous longitudinal and cross-sectional studies have attempted to correlate environmental lead levels with blood lead levels The studies have provided a number of regression analyses and corresponding slope factors for various media including air soil dust water and food In an attempt to use this valuable body of data ATSDR has developed an integrated exposure regression analysis This approach utilizes slope values from selected studies to integrate all exposures from various pathways thus providing a cumulative exposure estimate expressed as total blood lead The worktable in the text can be used to calculate a cumulative exposure estimate on a site-specific basis To use the table environmental levels for outdoor air indoor air food water soil and dust are needed In the absence of such data default values can be used In most situations default values will be background levels unless data are available to indicate otherwise Based on the US Food and Drug Administrationrsquos Total Diet Study data lead intake from food for infants and toddlers is about 5 micrograms per day In some cases a missing value can be estimated from a known value For example EPA has suggested that indoor air can be considered 003 times the level of outdoor air
Empirically determined or default environmental levels are multiplied by the percentage of time one is exposed to a particular source and then multiplied by an appropriate regression slope factor Slope factor studies were based upon an assumption that exposure is continuous The slope factors can be derived from regression analysis studies that determine blood lead levels for a similar route of exposure Typically these studies identify standard errors describing the regression line of a particular source of lead exposure These standard errors can be used to provide an upper and lower confidence limit contribution of each estimate of blood lead The individual source contributions can then be summed to provide an overall range estimate of blood lead While it is known that such summing of standard errors can lead to errors of population dynamics detailed demographic analysis (eg Monte Carlo simulations) would likely lead to a model without much utility As a screening tool estimates provided by the table have a much greater utility than single value central tendency estimates yet still provide a simple-to-use model that allows the health assessor an easy means to estimate source contributions to blood lead
Default values were used in calculating values in the table for exposures to lead other than soil and groundwater Although it is unknown whether residents using private water wells are exposed to lead detected in groundwater groundwater sampling results were included in these calculations as a conservative measure When suggested default values are a range of values the average of the range is used as the default value
Source US Public Health Service Agency for Toxic Substances and Disease Registry Draft Toxicological Profile for Lead (Update) 2006
Relative Time Spent
Table 2 Estimated blood lead levels from exposure to environmental lead for persons exposed to surface soil lead in the Paper Mill Road site
Media Concentration
Slope Factor
ugdL per
ugPbkg
Estimated Blood Lead Level (μgdL)
Outdoor Air
015 ugm3 01 days
132 00198
001782
12 159 0453
0488
00378
003402 12
159
0622
0622
252
Indoor Air 0045 03 days 132 252
Food 5 ugday 1 024 Water 53 ugL 1 003
Soil 777 mgkg 01 days 000583 0008
Dust 777 mgkg 01 days 000628 0008
Total 377 4106
Highest surface soil concentration of lead found in all samples collected and analyzed above EPA screening level of 400 mgkg
Suggested default values references Outdoor Air 01ndash02 μgm3 [1] Indoor Air 01ndash02 μgm3 [2] Food 5 μgday [3] Water 4 μgday [4] Dust 10ndash70 mgkg [5]
Slope values references Outdoor Indoor air 132 (low)ndash252 (high) μgdL per μg Pbm [6] Food 024 μgdL per μg Pbday [8] Water 003 μgdL per μg Pbday [8] Soil 000583 (low)ndash0008 (high) μgdL per μg Pbkg [6] Dust 000628 (low)ndash0008 (high) μgdL per μg Pbkg [6]
For children under the age of six the Centers for Disease Control and Prevention (CDC) has set a level of concern at 10 micrograms of lead per deciliter of blood (10 ugdL) This means that children with blood lead levels equal to or greater than 10 ugdL are considered to have an elevated lead level and require appropriate follow-up An elevated lead level does not mean that a child will have health effects especially if caught early and the source of the lead exposure is removed
An Equal Opportunity Employer wwwdhrgeorgiagov
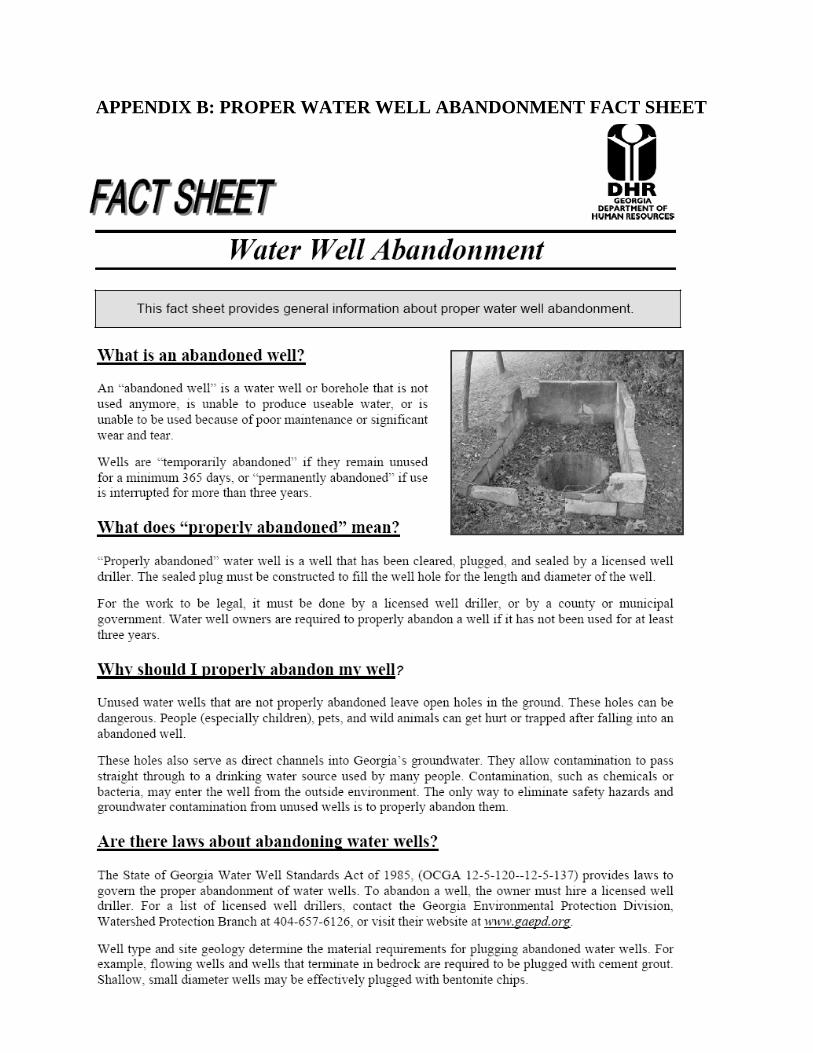