Embed Size (px)
Citation preview
Economic incentives, failures and tropical deforestation: the case for an international trade in ecosystem services
Bernardo B. N. Strassburg ([email protected])
Centre for Social and Economic Research on the Global Environment
School of Environmental Sciences
University of East Anglia, Norwich, UK
Paper prepared for European Summer School in Resource and Environmental Economics
Trade, Property Rights and Biodiversity Venice July 4th – 10th

After being historically concentrated in the temperate regions of the North1, the conversion process is now focused on the most diverse and productive ecosystems of the planet, the tropical forests. Despite its 1.3 billion hectares4 representing only c. 8.6% of Earth’s terrestrial surface, tropical forests produce 31,6% of annual land NPP5, and hold between half and two thirds of all living species of the planet6. It is estimated that between 8.1[7] and 15.2[4] million hectares of tropical forests are converted every year. Resulting greenhouse gas emissions amounted to 18-25% of global anthropogenic emissions8,9, making tropical deforestation the second largest source of emissions, closely behind Energy (24%) and well ahead of Transport (14%) and Industry (14%)8,9. The conversion of natural environments is the main driving force behind the explosive growth in extinctions rates10, presently between a hundred and a thousand times higher than natural rates, with a further tenfold increase expected in the near future1. Recent field observations11 appear to support these catastrophic scenarios. Not surprisingly, the conversion process is considered1 the largest negative impact factor in the provision of ecosystem services, the purely anthropocentric concept encompassing the benefits nature provides to mankind12. Yet, despite strong international pressure and several and diverse attempts made by their host countries in recent years, the rate of conversion of tropical forests remains staggeringly high. The impact of the projected massive loss of Earth’s biodiversity has been more completely understood in the recent past, when the main significance of biodiversity changed from the potential value of individual species to their role in the maintenance of ecosystem functioning and, consequently, in the provision of ecosystem services. There is an ample debate in the literature concerning the “causes” of tropical deforestation. These are normally divided into proximate (or direct) and underlying causes. There is currently a general agreement that conversion to agriculture is the main direct cause (with conversion to pasture and unsustainable timber extraction being regionally important in Latin America and SE Asia, respectively) (Geist & Lambin, 2002). Among the underlying causes there is less agreement. Trade, for instance, has long been regarded as an important deforestation driver, but recent research has contested this view (Lopez & Galinato, 2003). It seems likely that trade does lead to greater crop specialization, as predicted in theory (Polasky et al., 2004) and confirmed by empirical observations (Vadez et al., 2004). On the other hand, there is also a potential positive effect of trade in lowering corruption rates (Barbier et al., 2005), which in turn leads to smaller rates of deforestation and, consequently, of biodiversity loss. The role of property rights is also an unsettled issue. Standard economic theory predicts that resource depletion will decrease when we move from an open access regime to one in which property rights are assigned to individuals (private property) or to a community (commons). Although ill-defined property rights are commonly associated with greater deforestation (particularly in SE Asia) (Geist & Lambin, 2002), they seem to have ambiguous effects on forest cover (Geist & Lambin, 2002) and is not clear if assigning property rights does in fact reduce resource depletion (Perrings, 1995). What is far from ambiguous, however, is that economic incentives are the main underlying cause of tropical deforestation and the consequent biodiversity loss. The demand (both national and international) for agriculture and timber products, coupled with classical market failures are “the prominent underlying forces of tropical deforestation” (Geist & Lambin, 2002).

This paper investigates how the distribution of biodiversity’s benefits across different stakeholders on different scales has a fundamental role in the persistence of tropical deforestation and the consequent biodiversity loss. An initial systematic analysis of case studies available in the literature identifies some interesting patterns and suggests a decisive role for one of the classical failures of economic systems. Following, a novel approach applied to the conversion process in the Brazilian Amazon aims to test this hypothesis. Even if some of the quantitative results should be regarded cautiously, this approach offers important insights and applications for both research and policy. Its strong qualitative conclusions suggest that if we are interested in safeguarding what these forests represent for our own wellbeing, it will be necessary to cooperate internationally. If implemented, such cooperation would be much cheaper, straightforward and beneficial than recent international initiatives such as the Kyoto protocol. Far from being competitive, however, both approaches are complementary and strongly synergistic. The value of Biodiversity The first question that has to be answered is “value to whom ?”. The answer is related to the distinction between intrinsic and instrumental value. In a biocentric approach, other species have a value of their own, regardless of any direct or indirect benefit they provide to mankind. The anthropocentric approach, on the other hand consider that their value is exclusively related to their impact (direct or indirect) on human utility. The latter approach will be adopted on this study. The traditional anthropocentric approach, dominant until the last decades of the 20th century (and still largely adopted both in the scientific and non-scientific literature) consider that the benefits other species provide to mankind arise from their individual value. These benefits range from the potential value to pharmacological and biochemical applications to the individual existence value of each species. In the last decade of the 20th century, however, “the ideas related to the ecosystem services moved to the mainstream of ecological research” (Mooney & Erlich, 1997). These services can be defined as “the conditions and process through which the natural ecosystems, and the species that make them up, sustain and fulfill human life” (Daily, 1997). In the study of biodiversity, “while the major part of the debate about the meaning of biodiversity loss in centered in the genetic information lost with the extinction of species, the most recent research changed the focus from the characteristic of individual organisms to the functioning of the mix of organisms in ecosystems” (Holling et al., 1994). As a consequence, “the ‘cure for cancer’ was replaced by the role of the mix of species and communities in maintaining the resiliency of ecosystems” (Perrings, 1995). In fact both approaches are not mutually exclusive. In this study, the individual value of the species will be accessed, both as option and existence value. On the other hand, in general, a greater biodiversity increases the productivity of an ecosystem (Tilman, 1997), has a central role in the continuity of the ecosystem cycle (Odum, 1986), improve its regeneration capabilities (Norberg, 1999) and its resiliency to external shocks (Perrings, 1995). Therefore, the major significance of biodiversity for mankind comes from its importance to ecosystem functioning and, consequently, to the provision of its services. Biodiversity also has a direct impact in the magnitude of some services, as shown by its impact on the carbon sequestration service of tropical forests38. It is important to keep in mind that these “services” are an arbitrary disaggregation aimed at facilitating some analysis. Some studies and policies analysis that focus on individual services tend to overlook the interaction between different services and the fundamental dependence that they have on the ecosystem itself. To reduce these distortions, the present study will have as its base

variable of analysis the area of the ecosystem and will try to capture the impact its reduction has on the services the ecosystem provides. The Biased Trade-off As converting an ecosystem has, on the one hand, a significant negative impact on the services supplied by it to humanity, while on the other hand it increases the production of alternative valuable goods, there is a clear trade off in the choice of conserving or converting a given area. The main characteristic of this trade off is that it is strongly biased in favor of the option for conversion. There is ample literature showing how our growing but still limited knowledge of the workings of environmental systems, in conjunction with well-known failures in the economic system that are especially evident in this context, create a strong bias against the conservation option for a given natural environment a. An important portion of this bias derives from the fact that while the benefits provided by converting a given natural environment to alternative uses are well known, observable and measurable, the benefits provided by conserving the environment in its original form are still imperfectly understood and their measurement extremely complicated due to the slight and flawed insertion of these benefits into the economic system. Even when they are adequately identified, environmental services are usually measured either in physical units (such as volumes of regulated atmospheric gasses) or in more abstract units (such as cultural values), which are normally undervalued in comparison with the immediately observable monetary values of the benefits of conversion. The valuation process is an important tool in attenuating the bias mentioned above, although still subject to important and much debated limitationsb. Its objective here is to make an adequate identification of the total economic value of the natural environment in question, leading to a less flawed comparison between the benefits of a natural environment and alternative land-uses. Analysis of case-studies As converting an ecosystem has, on the one hand, a significant negative impact on the services supplied by it to humanity, while on the other hand it increases the production of alternative valuable goods, there is a clear trade off in the choice of conserving or converting a given area. The academic literature is rich in works that apply valuation methods to estimate the diverse benefits provided by natural systems and their components. Much less frequent, however, are works that make comparisons between the benefits of conservation and those of conversion to alternative uses. After a review of the literature, 14 works were selected that compare, directly or indirectly, the benefits of these two alternatives (Table 1). From a systematic analysis of these works, two important observations can be made. The first is that in most cases – in eleven of the fourteen works – the conservation option presents superior benefits than the conversion to alternative uses. The three works14,20,21 that do not reach the same conclusion analyze ecosystem benefits only of a local character, and, as explicitly noted in one of them21, the inclusion of benefits on other scales would probably reverse the conclusion.
a Pearce (1991), Barbier et al. (1994), Pearce (1994), Turner et al. (1994), Hempel (1996), Jakobsson and Dragun (1996), Manson (1996), OECD (1996), Swanson (1996), Swanson (1997) and Fearnside (2000) and. b See, for example, Costanza and Folke (1997), Rees (1998), Daily et al. (2000), Turner (2000)and Farber et al. (2002).

Table 1 – Analysis of case studies Country / Region
Ecosystem Alternative Use
Conclusions
Brazil13 Trop. Forest Agric./Cattle + Timber
Ecos. Glob. Value > $ Conversion
Peru14 Trop. Forest Agriculture + Timber
$ Conversion > Ecos. Nat. Value
Cameroon15 Trop. Forest Agriculture Ecos. Glob. Value > $ Conversion > Ecos. Nat. Value
Malaysia16 Trop. Forest Timber Ecos. Glob. Value > $ Conversion ≈ Ecos. Nat. Value
Brazil17 Trop. Forest Cattle Ecos. Glob. Value > $ Conversion > Ecos. Nat. Value
Brazil18 Trop. Forest Average Ecos. Glob. Value > $ Conversion > Ecos. Nat. Value
Madagascar19 Trop. Forest Timber + Agriculture
Ecos. Glob. Value > $ Conversion > Ecos. Nat. Value
Sri Lanka20 Trop. Forest Timber + Agriculture
$ Conversion > Ecos. Nat. Value
Kenya21 Savanna Average $ Conversion > Ecos. Nat. Value
Thailand22 Mangrove Shrimp Farm $ Conversion < Ecos. Nat. Value
United Kingdom23 Temp. Forest Timber $ Conversion < Ecos. Nat. Value
Australia24 Mixed (Kakadu)
Mining $ Conversion < Ecos. Nat. Value
Canada25 Temp. Wetlands
Agriculture $ Conversion < Ecos. Nat. Value
Scandinavia26 Boreal Forest Agriculture $ Conversion < Ecos. Nat. Value
The second conclusion is reached with the introduction of the different spatial dimensions of the ecosystem services in the analysis. While some services have a local or regional character, other services have a global dimension. Dissociation and classification of benefits for each service according to its spatial character demonstrates a highly relevant pattern for understanding the behaviour of the conversion process. On the one hand, it is observed that in all four works that analyze natural environments in high-income countries23-26, conservation shows superior benefits, even when only benefits of services of a local or national character are considered. On the other hand, of the nine studies that analyze national or local ecosystem benefits in medium or low income countries14-22, only the study related to mangrove ecosystems22 reaches a similar conclusion. Of the other eight, one is not conclusive in this respect16 and the other seven reach exactly the opposite conclusion, that is, that the national benefits of the natural area are inferior to the benefits of conversion to alternative uses. When the global benefits are included in the analysis, however, the balance always tilts towards conservation. This second observation demonstrates the fundamental role played by a well-known failure of the economic system – that is externality. An externality is the consequence (positive or negative) that an action performed by a group of stakeholders has on another group that does not take part in the decision process. Its occurrence in this case is related, on the one hand, to the different spatial dimensions of the services provided by the natural environments, and on the other, to the organization of the global geopolitical system in sovereign and independent nation states. The consequence of these two factors together is that a portion of the benefits provided by the ecosystems is appropriated by individuals in other countries that do not participate in the internal decision-making process of the countries that own the resources.

A key market-failure The role of the externality can be better understood in Figure 1. The lower (or leftmost) curve represents the marginal benefits provided by the natural area to the owner of the land. When we add the local or regional benefits provided by the natural area to the citizens of the country (the national externality), the second curve is formed. Finally, the inclusion of the benefits that affects everyone on Earth (the international externality) leads to the higher (or rightmost) curve. Figure 1
As the remaining natural area diminishes (i.e. when we move to the left along the horizontal axis), its marginal benefits grows – and grows faster. This expected shape, widely published in the literature27-31, derives from two fundamental causes. First, basic economic principles, such as the law of diminishing marginal utility indicate that unit values of the goods or services rise as their available quantity diminishes28-31. Second, ecological principles, such as the existence of thresholds and the resulting discontinuities indicate a rise in the possibility of rupture in the ecological system as larger portions of the area are converted, putting the stability and resiliency of the system at risk29-34. Thus, it is expected that the curve representing the marginal unit value of the environmental benefits becomes less elastic (more inclined) as conversion progresses. An optimum or equilibrium point occurs when marginal benefits equate marginal costs, the latter here composed of management and, mainly, opportunity costs (i.e. the forgone benefits of conversion to alternative activities). The presence of externalities leads to three different equilibrium points. As can be seen, more land should be conserved from a global standpoint (Qglob) than from a national one (Qnat). The presence of the international externality is not relevant in this context when the national benefits of the natural area – the ones that are (or should be) considered by the decision makers – are by themselves higher than the marginal cost of conserving it. Graphically, it means that the present “quantity” of the natural area under analysis is to the left of the point Qnat. In this case, the optimal decision from the national point of view is to conserve the area. From the analysis of case studies, this is what happens today in higher income countries. The opposite occurs, however, in lower-income countries. In these countries the national benefits of the natural area are lower than the costs of conserving it. It is only with the introduction of the

portion of the benefits appropriated by the inhabitants of other countries – the international externality – that the balance tilts towards conservation. Graphically, the present “quantity” of the natural area under analysis is between points Qnat and Qglob. This analysis goes along very well with the spatiotemporal behaviour of the conversion process. Developing countries are marching to the left on the horizontal axis, towards Qnat, at a rate of 8.1-15.2 million hectares per year4,7. This behaviour is coherent with the conclusion that their present “Q” is to the right of Qnat. Many developed countries, on the other hand, after moving to the left for centuries, are now actually marching to the right, expanding their forest cover1,4. This expansion could be understood as a result of two main forces: First, having reduced their natural areas up to a point near the private optimum (Qpv) in the past (ignoring national externalities when state concern with the environment was low or non-existent), they are now being conducted by state intervention towards Qnat. Second, as their income grew, their demand curves for environmental benefits moved to the right, leading to equilibrium points with higher portions of conserved land. This analysis allowed the detection of the fundamental role that the international externality has in the persistence of the conversion of natural environments in lower income countries. As no mechanism exists today to allow these countries to receive part of the external benefits generated by their natural environments, they follow the “national optimum” path previously taken by their richer counterparts and head towards Qnat. The Dynamic Marginal Analysis The studies analyzed above have a static nature. The values they present correspond to a “picture” of the conversion process at the moment the studies were made. They allowed establishing the present position of each group of countries in relation to the equilibrium points. A better comprehension of the essence of the problem, however, can be achieved by looking at the “full movie” – a dynamic analysis. The analysis that follows is an attempt to apply the theoretical approach behind Figure 1 to the conversion process in the Brazilian Amazon. The analysis will focus on the 84% or the original forest that still existed in 2002, approximately 336 million hectares35. Since the late 1970s these are converted at a historical rate of 2 million ha-1 yr-1 [35], although a recent and still controversial study36 suggested that using remote sensing to identify selective logging would double this figure. Cattle ranching is still the dominant alternative use35, although cropland (particularly soybean) conversion is on the rise37. Among the many obstacles encountered, one was by far the most relevant: although the literature suggests that the benefits of the natural environments have the general dynamic behaviour described in the previous section, the specific (quantitative) behaviour remains unknown. Several economic and ecological concepts and tools were combined to overcome this and other obstacles. In some cases the results seem fairly robust, while in others the estimations are more sensitive to some arbitrary assumptions adopted. Nonetheless, even taking some of the specific quantitative estimations with reserves, the dynamic approach adopted offers solid qualitative conclusions, identify a few points invisible to static studies, raises potential research applications, allows a clearer view of the role played by the externality and offers insights on how to counteract it. In order to offer useful insights to policymaking, the values used in cost-benefit analyses should ideally be of a marginal nature26. In the present context, this means estimating the value of the

benefits that are lost with the conversion of the next hectare of forest and the costs of conserving it. Due to the commonly used valuation methods and to different scales of analysis, however, the values normally found in the literature are closer to either maximum or average values. This subtle but important difference will also be addressed in the analysis. An attempt was made to analyze the forest’s Total Economic Value as completely as possible, based both on original calculations and on the treatment of estimates available in the literature. This resulted in the analysis of 12 different kinds of benefits provided by the forest, compared with an average of 4 analyzed in the case studies discussed previously. It is important to note that despite being a common practice in the literature, analyzing the benefits provided by ecosystems through individual “services” is a simplification that tends to ignore important feedbacks38 and complex relations39,40 between the different ecosystem components, structures and services. Some of these services were directly estimated, while others were obtained from the conversion of average values found in the literature. Some of the services commonly listed in ecosystem services frameworks28,51 do not directly affect human well-being, and should be considered as prerequisites for other services that have a more direct impact. MEA (2005)1 classifies these services as “support services”. Among them are the services of soil formation and nutrient cycling. Although the decomposition processes that lead to the formation of soil in a tropical forest are certainly indispensable for the forest to provide other services, such as climate regulation, to assign those services a separate value would be double-counting. All values were indexed to 2002 US$ using the Consumer Price Index (Bureau of Labor Statistics: http://stats.bls.gov/cpihome.htm). Values estimated in other countries were converted to Brazilian values (although still measured in 2002 US$) using the relation between PPP-adjusted per capita income of both countries. The services were grouped in four categories corresponding to each of the TEV categories. The adoption of different approaches to analyze each category has proven to be a key measure to overcome some of the pitfalls encountered. Direct Use Values These are benefits generated at present by natural systems through mankind’s production and consumption activities. They are, therefore, the benefits most subject to market characteristics. The three services included in this group have relatively well-developed markets. These are services for which there is a limited demand, which is disputed both by other suppliers of the same goods and services and by other substitute goods and services. Consequently, the demand curve for them is relatively elastic. In general, studies that estimate direct use values follow a similar process: First an attempt is made to identify the quantity of each good or service that can be produced in a sustainable manner within a generic unit (usually a hectare) of the ecosystem under analysis. Then, the quantity found is multiplied by the market profit of each one of these products. The values found from this method, however, are in essence maximum unit values, normally considerably distinct from marginal unit values. Take the case of forest timber products, for example. The most recent valuation studies of the Brazilian Amazon18,19 use a value of US$ 33 ha-1 yr-1 as a reference of the benefits obtained from sustainable timber exploitation of one hectare of Amazon forest. Although it is perfectly acceptable to affirm that in one hectare of generic forest the quantity of wood to be produced sustainably can

yield the annual return referred to, the use of this value as the marginal benefit of this activity in the Amazon forest is not correct. This is due to the fact that all sustainable timber for which there is a potential market can be produced in an area approximately equal to 10% of the present area of the forest. Therefore, at the present stage, the next deforested hectare does not diminish the total benefit that could be obtained from commercial exploitation of sustainable timber. Consequently, at the present stage, the marginal value of conservation related to timber exploitation is zero. Only when the remaining area is equal to the area necessary to meet the potential demand does deforestation of one hectare result in losses from this activity. The same rationale can be applied to the other benefits corresponding to Direct Use Value. 1.1 Timber Products Two of the most recent studies reviewed that analyze the benefits of the Brazilian Amazon, Andersen et al. (2002)18 and Seroa da Motta (2005)17 use the value of US$ 33 per year per hectare obtained from Almeida and Uhl (1995)52. According to Almeida and Uhl (1995)52, the volume of timber removed from each hectare in the 30-year sustainable cycle is equal to 38 m3, that is, approximately 1.25 m3 per year. Nepstad et al. (1999)53, on the basis of interviews with loggers in the area, present three different estimates for the volume of timber removed from one hectare of Amazonia. The lower estimate is 19 m3 for the entire cycle (or 0.63 m3 per year), the medium estimate is 28 m3 for the cycle (or 0.93 m3 per year) and the highest estimate is 40m3 for the cycle (or 1.33 m3 per year). Asner et al. (2005)36 presented estimates for the years 2000, 2001 and 2002 of respectively 26.6 m3, 21.7m3 and 21.4 m3 per hectare. According to data from IBAMA cited by Lentini et al. (2005)54, the average volume authorized by IBAMA in 2004 in the Forest Management Plans was 27.3 m3 per hectare for the 30-year cycle. This volume is also similar to the average intensity of exploitation on the Small-scale and Community Forest Management Plans authorized by IBAMA, equal to 0.9m3 per hectare per year (Lentini et al., 2005)54. The average between Nepstad et al. (199953) medium estimate (28m3), Asner et al. (2005)36 mean (23,2m3) and IBAMA’s FMP authorized volume (27,3m3) is equal to 26m3 for the 30-year cycle, or 0,87m3 per year, and will be used in this estimate. Extrapolating for the entire area under analysis, this estimate corresponds to sustainable production of 293 million cubic meters of timber per year. According to IBGE (2006)55, in 2005 the total amount of timber extracted from planted forests in the Northern Region of Brazil was 4,2 million cubic meters and the amount of timber in logs “collected” from the forest in the Northern Region was 12,7 million cubic meters. The total production was thus approximately equal to 17 million cubic meters. According to Lentini et al. (2005)54, timber production in logs in the Amazon region in 2004 was approximately 25 million cubic meters. Once again, the conservative character of the analysis leads us to use this later figure in this estimate. Therefore, the annual sustainable yield that would be possible in the region is more than eleven times greater than the current annual production of timber from Amazonia. Thus, an extrapolation for the entire area under analysis of the monetary values found in the examination of one hectare is shown to be a strong misrepresentation of reality.

The area necessary for production of all the timber for which there is a market is much smaller than the area of the present forest. Therefore, at the present stage, conversion of the forest does not diminish the total benefit obtained from commercial exploitation of timber. Consequently, at the present stage, the marginal value per hectare is equal to zero. When conversion progresses up to the point where the remaining area is equal to the area necessary to produce the timber for which there is a potential market, each hectare removed would represent a loss equal to the profit that could be realized from exploitation of the timber produced on that hectare. The marginal value will then be constant and equal to this profitc. Although IBGE (2006)55 foresees that timber production from Amazonia will fall in the next few years, it will be assumed here that the conservative volume of 25 million cubic meters chosen will be maintained. A further conservative assumption – in the sense that it increases the area that would not be converted from the national point of view – will be adopted. The performance of Brazil in the international tropical timber market is very weak. Brazil is not among the five main exporters. It is foreseen, however, that the main exporter, Malaysia, will lose market share with the exhaustion of its extraction areas. It is here assumed that Brazil will occupy its position, exporting around 5.5 million cubic meters of timber per year (World Bank, 2000)56. Thus adding the 5.5 million de cubic meters from this new market to the value found for 2004, the total size of a potential annual market for Amazonian timber would be equal to 30 million cubic meters. Applying to this potential market an average intensity of 26m3 for the 30-year cycle, or 0.87 m3 per year, we have the area necessary for sustainable planting to meet the production desired, that is 34.5 million hectares. The annual value of US$ 33 ha-1 yr-1, found by Almeida and Uhl (1995)52 – chosen for the strict methodology and for having been carried out in Brazilian Amazonia – will represent the marginal benefit of conservation of each hectare below the area estimated above. Thus the equation that represents the behaviour of the marginal unitary benefits from this service is:
Eq. 1.1
∈=∈=
)000.000.336;001.000.34(|0
)000.000.34;1(|33
xy
xy
It is assumed that the profit from exploitation of the timber will be appropriated by national producers and therefore the values estimated will be added to the national portion of the benefits of conservation. 1.2 Non-timber Forest products This refers to non-timber products that can be cultivated sustainably, such as latex, resins and oil seeds, as well as several types of food. In opposition to the case of timber, there is not enough data available to compare the potential and actual market for NTFPs in physical units. Therefore monetary values will be used for this comparison, what can lead to distorted results. As expressed in the limitations sections, however, this distortion would only begin to have an impact on the analysis carried in this article if the correct minimum area were ten times greater then the one estimated below. Given the conservative assumptions adopted here, this is very unlikely to be the case.
c The legal international market for tropical timber is highly competitive, with suppliers subject to international equilibrium prices.

According to IBGE (2006)55, the NTFPs production in the nine states that compose the “Legal Amazon” amounted to US$ 149 million in 2005. It should be noted that this area is larger than the area under analysis and therefore the potential market will be a conservative super estimation. For instance, 99% of babacu production (or 34% of total NTFPs value) comes from the state of Maranhao and from transitional ecosystems different from the evergreen broadleaf forest that is the focus of this study. Table 1.2 summarizes the estimates of the potential sustainable production of NTFPs in one hectare of a tropical forest. As can be seen, the values vary widely, ranging from US$ 11,51 to US$ 1032. As Peters et al. (1989)57 estimate is more than two times greater than the second largest estimate found and have been considered an outlier before18, it will not be included in the analysis. The average of the other 9 estimates is US$ 135.91. To be on the conservative side and to avoid temporal and spatial benefit transfer problems (link ecol econ), the value presented by Shone and Cavaglia-Harris (2005)62 will be chosen to reflect the potential economic returns of sustainable NTFPs produced in one hectare. As a further conservative assumption, instead of using their estimate for potential production (that included both goods consumed by the families and sold to the market), it will be used the value referring to the marketed fraction only, or US$ 16.94 ha-1 y-1. Note that this value is one-eighth the average of the studies found. Table 1.2 - NTFPs
Study Country Original Value
GNP per capita adjusted (2002 US$)
Peters et al. (1989)57 Peru 422 636.75 924.16 Anderson et al. (1991)58 Brazil 59 59.00 77.94 Pinedo-Vasquez et al. (1992)14 Peru 23 34.70 44.49 Chopra (1993)59 India 98 285.95 356.10 Godoy et al. (1993)60 Mexico 116 97.50 121.42 Godoy et al. (1993)60 Peru 20 30.18 37.58 Grimes et al. (1994)61 Ecuador 105 215.69 261.76 Kumari (1994)16 Malaysia 11 9.07 10.71 Batogoda et al (2000)20 Sri Lanka 186 396.81 414.64 Shone and cavaglia-harris (2005)62 Brazil 34.43 34.43 34.43 Mean (without Peters et al., 1989)57 135.91 Value Used 16.94 Multiplying this conservative potential market production by the area under analysis, yields a conservative potential production of US$ 5.7 billions per year. Even this conservative underestimation of the potential production, however, is approximately 38 times the conservative super estimation of the market currently existent for NTFPs from the Amazon region. Therefore, similarly with the timber case, it can be inferred that the next deforested hectare will not reduce the total benefits from the NTFPs and so the current marginal value of this activity is still zero. The marginal value will become positive when the conversion process reaches the minimum area necessary for the production of all NTFPs for which there is a potential market. Dividing the existent market (US$ 149 million y-1) by the potential monetary returns of one hectare (US$ 16.94 ha-1 y-1), this minimum area is conservatively estimated at 8.8 million hectares. Formally:
Eq. 1.2
∈=∈=
)336000000;8800001(|0
)8800000;1(|94.16
xy
xy

As in the case of timber products, these values will be added to the national portion of the benefits of conservation. 1.3 Recreation The benefits generated by recreational activities in the ecosystem under analysis are related to the tourism practiced in the region. The values found in the literature for recreational activities in tropical environments are listed in Table 1.3. Table 1.3 – Recreation
Study Country Original Value
GNP per capita adjusted (2002 US$)
Tobias and Mendelsohn 199163 Costa Rica 52 44.27 58.49 Edwards (1991)64 Ecuador 55 112.98 149.25 Ruitenbeek (1992)65 Cameroon 5 17.28 22.16 Andersen et al (2002)18 Brazil 1.6 1.60 1.60 Seroa da Motta (2005)17 Brazil 9 9.00 9.00 The values listed above were obtained through very similar methods, which consisted basically in measuring or estimating a total value for the market in the tourism sector in a given region and dividing it by the area of that region. As was observed by Seroa da Motta (2005)17, “due to the dimensions of the still preserved area of Amazonia, it is plausible to suppose that the potential for [recreational] activities can be assured, even with a quantity of forest lower than that currently existing”. Thus, it can be assumed that the dynamic behaviour of the marginal benefits of this service would be similar to the services previously analyzed. It would thus be equal to zero in the present stage and become positive when the minimum area in which the maximum potential per hectare can still be exploited is reached. The first three studies listed analyse smaller national reserves or parks in other countries in which there is a relatively well-developed ecotourism sector, and which could be considered an estimate of the maximum potential per hectared . The average among them is US$ 76.63 and will be used to represent this maximum potential. The last two studies seek to estimate the maximum potential for tourism in Amazonia. While Andersen et al. (2002)18 stipulate a value of US$ 800 million per year, Seroa da Motta (2005)17 assigns to Amazonia a potential per hectare equal to that found today in the region of the Pantanal, where the tourism industry is much more developed. Multiplying this value by the area of Amazonia, we find a potential market equal to US$ 3.25 billion. The average of the two markets is therefore approximately equal to US$ 2 billion a year. Dividing this market potential by the maximum potential benefit estimated above, we have a minimum area of 26 million hectares – or approximately 7.7% of the present area of Amazonia. Considering that below this area greater concentrations of tourist activity would cause “crowding” and a consequent loss of “the wild experience”, it will be considered that the marginal benefit from
d The first three studies focus, respectively, on the Monteverde Cloud Forest reserve in Costa Rica, on the Galapagos National Park in Ecuador and on the Karup National Park in Cameroon.

this point on would be equal to the US$ 76.63 ha-1 yr-1 estimated previously. Its formal representation is therefore:
Eq. 1.3
∈=∈=
)336000000;26000001(|0
)26000000;1(|63.76
xy
xy
Even considering that the recreation values from tourism are in part appropriated by foreign companies and in part appropriated by national companies, in the dynamic costs-benefit analysis of the conversion process, the value above will be conservatively related exclusively to the national component. Indirect Use Value These are the benefits provided by the ecosystems today, and which do not depend on human activity. The main difference from direct use services is that indirect use services do not depend on markets and are always fully absorbed by humanity. There is no such thing as excessive water regulation or too much erosion control. This does not mean, however, that there are no substitutes for these services or ways to compensate a fall in their provision. The difference is that generally these substitutes are imperfect, expensive and limited, normally allowing compensation only for relatively small variations on the provision of the original service. That is another reason why the marginal demand curve of this services is initially less inclined, becoming steeper as the conversion progress (as shown in Figure 1). As will become clear, the studies found in the literature concerning 5 of the 6 indirect use benefits (the exception being climate regulation) usually estimate average values. To carry out the analysis proposed for this paper, however, it is necessary to use marginal values. It was thus necessary to convert the average values into marginal ones. Of all the works reviewed that show similar curves, only one30 proposes a specific function to describe the behaviour of ecosystem benefits over the progress of conversion. The proposed function, the rectangular hyperbolic, is used here to represent the dynamic behaviour of IUVs. As well as having a behaviour similar to that shown in Figure 1, this function has an interesting application here. As detailed in Appendix A, it allows the average and total values found in the literature to be converted into marginal values through the formula: MgV = AvV / ln(x) where x is the area of the ecosystem under analysis. It is important to point out that the choice of the rectangular hyperbolic function is arbitrary and therefore the marginal values obtained through it should be approached with caution. However, in addition to respecting the ecological and economic principles cited, it will be shown that this function generates results that are compatible with the studies of comparative valuation previously analyzed and with other related studies. 2.1 Climate Regulation The measurement of the global climate regulation service provided by tropical forests is much facilitated, if compared with the other indirect benefits, by the widespread attention given to the climatic question that resulted in a large volume of research associated to the theme and in the creation of carbon markets.

The estimation of the benefits from this service is composed of five stages. In the first, it is necessary to estimate the quantity of carbon present in one hectare of a tropical forest such as Amazonia. In the second, to estimate the fraction of carbon that is emitted to the atmosphere when the forest in converted to other uses. The third step consists of including the effect of other greenhouse-gas emitted in the process. Then the estimated emissions per hectare are multiplied by the monetary value corresponding to non-emission of one tonne of carbon. Finally, as the product obtained is a present value, a discount rate is applied to obtain annual values. Estimates for the carbon contained in one hectare of a tropical forest vary widely (Houghton et al, 2001)66. The value used here is the average of the carbon density used in six studies focused on the Brazilian Amazon, listed in the first column of Table 2.1, equal to 190 MgC ha-1. In order to keep the estimate on the conservative side, the release of carbon from soil during the conversion (varying between 3,92 MgC ha-1[67], 16Mg ha-1[68] and 24 MgC ha-1[69] will not be added to this estimate. The next step is to consider the fraction of carbon that is in fact released to the atmosphere when the forest is converted to alternative uses. Two different approaches are used in the literature. Fearnside (1997)67 makes a very detailed account of the carbon released in the 10 years following the conversion of a hectare of forest to an “equilibrium landscape”, containing 4% of farmland, 43,8% of productive pasture, 5,2% of degraded pasture, 2,0% of secondary forest derived from farmland and 44,9% of secondary forest derived from pasture. He concludes that this equilibrium landscape would hold 6% of the original carbon biomass. From the remaining 94%, approximately 42% would be released through three sequential burnings, 55,6% would be released through decay and 2,4% would become trapped as charcoal. Therefore, from the initial carbon content in the forest, approximately 91,7% would be released to the atmosphere. Achard et al. (2004)70 do not focus on the conversion to alternative uses, but following the bookkeeping model by Houghton et al. (2000)71, present two estimates for the fractions of carbon emitted over time in the process of the deforestation: a “best estimate” of 28% (1st year), 69% (10 years) and 92% (25 years) and a high estimate of 44% (first year), 94% (10 years) and 97% (25 years). The present estimate will consider that the alternative use will hold Fearnside’s estimate of 6% of the original carbon, or 11,4 MgC. To estimate how much of the remaining 178,6 MgC will be released, it will be applied to it the average between Achard “best estimate” for the 25 years time horizon (still conservative if compared to IPCC’s 100 years time horizon), or 92%, and Fearnside’s 97,6%. The resulting estimate is that 94,8% of the 178,6 MgC, or 169.3MgC (equivalent to 89.1% of the original carbon content)will be released to the atmosphere when one hectare of the forest is converted. These 169.3MgC correspond to 620.8 MgCO2. Carbon Dioxide, however, is not the only greenhouse-gas emitted in the conversion process. Smaller fractions of Methane (CH4) and Nitrous Oxide (N2O) are also emitted. As their global warming potential is much higher then that of CO2 (21 for NH4 and 310 for N2O), however, they have a significant impact in the total emissions. Fearnside and Laurance (2004)72, based on Fearnside (2000)73, suggest that the estimate by Achard (2002)7 should be multiplied by 1,158 to account for these two greenhouse gas effects. The same will be done here, resulting in a corrected per hectare emission of 718.9 MgCO2 equivalent. Due to the different methodologies involved, estimates in the literature of the monetary value of an avoided tonne of CO2 vary widely. Usually, highest estimates look at the potential damage one extra tonne of CO2 would cause, and lowest estimates look at the mitigation costs. The mean between the 12 values presented in the third column of table 4 is US$ 7.7 per CO2 tonne. According to Stern (2006)42, the price of allowances in the European Union Emissions Trading

Scheme, the world’s largest greenhouse gas emissions market, has been in the range of €10 to €25 (US$ 13.3 to US$ 33.3) per tonne of CO2 for most of the period since it began operating in January 2005. By the end of 2006, however, prices for emission allowances in the first phase (2006-07) declined sharply, reaching 8.50 (US$ 11.11) in the end of November74. Prices for the second phase Emissions allowances for the second trading period (2008-12), remained higher, traded at around
17 (US$ 22.22). As the values above do not foresee the use of deforestation avoided as an activity that generates carbon credits, and as this activity would have a considerable weight in this market and could, therefore, negatively impact the market price, the option is again for a conservative value. The 718.6 MgCO2 estimated above will be valued at US$1 per tonne of CO2. As the consequent US$ 718.6 per hectare is a payment made for the perpetual immobilization of that carbon, it is a present value. To be compatible with the other values used in this study, it has to be annualized. Applying an annual rate of 6%, slight below the average found in the literature, yields the final value of US$ 43.13 ha-1 y-1. Differently from the other indirect use services, in this case the value has already a marginal nature, as it corresponds to the benefits of the non-emission of (or to the damage of emitting) the greenhouse gas from the next deforested hectare. To simulate the behaviour of this value as the remaining area of the forest diminishes, it will be used the rectangular hyperbolic function described earlier. Although for the last few hectares this function projects a very sharp increase in the values, for most of the area (and for all the area relevant to this study) this choice is also a conservative one. Clarkson and Deyes (2002)75, for instance, project that the value would rise US$ 1,5 per tonne (c. 5% of their estimated value) every year, as the GHG concentration in the atmosphere rises. With the rectangular hyperbolic function adopted here, a similar 5% rise would only occur when the current area is reduced by 16 million hectares, which would take 8 years according to the historical rate of conversion. Assuming this rate to remain constant, the value projected by the rectangular hyperbolic function would be smaller then the value projected using Clarkson and Deyes (2002)75 5% a year increase for more than 99.9% of the area. The benefit related to this service is also likely to rise due to an expected increase of forest biomass in tropical forests in a warmer climate76. The formal expression of the behaviour of the marginal value of this service is: Eq. 2.1: y = 14,491,680,000/x | x E (1:336,000,000) As they are related to a global service, the estimated values will be included in the global portion of the benefits of conservation.

Table 2.1 – Climate Regulation Carbon Density
(MgC ha-1) Carbon emitted
Trace gas correction
US$ MgC (2002 US$)
Discount Rate
Final Value
192[66] 91.7% [67] +15,8% [73] US$ 4.69 [79] 8 % [84] US$ 77.94 [79]
156 [77] 92% [71] US$ 3.32 [80] 5 % [82] US$ 443.86 [85]
196 [78] US$ 24 [81] 2 % [18] US$ 121.36 [80]
195 [71] US$ 0.55 [82] 6 % [18] US$ 242.72 [84]
186 [70] US$ 2.24 [82] 12 % [18] US$ 20.18 [82]
217 [67] US$ 20.22 [82]
6 % [17] US$ 78.48 [82]
US$ 29 [75] US$ 706.28 [82]
US$ 2.73 [18] US$ 20 [18]
US$ 1.37 [18] US$ 30 [18]
US$ 0.27 [18] US$ 12 [18]
US$ 3,6 [83] US$ 18 [17]
US$ 0.82 [17]
Mean 190 - 15,8% US$ 7.7 6,5% US$ 161 Value Chosen
190 89.1% 15,8% US$ 1 6% US$ 43.13
2.2 Waste Treatment Vegetable cover has the properties of storing and recycling certain quantities of organic and inorganic wastes generated by humanity. Conversion of the forest implies an increase in damage caused by pollution. Measuring this service, both in physical as in monetary units, however, is very complex. The work by Pimentel (1997)86 is based on a physical estimate of the quantity of wastes produced by humanity and costs of treatment, and estimates a total global value for this service in the order of US$ 760 billion dollars per year. Costanza et al (1997)28 propose that this value could be divided by the area of all forests (not just tropical forests) and grasslands on the planet, resulting in an average value per hectare of US$ 87. Table 2.2 summarizes the conversion to marginal values. ha-1 yr-1. Table 2.2 - Waste treatment
Study Country Original Value
GNP per capita adjusted
(2002 US$)
Current Marginal Value (US$ ha-1 yr-1)
Pimentel et al. 1997 [86] Global 87 87 99.77 5.08

The equation that expresses its marginal behaviour during conversion is: Eq. 2.2: y = 1,706,880,000/x | x E (1;336,000,000) Given the local and regional character of this service, this value will be added to the national portion of benefits of the forest. Hydrological-related services The next four services are directly or indirectly related to the hydrological cycle of the forest and therefore complement each other. 2.3 Disturbance regulation This service is related to the capacity of the forest to absorb environmental disturbances, such as storms, floods and droughts. This capacity is fundamentally related to the vegetable structure of the forest. Conversion of a complex structure such as the tropical forest into a simple structure such as a plantation or pasture reduces this capacity. No study was found that estimates the value of this service in the Brazilian Amazon. Costanza et al. (1997)28 and Torras (2000)29 use the work by Ruitenbeek (1992)65, carried out in Korup National Park, in Cameroon. The author used the methods of avoided costs to value this service provided by the local ecosystem, which is also of tropical forest type. The value found is an average value. So the method described in the beginning of this section will be used to convert it to marginal value. Table 2.3 summarizes the operations. Table 2.3 - Disturbance regulation
Study Country Original Value
GNP per capita adjusted
(2002 US$)
Current Marginal Value
Ruitenbeek (1992)65 Cameroon 2 6.91 10.03 0.51 The function that describes its dynamic behaviour is represented below: Eq. 2.3: y= 171,360,000/x | x E (1;336.000.000) As it is a service of a local character, this value was added to the national portion of the forest’s benefits. 2.4 Erosion Control Vegetable cover impedes soil sediments from being swept away by natural erosion agents, such as wind and rain. This service has an on-site and an off-site component. The on-site component keeps the soil nutrients available for plants to use them for their growth. For the reasons described in the introduction of this section, however, this on-site component can be considered a prerequisite for providing other services. Adding a value to this component would be double counting.

The off-site component is related to prevention of silting of rivers as a result of converting the forest. Maintaining the original cover avoids damage from silting, especially for fishing, river transport and hydroelectric stations. Seven studies listed in the first column in Table 2.4 estimate the benefits of this service in tropical forests in different regions of the planet. The fifth column lists the values adjusted to Brazil and updated to 2002 dollars. According to Torras (2000)29 e, the off-site portion is equivalent to 5/7 of the total of this service, (sixth column). Finally, these values were converted to marginal values, listed in the final column. Table 2.4 – Erosion Control
Study Country Original Value
GNP per capita adjusted
Average Benefits (2002 US$)
Off-site Average Benefits
Off-site Marginal Benefits
Cruz et al. (1988)87 Phillipines 23 41.05 62.38 44.56 2.27 Magrath and Arans (1989)88 Indonesia 5 9.29 13.48 9.63 0.49 Dixon and Hodgson (1988)89 Philippines 321 585.62 890.01 635.72 32.38 Chopra (1993)59 India 145 423.09 526.89 376.35 19.17 Chomitz and Kumari (1996)90 Ecuador 4 8.22 9.70 6.93 0.35 Chomitz and Kumari (1996)90 Philippines 45 82.10 96.93 69.23 3.53 Torras (2000)29 Brazil 238 238.00 248.69 177.64 9.05 The average of these values, equal to US$ 9.60 ha-1 yr-1, will be used to represent the current marginal value of this benefit. Note that this value is very close to the value adjusted from Torras (2000)29, which is both the most recent and the only one focused on the Brazilian Amazon. This indicates that the distortion from temporal and spatial benefit transfer is not relevant in this case. The equation that regulates the marginal dynamic behaviour for the value of this service is: Eq. 2.4: y = 3.225.600.000/x | x E (1; 336.000.000) As these benefits are of a regional nature, they will be included in the national portion of benefits of the forest. 2.5 Water regulation Forest cover exerts a fundamental role in maintaining the hydrological cycle. Differently from the disturbance regulation service, this service refers to the everyday regulation of the hydrological
e Calculations based on Cruz et al. (1988)87, Dixon and Hodgson (1988)89 and Chopra (1993)59.

cycle and its positive effects on natural irrigation, drainage, regulation of water discharge into rivers and regulation of river flow. The studies by Kumari (1994)16 in Malaysia and Fearnside (1997)82 in the Brazilian Amazonia were updated and converted to marginal value, as shown in Table 2.5. Table 2.5 – Water regulation
Study Country Original Value
GNP per capita adjusted
(2002 US$)
Current Marginal Value
Kumari (1994)16 Malaysia 25 20.68 24.42 1.24 Fearnside (1997)82 Brazil 19 19.00 21.30 1.08 The average between then is US$ 1.16 ha-1 yr-1 and represents the marginal value of this service at the current stage of the conversion process. The equation that shows its behaviour over conversion is: Eq. 2.5: y = 389.760.000/x | x E (1;336.000.000) As the service is of a regional character, this value is added to the national portion of benefits of the forest. 2.6 Water supply This service is the role of the forest in filtering, retaining and storing water for consumption. According to FAO (2006)91, Brazil uses only 0.4% of its renewable water resources. Furthermore, evidence from the literature92 suggests that the role of forests on the provision of water is ambiguous. There is evidence that a decrease in forest cover in fact increases the water available for consumption93. For these reasons recent studies have decided to attribute a zero value for this service18. The positive value chosen here is, therefore, a conservative assumption. According to the study by Kumari (1994)16, the market value of water supplied by one average hectare of tropical forest is equal to US$ 11 . Converting this value to marginal value yields US$ 0.56 per year for the next deforested hectare. Table 2.6 – Water supply
Study Country Original Value
GNP per capita adjusted
(2002 US$)
Current Marginal Value
Kumari (1994)16 Malaysia 11 9.33 11.02 0.56 The equation that shows the behaviour of the marginal value of this service over conversion is: Eq. 2.6: y = 188.160.000/x | x E (1;336.000.000) As the service is of a regional and local character, this value is added to the national portion of benefits of the forest.

Option Value This service is related to the possible new benefits that can be generated by the forest in the future, perhaps arising from new environmental, social, economic or technological conditions. It can be understood as a risk premium that individuals are ready to pay to keep future options open. In the literature, the option value is almost exclusively related to the still unexploited potential of biodiversity to produce new pharmacological products. In this case, again, almost all the works available use methods that result in average unit values. This fact is noted by the only studies found94,95 that actually seek to estimate marginal values. However, as well as starting from very arbitrary premises, and thus reaching admittedly debatable results, their methodology is directed to small hotspots of biodiversity, and cannot be applied to this study. The nine studies found that estimate average option values for tropical forests are listed in the first column of Table 3. The fifth column list these average values adjusted for the Brazilian Amazon in the year 2002. In the same way as with the IUVs, these average values need to be converted into marginal ones. Differently from the previous section, however, it is possible to reach this objective without resorting to an arbitrary function. As the benefits in question are fundamentally related to biological diversity, a function can be reached that relates the marginal option value of all species in an ecosystem with its area. A species that has not yet been tested has the potential for development of new products. The value of this untested species depends on the percentage of successes in previous tests, on the cost of tests and the profit in case of success. Although some have sought to estimate this value, in this case this complex operation is not necessary. Even though every kind of ecosystem has its own values for the constants, the relationship between an ecosystem area and the total number of species contained in it adapts very well to a power function, with the general form of: S = kAz
where S is the number of species, A is the area and k and z are constants. Now, if the total number of species S is multiplied by the potential monetary value of a species, say w, a function is reached that relates the total value (TV) of all species as a function of the area: TV=w.k.Az or (where c=wk) TV=c.Az (1) As : AV=TV/A (where AV stands for average value): We have: AV . A = c . Az or c =AV . A/Az (2) Differentiating (1), we have: MgV= δtV/δA = z . c . Az-1 (3) (where MgV stands for marginal value) Substituting (2) on (3): MgV = z . (AV . A/Az). Az-1 = z .AV . A/Az . Az-1 = z .AV . A1-z . Az-1 = MgV = z . AV (4) As z is a known parameter, conversion of the average values available in the literature to marginal values becomes trivial. The value of the constant z, which defines the inclination of the species-area
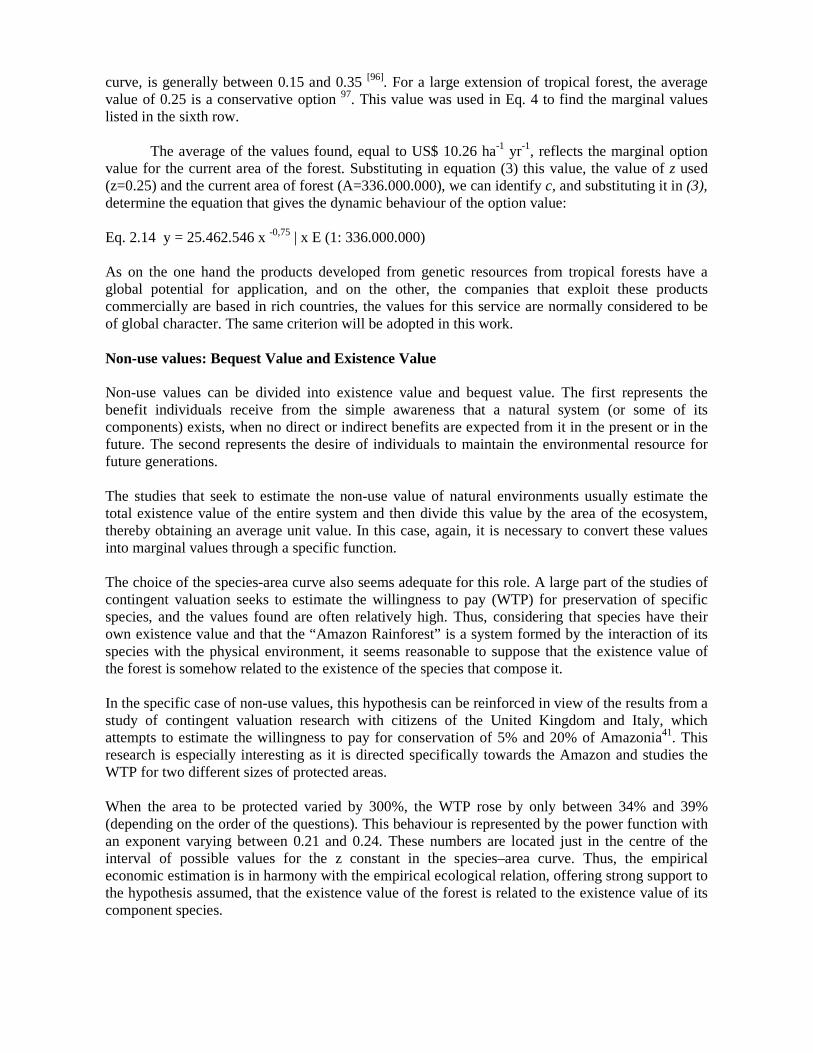
curve, is generally between 0.15 and 0.35 [96]. For a large extension of tropical forest, the average value of 0.25 is a conservative option 97. This value was used in Eq. 4 to find the marginal values listed in the sixth row. The average of the values found, equal to US$ 10.26 ha-1 yr-1, reflects the marginal option value for the current area of the forest. Substituting in equation (3) this value, the value of z used (z=0.25) and the current area of forest (A=336.000.000), we can identify c, and substituting it in (3), determine the equation that gives the dynamic behaviour of the option value: Eq. 2.14 y = 25.462.546 x -0,75 | x E (1: 336.000.000) As on the one hand the products developed from genetic resources from tropical forests have a global potential for application, and on the other, the companies that exploit these products commercially are based in rich countries, the values for this service are normally considered to be of global character. The same criterion will be adopted in this work. Non-use values: Bequest Value and Existence Value Non-use values can be divided into existence value and bequest value. The first represents the benefit individuals receive from the simple awareness that a natural system (or some of its components) exists, when no direct or indirect benefits are expected from it in the present or in the future. The second represents the desire of individuals to maintain the environmental resource for future generations. The studies that seek to estimate the non-use value of natural environments usually estimate the total existence value of the entire system and then divide this value by the area of the ecosystem, thereby obtaining an average unit value. In this case, again, it is necessary to convert these values into marginal values through a specific function. The choice of the species-area curve also seems adequate for this role. A large part of the studies of contingent valuation seeks to estimate the willingness to pay (WTP) for preservation of specific species, and the values found are often relatively high. Thus, considering that species have their own existence value and that the “Amazon Rainforest” is a system formed by the interaction of its species with the physical environment, it seems reasonable to suppose that the existence value of the forest is somehow related to the existence of the species that compose it. In the specific case of non-use values, this hypothesis can be reinforced in view of the results from a study of contingent valuation research with citizens of the United Kingdom and Italy, which attempts to estimate the willingness to pay for conservation of 5% and 20% of Amazonia41. This research is especially interesting as it is directed specifically towards the Amazon and studies the WTP for two different sizes of protected areas. When the area to be protected varied by 300%, the WTP rose by only between 34% and 39% (depending on the order of the questions). This behaviour is represented by the power function with an exponent varying between 0.21 and 0.24. These numbers are located just in the centre of the interval of possible values for the z constant in the species–area curve. Thus, the empirical economic estimation is in harmony with the empirical ecological relation, offering strong support to the hypothesis assumed, that the existence value of the forest is related to the existence value of its component species.

As the willingness to pay estimated for two different area sizes by Horton et al. (2002)41 and the species-area curve have the same behaviour in relation to the area of the forest, it is feasible to assume that the WTP would maintain this behaviour for the entire area under analysis. Another advantage of the work by Horton et al. (2002)41 was that the authors asked about the motivations for payment. As for 33% of respondents the main motive was concern for future generations and for 17% concern was related to the preservation of species diversity (but not for personal use, as on the option value), these percentages were used here to calculate the total values in relation to bequest and existence values, as shown in the fifth row of Table 4. Following the methodology employed by Seroa da Motta (2005)17 these values for families in the UK and Italy will be extrapolated to total global WTP, using PPP-adjusted per capita incomef (sixth row). And finally, from these total global values found, it is possible to estimate the equations that show the behaviour of total bequest and existence values as a function of the area of the forest (seventh row). From these equations, it is possible to calculate the equations that govern the behaviour of the marginal valuesg (eighth row). Table 4 – Non-Use Values Bequest Value Existence Value Area (%) 5% 20% 5% 20% Area (million ha) 16.8 67.2 16.8 67.2 Original WTP per family US$ 36 US$ 50 US$ 36 US$ 50 WTP per family related to each value US$ 11,88 US$ 16,5 US$ 6,12 US$ 8,5 Global WTP related to each value US$ 4,3 x10⁹ US$ 5,9 x10⁹ US$ 2,2 x10⁹ US$ 3,1 x10⁹
Total Value Function Y = 82.949.835x0,24
42.978.745x0,24
Marginal Value Function y = 19.907.960x -0,76 y = 10.314.899x -0,76
The equations that govern the marginal behaviour of the bequest and existence values are, therefore, respectively: Eq. 4.1: y = 19.907.960 x -0,76 | x E (1: 336.000.000) Eq. 4.2: y = 10.314.899 x -0,76 | x E (1: 336.000.000) Substituting the current forest area in the equations we find the values US$ 6.59 ha-1 yr-1 and US$ 3.42 ha-1 yr-1, which represent, respectively, the marginal bequest value and the marginal existence value at the present stage of the conversion process.
f Using the formula WTPD=WTPO(PPPYD/PPPYO)e where e is the marginal elasticity of income (supposing e=1), WTPO the willingness to pay in the original region, WTPD the willingness to pay for the region that one wishes to adjust to, and PPPYD/PPPYO the ratio between income per capita (measured in purchase power parity) of the destination region and the original one. Countries were grouped into three blocks, corresponding to high, medium and low income. g Calculations were made from data obtained by Horton et al. (2002) when these ask first about the larger area. As was observed by Seroa da Motta (2005), “for an estimate of existence value, the use of values with decreasing scopes is more conservative, as the anchorage affects lower and not greater stocks”.

Due to the global character of the non-use values, supported by the fact that all the estimations carried out here came from contingency valuation studies carried out on other continents, its benefits will be added to the global portion of benefits of conservation of the forest. The costs of conservation As mentioned previously, the cost of conserving the forest has two main components. The most important one is the opportunity cost – the benefits that could be obtained by converting the area to other uses. Among several studies reviewed that suggest values for alternative land-uses, three recent ones17,18,42 focus specifically in the Brazilian Amazon and follow careful albeit different methodologies. Andersen et al. (2002)18 estimated the impact that the conversion of one additional hectare had in the rural GNP of the Amazon region between 1985-1995. They concluded that one additional converted hectare generated an increase of US$ 48,48 per year in the region’s rural GDP. Seroa da Motta (2005)17 estimated his opportunity costs based on the values for leasing land for cattle ranching in the Amazon. He argues that the leasing annual value is much less affected by the market failures that distort the land purchasing price. The values varied from US$ 32,6 and US$ 49,5, with an average of US$ 38,4 ha-1 y-1. Grieg-Gran (2006)101, on a paper commissioned by Stern (2006)42, estimates the return per hectare for several land-uses in the Amazon region. Ponderating each one by the area it currently occupies yields an annual value if US$ 57 ha-1 on the medium scenario. The average between the three values can be considered a good estimate for the mix of alternative uses available in the region. It is then necessary to estimate the behavior of these benefits throughout the progress of conversion. In opposition to the forest benefits’ case, there is no clear general dynamic behavior here. It has been argued31 that these costs would drop when the remaining area diminishes, as the areas with higher value for alternative uses would be converted first. It is not clear, however, if this is the major driver behind the geographical distribution of the conversion process. In the Brazilian Amazon, the transport infrastructure seems to play a greater role46,47,102. As this infrastructure is expanded, the returns from conversion would rise. An important factor is the relative share that each alternative use has in the total mix of future deforested areas. Although cattle ranching is still the dominant alternative land-use in the Amazon region35, soybean plantation is becoming increasingly important37. Although the majority (58%) of new soybean crops occupies already deforested land, a significant share (42%) is direct conversion of forest103. FAO (2006)48 projects that world soybean production will more than double until 2030 and more than triple until 2050, even when accounting for a sharp decline in the market rate of growth. Brazil is forecast to overcome the US and become the main exporter in 2007/08 and the main producer in 2012/13 [104]. As a result, it is projected to expand the harvesting area from 21 to 31 million hectares until 2015/16 [104] and to more then double its current area until 2050 [48]. These projections already suppose that Brazil will increase its productivity from current 2,72 t/ha to 2,99t/ha, becoming more productive than the US. As returns from soybean plantation are nearly five times higher than returns from cattle ranching101, the likely increase in the former’s share of new deforested areas would lead to higher opportunity costs in the future. Despite the likely increase, another conservative assumption will be adopted by considering that these costs will remain constant as the conversion proceeds.
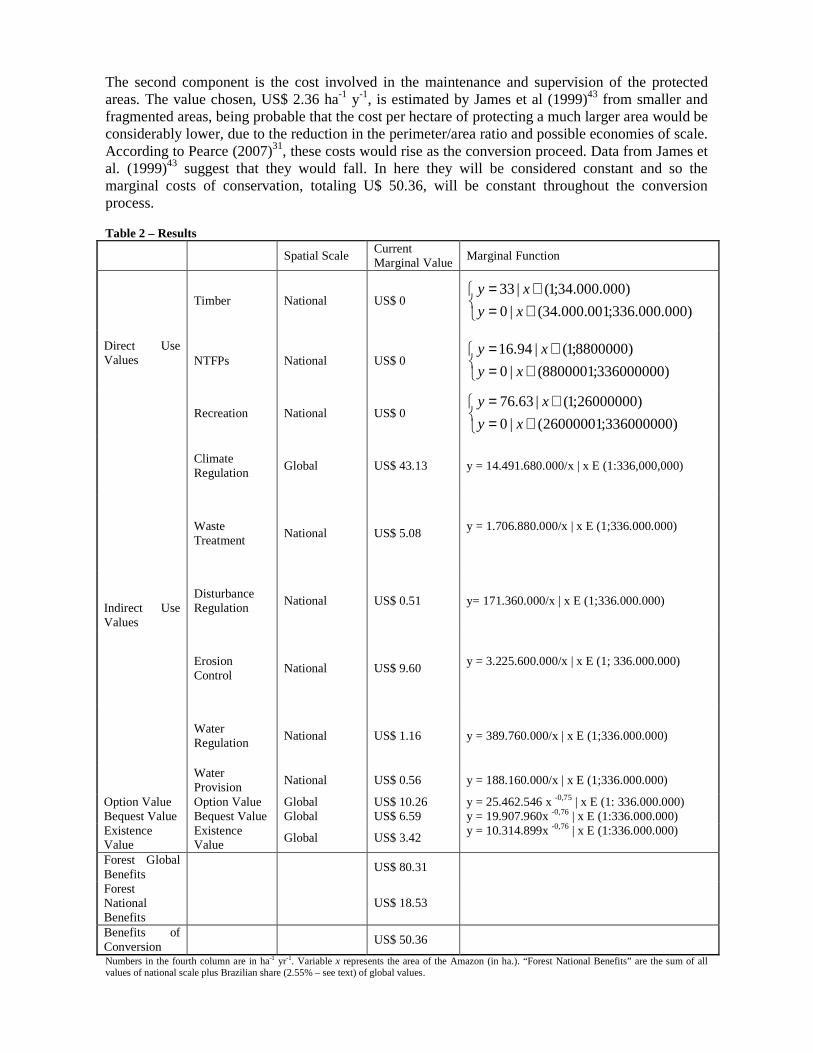
The second component is the cost involved in the maintenance and supervision of the protected areas. The value chosen, US$ 2.36 ha-1 y-1, is estimated by James et al (1999)43 from smaller and fragmented areas, being probable that the cost per hectare of protecting a much larger area would be considerably lower, due to the reduction in the perimeter/area ratio and possible economies of scale. According to Pearce (2007)31, these costs would rise as the conversion proceed. Data from James et al. (1999)43 suggest that they would fall. In here they will be considered constant and so the marginal costs of conservation, totaling U$ 50.36, will be constant throughout the conversion process. Table 2 – Results
Spatial Scale Current Marginal Value
Marginal Function
Timber National US$ 0
∈=∈=
)000.000.336;001.000.34(|0
)000.000.34;1(|33
xy
xy
NTFPs National US$ 0
∈=∈=
)336000000;8800001(|0
)8800000;1(|94.16
xy
xy
Direct Use Values
Recreation National US$ 0
∈=∈=
)336000000;26000001(|0
)26000000;1(|63.76
xy
xy
Climate Regulation
Global US$ 43.13 y = 14.491.680.000/x | x E (1:336,000,000)
Waste Treatment
National US$ 5.08 y = 1.706.880.000/x | x E (1;336.000.000)
Disturbance Regulation
National US$ 0.51 y= 171.360.000/x | x E (1;336.000.000)
Erosion Control
National US$ 9.60 y = 3.225.600.000/x | x E (1; 336.000.000)
Water Regulation
National US$ 1.16 y = 389.760.000/x | x E (1;336.000.000)
Indirect Use Values
Water Provision
National US$ 0.56 y = 188.160.000/x | x E (1;336.000.000)
Option Value Option Value Global US$ 10.26 y = 25.462.546 x -0,75 | x E (1: 336.000.000) Bequest Value Bequest Value Global US$ 6.59 y = 19.907.960x -0,76 | x E (1:336.000.000) Existence Value
Existence Value
Global US$ 3.42 y = 10.314.899x -0,76 | x E (1:336.000.000)
Forest Global Benefits
US$ 80.31
Forest National Benefits
US$ 18.53
Benefits of Conversion
US$ 50.36
Numbers in the fourth column are in ha-1 yr-1. Variable x represents the area of the Amazon (in ha.). “Forest National Benefits” are the sum of all values of national scale plus Brazilian share (2.55% – see text) of global values.

Cost-Benefit Analysis Each service was classified according to its spatial nature into “national” or “global” values. Brazil also absorbs part of the global benefits provided by the forest. Brazil’s share of gross world product (PPP adjusted) is 2,55% and its share of world population is 2,89%. Albeit in this case both figures are very similar, the first one is more economically sound (as it is linked to potential WTP) and more fair. Therefore 2,55% of the global benefits will be included in the national benefits. In the first place, the present picture of the conversion process in the Brazilian Amazon provides two observations. The first is that the current global benefits of conservation, estimated at approximately US$ 80 ha-1 yr-1 are higher than the benefits of conversion, estimated at approximately US$ 50 ha-1 yr-1. This indicates that the conversion process practiced today in the Amazon is an inefficient activity, presenting costs greater than the benefits. This conclusion was reached even with the conservative assumptions for the global conservation values. The second observation is that the sum of marginal benefits of national scale currently provided by the forest, which is approximately US$ 18.5 ha-1 yr-1, is considerably lower than the marginal benefits generated by alternative activities, the aforementioned US$ 50 ha-1 yr-1. Following the same rationale, the conclusion is that, from a national viewpoint, conversion still brings more benefits than conservation. These two observations are in perfect harmony with the observations obtained from the analysis of comparative case studies made previously, demonstrating once again the decisive role that global externalities have in this context. As mentioned previously, this role becomes even clearer from a dynamic analysis of these benefits. Figure 2 is an empirical version of Figure 1, showing the dynamic behaviour of the national and global marginal benefits provided by the forest, as well as the marginal costs. Figure 2
One can observe that the curve representing the global benefits of the forest, even with the conservative assumptions applied, is constantly above the line of the costs of conservation. Thus, the optimal point from the global point of view (Qglob) would be located to the right of the current area, indicating that the conversion of the forest today already presents more costs than benefits from the global standpoint.

On the other hand, it can be seen that the national benefits provided by the forest, initially lower than those for conversion, become higher than these when conversion progresses after the point Qnat. According to economic theory, this would be the point where the process of conversion in the Brazilian Amazon would be interrupted should the Brazilian government act in order to maximize national welfare. Solving the equation
( ) 36.50x10.314.899 x19.907.960 25462546x 0/x 14491680000255.0/5681760000 -0.76-0.76-0.75 =++++x yields the national equilibrium point, approximately equal to 123 million hectares. The dynamic analysis thus allows the identification of the national equilibrium point for the process of conversion in The Amazon, which would occur at an area approximately equal to 36.6% of the current area (or 30.7% of the original extent). Note that if the Brazilian government does not intervene, the process of conversion would continue up to the optimum private point. Private owners are generally supposed to be concerned only with direct use benefits. It is likely that sustainable timber extraction and recreational activities conflict with each other to some extent. As a further conservative assumption, the minimum area of both activities will be fully summed up. Notwithstanding, the private optimum point would be located even further to the left of the national one, corresponding to approximately 18% of the current area. Therefore it would be necessary to correct national market failures so that the conversion process stabilizes at the efficient point from the national point of view, or 36.6% of the current area, and does not proceed until the private efficient point, equal to half of this area. This correction, however, is not sufficient. At the present point the conversion process of Brazilian Amazon has already become an undesirable activity that generates more losses than benefits to humanity. The dynamic approach adopted here allows visualization of the role that externalities play in this context. This failure in the economic system, represented graphically by the distance between the national and global marginal benefits curves, causes the optimal national and global points not to coincide. However, perhaps the most attractive aspect of this approach is yet to come. As the graph above is a chart of marginal benefits, the area below each curve represents total benefits. Suppose that the country holding these natural resources, in this case Brazil, wished to interrupt the process of conversion immediately, considering that this would be the preferable option for humanity as a whole. In this case, the area marked by the letter A would represent the total economic incentives contrary to this alternative, equivalent to the aggregate loss of welfare that Brazilian society would incur from this decision. These incentives against conservation can be calculated from the equation:
( )
4490893612$
x10.314.899 x19.907.960 25462546x 0/x 14491680000255.0/543984000036.50
argarg
336000000
122855539
0.76-0.76-0.75-336000000
122855539
336000000
122855539
336000000
122855539
US
x
onConservatiofBenefitsNationalinalMConversionofBenefitsinalM
=
=++++−=
=−=
∫∫
∫ ∫

These annual US$ 4,5 billion would represent a considerable loss to national welfare for a developing country as Brazil (and the vast majority of countries owning tropical forests), thus being strong incentives against the option for conservation. But the graph above offers some reasons for optimism. The gain in welfare that all the other countries in the world would have from the immediate interruption of the conversion process – the international externality –would be equal to the sums of areas A and B in the graph above. That is, the benefit to the rest from the world of this decision is greater than the loss incurred by the country. This shows a potential for win-win cooperation, with gains for both sides. If the rest of the world compensates the host country for a value equal to area A, its welfare at the current point becomes equal to its welfare at point Qnat, allowing immediate interruption of the conversion process without loss of national welfare. The way in which this sum would be distributed internally is a question related to the specific characteristics of each country. The important point here is that compensation for a value equivalent to area A would counteract the economic incentives against conservation, allowing interruption of the process without loss of national welfare. Addressing the problem from a national level helps minimize the threat leakage, a recurring problem of conservation programs. There would still be the threat of an international leakage, which could be addressed through the extension of the cooperation to other countries hosting tropical forests. Making annual payments subject to prior auditing of the state of the forests is also a powerful tool to promote compliance. Extrapolating and bringing to scale Extrapolation of the compensation values found here for other countries that have tropical forests is not strictly correct, as the evaluation should be made specifically for each region. On the other hand, comparison with values found in the literature indicates that the values estimated here are relatively close to the values for other countries and to those of developing countries as a whole. Thus, an extrapolation, with reservations, of the values found could be seen as a fair approximation. Dividing the net annual loss of national welfare estimated by the area of the Brazilian Amazon yields an average loss of US$ 13.4 ha-1 yr-1. Multiplying it by the 1.3 billion hectares of tropical forests on the planet, the total necessary to compensate all the countries that have tropical forests for immediate halting of the process of conversion would be equal to US$ 17.4 billions per year. It is important to note that in contrast to several estimates in the literature for the costs of conserving 10% or similar proportions, this figure relates to the conservation of 100% of the tropical forest existent today. These values cast down the criticism that a cooperation of this nature would be prohibitively expensive. The estimated sum total for a global cooperation that would actually halt tropical deforestation is equal to 0.04% of annual global income, to 4% of what rich countries proportionally spend on their own internal environmental protection13, to 2% of what governments currently spend on environmental harmful subsidies44 or to 2% of annual military spending45. Actual willingness to pay for conservation of only 20% of the Amazon forest has been estimated at US$ 20 billion a year41. Comparisons with other studies Although no study was found that made projections for the area of equilibrium of the Brazilian Amazon, there are many projections for the area converted in a limited time horizon. A recent study projected that 40% of the forest existing today will have been converted by 2050[46]. Another projection suggests that the large scale infrastructure expansion now underway in the Amazon will result in a forest loss of 28-42% as early as 2020[47]. The persistence and possible acceleration of the

conversion process in the Amazon is also consistent with projected land demand for agriculture expansion, as discussed earlier48. Comparison can also be made with the historical behavior of the conversion process across the globe. According to the Millennium Ecosystem Assessment1, two ecosystem types located in regions where the conversion process first begun (Mediterranean forests, woodlands and scrubs and temperate forest steppe and woodland) have already lost c. 70% of their extent. Of the other 8 productive ecosystem types subject to conversion, 5 will reach similar levels by 2050 (temperate broadleaf and mixed forests; tropical and subtropical dry broadleaf forests; flooded grasslands and savannas; tropical and subtropical grasslands, savannas and shrublands; tropical and subtropical coniferous forests). Other study104 estimate that the extent of the frontier forests existent today corresponds to 21,7% of their original extent. The remaining stock of forests in all 72 countries (except Russia) for which the necessary data was available the three regions where conversion has been active for a longer period is also a good base for comparisons. Current regional forest cover corresponds to 33% (Europeh), 8,4% (North Africa) and 21,5% (Continental Asia) of the original cover. In total, the original forest cover amounted to 1.74 billion hectares. It has been reduced to 422 million hectares, or slightly less than a quarter. As for the monetary values necessary for compensation, the literature also offers opportunity for comparisons. As discussed in the Research Highlights section, studies on this theme usually suggests that the compensation value should cover the opportunity and management costs of conservation. Few deduct from these the national benefits provided by the environment. And as shown in this study, this net conservation cost is still different (probably higher) than the necessary compensation. A precursor work by Cartwright49 based on the returns from timber exploitation suggests that tropical countries would be unlikely to accept less then US$ 20 (or US$ 32 when indexed to 2002) as a compensation for not converting their forests. The net conservation costs incurred by Kenya from its reserves were estimated21 at US$ 57 ha-1 y-1. In a global simulation, the economic loss of setting aside reserves (opportunity costs) was estimated108 at US$ 40.5 ha-1 y-1 for the “Rest of the World” (which included Latin America). An estimation based on empirical data for a global network of protected areas43 suggested that the opportunity (based on land purchase price) and management costs of new areas in Latin America would be US$ 9.4 ha-1 y-1. Kremen et al. (2000)19 estimated the net conservation costs for a National Park in Madagascar at US$ 57 ha-1 y-1 (from the full capture scenario, 10% discount rate, 30 years timespan). The World Bank estimated109 the opportunity and management costs of setting aside new areas as protected forest in developing countries at US$ 93 ha-1y-1. A Payment for Ecosystem Services in Costa Rica, financed by the World Bank, pays US$ 45 ha-1 y-1 to landowners who conserve forests110. Finally the three works that based the estimation of the opportunity costs in this study offered values of US$ 38,4[17] , US$ 48,5[18] and US$ 57[42]. Given the remarkably different methodologies and the spatial and temporal differences between the ten estimates, the results are relatively close. Apart from the highest and the lowest values, the other 8 studies are located in the US$ 32 – US$ 57 interval, with a mean of US$ 46.9. Including the lowest and the highest values have a very small effect on the mean (now at US$ 47.8). These mean values are close to the opportunity costs (US$50,4) and are higher than the current net marginal conservation costs (US$ 32.5) and the average compensation value (US$ 14.1) estimated here. The
h If Sweden, Norway and Finland are excluded, Europe’s current extent drops to 21% of the original cover.
fact that the last two values are inside the interval and below the mean indicates that the quantitative values estimated are not overly distorted and may be considered conservative estimates. Consistency and Limitations Due to the many theoretical and practical obstacles found, it was necessary to adopt some simplifications. Some of the consequent limitations are: 1)The Brazilian Amazon is not a single, homogeneous forest block. There are considerable regional differences in several ecological characteristics (i.e. soil composition, species diversity, climatic regimes) that impact the benefits provided by the forest. In addition to being impacted by these ecological differences, the benefits provided by alternative uses are also highly influenced by regional differences in socio-economic characteristics (i.e. transport infrastructure, distance to markets). 2) In order to analyse the benefits provided by the ecosystems to mankind, those have been classified into different “services” and analysed individually. Although this is the common practice in the literature, its is important to keep in mind that ecological systems are complex net of interactions111 and that alterations in one service impacts the provision of others. For instance, species extinction is likely to impact the climate regulation service38, while interactions between the latter and the hydrological cycle have recently been better understood39,40. These feedbacks often present time lags, adding more complexity to the analysis. Further research that introduces these interrelations into the analysis can help to reduce distortion in the results. 3) Although a large portion of the key values were obtained from studies focused in the Brazilian Amazon, estimates from other tropical countries were also used. Despite being a common practice in the literature, the issue of transferring environmental benefits estimates across different countries is a very complex one. Different environmental, economic and socio-cultural characteristics imply different values for each country. Although some tools were used to reduce the distortions, this is still a source of error. 4) Apart from timber, where all the data necessary for the estimations was available, the simplifying assumptions adopted in the estimations of the values related to the other direct use benefits of the forest probably distorted the individual results. These distortions, however, would only begin to influence the cost-benefit analysis if the largest of the minimum areas found were more than doubled. Given the conservative assumptions adopted, it is unlikely that these minimum areas have been so strongly underestimated. 5) The estimation of some of the indirect use values is probably the major limitation in this study. Apart from the climate regulation service, whose marginal benefits were estimated directly, the indirect marginal benefits were obtained through the conversion of published average values using the rectangular hyperbolic function. Although based on a published work and presenting the dynamic behavior expected by several different authors, the choice of this functions it is still an arbitrary one. There are other functions that would also match the expected behavior and produce different quantitative results. It would even be possible to select a function that would result in the national benefits from the forest being higher than the benefits of alternative uses. This choice, however, in addition to being as arbitrary as the one made here, would lead to conclusions that contradict the ones obtained from the review of case studies carried earlier. It is this consensus found in the analysis of the literature that gives a qualitative support to the conclusions found here. 6) The marginal option value estimated should be considered a conservative lower-limit bound, as the potential for pharmacological application is only a portion of the new benefits that can arise from the conserved forest. 7) The value chosen to reflect the benefits from the conversion to alternative uses was based in two recent and methodologically strong analysis focused on the Brazilian Amazon. Its dynamic behavior, however, was not the focus of this study and the supposition adopted here that it would remain constant throughout the conversion process is a very simplistic one. According to projected

market estimates, however, it is likely that this is a conservative estimate and a more realistic approach would reinforce the qualitative conclusions found. 8) Finally, in addition to these, this work also carries all the limitations expressed by the authors of the studies whose estimates were used. Overall, all the simplifications certainly have a quantitative impact on the results that, therefore, should be used with caution. The impact could certainly be reduced with additional research. Although this quantitative distortion certainly exists, the subsequent critical discussion and comparison with similar values in the literature indicate that it may not be overly large. And, more importantly, the analysis of comparative case studies made previously shows that it is unlikely that these distortions have had a qualitative influence on the main conclusions of this study. Research insights Even with reservations about some quantitative estimates, the dynamic marginal approach adopted provided important research insights, that can explored in future: 1)Recognizing the different characteristics of each category of the TEV and using different approaches for each one allowed to overcome some of the pitfalls encountered in the analysis. 2)There are some misinterpretations in the literature about the nature of the values estimated. Estimating values for one unit (usually a hectare) of a natural area does not mean it is marginal value. A unit value can be an average (usually obtained by dividing a value found for the whole ecosystem by its area), a maximum (usually obtained by estimating the potential value that could be produced in a unit) or a marginal value, which is how much one more unit contributes to the total value. The last one is usually more useful for policy purposes. 3) The focus on a very extensive area brought up an interesting scale issue in relation to the marginal direct use values. The vast majority of works in the literature estimate values for much smaller areas, such as specific reserves and parks. It is generally assumed that there will be a market for all the goods potentially produced in the whole area, yielding a positive marginal value. That may be true for small areas. When we start “zooming out” the picture, however, this assumption ceases to be valid after a certain point and the marginal value drops to zero. 4) Due to the valuation process used, estimations for indirect, option and non-use values generally yield values of average nature. If the general behaviour of marginal values is the one depicted in Figure 1 – as the literature suggests – then these average values can be considerably different than current marginal values. 5)Applying an empirical ecological function into the economic valuation process allowed the estimation of a sound dynamic behaviour for option, bequest and existence values. In the case of the latter two, the approach was supported and confirmed by empirical economic estimates. This highlights the still largely untapped potential of cooperation between these two sciences. 6)Works in the literature addressing a cooperation such as the one proposed here usually argue that the payment by the international community should be equal to the opportunity and management costs incurred by the host nation. In fact the national benefits of the conserved area should be deducted from those costs (to find the incremental costs). The dynamic analysis also shows that simply deducting current marginal national benefits from current marginal costs and multiplying them by the area in order to find total compensation may not be strictly correct. Supposing that the national benefits would rise faster than the costs (the only way to have Qnat>0), this procedure would overestimate the necessary compensation. As an illustration, current marginal costs of

conservation were estimated here at US$ 50.4 ha-1 yr-1, current net marginal costs at US$ 31.8 ha-1 yr-1 and the average compensation costs at US$ 13.4 ha-1 yr-1. The role of the international externality The initial analysis of comparative case studies hinted on the decisive role that international externalities have in the persistence of the conversion process in lower-income countries. This classic market failure arises in this case from the interaction of the different spatial dimensions of ecosystem services with the division of the planet in sovereign sub-units. The consequence is that a country does not receive all the benefits arising from its ecosystems and, when bearing all the costs of their conservation, is attracted to a national point of equilibrium which is lower than the global optimum. The role of the externality becomes clear in the graphic theoretical analysis (Fig. 1), which is also in perfect harmony with past and current trends of the conversion process in both high and low income countries. The impact of this market failure became frightening clear when the marginal dynamic approach estimated that 63.4% of the current area of the Brazilian Amazon will be deforested until it reaches the national equilibrium point. This proportion is consistent with the past behaviour of the conversion process throughout the planet. Tropical deforestation is unlikely to stop if the substantial economic incentives contrary to conservation – here estimated at annual US$ 4.5 billion for the Brazilian Amazon and US$ 17.4 billion for all tropical forests – are not counterbalanced. It is important to understand that these incentives do influence private and governmental decisions even if they are not explicitly accounted for or even directly perceived. Their diffuse force acts through the political process, resulting in governmental decisions to “develop” natural environments. Even when governments resist these pressures, maybe against the interests21,31 of their own people, the invisible hand pushes national and foreign private groups to illegal acts, whose repression demands additional sacrifice of public resources. In addition to being unrealistic, it is hardly fair to demand that the population of tropical countries sacrifice part of their scarce well-being by forfeiting their “national optimum path”, in order to provide the global optimum amount of ecosystem services to an international community, of which many members already enjoy high levels of affluence. It is fairer to expect that this community transfer back a small part of the global benefits these ecosystems provide in order to compensate their host countries by the net loss incurred in conserving them at global optimum levels. The international trade in food and timber products provides incentives for the conversion of tropical forests into alternative land-uses. On the other hand global ecosystem services provided by tropical forests, such as climate regulation and biodiversity-related services, do not have a formal market and therefore no incentive is given for their provision. This analysis shows that a small fraction of the benefits these services provide to the international community is necessary and sufficient to tilt the balance towards the conservation of tropical forests.

References
1- Millennium Ecosystem Assessment Ecosystems and Human Well-being: Synthesis
(Island Press, Washington DC, 2005).
2- Vitousek, P. M., Mooney, H. A., Lubchenco, J. & Melillo, J. M. Human Domination of Earth's Ecosystems. Science 277, 494-499 (1997).
3- Haberl, H. The global socioeconomic energetic metabolism as a sustainability problem. Energy 31, 87-99 (2006).
4- Food and Agriculture Organization Global Forest Resource Assessment 2000 (FAO, Rome, 2001).
5- Field, C. B., Behrenfeld, M. J., Randerson, J. T., Falkowski, P. Primary Production of the Biosphere: Integrating Terrestrial and Oceanic Components. Science 281, 237-240 (1998).
6- Wilson. E. O.(ed) Biodiversity (National Academy Press, Washington DC, 1988).
7- Achard, F. et al. Determination of Deforestation Rates of the World’s Humid Tropical Forests. Science 297, 999-1002 (2002).
8- Baumert, K. A., Herzog, T. & Pershing, J. Navigating the Numbers: Greenhouse Gas Data and International Climate Policy (World Resources Institute, Washington DC, 2005).
9- Houghton, R . A . Aboveground Forest Biomass and the Global Carbon Balance. Glob. Change Bio. 11, 945–958 (2005).
10- Sala, O. E. et al. Global Biodiversity Scenarios for the Year 2100. Science 287, 1770-1774 (2000).
11- Brook, B. W., Sodhi, N. S. & Ng, P. K. L. Catastrophic extinctions follow deforestation in Singapore. Nature 424, 420-423 (2003).
12- Daily, G. (ed.) Nature’s Services: Societal Dependence on Natural Ecosystems (Island, Washigton DC, 1997).
13- Pearce, D. New directions for financing global environmental change. Global Environmental Change 5, 27- 40 (1995).
14- Pinedo-Vasques, M., Zarin, D. & Jipp, P. Economic returns from forest conversion in the Peruvian Amazon. Ecol. Econ. 6, 76–78 (1992).
15- Yaron, G. Forest Plantation crops or small-scale agriculture? An economic analysis of alternative land use options in the Mount Cameroon Area. Journal of
Environmental Planning and Management 44, 85-108 (2001).
16- Kumari, K., Sustainable Forest Management in Peninsular Malaysia: Towards a total economic valuation approach (Thesis, University of East Anglia, Norwich, UK, 1994).
17 - Seroa Da Motta, R. Custos e Beneficios do desmatamento na Amazônia. Ciencia e Ambiente 32, 73-84 (2005).
18 - Andersen, L. A., Granger, O., Reis, E. J., Weinhold, D., Wunder, S. The Dynamics of Deforestation and Economic Growth in the Brazilian Amazon (Cambridge University Press, Cambridge, 2002).
19 - Kremen, C. et al. Economic incentives for rain forest conservation across scales. Science 288, 1828-1832 (2000).
20 - Batagoda, S. Turner, R.K. Tinch, R. & Brown, K. Towards policy relevant ecosystem services and natural capital values: rainforest non-timber products. CSERGE Working Paper GEC 2000-06 (2000).
21 - Norton-Griffiths, M. & Southey, C. The opportunity costs of biodiversity conservation in Kenya. Ecol. Econ. 12, 125-139 (1995).
22 - Sathirathai, S., Economic valuation of mangroves and the roles of local communities in the conservation of the resources: case study of Surat Thani, South of Thailand. Final report submitted to the Economy and Environment Program for Southest Asia (EEPSEA), Singapore, 1998.
23 - Garrod, G.D. & Willis, K.G. Valuing goods’ characteristics: An application of the hedonic price method to environmental attributes. Journal of Environmental Management 34, 59–61 (1992).
24 - Carson, R.T., Wilks, L. & Imber, D. Valuing the Preservation of Australia's Kakadu C4nservation Zone. Oxford Economic Papers 46, 727-749 (1994).
25 - Van Vuuren W. & Roy, P. Private and Social Returns from Wetland Preservation Versus Those From Wetland Conversion to Agriculture. Ecol. Econ. 8, 289-305 (1993).
26 - Turner, R.K. et al. Valuing nature: lessons learned and future research directions. Ecol. Econ. 46, 493-510 (2003).
27 – Balmford, A. et al. Economic Reasons for Conserving Wild Nature. Science 297, 950-953 (2002).
28 – Costanza, R. et al. The value of the world’s ecosystem services and natural capital. Nature 387, 253-260 (1997).
29 – Torras, M. The total economic value of Amazonia deforestation, 1978-1993. Ecol. Econ. 33, 283-297 (2000).
30 - Farber, S.C., Costanza, R. & Wilson, M.A. Economic and ecological concepts for valuing ecosystem services. Ecol. Econ. 41, 375-392 (2002).
31 - Pearce, D.W. Do we really care about biodiversity ?. Environmental and Resource Economics, forthcoming (2007).
32 – Holling, C.S. Resilience and stability of ecological systems. Annual Review of Ecology and Systematics 4, 1-23 (1973).
33 - Perrings,C. & Pearce, D.W. Threshold Effects and Incentives for the Conservation of Biodiversity. Environmental and Resource Economics 4, 13-28 (1994).
34 - Perrings,C. Biodiversity conservation as insurance, in Swanson, T. M. (Ed.) The Economics and Ecology of Biodiversity Decline (Cambridge University Press, Cambridge,1995).
35– Fearnside, P. M. Deforestation in Brazilian Amazonia: History, Rates and Consequences. Conservation Biology 19, 680–688 (2005).
36– Asner, G.P. et al. Selective Logging in the Brazilian Amazon. Science 310, 480-482 (2005).
37 – Morton, D.C. et al, Cropland expansion changes deforestation dynamics in the southern Brazilian Amazon. Proc. Natl. Acad. Sci. U.S.A. 103, 14637–14641 (2006).
38 –Bunker, D. E. et al. Species Loss and Aboveground Carbon Storage in a Tropical Forest. Science 310, 1029-1031 (2005).
39 - Richey, J. E., Melack, J. M., Aufdenkampe, A. K., Ballester, M. V. & Hess, L. L.
Outgassing from Amazonian rivers and wetlands as a large tropical source of
atmospheric CO2. Nature 416, 617–620 (2002).
40 –Mayorga, E. et al. Young organic matter as a source of carbon dioxide outgassing from Amazonian rivers. Nature 436, 538-541 (2005).
41 - Horton, B. Collarullo, G. Bateman, I.J. & Peres, C. Evaluating non-user willingness to pay for a large scale conservation program in Amazonia: A UK/Italian contingent valuation study. Environmental Conservation 30, 139-146 (2003).
42- Stern, N. Stern Review on the Economics of Climate Change (Cambridge University Press, Cambridge, 2006).
43 –James, A. N., Gaston, K. J. & Balmford, A. Balancing the Earth’s accounts. Nature 401, 323-324 (1999).
44 - Myers, N. Lifting the veil on perverse subsidies. Nature 392, 327–328 (1998).
45 – SIPRI, Military Expenditure Database. Available electronically at www.sipri.org (2005).
46 - Soares-Filho, B. S. et al. Modelling conservation in the Amazon basin. Nature 440, 520-523 (2006).
47 – Laurance, W. F. et al. The Future of the Brazilian Amazon. Science 291, 438-439 (2001).
48 – Food and Agriculture Organization World agriculture: towards 2030/2050 (FAO, Rome, 2006).
49 – Cartwright, J. The politics of preserving natural areas in Third World States. The Environmentalist 5, 179-186 (1985).
50 – United Nations Framework Convention on Climate Change Reducing Emissions from Deforestation in Developing Countries. Available eletronically at http://unfccc.int/methods_and_science/lulucf/items/1084.php (2006).
51 – De Groot, R. S., Wilson, M. A., Boumans, R. M. J. A typology for the classification, description and valuation of ecosystem functions, goods and services. Ecological Economics 41, 393-408 (2002).
52 - Almeida, O. T. & Uhl, C. Identificando os custos de usos alternativos do solo para o planejamento municipal da Amazônia: o caso de Paragominas (PA), in May, P. (ed.) Economia Ecológica (Campus, Rio de Janeiro, 1995).
53 – Nepstad, D. C. et al. Large-Scale Impoverishment of Amazonian Forests by Logging and Fire. Nature 398, 505-508 (1999).
54 - Lentini, M., Pereira, D., Celentano, D., Pereira, R. Fatos Florestais da Amazônia 2005 (Imazon, Belém, 2005).

55 – IBGE, Produção da Extração Vegetal e da Sivicultura 2005 (IBGE, Rio de Janeiro, 2006).
56 - World Bank, Global commodity Market (The World Bank, Washington D.C., 2000).
57 – Peters, C.M., Gentry A.H. & Mendelsohn, R.O. Valuation of an Amazonian Rain Forest. Nature 339, 655-656 (1989).
58 - Anderson, A.B., May, P.H. & Balick, M. The Subsidy from Nature: Palm Forests, Peasantry, and Development on an Amazon Frontier (Columbia University Press, New York, 1991).
59 - Chopra, K. The value of non-timber forest products: an estimation for tropical deciduous forests in India. Economic Botany 47, 251-57 (1993).
60 - Godoy, R., Lubowski, R. & Markandya, A. A method for the economic valuation of non-timber tropical forest products. Economic Botany 47, 220-233 (1993).
61 - Grimes, A. et al. Valuing the Rain Forest: the economic value of nontimber forest products in Ecuador. Ambio 23, 405-410 (1994).
62- Shone, B. M. & Caviglia-Harris, J. L. Quantifying and comparing the value of non-timber forest products in the Amazon. Ecol. Econ. 58, 249– 267(2006).
63 - Tobias, D. & Mendelsohn, R. Valuing ecotourism in a tropical rain-forest reserve. Ambio 20, 91-93 (1991).
64 - Edwards, S. F. The demand for Galapagos vacations: estimation and application to wilderness preservation. Coastal Management 19, 155-199 (1991).
65 - Ruitenbeek, H.J. The rainforest supply price: a tool for evaluating rainforest conservation expenditures. Ecol. Econ. 6, 57–78 (1992).
66 - Houghton R.A., Lawrence K.T., Hackler J.L. & Brown, S. The spatial distribution of forest biomass in the Brazilian Amazon: a comparison of estimates. Global Change Biology 7, 731–746 (2001).
67 – Fearnside, P.M. Greenhouse gases from deforestation in Brazilian Amazonia: net committed emissions. Climatic Change 35, 321-360 (1997).
68 – Nepstad, D.C. et al. ‘The Role of Deep Roots in the Hydrological and Carbon Cycles of Amazonian Forests and Pastures. Nature 372, 666–669 (1994).
69 – Asner, G. P., Keller, M. & Silva J. N. M. Spatial and temporal dynamics of forest canopy gaps following selective logging in the eastern Amazon. Global Change Biology 10, 765-783 (2004).
70 - Achard F, Eva HD, Mayaux P., Stibig, H. & Belward, A. Improved estimates of net carbon emissions from land cover change in the tropics for the 1990s. Global Biogeochemical Cycles 18, GB2008 (2004).
71 - Houghton, R.A. et al. Annual Fluxes of carbon from deforestation and regrowth in the Brazilian Amazon. Nature 403, 301-304 (2000).
72- Fearnside, P. M. & Laurance, W. F. Tropical deforestation and greenhouse-gas emissions. Ecological Applications 14, 982–986 (2004).
73 - Fearnside, P. M. Global warming and tropical land-use change: greenhouse gas emissions from biomass burning, decomposition and soils in forest conversion, shifting
cultivation and secondary vegetation. Climatic Change 46, 115–158 (2000).
74 – Schiermeier, Q. Market Watch. Nature 444, 533 - 533 (2006).
75 - Clarkson, R. & Deyes, K. Estimating the Social Cost of Carbon Emissions. Government Economic Service Working Paper (HM Treasury, London, 2002).
76 –Raich, J. W. Russell, A. E., Kitayama, K., Parton, W. J Vitousek, P. M. Temperature influences carbon accumulation in moist tropical forests. Ecology 87, 76-87 (2006).
77 - Brown, S. and Lugo, A. E. Aboveground Biomass Estimates for Tropical Moist Forests of the Brazilian Amazon. Interciencia 17, 8–18 (1992).
78 - Potter, C. S., Terrestrial Biomass and the Effects of Deforestation on the Global Carbon Cycle BioScience 49, 769-778 (1999).
79 - Pearce, D. An economic approach to saving the tropical forests in Helm, D. (ed.) Economic policy toward the environment (Blackwell, Oxford, 1991).
80 - Brown, K. & Pearce, D. W. The economic value of non-marketed benefits of tropical forests: carbon storage in: Weiss, J. (ed) The economics of project appraisal and the environment (Edward Elgar, London, 1994).
81 – Pearce, D. et al. The social costs of climate change: Greenhouse damage and the benefits of control in IPCC Climate Change 1995: Economic and Social Dimensions of Climate Change (Cambridge University Press, Cambridge, 1996).
82 - Fearnside, P. Environmental services as a strategy for sustainable development in rural Amazonia. Ecol. Econ. 20, 53–70 (1997).
83 - Pearce, D.W. The social cost of carbon and its policy implications. Oxford Rev. Econ. Policy 19, 362–384 (2003).
84- Pearce, D., and Moran, D. The economic value of biodiversity (Earthscan Publication, London, 1994).
85 - Krutilla, J. V.. Environmental resource services of Malaysian moist tropical forest (Johns Hopkins University Press, for Resources for the Future, Inc, Baltimore, 1991).
86 - Pimentel, D. et al. Economic and environmental benefits of biodiversity. Bio-
Science 47, 747–757 (1997).
87 - Cruz, W., Francisco, H.A. & Conway, Z.T The on-site and downstream costs of soil erosion in the Magat and Pantabangan watersheds. Journal of Philippine Development 26, 85-11 (1988).
88 - Magrath, W. & Arens, P. The costs of soil erosion on Java: a natural resource accounting approach. Environment Department Working Paper No. 18 (The World Bank, Washington DC, 1989).
89 - Dixon, J. A. & Hodgson, G. Economic evaluation of Coastal Resources: the El Niño study. Tropical Coastal Area Management (August), 5 -7 (1988).
90 – Chomitz, K.M. & Kumari, K. The Domestic Benefits of Tropical Forests: A Critical Review Emphasizing Hydrological Functions. World Bank Policy Research Working Paper No. 1601 (The World Bank , PRDEI, Washington, DC, 1996).
91 – Food and Agriculture Organization Irrigation water use per country in the year 2000. Available electronically at http://www.fao.org/landandwater/aglw/aquastat/dbase/index.stm (2006).
92 - Food and Agriculture Organization State of the World’s Forests 2003 (FAO, Rome, 2003).
93 - Whitehead, P.G. & Robinson, M. Experimental basin studies - an international and historical perspective of forest impacts. Journal of Hydrology 145, 217-230 (1993).
94 – Simpson, R. D., Sedjo, R. A. & Reid, J. W. Valuing Biodiversity for Use in
Pharmaceutical Research. Journal of Political Economy 104, 163-85 (1996).
95 – Rausser, G. C. & Small, A. A. Valuing Research Leads: Biodiversity
Prospecting and the Conservation of Genetic Resources. Journal of Political Economy 108, 173-206 (2000).
96 – Connor, E. F., & Mccoy, E. D. Statistics and biology of the species-area relationship. Am. Nat. 113,791-833 (1979).
97 - Reid, W. R. How many species will there be in Whitmore, T. C. & Sayer, J. A. (ed.) Tropical deforestation and species extinction (Chapman and Hall, New York, 1992).
98 - Pearce, D. W. & Whittington G. Economic values and the environment in developing world. United Nations Enviroment Programme by CSERGE and University of North Carolina at Chapel Hill (1994).
99 - Adger, W.N., Brown, K., Cervigni, R. & Moran, D. Total economic value of forests in Mexico. Ambio 24, 286-296 (1995).
100 – Mendelsohn, R. Notes on economic plants. Econ. Botany 51, 328 (1997).
101- Grieg-Gran, M. The Cost of Avoiding Deforestation. Report prepared for the Stern Review of the Economics of Climate Change. Available electronically at http://www.hm-treasury.gov.uk/media/8A7/17/stern_review_supporting_technical_m_greiggran_261006a.pdf (2006).
102 – Kirby, K.R. et al. The future of deforestation in the Brazilian Amazon. Futures 38, 432-453 (2006).
103 - Brown, J. C. Koeppe, M. Coles, B. & Price, K. P. Soybean Production and Conversion of Tropical Forest in the Brazilian Amazon: The Case of Vilhena, Rondonia. Ambio 34, 462-269 (2005).
104 - FAPRI U.S. and World Agricultural Outlook 2006. Food and Agricultural Policy Research Institute, Iowa State University. Available electronically at http://www.fapri.iastate.edu/outlook2006/ (2006).
105 - Bryant, D., Nielsen, D. & Tangley, L. The Last Frontier Forests: Ecosystems and Economies on the Edge (World Resources Institute, Washington DC, 1997).

106 - Food and Agriculture Organization FAOSTAT Online Statistical Service. Rome: FAO. Available online at: http://faostat.fao.org (2006).
107 - Billington,C. Kapos, V. Edwards, M. Blyth, S. & Iremonger, S. Estimated Original Forest Cover Map - A First Attempt (WCMC, Cambridge, 1996).
108 - Lewandrowski, J, Darwin, R. F., Tsisgas, M. Raneses, A. Estimating costs of protecting global ecosystem diversity. Ecological Economics 29, 111-125 (1999).
109 – World Bank Costing the 7th Millennium Goal: Ensure Environmental Sustainability. Environment Department and Development Economics Research Group, The World Bank, Washigton DC (2000) [Restricted].
110 - Pagiola, S. et al. Paying for biodiversity conservation services in agricultural landscapes (Environment Department Paper n° 96, The World Bank, Washigton DC, 2004).
111 – Levin, S. A. Ecosystems and the Biosphere as Complex Adaptive Systems. Ecosystems 1, 431-436 (1998).

Appendix A
IN regards to indirect use values, the studies found in the literature concerning 5 of the 6 services (the exception being climate regulation) usually estimate average values. To carry out the analysis proposed for this paper, however, it is necessary to use marginal values. It was thus necessary to convert the average values into marginal ones. Unknown dynamic behaviour Valuation exercises seek to assign monetary values to environmental services provided by natural ecosystems. It is foreseen that an alteration in the existing quantity of environmental resources will cause an alteration in the value. Due to the various ecological and economic assumptions, it is supposed that the value of resources increases as they become scarcer, as shown in Figure 1. These valuation exercises can be interpreted as “pictures” of the value of these resources as a function of their existing quantity at the moment the exercises were carried out. As the conversion of ecosystems progresses, and they become scarcer, it can be foreseen that future valuation exercises will find new values. Over time, sequential analysis of these studies would allow tracing of an overview of the real behaviour of the natural resource values as a function of their existing quantity. The problem resides in the fact that although the conversion process began thousands of years ago, valuation exercises are all more recent, most of them having taken place in the last two decades. And although the speed of conversion is very high, relative changes in the quantity of natural resources still do not allow a dynamic function for the values to be estimated from the few studies available.i Torras’ (2000) hypothesis Torras (2000)29 attempts to estimate the losses incurred by human beings due to the process of conversion in Brazilian Amazon region in the years from 1978 to 1993. The author estimates the value of one hectare of Amazonian forest for the year 1993 based on a review of the literature and some calculations of his own. Recognizing that the value of environmental resources is also a function of their quantity, the author states that it is necessary to make a ‘scarcity adjustment’, in order to convert the value found for the year 1993 to each of the previous years, in relation to the quantity of existing forest in each year. Assuming that the Amazonian ecosystem is subject to non-linearities resulting from the existence of ecological thresholds, the author affirms that “deforestation potentially results in rapid increases in the marginal unit values of conservation”. The author himself emphasizes that it is not possible to estimate the point at which these discontinuities occur, nor the magnitude of the “leap”. He affirms that it is therefore necessary to assume a function that better reflects this behaviour. The function he chooses is the rectangular hyperbolic function, that has the expected general behaviour (initially elastic and becoming rapidly inelastic as the forest area diminishes).
i The services valued and the valuation techniques used are also very different, making systematic comparisons among these studies more difficult.

The problem with Torras (2000)29 approach, however, is that despite the affirmation in his last passage cited above, he used the rectangular hyperbolic function to reflect the behaviour of average values. One characteristic of the rectangular hyperbolic function is that the product of the input (x) by the output (y) remains always constant. Thus applying the rectangular hyperbolic function to average values causes the unrealistic consequence that the total value of the annual benefits provided by the Amazon forest remains the same independently of the area of the forestj. In this hypothesis, the reduction in the area of forest due to annual deforestation is exactly offset by an increase in the value of the remaining hectares. Consequently, the marginal benefit would be equal to zerok. In other words, with this approach, 100% or 1% of forest would generate the same benefit to mankind. Thus, although the function chosen is in accordance with economic and ecological assumptions for the behaviour of the values of the ecosystems as a function to their areas, applying it to average benefits leads to incoherent results. An alternative hypothesis If this same function were applied to marginal benefits however, the conclusion would be different. The same ecological assumptions – related to discontinuities and thresholds – and economic assumptions – related to the principle of scarcity – that led Torras (2000)29 to select this function would still be met. In this new hypothesis, the important law of diminishing marginal utility would now be met. The unrealistic consequence mentioned above would disappear. Although a reduction in the area of the forest still causes a rise in the unit value of the total remaining hectares, – respecting the scarcity principle–, now this rise only partially offsets the diminished area, and the total value of benefits falls with the diminishing of the forest area. Thus: Marginal Value = Constant / Forest Area or MgV = a / X Eq. A.1 Integrating the function of marginal benefits we obtain the function of total benefits: TV = a . ln (x) Eq. A.2 And dividing the total benefits by the area of the forest, we have the average benefits: AvV = a . ln (x) / x Eq. A.3 It is interesting to observe that the new function for the average benefits has a graphical behaviour similar to the function selected by Torras (2000)29, while the introduction of the term ln (x) in the numerator causes a reduction in the variable x to not be entirely offset by an increase in AvV. The new function thus causes the term lx (x) to be also present in the expression of TV, making it dependent on the variable x. Transformation of average values into marginal values Almost all the studies reviewed estimate average values for the benefits of natural environments. To carry out the analysis proposed it would be necessary to turn them into marginal values.
j As the author himself notes, “the unit Total Economic Value varies depending on the amount of Forest, with the unit TEV product for the area remaining constant”. k With Y representing the average benefit, X representing the area of forest, Z representing total benefit, W representing marginal benefit and a representing a constant, we have: Y = a / X. Multiplied by the Forest area, X, we have Z = a. Derivating in relation to X, we have W = δZ/ δX = 0.
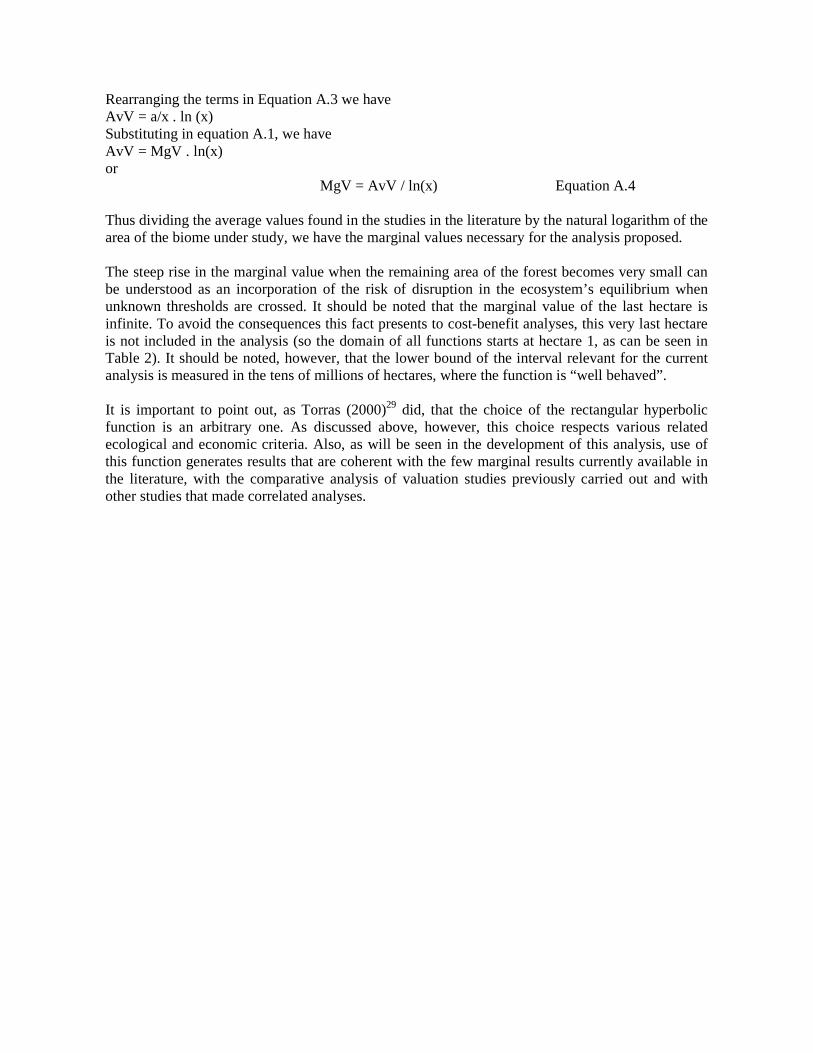
Rearranging the terms in Equation A.3 we have AvV = a/x . ln (x) Substituting in equation A.1, we have AvV = MgV . ln(x) or
MgV = AvV / ln(x) Equation A.4 Thus dividing the average values found in the studies in the literature by the natural logarithm of the area of the biome under study, we have the marginal values necessary for the analysis proposed. The steep rise in the marginal value when the remaining area of the forest becomes very small can be understood as an incorporation of the risk of disruption in the ecosystem’s equilibrium when unknown thresholds are crossed. It should be noted that the marginal value of the last hectare is infinite. To avoid the consequences this fact presents to cost-benefit analyses, this very last hectare is not included in the analysis (so the domain of all functions starts at hectare 1, as can be seen in Table 2). It should be noted, however, that the lower bound of the interval relevant for the current analysis is measured in the tens of millions of hectares, where the function is “well behaved”. It is important to point out, as Torras (2000)29 did, that the choice of the rectangular hyperbolic function is an arbitrary one. As discussed above, however, this choice respects various related ecological and economic criteria. Also, as will be seen in the development of this analysis, use of this function generates results that are coherent with the few marginal results currently available in the literature, with the comparative analysis of valuation studies previously carried out and with other studies that made correlated analyses.

![Concerto No.3 in G for Violin (Strassburg), K · Concertos for String Instruments : Concerto No.3 in G for Violin (Strassburg) [K.216] Author: Mozart, Wolfgang Amadeus - Editeur:](https://img.dokumen.tips/doc/110x75/606dda127a6d6c5c4e5ea709/concerto-no3-in-g-for-violin-strassburg-k-concertos-for-string-instruments-.jpg)


![Concerto No.3 in G for Violin (Strassburg), K€¦ · Title: Concertos for String Instruments : Concerto No.3 in G for Violin (Strassburg) [K.216] Author: Mozart, Wolfgang Amadeus](https://img.dokumen.tips/doc/110x75/5ad79cee7f8b9a9d5c8c4f15/concerto-no3-in-g-for-violin-strassburg-k-title-concertos-for-string-instruments.jpg)