Embed Size (px)
Citation preview

1
From Ultraviolet to Prussian blue: A spectral response for the cyanotype process and a safe
educational activity to explain UV exposure for all ages.
Turner, J1, Parisi, AV
1, Downs, N
1 and Lynch, M
1
1University of Southern Queensland, Toowoomba. Australia.
Abstract
Engaging students and the public in understanding UV radiation and its effects is achievable using the
real time experiment that incorporates blueprint paper, an “educational toy” that is a safe and easy
demonstration of the cyanotype chemical process. The cyanotype process works through the presence
of UV radiation. The blueprint paper was investigated to be used as not only engagement in
discussion for public outreach about UV radiation, but also as a practical way to introduce the
exploration of measurement of UV radiation exposure and as a consequence, digital image analysis.
Tests of print methods and experiments, dose response, spectral response and dark response were
investigated. Two methods of image analysis for dose response calculation are provided using easy to
access software and two methods of pixel count analysis were used to determine spectral response
characteristics. Variation in manufacture of the blueprint paper product indicates some variance
between measurements. Most importantly, as a result of this investigation, a preliminary spectral
response range for the radiation required to produce the cyanotype reaction is presented here, which
has until now been unknown.
Keywords: ultraviolet radiation, Prussian blue, cyanotype, educational activity, UV, spectral response.

2
1.0 Introduction
Improving public understanding of ultraviolet (UV) radiation and how it impacts human health (both
beneficial and hazardous implications) is an ongoing challenge that constantly needs reinforcement
from research institutions to the public [1]. This is a topical problem especially for countries like
Australia which experiences the highest incidence rates of skin cancer in the world [2]. Due to the
time lag between UV exposure and skin cancer development, it is difficult to provide definitive
evidence to the public of the connection. However many studies are working to close that gap [3, 4]
especially with the impact of the diminished ozone layer [5, 6] and its predicted slow recovery [7]. In
general, it is accepted that UV radiation causes skin cancer as endorsed by the World Health
Organisation [8]. Despite the established knowledge base connecting UV radiation and skin cancer
[3-5, 9], there is still public misunderstanding which can be damaging to the beneficial effects of
public health campaigns [10, 11].
One of the key factors that assist in promoting sun protection campaigns in skin cancer prevention is
the education of children and the public. A review of studies by Stanton et al [12] indicates children
were reported to depend on parents’ sun protective behaviour. Primary schools are also shown to be
effective in moderating sun exposure behaviour [13]. Therefore education of both children and adult
populations are equally important in sun protection education. One of the most difficult issues in
demonstrating the effects of UV radiation is being able to show a physical effect in real time
specifically due to UV radiation before the onset of erythema. UV radiation is not sensed like thermal
radiation (although there is evidence to indicate that the two are regularly confused by the public
[10]), and thermal comfort does indirectly affect behaviour in an UV environment [14, 15]. The
biological effects due to UV radiation are delayed in relation to original exposure periods, which may
contribute to lack of public understanding. Skin cancer results from a number of factors over years of
exposure [3-5, 9]. Even short term human biological responses, such as erythema (sunburn) [16] and
photokeratitis (also known as snowblindness) [17] occur after a period of hours, due to excessive UV
exposure. A mechanism to allow the public and children to immediately understand the connection
between exposure and deleterious health effects is required. The notable latency between exposure
and biological effect are not appropriate for educational purposes.
There is a commercially available simple “educational toy”, which will be called blueprint paper
hereafter that can be employed to demonstrate an immediate physical response to UV radiation in real
time that can be observed easily and safely by anyone. The product is not new, and has been readily
available from scientific educational stores for many years, but has never been effectively studied for
its response to the biologically weighted UV spectrum. This article aims to analyse blueprint paper so
that UV researchers and educators can be confident of its effectiveness in responding to UV radiation,
and, therefore can be used as a “hands-on” engagement activity for students and the public alike.

3
Education research shows that “hands-on” activities promote greater understanding than any other
form of learning.
The blueprint paper is a solar radiation sensitive paper. The paper is based on the principle of
cyanotype, an alternative to the early forms of silver based photographic printing that was published
by John Hershel in 1842 as a post-script [18] and was subsequently used as the method of producing
blueprints for designs and schematics in the 20th century. History and information regarding the
technique of cyanotyping has been extensively documented [19]. The chemical process of producing
the colour Prussian blue in the cyanotype has also been documented [20]. Prussian blue is the product
of the reaction between either iron (III) and ferrocyanide ions, or iron (II) and ferricyanide ions. Iron
(II) ions are generated by the photochemical decomposition of iron (III) complexes with ligands such
as oxalate or citrate, through a photo-activated redox reaction. The iron (II) ions are then free to react
with ferricyanide to produce Prussian blue. The photo-activation in the cyanotype process occurs most
easily due to ultraviolet and extreme violet radiation exposure [21]. Prussian blue is an insoluble
product, but can be embedded in paper or cloth when the chemical process takes place. This is a
common experiment for undergraduate students undertaking chemistry, by soaking cloth in the
prepared reactants before exposing the cloth and adding an overlying negative type image, to solar
radiation to initiate the cyanotype process. This procedure is called the “printing-out-process” since it
does not require any other development to produce the image [22]. Any unreacted salts can be washed
from the cloth leaving an image of the negative in shades of blue. Recently this technique has been
used to create a simple solar radiation dosimeter, with depth of Prussian blue colouring in the cloth
correlated to solar UV exposure [23].
The blueprint paper (of varying sizes depending on manufacturer) has embedded reactants that
undergo the above reaction when exposed to solar radiation. The blueprint paper is provided as a dry
product, and during exposure shows pale blue fading to greenish-white. After exposure the paper is
rinsed in water to remove unreacted salts. During the rinse process, it can be observed that the white
areas will change to blue within just a minute of rinsing. After drying, the paper shows deep blue
where sunlight caused a reaction and white (no exposure) to shades of blue (low to medium exposure)
depending on level of exposure to solar radiation. This inverse of the colours during exposure and
development have been used to simulate film photography methods [24]. Given the simplicity of the
blueprint paper development, in that it does not require a wet lab for the experiment (only access to
water), and can be safely used by children and adults of all ages, it was hypothesised that the
applications seen by the cloth experiment in UV exposure measurement could be reproduced using
the blueprint paper.
UV radiation and visible light are assigned the role of the sensitiser in the blueprint paper just like that
of the cyanotype process. However, there appears to be little documented evidence as to exactly what

4
part of the solar spectral range is the primary initiator of the reaction. Work done by Price et al. [25]
used blueprint paper to study light distribution on grape clusters. Blueprint paper was used in place of
ozalid paper, a photosensitive paper used to observe light distribution in ecological and plant based
studies [26] that required development in a chamber with ammonia gas [25]. However, Price et al
reported they could not obtain a spectral response of the blueprint paper from the manufacturer and
that lack of a spectral response would limit the use of the blueprint paper in their devised experimental
method. Price et al. assumed that blueprint paper must be most responsive in the violet and ultraviolet
spectrum (similar to ozalid paper), based on unpublished data that reported the paper having no
response to wavelengths above 500 nm. Ware [21] stipulates that maximum effect is observed due to
the near ultraviolet and blue light spectra, although he also states that this range is 300 nm to 400nm
and known as UVA radiation. A breakdown of the UV spectrum consists of UVC radiation (200 nm
to 280 nm), UVB radiation (280 nm to 315 nm) and UVA radiation (315 nm to 400 nm) [27, 28] and
above 400 nm as violet or visible radiation (the division between UVA and UVB may also be stated
in some sources at 320 nm for other areas of study [29, 30]). For solar UV studies those divisions are
limited to UVB (290 nm to 315 nm) since there is no terrestrial UVB below 290 nm, UVA (315 nm to
400 nm) and visible (400 nm and above). However, lack of consistent nomenclature notwithstanding,
there is evidence to indicate UV radiation is the main initiator of this reaction despite a lack of
published work in this regard. This study will characterise the blueprint paper, by providing a dose
response and a preliminary spectral response for the cyanotype process that produces the dye Prussian
blue. These qualities will provide the certainty that blueprint paper can be used to demonstrate effects
due to UV radiation to the public and students. Example demonstration uses will also be provided.
2.0 Methodology
Blueprint paper is available commercially through three companies of manufacture, with each
blueprint paper marketed with different names. These companies, the product name and the company
website are listed in Table 1. At least two of the three companies export their products with Australian
suppliers listed (from which the product was obtained). Samples of the blueprint paper were
purchased from the companies and two of the three tested in this study. The third blueprint paper was
not tested due to its discovery of production after all of the tests were completed. A legend for each
commercial product used in the following study is provided in Table 1, in which each company of
manufacture is referred to as Paper 1, 2 or 3. Lawrence and Fishelson [22] also provide instruction on
creating one’s own version of this paper.
2.1 Spectral Response

5
Paper 1 was divided into smaller sized sheets and individually exposed to UV radiation. The paper
was cut to sizes of 3 cm × 4 cm and was held in place using a film transparency holder measuring 3.5
cm × 2.3 cm. The UV radiation was produced by an irradiation monochromator with a 1600 W lamp
(model 66390 Oriel Instruments, California, USA) and double grating monochromator (model 74125
Oriel Instruments, California, USA) controlled by a digital exposure controller (model 68591, Oriel
Instruments, California, USA). Input and output slits were set to 4.5 mm and 4.0 mm respectively.
The output beam covered the film transparency aperture. Each sheet of blueprint paper segment was
exposed to 2000 J/m2 per 10 nm step with an average full-width-half-maximum (FWHM) of 5.2 nm,
starting at 280 nm to 430 nm in the initial test run. Following tests increased this range to 450 nm.
The blueprint paper was placed at 16.4 cm from the irradiation monochromator aperture. The
exposure was calculated by measuring the output of the irradiation monochromators using a
spectroradiometer (model DMc150, Bentham Instruments Ltd, Reading UK) and calculating the
equivalent time for exposure. The minimum exposure for a response of the chemical process is 34
J/m2 [21]. The dose of 2000 J/m
2 for each exposure per wavelength was used after a number of trials
at a variety of exposure amounts and times. Exposure ranges from 500 J/m2 to 1500 J/m
2 did not
provide information that would withstand the pixel counting procedure (producing low to no counts
compared to a saturated exposed reference sheet), and exposures well above 2000 J/m2 often saturated
the paper. Consequently, the exposure of 2,000 J/m2 provided the most appropriate indication per
wavelength of radiant UV sensitivity. Examples of a “no exposure” and “saturated exposure”
reference sheet are provided in Figure 1 for both Paper 1 and Paper 2. It is interesting to note that the
saturation is deeper in Paper 2 than Paper 1. Saturation was achieved using the full solar spectrum.
Paper 1 also shows that the protective layer that covered the “no exposure” side was moved during
exposure, leaving a mid-tone exposure in the centre of the sheet. This central section of the image was
not used as part of the reference sheet (detailed next). After exposure each blueprint paper sheet was
washed in water, dried and photographed using a digital camera Nikon D7000 with 18-105 mm lens.
To ensure no variation between photographs, each paper sheet was photographed on an illuminated
white background, using the set photographic controls including a pre-set white balance for the
illuminated background (daylight with additional lamp lighting) without any other objects on the page
(as compared to an 18% grey card which provides colour balance between neutral colours in an
image, and helps to prevent under- or over-exposure of an image). The manual settings of the camera
included an aperture of f/9, shutter speed of 1/50, ISO of 800 with no flash. The focal length of the
camera is recorded at 32 mm with a 35 mm lens focal length at 48 mm. The images of each exposed
piece of paper were then cropped to the same dimensions to show blue print paper only. Two methods
of pixel counting were used to determine effect of exposure per wavelength. An algorithm developed
to count blue pixels in a sky image used in Downs, et al. [31] was used to count the number of dark
blue pixels as stipulated by a saturation amount. The second method was the use of the program
Multispec (for Windows) which is used for analysis of multispectral image data. Each method
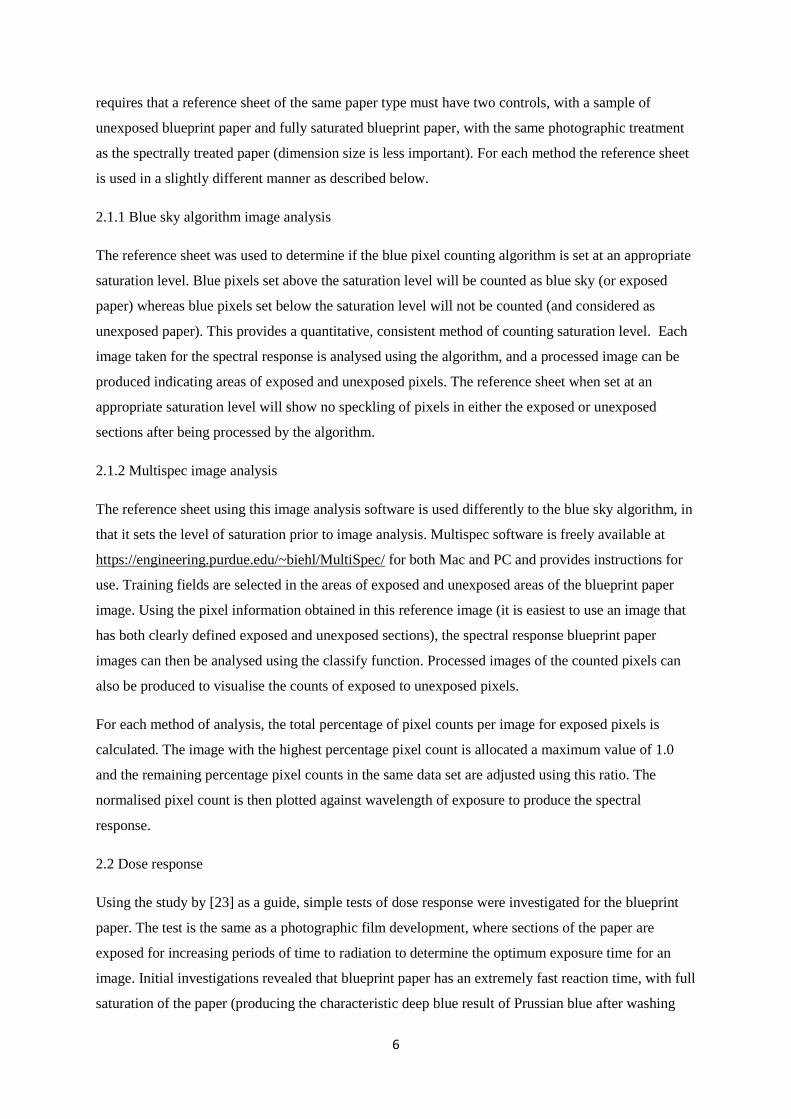
6
requires that a reference sheet of the same paper type must have two controls, with a sample of
unexposed blueprint paper and fully saturated blueprint paper, with the same photographic treatment
as the spectrally treated paper (dimension size is less important). For each method the reference sheet
is used in a slightly different manner as described below.
2.1.1 Blue sky algorithm image analysis
The reference sheet was used to determine if the blue pixel counting algorithm is set at an appropriate
saturation level. Blue pixels set above the saturation level will be counted as blue sky (or exposed
paper) whereas blue pixels set below the saturation level will not be counted (and considered as
unexposed paper). This provides a quantitative, consistent method of counting saturation level. Each
image taken for the spectral response is analysed using the algorithm, and a processed image can be
produced indicating areas of exposed and unexposed pixels. The reference sheet when set at an
appropriate saturation level will show no speckling of pixels in either the exposed or unexposed
sections after being processed by the algorithm.
2.1.2 Multispec image analysis
The reference sheet using this image analysis software is used differently to the blue sky algorithm, in
that it sets the level of saturation prior to image analysis. Multispec software is freely available at
https://engineering.purdue.edu/~biehl/MultiSpec/ for both Mac and PC and provides instructions for
use. Training fields are selected in the areas of exposed and unexposed areas of the blueprint paper
image. Using the pixel information obtained in this reference image (it is easiest to use an image that
has both clearly defined exposed and unexposed sections), the spectral response blueprint paper
images can then be analysed using the classify function. Processed images of the counted pixels can
also be produced to visualise the counts of exposed to unexposed pixels.
For each method of analysis, the total percentage of pixel counts per image for exposed pixels is
calculated. The image with the highest percentage pixel count is allocated a maximum value of 1.0
and the remaining percentage pixel counts in the same data set are adjusted using this ratio. The
normalised pixel count is then plotted against wavelength of exposure to produce the spectral
response.
2.2 Dose response
Using the study by [23] as a guide, simple tests of dose response were investigated for the blueprint
paper. The test is the same as a photographic film development, where sections of the paper are
exposed for increasing periods of time to radiation to determine the optimum exposure time for an
image. Initial investigations revealed that blueprint paper has an extremely fast reaction time, with full
saturation of the paper (producing the characteristic deep blue result of Prussian blue after washing

7
and drying) in less than one minute exposure on a sunny winter’s day in Toowoomba (27.5o S, 151.9
o
E) at noon (44.9 o SZA). Ware [21] identified that the cyanotype reaction only requires a very low
radiant energy density of 34 J/m2 to produce a perceptible visual effect. Further tests of shorter time
intervals were made, that indicated intervals of 10 seconds, whilst providing a visible indication that a
dose response is apparent, is still too fast for effective scientific investigations about exposure times.
A neutral density filter consisting of thin white plastic (household garbage bags) was used to slow the
dose response. Transmission tests using a spectrophotometer (UV-2700, Shimadzu & Co, Kyoto,
Japan) indicate that a single layer of the neutral density filter has an average spectral transmission
from 280 nm to 400 nm of 8.5% and from 400 nm to 700 nm an average of 12%. A double layer of
neutral density filter was shown to have an average transmission of 2.3% for the range of 280 nm to
400 nm and 3.8% transmission for 400 nm to 700 nm. The overall transmission values are provided in
Figure 2 [32].
The dose response of Paper 2 (see Table 1) was tested on September 7, 2013 on a sunny day (51 to
56.7 o SZA), using each (single and double) neutral density filter layer. To create the paper dose
response, one sheet of blueprint paper (10 cm × 10 cm) was divided into smaller pieces (2 cm × 2 cm
square) to limit sheet variation and batch variation per paper type. Two controls were created per dose
response. One piece was not exposed to any solar UV irradiance, whilst a second was exposed to solar
UV irradiance for several minutes to obtain saturation. Under one layer of the neutral density filter,
ten pieces of blueprint paper were exposed to solar UV irradiance in time intervals of 30 seconds,
whilst the solar UVB exposure was measured concurrently. An additional dose response using two
layers of neutral density filter with increasing intervals of 1 minute exposure to solar UV irradiance
was carried out with measured solar UVB exposure.
A broadband UVB sensor (IL-1400, International Light Inc, Massachusetts, USA) was used to
measure the UV radiation exposure for the transmitted UV radiation with the corresponding layers
neutral density filter (one layer for a five minute dose response and a double layer for a ten minute
dose response) over the sensor. The neutral density filter was stretched as taut as possible across both
the blueprint paper and the UVB detector head during each dose response measurement. The sensor
(model SEL240, International Light Inc) is used with a UVB Detector Head with a wavelength
sensitivity range from 256 nm to 314 nm. This instrument is regularly calibrated again a scanning
spectroradiometer (model DTM 300, Bentham Instruments, Reading, UK) located on a nearby
building rooftop, and therefore it is possible to correlate the UVB measured to the entire UV
spectrum. The ambient UV exposure was calculated from the UV irradiances recorded by the
spectroradiometer. The spectroradiometer is kept temperature stabilised in an environmentally sealed
box at 25.0º ± 0.5º. The spectroradiometer runs continuously from 5.00 am to 7.00 pm and makes
global and diffuse scans alternating throughout the day so that global scans are carried out on the 0,
10, 20, 30, 40, and 50 minute interval in the hour and the diffuse scans are carried out on the 5, 15, 25,

8
35, 45 and 55 minute interval in the hour. Each dose response measurement was carried out mid-
afternoon 7 September 2013. The corresponding afternoon group of global scans from the
spectroradiometer were collated (from 2.00 pm to 3.30 pm). The spectral UV erythemal irradiance
was collected, the exposure values calculated and plotted against time in order to obtain a polynomial
line of best fit. Using the line of best fit, ambient UV exposure values were calculated at the times the
measurements were taken and then cumulatively combined per increase in time.
After exposure each piece of blueprint paper was washed in water, dried and photographed. The
camera settings were the same as those used for the spectral response using the same set up and
background, except the camera focal length is recorded at 34mm with the lens 35mm focal length at
51 mm. As these are analysed separately to the dose response images, a slight variation in distance is
negligible. Given the size of the blueprint paper pieces, all pieces in a dose response set fitted into
one photograph, thus limiting any further variation between images. Each section of blueprint paper
was then cropped from the image using Photoshop CS6 with no white background present in each
individual timed dose with the same dimensions per cropped image. Information about each timed
dose or control piece was obtained either using Photoshop or a method devised by Downs et al. [33]
using Microsoft Office Picture Manager. The method using Photoshop CS6 used mean RGB value
from the image histogram for each timed dose response piece and the unexposed control piece. Any
software that provides histogram image analysis can provide this information. The difference between
each mean RGB value was calculated and compared to the total change in RGB values observed
between the unexposed and fully saturated control pieces. This resulted in a ratio between 0 to 1. This
method is similar in technique to that devised by Downs et al. [33]. That technique was originally
used to measure ink fade but it applies equally to colour saturation. The method requires the image to
be converted to monochrome (or grey scale) images. In Microsoft Office Picture Manager this can be
achieved by changing colour settings of “Amount” and “Saturation” to zero. The image is then
processed by increasing contrast to 100, and then slowly decreasing brightness until the image turns
completely black. Alternatively, the brightness could also be increased until the image turns
completely white. The brightness level is then recorded. This is repeated for each image obtained per
timed dose and each control piece. The difference between the brightness of the timed dose response
and the unexposed control piece is then compared to the range of brightness between the unexposed
control piece and the fully saturated control piece. This results in a ratio between 0 and 1.
2.3 Response after development
The blueprint paper was exposed for a photogram image and developed by washing in water. Half of
the same sheet was exposed to further solar irradiance and then photographed for analysis to detect if
there was any further change.
2.4 The cyanotype process

9
The basic chemical experiment in the traditional wet lab of cyanotypes includes creation of
photograms (images made without a camera). Example items include film negatives, positive images
(black and white images printed on transparencies) and objects. Some of the manufacturing
companies provide other examples of possible photograms, showing that sunscreen will block UV
radiation and prevent the chemical reaction in the paper. The procedure for this latter experiment
recommends using glass slides or sheets of acrylic (provided in some kits made by the companies) to
apply sunscreen to cover the blueprint paper. Whilst this is an understandable idea, glass is an
unsuitable item to allow younger children to use in case of breakage and therefore has been avoided
by the authors. Additionally, both glass and acrylic absorb strongly in the UVB radiation spectrum
and are therefore blocking a portion of the UV spectrum that is explored. It is instead recommended
by the authors that polyethylene (plastic sheet protectors) is a suitable and cost effective replacement
for both these recommended items. Polyethylene has a high transmission across both the UV and
visible spectrum (ranging from 60% transmission at 280 nm to 80% transmission at 700 nm) as shown
in Figure 2 [32]. The plastic sheet protectors can be obtained in large quantities at any stationery store
for a reasonably low cost and are safe for younger children to use under supervision.
3.0 Results
3.1 Spectral Response
Figure 3 provides the spectral response as photographed images of the exposed and developed paper.
The paper used in this particular example is Paper 1, and is one of a set of two carried out on the same
day of testing. Figure 4 provides the image processed versions of the images shown in Figure 3 using
MultiSpec software to classify the pixels. The percentage count of blue pixels was tabulated per
wavelength, then normalised according to the maximum exposure count. For sheet 1, maximum blue
pixel count occurred at 300 nm and for sheet 2 maximum blue pixel count occurred at 330 nm.
Despite the variation between sheets of the same paper type there is a definite correlation between the
exposure wavelength and the sensitivity of the paper, with sensitivity decreasing as wavelength
increases. Early tests indicated that wavelengths above 430 nm may be a promoter of the chemical
reaction, though later tests that extend to 450 nm do not indicate any promoter effect of the chemical
reaction in the paper above 430 nm. It does show that violet light is able to produce the cyanotype
reaction, but with a lower effectiveness than for the UVB radiation. Figure 5 provides the data
obtained for Paper 1 type.
3.2 Dose response

10
The dose responses produced using the neutral density filters show increasing colour saturation with
increasing exposure time (Figure 6) with one layer used for the five minute exposure and two layers
used for the ten minute exposure. Also visible are “creases” from the neutral density filter, where the
filter was not stretched evenly. It was quite difficult to eliminate creases given the elasticity of the
filter. When correlated against pixel saturation and change in RGB mean or change in brightness
(Figures 7 a & b), the results are extremely similar for each method for both the five minute and ten
minute dose responses plotted against UVB irradiance. Both the five minute and ten minute dose
responses show a linear dose response. For the five minute dose response, the following lines of best
were noted: brightness 𝑦 = 9.4𝑥 + 0.9 (𝑅2 = 0.98), RGB mean 𝑦 = 7.8𝑥 + 1.06 (𝑅2 = 0.96),
ambient brightness 𝑦 = 361.3𝑥 + 36.9 (𝑅2 = 0.98) and ambient RGB mean 𝑦 = 300.7𝑥 +
43.3 (𝑅2 = 0.96). For the ten minute dose response, the following lines of best fit were noted:
brightness 𝑦 = 4.2𝑥 + 0.7 (𝑅2 = 0.97), RGB mean 𝑦 = 4.3𝑥 + 0.6 (𝑅2 = 0.99), ambient brightness
𝑦 = 223𝑥 + 35.8 (𝑅2 = 0.97) and ambient RGB mean 𝑦 = 228𝑥 + 31.2 (𝑅2 = 0.99). It is
interesting to note that both the filtered UVB and ambient erythemal UV dose responses for the five
minute and ten minute sessions differ in exposure rates (Figure 7c). This is only in part due to the time
of day the dose responses were measured. The ten minute dose response was carried out later in the
afternoon when lower ambient exposures were experienced with the five minute dose response made
from 2.30 pm to 2.35 pm and the ten minute dose response made from 3.10 pm to 3.20 pm. Therefore
the ten minute exposure undergoes both less UV exposure due to lower ambient UV, with filtered UV
exposure extending the exposure time, resulting in a lower exposure rate. In addition, with the
saturation limitations of the blueprint paper and possibly batch or paper variation, it is not unexpected
that the exposure rates are different. Interestingly, it is observable here that the filtered UVB exposure
(from the IL1400 with neutral density filter) and the ambient erythemal exposure (from the Bentham
DTM300) are comparable for most of the dynamic response, with some variation occurring in the
measurements with deeper colour saturation.
3.3 Response after Development
There was no measurable dark reaction for the blueprint paper. Once the paper is washed, the salts are
removed completely from the paper and the reaction cannot continue. The image tested did not show
any change after development.
3.4 The cyanotype process
Figure 8 shows the result of a basic experiment using the blueprint paper, where an image printed in
black on overhead projector transparency sheets, has been superimposed on the blueprint paper.
Where the solar irradiance has been blocked from the blueprint paper, the reaction creating Prussian
Blue does not occur in these spaces. Therefore, the white/pale blue is a result of no reaction and dark
11
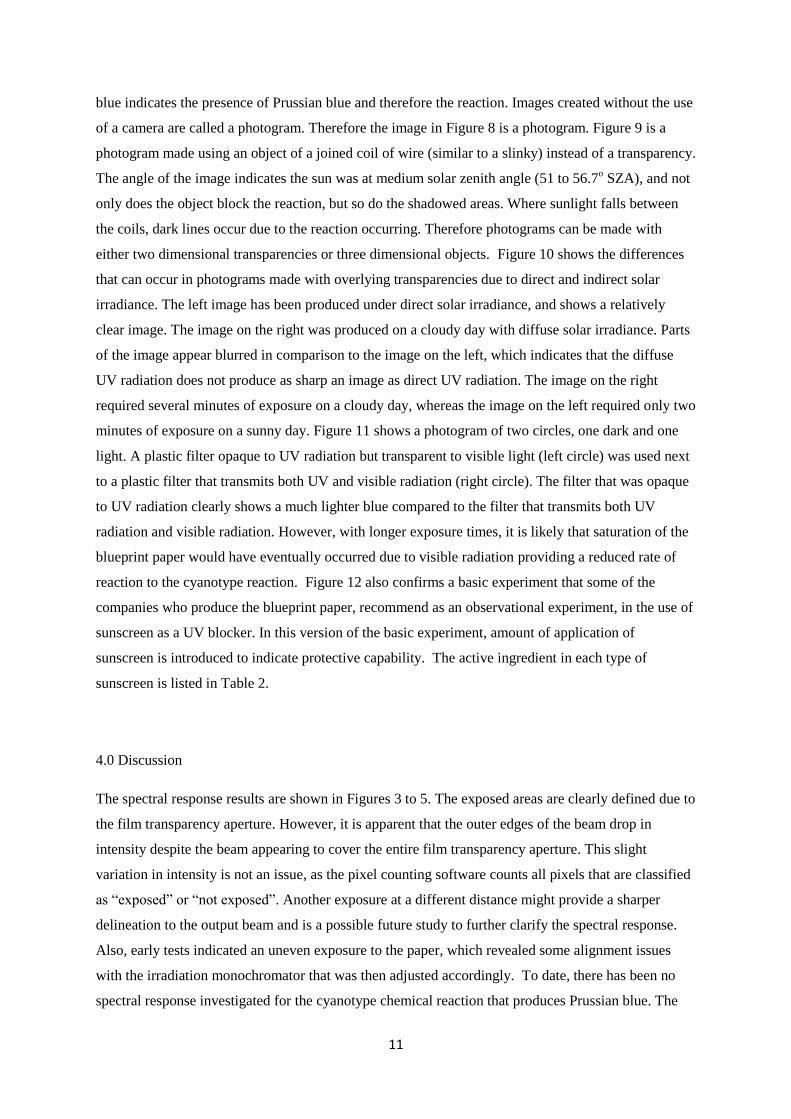
blue indicates the presence of Prussian blue and therefore the reaction. Images created without the use
of a camera are called a photogram. Therefore the image in Figure 8 is a photogram. Figure 9 is a
photogram made using an object of a joined coil of wire (similar to a slinky) instead of a transparency.
The angle of the image indicates the sun was at medium solar zenith angle (51 to 56.7o SZA), and not
only does the object block the reaction, but so do the shadowed areas. Where sunlight falls between
the coils, dark lines occur due to the reaction occurring. Therefore photograms can be made with
either two dimensional transparencies or three dimensional objects. Figure 10 shows the differences
that can occur in photograms made with overlying transparencies due to direct and indirect solar
irradiance. The left image has been produced under direct solar irradiance, and shows a relatively
clear image. The image on the right was produced on a cloudy day with diffuse solar irradiance. Parts
of the image appear blurred in comparison to the image on the left, which indicates that the diffuse
UV radiation does not produce as sharp an image as direct UV radiation. The image on the right
required several minutes of exposure on a cloudy day, whereas the image on the left required only two
minutes of exposure on a sunny day. Figure 11 shows a photogram of two circles, one dark and one
light. A plastic filter opaque to UV radiation but transparent to visible light (left circle) was used next
to a plastic filter that transmits both UV and visible radiation (right circle). The filter that was opaque
to UV radiation clearly shows a much lighter blue compared to the filter that transmits both UV
radiation and visible radiation. However, with longer exposure times, it is likely that saturation of the
blueprint paper would have eventually occurred due to visible radiation providing a reduced rate of
reaction to the cyanotype reaction. Figure 12 also confirms a basic experiment that some of the
companies who produce the blueprint paper, recommend as an observational experiment, in the use of
sunscreen as a UV blocker. In this version of the basic experiment, amount of application of
sunscreen is introduced to indicate protective capability. The active ingredient in each type of
sunscreen is listed in Table 2.
4.0 Discussion
The spectral response results are shown in Figures 3 to 5. The exposed areas are clearly defined due to
the film transparency aperture. However, it is apparent that the outer edges of the beam drop in
intensity despite the beam appearing to cover the entire film transparency aperture. This slight
variation in intensity is not an issue, as the pixel counting software counts all pixels that are classified
as “exposed” or “not exposed”. Another exposure at a different distance might provide a sharper
delineation to the output beam and is a possible future study to further clarify the spectral response.
Also, early tests indicated an uneven exposure to the paper, which revealed some alignment issues
with the irradiation monochromator that was then adjusted accordingly. To date, there has been no
spectral response investigated for the cyanotype chemical reaction that produces Prussian blue. The

12
method used in this study is a completely new method to investigate influence of UV radiation
wavelength on the cyanotype chemical reaction that produces Prussian blue, with no information
provided in the literature reviewed. Given that many UV radiation induced action spectra normally
have strong sensitivity in the shorter UVB wavelengths, it is interesting to observe that the longer
UVB range and shorter UVA range had the most sensitivity in producing the product Prussian blue,
with a skewed bell shaped curve. The pixel counting software (Figure 4 shows the data obtained using
MultiSpec for Windows) also indicates that the effect of wavelengths greater than 420 nm are not
effective at producing Prussian blue. Young, Freedman & Ford [34] stipulate that the wavelength
range of 400 nm to 450 nm is classified as violet coloured irradiance, and wavelength from 450 nm
upwards is classified as blue wavelengths. Therefore, it appears ultraviolet and violet classified
wavelengths are the only effective wavelengths to produce the chemical reaction, rather than the
previously assumed range of ultraviolet radiation to blue radiation.
Additionally, it was found that variation in this spectral response varied with Paper type. There was
variation also observed with different batches of the same Paper type, and to a lesser extent, the
separate sheets within a batch of the same Paper type. This suggests that the production methods of
the different companies, and even within manufacturing processes, result in variation in the chemical
density of reagents present. This would account for the variation in exposed pixels counted in some of
the preliminary test results. An expression of the uncertainty of the spectral response cannot be
calculated given that only three spectral response data measurements for each point in the spectrum
have been obtained. This is not enough data to provide confidence in statistical analysis until further
repeated measurements can be made. Variations between batch types and paper type will also
introduce further uncertainty that will need to be investigated.
The five minute and ten minute dose response tests show similarity (Figure 6) in depth of colour
saturation. A comparison of the RGB mean in each dose response shows that the saturation level of
each exposed piece (as indicated in Figure 7 (a & b)) is approximately the same for each
corresponding time, which also means dynamic response is limited to short time periods unless
alternative neutral density filters are used. In other words, they appear the same visually. For example,
the 7 minute exposure corresponds to 3.5 minute exposure – which is the 8th exposed piece from the
left in Figure 6. The colour range indicated by the unexposed to the fully exposed shows that only a
limited dynamic range may be supported by the blueprint paper. The maximum variance in mean
RGB between saturation levels at each corresponding colours is 10%. This suggests that the neutral
density filter, despite the average difference of transmission varying by a factor of four, indicates only
a factor of two difference between layers with exposure time. One neutral density filter layer used
with half minute intervals corresponds with a double neutral density filter layer used with minute
intervals, although exact double UV exposure is not observed in Figure 7b or Figure 7c. In fact,
erythemal exposure is actually lower in this data set given that the dose response was carried out later

13
in the afternoon compared to the five minute dose response (Figure 7a). Figure 7c indicates that the
differing exposure with differing neutral density filters produce different dose responses. Ideally these
dose responses should be carried out over the noon period to reduce significant variation. However, it
can be beneficial to use this variation to enforce the conceptual understanding for students that UV
exposure varies significantly over the day. It is indicative that using either method of image analysis
(brightness change or RGB mean change) produces similar results and thus either method is suitable
for a basic analysis of the dynamic response. This can then be used as a method of approximating UV
exposure in short periods of time. If equipment is not available for use as indicated in the
methodology, Downs et al. [23] have shown that an Edison UV checker can be used as an inexpensive
means to measure ambient UV exposure in order to carry out a dose response calculation as shown in
Figures 7 (a) & (b). This affordable instrument has previously been used successfully in other
dosimetry experiments [33, 35]. It was also interesting to observe the creases produced in some of the
images from the addition of the neutral density filter. By taking non-creased segments of an image
that had a visible crease, the mean response from the histogram of those images did not change, nor
did the brightness. Therefore “creases” from the neutral density filter did not affect the production of
the dose response. However, it is advised that the filter should always be fixed as flat as possible.
Many of the recommended experiments from the paper manufacturers confirm that which has been
done before. However this study shows that UV radiation is the most effective initiator of the
cyanotype reaction. A further potential experiment that might be explored for younger children is the
concept of translating three dimensional objects into two dimensional images. This might simply
involve younger students working out how to make specific patterns using shade from three
dimensional objects. This may provide students a connection between UV exposure and shade (shade
reduces exposure). However this should be used cautiously if the intention is to demonstrate that
shade does not block all UV exposure (as shown in Figure 10) and even in shaded situations relatively
sharp images can be produced. In this Figure it is also interesting to note that blurring occurs within
the image (see highlighted areas). This blurring is not due to the layer of image transparency moving,
and could be attributed to the diffuse nature of the UV exposure, which again may be a suitable
variation in an investigation to explore the properties of UV radiation exposure. It may be suitable to
investigate the differences between photograms made in direct sunlight and indirect sunlight for
younger students, so as to introduce students to duration of exposure time and how the exposure is
obtained. In moving onto exploring the difference between ultraviolet and visible radiation, the filters
used in Figure 11 are inexpensive to obtain (originally obtained from the same supplier as Paper 1)
and can then be included in experiments to stimulate discussion on whether solar ultraviolet radiation
can be present inside buildings as opposed to outside.
The sunscreen test is recommended for public outreach, where a number of sunscreens might be
compared against one another for effectiveness, mainly for investigation of ease of application and

14
amount of application. Using the modified method outlined in this study, this experiment has been
successfully used by children aged five and up to show the effectiveness in application of sunscreen
(level of thickness). From Figure 12 we can see that of the three types tested, Sunscreen number 3
appears to show the best spread-ability and coverage for layers of thin to thick, but sunscreen 2
apparently shows the maximum blocking ability for its thickest layer. An experiment such as this is a
good reminder to students and to the public that generous application of sunscreen is more effective
than light application of sunscreen. Studies show that sunscreen is not regularly applied at the
recommended amounts [36, 37]. The Cancer Council of Australia recommends a minimum of one
half to one teaspoon of sunscreen applied per limb. This recommendation is based on the
internationally accepted amount of sunscreen application at 2 mg/cm2 [36, 37] and is equivalent to an
average of nine teaspoons of sunscreen applied on an adult [38]. All the sunscreens used were sun
protection factor (SPF) 30+ with different active ingredients (see Table 2). At this stage this style of
basic test would be unable to provide analysis between different active ingredients given it can be
difficult to apply the sunscreen evenly to a slippery surface. It is also unlikely that tests to look at
different SPF would provide useful information, given that the difference between SPF 30 and SPF 50
protection is about 3%, with a non-linear protection scale. However, future tests could easily include
investigating application methods (spray versus roll on versus application by hand) which may
provide further extension to these studies.
Of all the characterisation tests carried out in this study, the spectral sensitivity response test is the
least likely to be effective in public demonstrations given the equipment and extensive analysis
techniques required. However, prior development of a sheet of spectral sensitivity such as those in
Figure 3, could be made to use as a visual aid in any public outreach. The dose response technique, is
easily demonstrated in a real time experiment, and visual comparison of results could be estimated if
the demonstration incorporated factors such as the exposure of paper to UV in a shaded environment,
and by comparing it to the dynamic response calibration to determine how much UV exposure is
obtained in a short time in a shaded environment. Measurements made at noon even with a neutral
density filter may require shorter time periods to ensure saturation is not achieved too soon throughout
the experiment. The analysis can then be carried out within an hour of the initial exposures, or even
estimated when observed in real time during the blue to white fade observed as the paper is exposed.
The more straightforward experiments outlined last in this study are the most likely to be able to
capture interest at the beginning of any outreach plan. Suggested further studies include investigation
of the effectiveness of application of spray on sun screen, including both the alcohol based sprays
compared to pump action cream sprays and standard cream application.
Through this investigation, the authors have found a direct link with wavelength and the reaction that
produces Prussian blue. This is a significant step in the understanding of the cyanotype reaction that
deserves further attention to shed further light on nature of this chemical process.

15
Acknowledgements
The authors would like to thank Laboratory Officer Kim Larsen for his assistance and consultation
with this study.

16
References
1. Smith, B. J., Ferguson, C., McKenzie, J., Bauman, A., and Vita, P., Impacts from repeated mass media campaigns to promote sun protection in Australia. Health Promotion International, 2002. 17(1): p. 51-60.
2. McCarthy, W., The Australian Experience in Sun Protection and Screening for Melanoma. Journal of Surgical Oncology, 2004. 86: p. 236-245.
3. Armstrong, B. K. and Kricker, A., The epidemiology of UV induced skin cancer. Journal of Photochemistry and Photobiology B: Biology, 2001. 63: p. 8-18.
4. Godar, D. E., UV Doses Worldwide. Photochemistry and Photobiology, 2005. 81: p. 736-749. 5. de Gruijl, F., Skin cancer and solar UV radiation. European Journal of Cancer, 1999. 35(14): p.
2003-2009. 6. Lemus-Deschamps, L. and Makin, J. K., Fifty years of changes in UV Index and implications for
skin cancer in Australia. International Journal of Biometeorology, 2012. 56: p. 727-735. 7. Mckenzie, R., Aucamp, P., Bais, A., Bjorn, L., Ilyas, M., and Madronich, S., Ozone depletion
and climate change: impacts on UV radiation. Photochemical and Photobiological Sciences, 2011. 10: p. 182-198.
8. Lucas, R. M., McMichael, A. J., Armstrong, B. K., and Smith, W. T., Estimating the global disease burden due to ultraviolet radiation exposure. International Journal of Epidemiology, 2008. 37: p. 654-667.
9. English, D., Armstrong, B. K., Kricker, A., and Fleming, C., Sunlight and Cancer. Cancer Causes and Control, 1997. 8: p. 271-283.
10. Carter, O. B. and Donovan, R. J., Public (Mis)understanding of the UV Index. Journal of Health Communication, 2007. 12: p. 41-52.
11. Stengel, F. M. and Fernandez, J. F., Education and behavioral change for sun protection. Journal of Cosmetic Dermatology, 2005. 4: p. 83-88.
12. Stanton, W. R., Janda, M., Baade, P. D., and Anderson, P., Primary prevention of skin cancer: a review of sun protection in Australia and internationally. Health Promotion International, 2004. 19(3): p. 369-378.
13. Saraiya, M., Glanz, K., Briss, P. A., Nichols, P., White, C., Das, D., Smith, S. J., Tannor, B., Hutchinson, A. B., Wilson, K. M., Gandhi, N., Lee, N. C., Rimer, B., Coates, R. C., Kerner, J. F., Hiatt, R. A., Buffler, P., and Rochester, P., Interventions to prevent skin cancer by reducing exposure to ultraviolet radiation: A systematic review. American Journal of Preventative Medicine, 2004. 27(5): p. 422-466.
14. Hill, D., White, V., Marks, R., Theobald, T., Borland, R., and Roy, C., Melanoma prevention: behavioral and nonhehavioral factors in sunburn among Australian urban population. Preventative Medicine, 1992. 21(5): p. 654-669.
15. Milon, A., Sottas, P.-E., Bulliard, J.-L., and Vernez, D., Effective exposure to solar UV in building workers: influence of local and individual factors. Journal of Exposure Science and Environmental Epidemiology, 2007. 17: p. 58-68.
16. Honigsmann, H., Erythema and pigmentation. Photodermatology, Photoimmunology & Photomedicine, 2002. 18: p. 75-81.
17. Sliney, D., Epidemiological studies of sunlight and cataract: the critical factor of ultraviolet exposure geometry. Ophthalmic Epidemiology, 1994. 1(2): p. 107-119.
18. Hershel, J. F. W., On the action of rays of the solar spectrum on vegetable colours, and on some new photographic processes. Philosophical Transactions of the Royal Society of London, 1842. 132: p. 181-214.
19. Ware, M., Cyanotype: The history, science and art of photographic printing in Prussian blue. 1999, Bradford, England: National Museum of Photography, Film & Television.
20. Davidson, D., The Formulation of Prussian Blue. Journal of Chemical Education, 1937. 14(6): p. 277-281.

17
21. Ware, M., The molecular basis of blueprinting, in Cyanotype: The history, science and art of photographic printing in Prussian blue. 1999, National Museum of Photography, Film & Television: Bradford, Englad. p. 39-47.
22. Lawrence, G. D. and Fishelson, S., UV Catalysis, Cyanotype Photography and Sunscreens. Journal of Chemical Education, 1999. 76(9): p. 1199-1200.
23. Downs, N., Larsen, K., Parisi, A., Schouten, P., and Brennan, C., A practical science investigation for middle school students: Designing a simple cost effective chemical solar radiation dosimeter. Teaching Science, 2012. 58(1): p. 48-51.
24. Lawrence, G. D. and Fishelson, S., Blueprint Photography by the Cyanotype Process. Journal of Chemical Education, 1999. 76(9): p. 1216A-1216B.
25. Price, S. F., Schuette, M. L., and Tassie, E., Measuring incident light graph clusters using photosensitive paper and image analysis. Journal of the American Society for Horticultural Science, 1995. 120(2): p. 235-240.
26. Friend, D., A simple method of measuring integrated light values in the field. Ecology, 1961. 42(3): p. 577-580.
27. CIE, A reference action spectrum for ultraviolet induced erythema in human skin. CIE, 1987. 6: p. 17-22.
28. Mckenzie, R. and Madronich, S., Ultraviolet, Surface, in Encyclopedia of Atmospheric Sciences, R.H. James, Editor. 2003, Academic Press: Oxford. p. 2474-2480.
29. Diffey, B., Source and measurement of ultraviolet radiation. Methods, 2002. 28(1): p. 4-13. 30. Stamnes, K., Ultraviolet radiation, in Encyclopedia of Atmospheric Sciences, R.H. James,
Editor. 2003, Academic Press: Oxford. p. 2467-2473. 31. Downs, N., Parisi, A., Turner, J., and Turnbull, D., Modelling ultraviolet exposures in a school
environment. Photochemical and Photobiological Sciences, 2008. 7(6): p. 700-710. 32. Turner, J. and Parisi, A. V., Simple experiments to visualise and simulate the biological impact
of ultraviolet radiation, in 2014 NIWA UV Workshop, R. Mckenzie, Editor 2014: Auckland, New Zealand.
33. Downs, N., Turner, J., Parisi, A., and Spence, J., Pen ink as an ultraviolet dosimeter. Teaching Science, 2008. 54(4): p. 41-44.
34. Young, H. D., Freedman, R. A., and Ford, L., Sears and Zemansky's University Physics with Modern Physics. 2008, San Francisco, USA: Pearson Addison-Wesley.
35. Downs, N., Parisi, A., Powell, S., Turner, J., and Brennan, C., Extensions in pen ink dosimetry: Ultraviolet calibration applications for primary and secondary schools. Teaching Science, 2010. 56(1): p. 51-56.
36. Bauer, U., O'Brien, D. S., and Kimlin, M. G., A new method to quantify the application thickness of sunscreen on skin Photochemistry and Photobiology, 2010. 86: p. 1397-1403.
37. Petersen, B. and Wulf, H. C., Application of sunscreen - theory and reality. Photodermatology, Photoimmunology & Photomedicine, 2014. 30: p. 96-101.
38. Isedah, P., Osterwalder, U., and Lim, H. W., Teaspoon rule revisited: proper amount of sunscreen application. Photodermatology, Photoimmunology & Photomedicine, 2012. 29(1): p. 55-56.

18
Table 1- Information on the types of blueprint paper.
Paper
No.
Company Blueprint
paper name
Website Australian
Distributor
1 NaturePrint Paper Nature Print
Paper
www.natureprintpaper.com Haines
Educational
2 Lawrence Hall of
Science,
University of
California, Berkely
Sunprint Paper www.sunprints.org Prof Bunsen
Science
3 TEDCO Toys Sun Art Paper www.tedcotoys.com Not available
Table 2 - Information on the active ingredients in the sunscreens.
Sunscreen Number Active ingredients SPF Spectrum
protection claim
1 Homosalate 5%
Octisalate 5%
Oxybenzone 5%
Avobenzone 3%
Octocrylene 2.7%
30+ Not available
(sample only)
2 Octyl methoxycinnamate 7.5%
Octocrylene 4.0%
Zinc oxide 4.75%
Titanium dioxide 1.5%
30+ Broadband
3 Zinc oxide 18% 30+ High UVB+UVA

19
Figure 1 – Example references sheet of “no exposure” (light blue) to “saturated exposure” (dark blue).
Note that paper type shows different levels of saturation where Paper 2 (left) has darker saturation
than Paper 1 (right).
Figure 2 – Transmission of polyethylene (unbroken line), single layer of neutral density filter (wide
broken line) and double layer of neutral density filter (thin broken line). Figure reproduced with
permission [32].
0
20
40
60
80
100
280 380 480 580 680 780
Tran
smis
sio
n %
Wavelength (nm)

20
Figure 3 - Exposure to 2000 J/m2 per wavelength at 16.4 cm from outside of source.

21
Figure 4 - Pixel count corresponding images to the spectral test, using MultiSpec for windows
software.

22
Figure 5 – Spectral response of blueprint paper using the pixel counting analysis according to
different sheets used from one paper type (Paper 1) exposed at each wavelength to 2000 J/m2.
0.0
0.2
0.4
0.6
0.8
1.0
280 300 320 340 360 380 400 420 440
No
rmal
ise
d r
esp
on
se
Wavelength (nm)
Preliminary test Test 1 Test 2

23
Figure 6 - Dose response using a single layer of neutral density filter for a five minute period (top)
and a double layer of neutral density filter for a ten minute period (bottom). Each dose response set
has an unexposed control piece (extreme left) and a fully exposed (saturated) control piece (extreme
right). Each piece is placed in sequential order of dose exposure time.
24
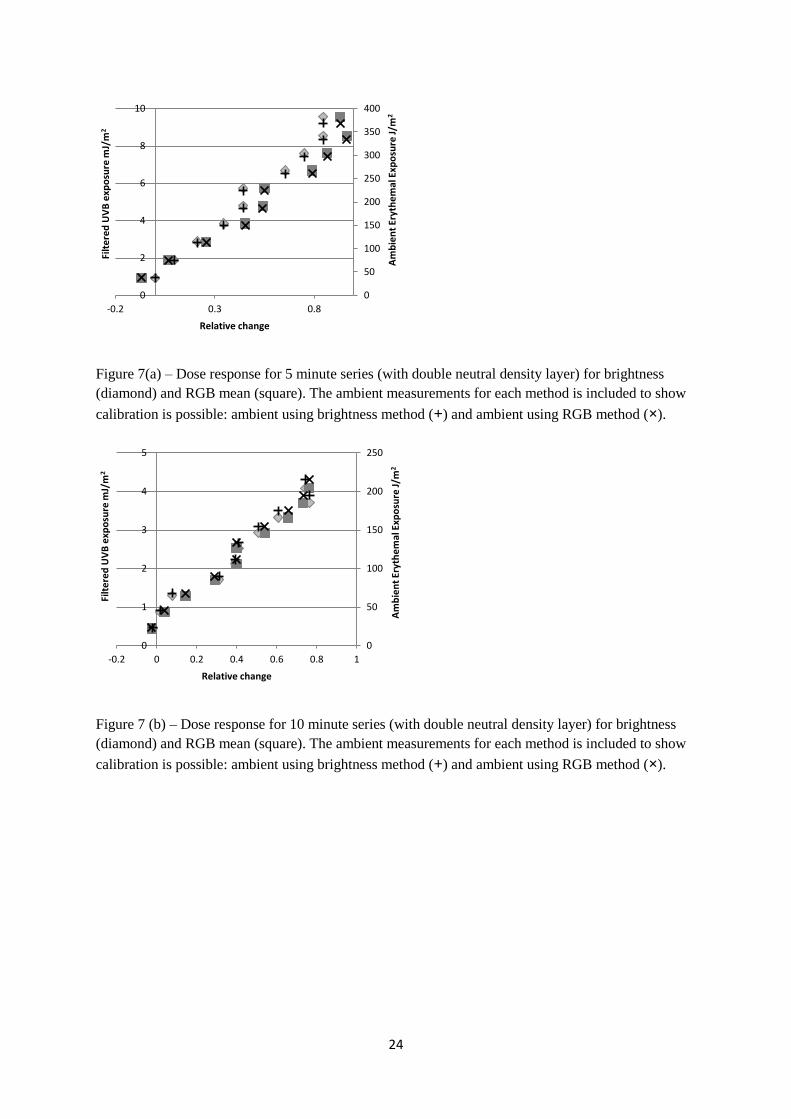
Figure 7(a) – Dose response for 5 minute series (with double neutral density layer) for brightness
(diamond) and RGB mean (square). The ambient measurements for each method is included to show
calibration is possible: ambient using brightness method (+) and ambient using RGB method (×).
Figure 7 (b) – Dose response for 10 minute series (with double neutral density layer) for brightness
(diamond) and RGB mean (square). The ambient measurements for each method is included to show
calibration is possible: ambient using brightness method (+) and ambient using RGB method (×).
0
50
100
150
200
250
300
350
400
0
2
4
6
8
10
-0.2 0.3 0.8
Am
bie
nt
Eryt
he
mal
Exp
osu
re J
/m2
Filt
ere
d U
VB
exp
osu
re m
J/m
2
Relative change
0
50
100
150
200
250
0
1
2
3
4
5
-0.2 0 0.2 0.4 0.6 0.8 1
Am
bie
nt
Eryt
he
mal
Exp
osu
re J
/m2
Filt
ere
d U
VB
exp
osu
re m
J/m
2
Relative change

25
Figure 7 (c) – Comparison between dose response using relative change in RGB mean for the 5
minute series (one layer of neutral density filter) 𝑦 = 7.8𝑥 + 1.1; 𝑅2 = 0.96 and 10 minute series
(two layers of neutral density filter) 𝑦 = 4.3𝑥 + 0.6; 𝑅2 = 0.99.
0
2
4
6
8
10
-0.2 0 0.2 0.4 0.6 0.8 1
Filt
ere
d U
VB
exp
osu
re m
J/m
2
RGB mean

26
Figure 8 - Photogram created using an image on a transparent sheet
Figure 9 - Photogram using an object (connected slinky spring) with sun at a medium SZA. Shadows
and light are recorded on the image.

27
Figure 10 - Photograms using transparent prints. The image on the left was produced in direct
sunlight in less than five minutes. Most of the image is relatively clear. The image on the right was
produced under shade with diffuse radiation and took five to ten minutes to produce. Parts of the
image are blurred (see highlighted areas); however this is not due to image movement.
Figure 11 - Simple plastic UV filters shows that UV is part of the main reactive energy source to
produce the reaction. The circle filter on the left was opaque to UV radiation whilst the one on the
right was transparent to UV. However, long exposure with the opaque filter would have eventuated in
a reaction due to the visible sensitivity.

28
Figure 12 - Basic sunscreen tests comparing sunscreen type can be carried out. Three different
sunscreens were tested at varying thicknesses (thinnest layer at the top of each box graduated in
increasing thickness to the bottom of the box).


![Abstract - emilyjkimportfolio.files.wordpress.com · These toys are called educational toys, and “[a] truly educational toy should promote some type of emotional, intellectual or](https://img.dokumen.tips/doc/110x75/5f7af605d7bdae5f5d238a43/abstract-these-toys-are-called-educational-toys-and-aoea-truly-educational.jpg)