Embed Size (px)
Citation preview

PAPER – 5 : ADVANCED MANAGEMENT ACCOUNTING
QUESTIONS
Value Added/ Non- Value Added Activities
1. Qwerty manufactures high-quality wooden doors within the forests of Qtown since 1967.
Management is having emphasize on creativity, engineering, innovation and experience to
provide customers with the door they desire, whether it is a standard design or a one -of-
a-kind custom door. The following information pertains to operations during April:
Processing time 9.0 hrs.* Waiting time 6.0 hrs.*
Inspection time 1.5 hr.* Move time 7.5 hrs.*
Units per batch 60 units
(*) average time per batch
Required
Compute the following operational measures:
(i) Average non-value-added time per batch
(ii) Average value added time per batch
(iii) Manufacturing cycle efficiency
(iv) Manufacturing cycle time
Life Cycle Costing and Pricing Strategy
2. OR International Ltd. (ORIL) has developed a new product ‘ 3α ’which is about to be
launched into the market. Company has spent ` 30,00,000 on R&D of product ‘ 3α ’. It has
also bought a machine to produce the product ‘ 3α ’ costing ` 11,25,000 with a capacity of
producing 1,100 units per week. Machine has no residual value.
The company has decided to charge price that will change with the cumulative numbers of
units sold:
Cumulative Sales (units) Selling Price ` per unit
0 to 2,200 750
2,201 to 7,700 600
7,701 to 15,950 525
15,951 to 59,950 450
59,951 and above 300
© The Institute of Chartered Accountants of India

2 FINAL EXAMINATION: NOVEMBER, 2018
Based on these selling prices, it is expected that sales demand will be as shown below:
Weeks Sales Demand per week (units)
1-10 220
11-20 550
21-30 825
31-70 1,100
71-80 880
81-90 660
91-100 440
101-110 220
Thereafter NIL
Unit variable costs are expected to be as follows:
` per unit
First 2,200 units 375
Next 13,750 units 300
Next 22,000 units 225
Next 22,000 units 188
Thereafter 225
ORIL uses just-in-time production system. Following is the total contribution statement of
the product ‘ 3α ’ for its Introduction and Growth phase:
Introduction Growth
Weeks 1 - 10 11 - 30
Number of units Produced and Sold 2,200 5,500 8,250
Selling Price per unit (`) 750 600 525
Variable Cost per unit (`) 375 300 300
Contribution per unit (`) 375 300 225
Total Contribution (`) 8,25,000 16,50,000 18,56,250
Required
(i) Prepare the total contribution statement for each of the remaining two phases of the
product’s life cycle.
(ii) Discuss Pricing Strategy of the product ‘ 3α ’.
(iii) Find possible reasons for the changes in cost during the life cycle of the product ‘ 3α ’.
Note: Ignore the time value of money.
© The Institute of Chartered Accountants of India

PAPER – 5 : ADVANCED MANAGEMENT ACCOUNTING 3
Value Chain Analysis – Primary Activity
3. Sinopec Ltd. is engaged in business of manufacturing branded readymade garments. It
has a single manufacturing facility at Surat. Raw material is supplied by various suppliers.
Majority of its revenue comes from export to Euro Zone and US. To strengthen its position
further in the Global Market, it is planning to enhance quality and provide assurance
through long term warranty.
For the coming years company has set objective to reduce the quality costs in each of the
primary activities in its value chain.
Required
State the primary activities as per Porter’s Value Chain Analysis in the value chain of
Sinopec Ltd with brief description.
Just in Time
4. YP Ltd. (YPL) manufactures and sells one product called “YEIA”. Managing Director is not
happy with its current purchasing and production system. There has been considerable
discussion at the corporate level as to use of ‘Just in Time’ system for “YEIA”. As per the
opinion of managing director of YPL Ltd. - “Just-in-time system is a pull system, which
responds to demand, in contrast to a push system, in which stocks act as buffers between
the different elements of the system such as purchasing, production and sales. By using
Just in Time system, it is possible to reduce carrying cost as well as other overheads” .
YPL is dependent on contractual labour which has efficiency of 95%, for its production.
The labour has to be paid for minimum of 4,000 hours per month to which they produce
3,800 standard hours.
For availing services of labour above 4,000 hours in a month, YPL has to pay overtime
rate which is 45% premium to the normal hourly rate of `110 per hour. For avoiding this
overtime payment, YPL in its current production and purchase plan utilizes full available
normal working hours so that the higher inventory levels in the month of lower demand
would be able to meet sales of month with higher demand level. YPL has determined that
the cost of holding inventory is `70 per month for each standard hour of output that is held
in inventory.
YPL has forecast the demand for its products for the first six months of year 2017 as follows:
Month
Demand
(Standard Hrs)
Jan’17 3,150
Feb’17 3,760
Mar’17 4,060
Apr’17 3,350
May’17 3,650
Jun’17 4,830
© The Institute of Chartered Accountants of India

4 FINAL EXAMINATION: NOVEMBER, 2018
Following other information is given:
(a) All other production costs are either fixed or are not driven by labour hours worked .
(b) Production and sales occur evenly during each month and at present there is no stock
at the end of Dec’16.
(c) The labour are to be paid for their minimum contracted hours in each month
irrespective of any purchase and production system.
Required
As a chief accountant, you are requested to comment on managing director’s view.
Break-even Point – Production in Batches
5. Z Ltd. is a leading Home Appliances manufacturer. The company uses just -in- time
manufacturing process, thereby having no inventory. Manufacturing is done in batch size
of 100 units which cannot be altered without significant cost implications. Although the
products are manufactured in batches of 100 units, they are sold as single units at the
market price. Due to fierce competition in the market, the company is forced to follow
market price of each product. The following table provides the financial results of its four
unique products:
Alpha Beta Gamma Theta Total
Sales (units) 2,00,000 2,60,000 1,60,000 3,00,000
(`) (`) (`) (`) (`)
Revenue 26,00,000 45,20,000 42,40,000 32,00,000 145,60,000
Less: Material Cost 6,00,000 18,20,000 18,80,000 10,00,000 53,00,000
Less: Labour Cost 8,00,000 20,80,000 12,80,000 12,00,000 53,60,000
Less: Overheads 8,00,000 7,80,000 3,20,000 12,00,000 31,00,000
Profit / (Loss) 4,00,000 (1,60,000) 7,60,000 (2,00,000) 8,00,000
Since, company is concerned about loss in manufacturing and selling of two products so,
it has approached you to clear picture on its products and costs. You have conducted a
detailed investigation whose findings are below:
The overhead absorption rate of ` 2 per machine hour has been used to allocate overheads
into the above product costs. Further analysis of the overhead cost shows that some of it
is caused by the number of machine hours used, some is caused by the number of batches
produced and some are product specific fixed overheads that would be avoided if the
product were discontinued. Other general fixed overhead costs would be avoided only by
the closure of the factory. Numeric details are summarized below:
` `
Machine hour related………………………………………………………………6,20,000
Batch related………………………………………………………………………..4,60,000
© The Institute of Chartered Accountants of India

PAPER – 5 : ADVANCED MANAGEMENT ACCOUNTING 5
Product specific fixed overhead:
Alpha…………………………………………………10,00,000
Beta…………………………………………………....1,00,000
Gamma………………………………………………. 2,00,000
Theta…………………………………………………. 1,00,000…………. 14,00,000
General fixed overheads…………………………………………………………6,20,000
31,00,000
The other information is as follows:-
Required
(i) Prepare a profitability statement that is more useful for decision making than the profit
statement prepared by Z Ltd.
(ii) Calculate the break- even volume in batches and also in approximate units for Product
‘Alpha’.
Determination of Production Mix/ Production Planning
6. A company is producing three products P, Q & R. Relevant information is given below:
Product P Q R
Raw material per unit (kg) 20 12 30
Machine hours per unit (hours) 3 5 4
Selling price per unit (`) 500 400 800
Maximum limit of production Unit 1,500 1,500 750
Only 9,200 hours are available for production at a cost of `20 per hour and maximum
50,000 kgs. of material @ ` 20 per kg., can be obtained.
(Only product mix quantities are to be shown, calculation of total profit at that product mix not
required to be shown)
Required
On the basis of the above information determine the product-mix to give the highest profit
if at least two products are produced.
Alpha Beta Gamma Theta Total
Machine Hours 4,00,000 3,90,000 1,60,000 6,00,000 15,50,000
Labour Hours 1,00,000 2,60,000 1,60,000 1,50,000 6,70,000
© The Institute of Chartered Accountants of India

6 FINAL EXAMINATION: NOVEMBER, 2018
Pareto Analysis
7. Generation 2050 Technologies Ltd. develops cutting-edge innovations that are powering
the next revolution in mobility and has nine tablet smart phone models currently in the
market whose previous year financial data is given below:
Model Sales (`’000) Profit-Volume (PV) Ratio
Tab - A001 5,100 3.53%
Tab - B002 3,000 23.00%
Tab - C003 2,100 14.29%
Tab - D004 1,800 14.17%
Tab - E005 1,050 41.43%
Tab - F006 750 26.00%
Tab - G007 450 26.67%
Tab - H008 225 6.67%
Tab - I009 75 60.00%
Using the financial data, carry out a Pareto analysis (80/20 rule) of Sales and Contribution.
Discuss your findings with appropriate recommendations.
Budget and Budgetary Control
8. KLM Ltd manufactures and sells a single product and has estimated sales revenue of
`397.80 lacs during the year based on 20% profit on selling price. Each unit of product
requires 6 kg of material W and 3 kg of material X and processing time of 4 hours in
machine shop and 2 hours in assembly shop. Factory overheads are absorbed at a
blanket rate of 20% of direct labour. Variable selling & distribution overheads are ` 6 per
unit sold and fixed selling & distribution overheads are estimated to be `7,20,000.
The other relevant details are as under:
Purchase Price Material W `16 per kg
Materials X `10 per kg
Labour Rate Machine Shop `14 per hour
Assembly Shop `7 per hour
Finished Stock Material W Material X
Opening Stock 25,000 units 75,000 kg 40,000 kg
Closing Stock 30,000 units 80,000 kg 55,000 kg
© The Institute of Chartered Accountants of India

PAPER – 5 : ADVANCED MANAGEMENT ACCOUNTING 7
Required
Calculate
(i) Number of units of product proposed to be sold and selling price per unit.
(ii) Production budget in units.
(iii) Material purchase budget in units.
Standard Costing – Reconciliation of Budgeted and Actual Profit
9. KYC Toys Ltd. manufactures a single product and the standard cost system is followed.
Standard cost per unit is worked out as follows:
`
Materials (10 Kgs. @ `4 per Kg) 40
Labour (8 hours @ `8 per hour) 64
Variable overheads (8 hours @ `3 per hour) 24
Fixed overheads (8 hours @ `3 per hour) 24
Standard Profit 56
Overheads are allocated on the basis of direct labour hours. In the month of April 2018,
there was no difference between the budgeted and actual selling price and there were no
opening or closing stock during the period.
The other details for the month of April 2018 are as under
Budgeted Actual
Production and Sales 2,000 Units 1,800 Units
Direct Materials 20,000 Kgs. @ ` 4 per kg 20,000 Kgs.@ ` 4 per kg
Direct Labour 16,000 Hrs. @ ` 8 per Hr. 14,800 Hrs. @ ` 8 per Hr.
Variable Overheads ` 48,000 ` 44,400
Fixed Overheads ` 48,000 ` 48,000
Required
Reconcile the budgeted and actual profit with the help of var iances according to each of
the following method:
(i) The conventional method
(ii) The relevant cost method assuming that
(a) Materials are scarce and are restricted to supply of 20,000 Kgs. for the period.
(b) Labour hours are limited and available hours are only 16,000 hours for the
period.
(c) There are no scarce inputs.
© The Institute of Chartered Accountants of India

8 FINAL EXAMINATION: NOVEMBER, 2018
Transfer Pricing
10. Divisions X and Y are two divisions in XY Ltd. Division X manufactures a component (X)
which is sold to external customers and also to Division Y.
Details of Division X are as follows:
Market price per component ` 300
Variable cost per component ` 157
Fixed costs per production period ` 20,62,000
Demand from Y Division per production period 20,000 components
Capacity per production period 35,000 components
Division Y assembles a product (Y) which is sold to external customers. Each unit of Y
requires two units of X.
Details of Division Y are as follows:
Selling price per unit `1,200
Variable cost per unit:
(i) Two components from X 2@ transfer price
(ii) Other variable costs per unit ` 375
Fixed costs per production period ` 13,50,000
Demand per production period 10,000 units
Capacity per production period 10,000 units
The Group Transfer Pricing Policy stipulates that
Transfers must be at opportunity cost.
Y must buy the components from X.
X must satisfy the demand from Y before making external sales.
Required
(i) Present figures showing the weighted average transfer price, per component
transferred to Y and the total profits earned by X for each of the following levels of
external demand of X:
External demand = 15,000 components
External demand = 19,000 components
External demand = 35,000 components
(ii) Compute Division Y's profits when Division X has each of the above levels of demand.
(Only relevant figures need to be discussed. A detailed profitability statement for each
situation is not required).
© The Institute of Chartered Accountants of India

PAPER – 5 : ADVANCED MANAGEMENT ACCOUNTING 9
Transportation Problem - Degeneracy
11. A project consists of four (4) major jobs, for which four (4) contractors have submitted
tenders. The tender amounts, in thousands of rupees, are given in the each cell. The initial
solution of the problem obtained by using Vogel’s Approximation Method is given in the
Table below:
Contractors Job P Job Q Job R Job S
A 112.50 100.00 127.50 167.50
B 142.50 105.00 157.50 137.50
C 122.50 130.00 120.00 160.00
D 102.50 112.50 150.00 137.50
Find the assignment, which minimizes the total cost of the project. Each contractor has to
be awarded one job only.
Critical Path Analysis – Missing Figures and Network
12. The number of days of total float (TF), earliest start times (EST) and duration in days are
given for some of the following activities.
Activity TF EST Duration
1–2 0 0 ???
1–3 2 ??? ???
1–4 5 ??? ???
2–4 0 4 ???
2–5 1 ??? 5
3–6 2 12 ???
4–6 0 12 ???
5–7 1 ??? ???
6–7 ??? 23 ???
6–8 2 ??? ???
7–8 0 23 ???
8–9 ??? 30 6
(i) Find??? Figures.
(ii) Draw the network.
1
1
1
1
© The Institute of Chartered Accountants of India
10 FINAL EXAMINATION: NOVEMBER, 2018
(iii) List the paths with their corresponding durations and state when the project can be
completed.
PERT and CPM – Basic Concepts
13. State the validity of following statements along with the reasons:
(i) Two activities have common predecessor and successor activities. So, they can have
common initial and final nodes.
(ii) In respect of any activity whether real or dummy, the terminal node should bear a
number higher than the initial node number.
(iii) The difference between the latest event time and the earliest event time is termed as
free float.
(iv) For every critical activity in a network, the earliest start and the earliest finish time as
well as the latest finish time and the latest start time are the same.
(v) The optimal duration of a project is the minimum time in which it can be completed.
(vi) Resource leveling aims at smoothening of the resource usage rate without changing
the project duration.
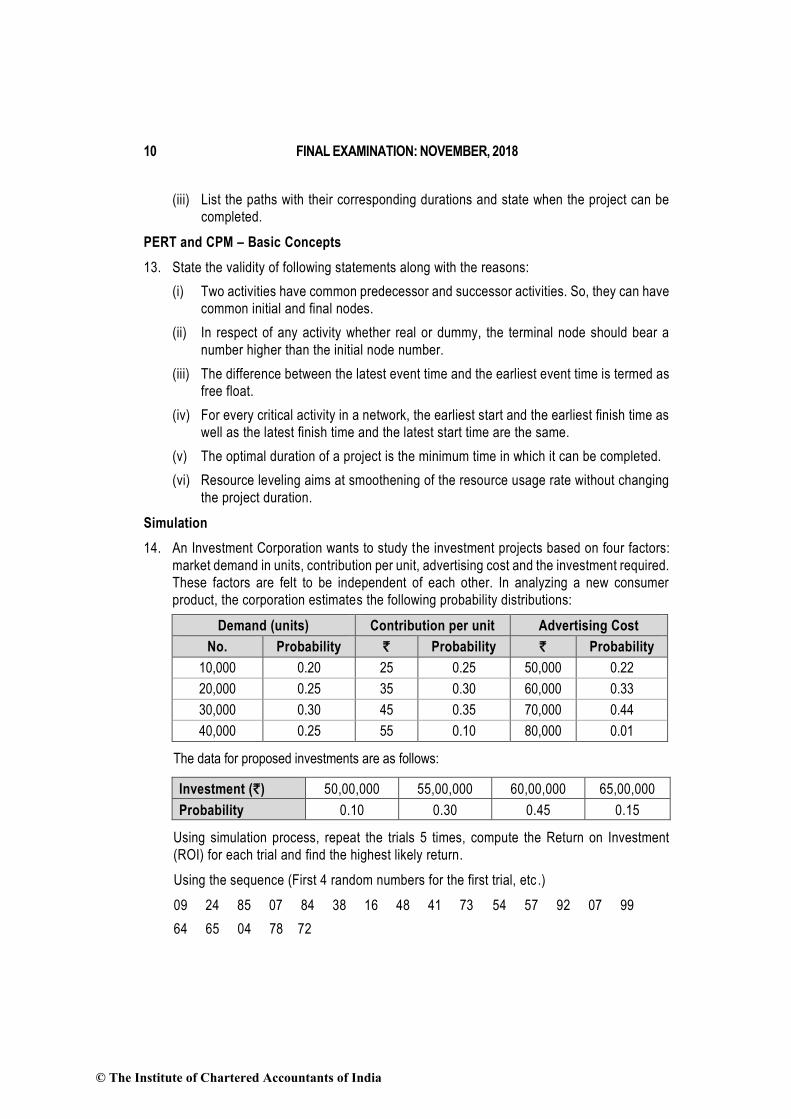
Simulation
14. An Investment Corporation wants to study the investment projects based on four factors:
market demand in units, contribution per unit, advertising cost and the investment required.
These factors are felt to be independent of each other. In analyzing a new consumer
product, the corporation estimates the following probability distributions:
Demand (units) Contribution per unit Advertising Cost
No. Probability ` Probability ` Probability
10,000 0.20 25 0.25 50,000 0.22
20,000 0.25 35 0.30 60,000 0.33
30,000 0.30 45 0.35 70,000 0.44
40,000 0.25 55 0.10 80,000 0.01
The data for proposed investments are as follows:
Investment (`) 50,00,000 55,00,000 60,00,000 65,00,000
Probability 0.10 0.30 0.45 0.15
Using simulation process, repeat the trials 5 times, compute the Return on Investment
(ROI) for each trial and find the highest likely return.
Using the sequence (First 4 random numbers for the first trial, etc .)
09 24 85 07 84 38 16 48 41 73 54 57 92 07 99
64 65 04 78 72
© The Institute of Chartered Accountants of India

PAPER – 5 : ADVANCED MANAGEMENT ACCOUNTING 11
Application of Learning Curve in Standard Costing
15. Aldi International Co. is a multiproduct firm and operates standard costing and budgetary
control system. During the month of June firm launched a new product. An extract from
performance report prepared by Sr. Accountant is as follows:
Particulars Budget Actual
Output 30 units 25 units
Direct Labour Hours 180.74 hrs. 118.08 hrs.
Direct Labour Cost ` 1,19,288 ` 79,704
Sr. Accountant prepared performance report for new product on certain assumptions but
later on he realized that this new product has similarities with other existing product of the
company. Accordingly, the rate of learning should be 80% and that the learning would
cease after 15 units. Other budget assumptions for the new product remain valid.
The original budget figures are based on the assumption that the labour has learning rate
of 90% and learning will cease after 20 units, and thereafter the time per unit will be the
same as the time of the final unit during the learning period, i.e. the 20th unit. The time
taken for 1st unit is 10 hours.
Show the variances that reconcile the actual labour figures with revised budgeted figures
in as much detail as possible.
Note:
The learning index values for a 90% and a 80% learning curve are −0.152 and −0.322 respectively.
[log 2 = 0.3010, log 3 = 0.47712, log 5 = 0.69897, log 7 = 0.8451, antilog of 0.6213 = 4.181, antilog of 0.63096 = 4.275]
Profitability Analysis
16. A company is planning to improve its profit level at least by 10% from the preliminary
budget estimates of a profit of `32,80,000 for the coming year. It has worked out the
following profit improvement plan:
(i) In the year just concluded the sales of the company were 10% of the total market of
12,00,000 units. For the preparation of the original budget estimate, the same market
demand and the same share of market for the company was envisaged. Now it has
been estimated that the total market demand will increase by 18% and the company's
market share will increase to 11% from the present level of 10%.
(ii) The products are sold in two sizes - large and medium. The sales mix of each size
was 50:50 so far. Now it is planned that the sales will be 40% of large and 60% of
medium. The medium packs and large packs have a contribution of ` 10 and ` 8 per
pack respectively. The budget proposes to raise the price in such a manner that the
contribution per pack will increase by ` 0.60 for each size.
© The Institute of Chartered Accountants of India

12 FINAL EXAMINATION: NOVEMBER, 2018
(iii) There will be an additional expenditure on sales promotion worth `78,000.
(iv) The company proposes to save `9,000 by saving on interest cost in the coming year
by better financial management.
Required
Draw a profit improvement plan in financial terms and spell out separately the effect of
various factors on profit.
SUGGESTED ANSWERS/ HINTS
1. (i) Average Non Value Added Time per batch
= Inspection Time + Waiting Time + Move Time
= 1.5 hr. + 6.0 hrs. + 7.5 hrs.
= 15 hrs.
(ii) Average Value Added Time per batch
= Processing Time
= 9 hrs.
(iii) Manufacturing Cycle Efficiency
= ProcessingTime
ProcessingTime + Inspection Time + Waiting Time + Move Time
= 9.0 hrs.
9.0 hrs.+ 1.5 hr.+ 6.0 hrs.+ 7.5 hrs.
= 37.5%
(iv) Manufacturing Cycle Time
= Total Production Time
Units per Batch
= 24 hrs.
60 units
= 0.40 hrs. per unit
2. (i) Total Contribution Statement
Statement Showing ‘Total Contribution’ for remaining two phases
Particulars Maturity Decline
Weeks 31 - 50 51 - 70 71 - 110
Number of units Produced and Sold 22,000 22,000 22,000
© The Institute of Chartered Accountants of India

PAPER – 5 : ADVANCED MANAGEMENT ACCOUNTING 13
Selling Price per unit (`) 450 450 300
Unit Variable Cost (`) 225 188 225
Unit Contribution (`) 225 262 75
Total Contribution (`) 49,50,000 57,64,000 16,50,000
(ii) Pricing Strategy for Product 3α
ORIL is following the skimming price strategy that’s why it has planned to launch the
product 3α initially with high price tag.
A skimming strategy may be recommended when a firm has incurred large sums of
money on research and development for a new product.
In the question, ORIL has incurred a huge amount on research and development.
Also, it is very difficult to start with a low price and then raise the price. Raising a low
price may annoy potential customers.
Price of the product 3α is decreasing gradually stage by stage. This is happening
because ORIL wants to tap the mass market by lowering the price.
(iii) Possible reasons for the changes in cost during the life cycle of the product ‘ 3α ’
Product life cycle costing involves tracing of costs and revenues of each product over
several calendar periods throughout their entire life cycle. Possible reasons for the
changes in cost during the life cycle of the product are as follows:
ORIL is expecting reduction in unit cost of the product 3α over the life of product as a
consequence of economies of scale and learning / experience curves.
Learning effect may be the possible reason for reduction in per unit cost if the process
is labour intensive. When a new product or process is started, performance of worker
is not at its best and learning phenomenon takes place. As the experience is gained,
the performance of worker improves, time taken per unit reduces and thus his
productivity goes up. The amount of improvement or experience gained is reflected
in a decrease in cost.
Till the stage of maturity, ORIL is in the expansion mode. The ORIL may be able to
take advantages of quantity discount offered by suppliers or may negotiate the price
with suppliers.
Product 3α has the least variable cost `188 in last phase of maturity stage; this is
because a product which is in the mature stage may require less marketing support
than a product which is in the growth stage so, there is a saving of marketing cost per
unit.
Again, the cost per unit of the product 3α jumps to `225 in decline stage. As soon as
the product reaches its decline stage, the need or demand for the product disappear
and quantity discount may not be available. Even ORIL may have to incur heavy
marketing expenses for stock clearance.
© The Institute of Chartered Accountants of India

14 FINAL EXAMINATION: NOVEMBER, 2018
Workings:
Statement of Cumulative Sales along with Sales Price and Variable Cost
Weeks Demand per week
Total Sales
Cumulative Sales
Selling Price
per unit (`) Variable Cost
per unit (`)
1 - 10 220 2,200 2,200 750 375
11 - 20 550 5,500 7,700 600 300
21 - 30 825 8,250 15,950 525 300
31 - 50 1,100 22,000 37,950 450 225
51 - 70 1,100 22,000 59,950 450 188
71 - 80 880 8,800 68,750 300 225
81 - 90 660 6,600 75,350 300 225
91 - 100 440 4,400 79,750 300 225
101 - 110 220 2,200 81,950 300 225
3. Primary activities are the activities that are directly involved in transforming inputs into
outputs and delivery and after-sales support to output. Following are the primary activities
in the value chain of Sinopec Ltd:
(i) Inbound Logistics: These activities are related to the material handling and
warehousing. It also covers transporting raw material from the supplier to the place
of processing inside the factory.
(ii) Operations: These activities are directly responsible for the transformation of raw
material into final product for the delivery to the consumers.
(iii) Outbound Logistics: These activities are involved in movement of finished goods to
the point of sales. Order processing and distribution are major part of these activities.
(iv) Marketing and Sales: These activities are performed for demand creation and
customer solicitation. Communication, pricing and channel management are major
part of these activities.
(v) Service: These activities are performed after selling the goods to the consumers.
Installation, repair and parts replacement are some examples of these activities .
4. Workings
Statement Showing ‘Inventory Holding Cost’ under Current System
Particulars Jan Feb Mar Apr May Jun
Opening Inventory* (A) --- 650 690 430 880 1,030
Add: Production* 3,800 3,800 3,800 3,800 3,800 3,800
Less: Demand* 3,150 3,760 4,060 3,350 3,650 4,830
Closing Inventory* (B) 650 690 430 880 1,030 -
© The Institute of Chartered Accountants of India

PAPER – 5 : ADVANCED MANAGEMENT ACCOUNTING 15
Average Inventory A B
2
325 670 560 655 955 515
Inventory Holding Cost @ `70 22,750 46,900 39,200 45,850 66,850 36,050
(*) in terms of standard labour hours
Inventory Holding Cost for the six months = `2,57,600
(` 22,750 + ` 46,900 + ` 39,200 +
` 45,850 + ` 66,850 + ` 36,050)
Calculation of Relevant Overtime Cost under JIT System
Particulars Jan Feb Mar Apr May Jun
Demand* 3,150 3,760 4,060 3,350 3,650 4,830
Production* 3,150 3,760 4,060 3,350 3,650 4,830
Normal Availablility* 3,800 3,800 3,800 3,800 3,800 3,800
Shortage (=Overtime*) (C) --- --- 260 ---- ---- 1,030
Actual Overtime Hours
C
0.95 --- --- 273.68 ---- ---- 1,084.21
Overtime Payment @ `159.50 [110+45%]
--- --- 43,652 ---- ---- 1,72,931
(*) in terms of standard labour hours
Total Overtime payment = ` 2,16,583
(` 43,652 + ` 1,72,931)
Therefore, saving in JIT system = ` 2,57,600 – ` 2,16,583 = ` 41,017
Comments
Though YPL is saving `41,017 by changing its production system to Just-in-time but it has
to consider other factors as well before taking any final call which are as follows:-
(i) YPL has to ensure that it receives materials from its suppliers on the exact date and
at the exact time when they are needed. Credentials and reliability of supplier must
be thoroughly checked.
(ii) To remove any quality issues, the engineering staff must visit supplier’s sites and
examine their processes, not only to see if they can reliably ship high -quality parts
but also to provide them with engineering assistance to bring them up to a higher
standard of product.
(iii) YPL should also aim to improve quality at its process and design levels with the
purpose of achieving “Zero Defects” in the production process .
(iv) YPL should also keep in mind the efficiency of its work force. YPL must ensure that
labour’s learning curve has reached at steady rate so that they are capable of
© The Institute of Chartered Accountants of India

16 FINAL EXAMINATION: NOVEMBER, 2018
performing a variety of operations at effective and efficient manner. The workforce
must be completely retrained and focused on a wide range of activities.
5. (i) Statement of Profitability of Z Ltd.
Products (Amount in `)
Alpha Beta Gamma Theta Total
Sales 26,00,000 45,20,000 42,40,000 32,00,000 1,45,60,000
Direct Materials 6,00,000 18,20,000 18,80,000 10,00,000 53,00,000
Direct Wages 8,00,000 20,80,000 12,80,000 12,00,000 53,60,000
Overheads (W.N.2):
Machine Related 1,60,000 1,56,000 64,000 2,40,000 6,20,000
Batch Related 1,00,000 1,30,000 80,000 1,50,000 4,60,000
Contribution 9,40,000 3,34,000 9,36,000 6,10,000 28,20,000
Product Specific Fixed Overheads
10,00,000 1,00,000 2,00,000 1,00,000 14,00,000
Gross Profit (60,000) 2,34,000 7,36,000 5,10,000 14,20,000
General Fixed Overheads 6,20,000
Profit 8,00,000
(ii) Break-even Point
Total Sale Value of Product ‘Alpha’ = ` 26,00,000
Total Contribution of Product ‘Alpha’ = ` 9,40,000
Specific Fixed Overheads (Product Alpha) = ` 10,00,000
Break-even Sales (`) = Specific Fixed Cost
xTotal Sales ValueTotal Contribution
= 10,00,000
x 26,00,0009,40,000
` `
`
= `27,65,957.45
Break-even Sales (units) = 27,65,957.45
13.00
`
` = 2,12,766 units
However, production must be done in batches of 100 units. Therefore, 2,128 batches
are required for break even. Due to the production in batches, 34 units (2,128 batches
× 100 units – 2,12,766 units) would be produced extra. These 34 units would add
extra cost `282.20 (34 units × `8.3*). Accordingly, break-even units as calculated
above will increase by 22 units282.20
13.00
`
` .
© The Institute of Chartered Accountants of India

PAPER – 5 : ADVANCED MANAGEMENT ACCOUNTING 17
(*) 6,00,000 8,00,000 1,60,000 1,00,000
2,00,000 units
` ` ` `
Break-even units of product ‘Alpha’ is 2,12,788 units (2,12,766 units + 22 units).
Workings:
W.N.-1
Calculation Showing Overhead Rates
Overhead’s Related Factors
Overhead
Cost (`)
[a]
Total No. of
Units of Factors
[b]
Overhead Rate
(`)
[a] / [b]
Machining Hours 6,20,000 15,50,000 hrs. 0.40
Batch Production 4,60,000 9,200 batches 50.00
W.N.-2
Statement Showing - Overhead Costs Related to Product
Particulars Alpha Beta Gamma Theta
Machining hrs. related overheads
` 1,60,000
(4,00,000 hrs × `0.40)
` 1,56,000
(3,90,000 hrs × ` 0.40)
` 64,000
(1,60,000 hrs × ` 0.40)
` 2,40,000
(6,00,000 hrs × ` 0.40)
Batch related overheads
`1,00,000
(2,000 batches × ` 50)
`1,30,000
(2,600 batches × ` 50)
`80,000
(1,600 batches × ` 50)
`1,50,000
(3,000 batches × ` 50)
6. Computation of Contribution per Key Factor(s) for Various Products
Particulars Products
P Q R
Selling Price p. u. (`) 500 400 800
Variable Cost p. u. (`):
Material 400
(`20 × 20 Kg.)
240
(`20 × 12 Kg.)
600
(`20 × 30 Kg.)
Machine Charge 60
(`20 × 3 hrs)
100
(`x20 × 5 hrs)
80
(`20 × 4 hrs)
Total Variable Cost p. u. (`) 460 340 680
Contribution p. u. (`) 40 60 120
Ranking III II I
Requirement of Material (Kg.) 20 12 30
© The Institute of Chartered Accountants of India

18 FINAL EXAMINATION: NOVEMBER, 2018
Contribution per Kg. (`) 2.00 5.00 4.00
Ranking III I II
Requirement of Machine Hours
(Hrs.)
3 5 4
Contribution per hour (`) 13.33 12.00 30.00
Ranking II III I
It is clear from the above ranking(s):-
I. Contribution per Unit is maximum in case of product Q & R.
II. Contribution per Kg. of Raw Material also maximum in case of product Q & R.
III. Contribution per Machine Hour is maximum in case of product P & R.
So product R is common in all cases and priority shall be given for production of ‘R’.
Balance resources should be divided between other two products P & Q.
Statement Showing Balance Resources for Product P & Q
Resources Maximum Availability
(a)
Maximum Production R
(b)
Consumption of Resources
p.u.
(c)
Total
Cons.
(d) = (b) x (c)
Balance
(a) - (d)
Material 50,000 Kg. 750 30 Kg. 22,500 Kg. 27,500 Kg.
Machine Hrs. 9,200 Hrs. 750 4 Hrs. 3,000 Hrs. 6,200 Hrs.
The production of P & Q may be calculated with the help of following equations by utilizing
balance resources: -
20P + 12Q = 27,500 …(i)
3P + 5Q = 6,200 …(ii)
Then,
30P + 18Q = 41,250
equation (i) multiplied by 1.5
30P + 50Q = 62,000
equation (ii) multiplied by 10
- - -
-32Q = -20,750
Q = 648.43 i.e. 648 units
Putting the value of Y in equation (ii)
3P + (5 × 648) = 6,200
Or 3P = 2,960
Or P = 986 units
© The Institute of Chartered Accountants of India

PAPER – 5 : ADVANCED MANAGEMENT ACCOUNTING 19
So the of Product Mix is
P= 986 units; Q = 648 units; R = 750 units
7. Statement Showing ‘Pareto Analysis’
Model Sales
(`’000)
% of Total Sales
Cumulative
Total
Model Cont.
(`’000)
% of
Total Cont.
Cumulative
Total %
Pareto Analysis Sales Pareto Analysis Contribution
A001 5,100 35.05% 35.05% B002 690 30.87% 30.87%
B002 3,000 20.62% 55.67% E005 435 19.47%* 50.34%
C003 2,100 14.43% 70.10% C003 300 13.42% 63.76%
D004 1,800 12.37% 82.47% D004 255 11.41% 75.17%
E005 1,050 7.22% 89.69% F006 195 8.73%* 83.90%
F006 750 5.15% 94.84% A001 180 8.05% 91.95%
G007 450 3.09% 97.93% G007 120 5.37% 97.32%
H008 225 1.55% 99.48% I009 45 2.01% 99.33%
I009 75 0.52% 100.00% H008 15 0.67% 100.00%
14,550 100.00% 2,235 100.00%
(*) Rounding - off difference adjusted.
Diagram Showing ‘Sales and Contribution’ (NOT COMPULSORY)
This Diagram is shown for better understanding of the concept.
© The Institute of Chartered Accountants of India

20 FINAL EXAMINATION: NOVEMBER, 2018
Recommendations
Pareto Analysis is a rule that recommends focus on most important aspects of the decision
making in order to simplify the process of decision making. The very purpose of th is
analysis is to direct attention and efforts of management to the product or area where best
returns can be achieved by taking appropriate actions.
Pareto Analysis is based on the 80/20 rule which implies that 20% of the products account
for 80% of the revenue. But this is not the fixed percentage rule; in general business sense
it means that a few of the products, goods or customers may make up most of the value
for the firm.
In present case, five models namely A001, B002, C003, D004 account for 80% o f total
sales where as 80% of the company’s contribution is derived from models B002, E005,
C003, D004 and F006.
Models B002 and E005 together account for 50.34% of total contribution but having only
27.84% share in total sales. So, these two models are the key models and should be the
top priority of management. Boths C003 and D004 are among the models giving 80% of
total contribution as well as 80% of total sales so; they can also be clubbed with B002 and
E005 as key models. Management of the company should allocate maximum resources
to these four models.
Model F006 features among the models giving 80%of total contribution with relatively lower
share in total sales. Management should focus on its promotional activities.
Model A001 accounts for 35.05% of total sales with only 8.05% share in total contribution.
Company should review its pricing structure to enhance its contribution.
Models G007, H008 and I009 have lower share in both total sales as well as contribution.
Company can delegate the pricing decision of these models to the lower levels of
management, thus freeing themselves to focus on the pricing decisions for key models.
8 (i) Workings:
Statement Showing Total Variable Cost for the year
Particulars Amount
(`)
Estimated Sales Revenue 3,97,80,000
Less: Desired Profit Margin on Sale @ 20% 79,56,000
Estimated Total Cost 3,18,24,000
Less: Fixed Selling and Distribution Overheads 7,20,000
Total Variable Cost 3,11,04,000
© The Institute of Chartered Accountants of India

PAPER – 5 : ADVANCED MANAGEMENT ACCOUNTING 21
Statement Showing Variable Cost per unit
Particulars Variable Cost p.u.
(`)
Direct Materials:
W: 6 Kg. @ `16 per Kg. 96
X: 3 Kg. @ `10 per Kg. 30
Labour Cost:
Machine Shop: 4 hrs. @ `14 per hour 56
Assembly Shop: 2 hrs. @ `7 per hour 14
Factory Overheads: 20% of (`56 + `14) 14
Variable Selling & Distribution Expenses 6
Total Variable Cost per unit 216
Number of Units Sold = Total Variable Cost / Variable Cost per unit
= `3,11,04,000 / `216
= 1,44,000 units
Selling Price per unit = Total Sales Value / Number of Units Sold
= `3,97,80,000 / 1,44,000 units
= `276.25
(ii) Production Budget (units)
Particulars Units
Budgeted Sales 1,44,000
Add: Closing Stock 30,000
Total Requirements 1,74,000
Less: Opening Stock 25,000
Required Production 1,49,000
(iii) Materials Purchase Budget (Kg.)
Particulars Material Material
W X
Requirement for Production 8,94,000 4,47,000
(1,49,000 units × 6 Kg.) (1,49,000 units × 3 Kg.)
Add: Desired Closing Stock 80,000 55,000
Total Requirements 9,74,000 5,02,000
Less: Opening Stock 75,000 40,000
Quantity to be purchased 8,99,000 4,62,000
© The Institute of Chartered Accountants of India

22 FINAL EXAMINATION: NOVEMBER, 2018
9. COMPUTATION OF VARIANCES
Material Usage Variance = Standard Price × (Standard Quantity – Actual Quantity)
= `4.00 × (18,000* Kgs. – 20,000 Kgs.)
= ` 8,000 (A)
*20,000 Kgs.
1,800 units2,000 units
Labour Efficiency Variance = Standard Rate × (Standard Hours – Actual Hours)
= `8.00 × (14,400* hrs. – 14,800 hrs.)
= `3,200 (A)
*16,000 hrs.
1,800 units2,000 units
Variable Overhead Efficiency Variance
= Standard Variable Overheads for Production –
Budgeted Variable Overheads for Actual hours
= (14,400 hrs. × Rs.3.00) – (`3.00 × 14,800 hrs.)
= `1,200 (A)
Fixed Overhead Volume Variance
= Absorbed Fixed Overheads – Budgeted Fixed
Overheads
= (14,400 hrs. × `3.00) – (16,000 hrs. × `3.00)
= `4,800 (A)
Sales Margin Volume Variance
= Standard Margin – Budgeted Margin
= (1,800 units × `56.00) – (2,000 units × `56.00)
= `11,200 (A)
Sales Contribution Volume Variance
= Standard Contribution – Budgeted Contribution
= (1,800 units × `80.00) – (2,000 units × `80.00)
= `16,000 (A)
© The Institute of Chartered Accountants of India
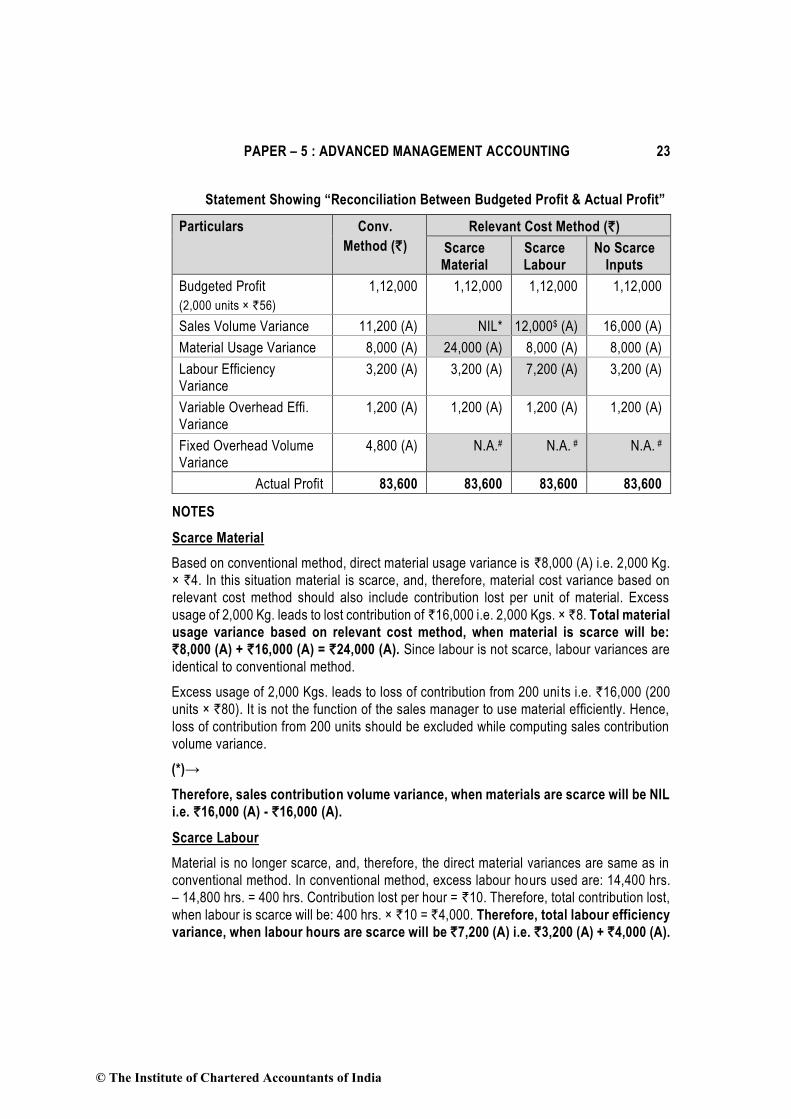
PAPER – 5 : ADVANCED MANAGEMENT ACCOUNTING 23
Statement Showing “Reconciliation Between Budgeted Profit & Actual Profit”
Particulars Conv.
Method (`)
Relevant Cost Method (`)
Scarce Material
Scarce Labour
No Scarce Inputs
Budgeted Profit
(2,000 units × `56)
1,12,000 1,12,000 1,12,000 1,12,000
Sales Volume Variance 11,200 (A) NIL* 12,000$ (A) 16,000 (A)
Material Usage Variance 8,000 (A) 24,000 (A) 8,000 (A) 8,000 (A)
Labour Efficiency Variance
3,200 (A) 3,200 (A) 7,200 (A) 3,200 (A)
Variable Overhead Effi. Variance
1,200 (A) 1,200 (A) 1,200 (A) 1,200 (A)
Fixed Overhead Volume Variance
4,800 (A) N.A.# N.A. # N.A. #
Actual Profit 83,600 83,600 83,600 83,600
NOTES
Scarce Material
Based on conventional method, direct material usage variance is `8,000 (A) i.e. 2,000 Kg.
× `4. In this situation material is scarce, and, therefore, material cost variance based on
relevant cost method should also include contribution lost per unit of material. Excess
usage of 2,000 Kg. leads to lost contribution of `16,000 i.e. 2,000 Kgs. × `8. Total material
usage variance based on relevant cost method, when material is scarce will be:
`8,000 (A) + `16,000 (A) = `24,000 (A). Since labour is not scarce, labour variances are
identical to conventional method.
Excess usage of 2,000 Kgs. leads to loss of contribution from 200 uni ts i.e. `16,000 (200
units × `80). It is not the function of the sales manager to use material efficiently. Hence,
loss of contribution from 200 units should be excluded while computing sales contribution
volume variance.
(*)→
Therefore, sales contribution volume variance, when materials are scarce will be NIL
i.e. `16,000 (A) - `16,000 (A).
Scarce Labour
Material is no longer scarce, and, therefore, the direct material variances are same as in
conventional method. In conventional method, excess labour hours used are: 14,400 hrs.
– 14,800 hrs. = 400 hrs. Contribution lost per hour = `10. Therefore, total contribution lost,
when labour is scarce will be: 400 hrs. × `10 = `4,000. Therefore, total labour efficiency
variance, when labour hours are scarce will be `7,200 (A) i.e. `3,200 (A) + `4,000 (A).
© The Institute of Chartered Accountants of India

24 FINAL EXAMINATION: NOVEMBER, 2018
Excess usage of 400 hrs. leads to loss of contribution from 50 units i.e. `4,000 (50 units ×
`80). It is not the function of the sales manager to use labour hours efficiently. Hence, loss
of contribution from 50 units should be excluded while computing sales contribution volume
Variance.
($)→
Therefore, sales contribution volume variance, when labour hours are Scarce will be
`12,000 (A) i.e. `16,000 (A) - `4,000 (A).
Fixed Overhead Volume Variance
(#) →
The fixed overhead volume variance does not arise in marginal costing system. In
absorption costing system, it represents the value of the under or over absorbed fixed
overheads due to change in production volume. When marginal costing is in use there is
no overhead volume variance, because marginal costing does not absorb fixed overheads.
10. (i) Computation of Weighted Average Transfer Price
Particulars External Demand 15,000
Components
External Demand 19,000
Components
External Demand
35,000
Components
Component’s Transfer Price (Base)
Variable Cost Variable Cost plus Opportunity Cost
for 4,000 Components
Variable Cost plus Opportunity Cost for 20,000 Components
Variable Cost `157.00 `157.00 `157.00
Opportunity Cost
0 `28.60
4,000× 143
20,000
`
`143.00
20,000× 143
20,000
`
Transfer Price `157.00 `185.60 `300.00
Opportunity Cost for a Component is the Contribution forgone by not Selling it to the
market.
Contribution = Market Selling Price – Variable Cost
= `300 – `157 = `143
Statement Showing Profitability of Division- X
Particulars External Demand 15,000
Components
(`)
External Demand 19,000
Components
(`)
External Demand 35,000
Components
(`)
Sales :
Division-Y 31,40,000 37,12,000 60,00,000
© The Institute of Chartered Accountants of India

PAPER – 5 : ADVANCED MANAGEMENT ACCOUNTING 25
(`157 × 20,000) (`185.60 × 20,000) (`300 × 20,000)
Market 45,00,000 (`300 × 15,000)
45,00,000 (`300 × 15,000)
45,00,000 (`300 × 15,000)
Total Revenue 76,40,000 82,12,000 1,05,00,000
Less: Variable Cost (`157 × 35,000)
54,95,000 54,95,000 54,95,000
Less: Fixed Cost 20,62,000 20,62,000 20,62,000
Profit 83,000 6,55,000 29,43,000
(ii) Statement Showing Profitability of Division- Y
Particulars External Demand 15,000
Components
(`)
External Demand 19,000
Components
(`)
External Demand 35,000
Components
(`)
Selling Price per unit 1,200.00 1,200.00 1,200.00
Less: Variable Cost per unit:
314.00
(`157 × 2)
371.20
(`185.60 × 2)
600.00
(`300 × 2)
Component –X
Others 375.00 375.00 375.00
Contribution per unit 511.00 453.80 225.00
No. of units 10,000 10,000 10,000
Total Contribution 51,10,000 45,38,000 22,50,000
Less: Fixed Cost 13,50,000 13,50,000 13,50,000
Profit 37,60,000 31,88,000 9,00,000
11.
Once the initial basic feasible solution is done, we have to do the optimality test. If it satisfy
the condition that number of allocation is equal to m+n-1 where m= number of rows, n=
number of columns. If allocation is less than m+n-1, then the problem shows degenerate
situation. In that case we have to allocate an infinitely small quantity (e) in least cost and
independent cell. Independent cells in Transportation Problems mean the cells which do not
form a closed loop with occupied cells.
The table obtained after using VAM contains 4 occupied cells against the required number
of 4 + 4 – 1 = 7, hence the solution is degenerate.
To remove degeneracy, a letter ‘e’ is placed in three independent cells. The problem for
test of optimality is reproduced in table below:
© The Institute of Chartered Accountants of India

26 FINAL EXAMINATION: NOVEMBER, 2018
Contractors Job P Job Q Job R Job S
A 112.50 100.00 127.50 167.50
B 142.50 105.00 157.50 137.50
C 122.50 130.00 120.00 160.00
D 102.50 112.50 150.00 137.50
Alternatively, ‘e’ can also be allocated to cell C42 instead of C11.
Now total number of allocations become equal to m + n -1 i.e. 7. This solution is tested
for optimality.
(ui + vj) Matrix for Allocated / Unallocated Cells
ui
112.50 100.00 110.00 167.50 0
117.50 105.00 115.00 172.50 5.00
122.50 110.00 120.00 177.50 10.00
102.50 90.00 100.00 157.50 -10.00
vj 112.50 100.00 110.00 167.50
Now we calculate ij = Cij – (ui + vj) for non basic cells which are given in the table below-
ij Matrix
17.50
25.00 42.50 -35.00
20.00 -17.50
22.50 50.00 -20.00
1
1
1
1 e e
e
© The Institute of Chartered Accountants of India

PAPER – 5 : ADVANCED MANAGEMENT ACCOUNTING 27
Since all values of ij are not positive, the solution given above is not optimal. Let us
include the cell with highest negative ij which is C24 as a basic cell and try to improve the
solution. The reallocated solution is given below which is tested for optimality -
e
e
+1
1
-1
1
-1
+1
e 1
1
Revised allocations (improved initial solution) are as follows-
Contractors Job P Job Q Job R Job S
A 112.50 100.00 127.50 167.50
B 142.50 105.00 157.50 137.50
C 122.50 130.00 120.00 160.00
D 102.50 112.50 150.00 137.50
Again there is a situation of degenracy to remove this situation a new ‘e’ has been
allocated to least cost independent cell C22.
(ui + vj) Matrix for Allocated / Unallocated Cells
ui
112.50 100.00 110.00 132.50 0
117.50 105.00 115.00 137.50 5.00
1
e
1
1
e 1
e
© The Institute of Chartered Accountants of India

28 FINAL EXAMINATION: NOVEMBER, 2018
122.50 110.00 120.00 142.50 10.00
102.50 90.00 100.00 122.50 -
10.00
vj 112.50 100.00 110.00 132.50
Now we calculate ij = Cij – (ui + vj) for non basic cells which are given in the table below-
ij Matrix
17.50 35.00
25.00 42.50
20.00 17.50
22.50 50.00 15.00
Since all the entries in the above ij Matrix table are non-negative, this solution is optimal.
The optimal assignment is given below-
Contractor Job Cost of Project
A Q 100.00
B S 137.50
C R 120.00
D P 102.50
Total 460.00
12. (i) Calculation of Missing Figures
Statement Showing Calculation of Missing Figures
Activity Duration
EST EFT LST LFT Total
Float
Dij Ei Ei + Dij Lj − Dij Lj LST− EST
1–2 4 0 4 0 4 0
1–3 12 0 12 2 14 2
1–4 7 0 7 5 12 5
2–4 8 4 12 4 12 0
2–5 5 4 9 5 10 1
3–6 9 12 21 14 23 2
4–6 11 12 23 12 23 0
5–7 13 9 22 10 23 1
© The Institute of Chartered Accountants of India

PAPER – 5 : ADVANCED MANAGEMENT ACCOUNTING 29
Activity Duration
EST EFT LST LFT Total
Float
Dij Ei Ei + Dij Lj − Dij Lj LST− EST
6–7 0 23 23 23 23 0
6–8 5 23 28 25 30 2
7–8 7 23 30 23 30 0
8–9 6 30 36 30 36 0
(ii) The Network for the given problem:
(iii) Paths with their corresponding durations
The Various Paths in the Network are:
1–2–4–6–7–8–9 with Duration 36 Days
1–2–5–7–8–9 with Duration 35 Days
1–3–6–7–8–9 with Duration 34 Days
1–2–4–6–8–9 with Duration 34 Days
1–3–6–8–9 with Duration 32 Days
1–4–6–7–8–9 with Duration 31 Days
1–4–6–8–9 with Duration 29 Days
The Critical Path is 1–2–4–6–7–8–9 with Duration 36 Days.
13. (i) Invalid
Reason: As per the rules of network construction, parallel activities between two
events, without intervening events, are prohibited. Dummy activities are needed when
two or more activities have same initial and terminal events. Dummy activities do not
consume time or resources.
© The Institute of Chartered Accountants of India

30 FINAL EXAMINATION: NOVEMBER, 2018
(ii) Valid
Reason: As per the conventions adopted in drawing networks, the head event or
terminal node always has a number higher than that of initial node or tail event.
(iii) Invalid
Reason: The difference between the latest event time and the earliest event time is
termed as slack of an event. Free float is determined by subtracting head event slack
from the total float of an activity.
(iv) Invalid
Reason: For every critical activity in a network, the earliest start time and the latest
start time is same and also the earliest finish time and the latest finish time is same.
(v) Invalid
Reason: The optimum duration is the time period in which the total cost of the project
is minimum.
(vi) Valid
Reason: Resource leveling is a network technique used for reducing the requirement
of a particular resource due to its paucity or insufficiency within a constraint on the
project duration. The process of resource leveling utilize the large floats available on
non-critical activities of the project and cuts down the demand of the resource.
14. Allocation of Random Numbers
Demand (units)
Units Probability Cumulative Probability
Random Nos.
10,000 0.20 0.20 00 – 19
20,000 0.25 0.45 20 – 44
30,000 0.30 0.75 45 – 74
40,000 0.25 1.00 75 − 99
Contribution per unit
` Probability Cumulative Probability
Random Nos.
25 0.25 0.25 00 – 24
35 0.30 0.55 25 – 54
45 0.35 0.90 55 – 89
55 0.10 1.00 90 − 99
© The Institute of Chartered Accountants of India
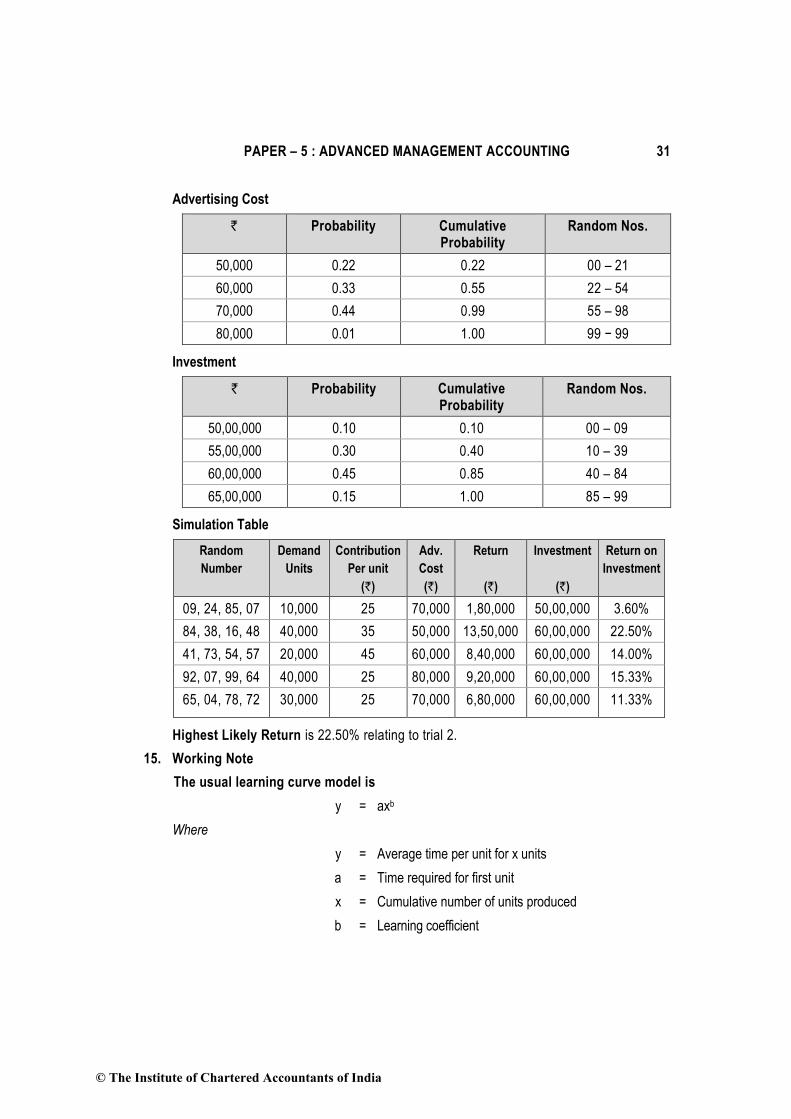
PAPER – 5 : ADVANCED MANAGEMENT ACCOUNTING 31
Advertising Cost
` Probability Cumulative Probability
Random Nos.
50,000 0.22 0.22 00 – 21
60,000 0.33 0.55 22 – 54
70,000 0.44 0.99 55 – 98
80,000 0.01 1.00 99 − 99
Investment
` Probability Cumulative Probability
Random Nos.
50,00,000 0.10 0.10 00 – 09
55,00,000 0.30 0.40 10 – 39
60,00,000 0.45 0.85 40 – 84
65,00,000 0.15 1.00 85 – 99
Simulation Table
Random
Number
Demand
Units
Contribution
Per unit
(`)
Adv.
Cost
(`)
Return
(`)
Investment
(`)
Return on
Investment
09, 24, 85, 07 10,000 25 70,000 1,80,000 50,00,000 3.60%
84, 38, 16, 48 40,000 35 50,000 13,50,000 60,00,000 22.50%
41, 73, 54, 57 20,000 45 60,000 8,40,000 60,00,000 14.00%
92, 07, 99, 64 40,000 25 80,000 9,20,000 60,00,000 15.33%
65, 04, 78, 72 30,000 25 70,000 6,80,000 60,00,000 11.33%
Highest Likely Return is 22.50% relating to trial 2.
15. Working Note
The usual learning curve model is
y = axb
Where
y = Average time per unit for x units
a = Time required for first unit
x = Cumulative number of units produced
b = Learning coefficient
© The Institute of Chartered Accountants of India

32 FINAL EXAMINATION: NOVEMBER, 2018
W.N.1
Time required for first 15 units based on revised learning curve of 80% (when the time
required for the first unit is 10 hours)
y = 10 × (15) –0.322
log y = log 10 − 0.322 × log 15
log y = log 10 − 0.322 × log (5 × 3)
log y = log 10 − 0.322 × [log 5 + log 3]
log y = 1 − 0.322 × [0.69897 + 0.47712]
log y = 0.6213
y = antilog of 0.6213
y = 4.181 hours
Total time for 15 units = 15 units × 4.181 hours
= 62.72 hours
Time required for first 14 units based on revised learning curve of 80% (when the time
required for the first unit is 10 hours)
y = 10 × (14) –0.322
log y = log10 − 0.322 × log 14
log y = log10 − 0.322 × log (2 × 7)
log y = log10 − 0.322 × [log 2 + log 7]
log y = 1 − 0.322 × [0.3010 + 0.8451]
log y = 0.63096
y = antilog of 0.63096
y = 4.275 hrs
Total time for 14 units = 14 units × 4.275 hrs
= 59.85 hrs
Time required for 25 units based on revised learning curve of 80% (when the time required
for the first unit is 10 hours)
Total time for first 15 units = 62.72 hrs
Total time for next 10 units = 28.70 hrs [(62.72 − 59.85) hours × 10 units]
Total time for 25 units = 62.72 hrs + 28.70 hrs
= 91.42 hrs
© The Institute of Chartered Accountants of India

PAPER – 5 : ADVANCED MANAGEMENT ACCOUNTING 33
W.N.2
Computation of Standard and Actual Rate
Standard Rate = 1,19,288
180.74 hrs.
`
= ` 660.00 per hr.
Actual Rate = 79,704
118.08 hrs.
`
= ` 675.00 per hr.
W.N.3
Computation of Variances
Labour Rate Variance = Actual Hrs × (Std. Rate – Actual Rate)
= 118.08 hrs × (`660.00 – `675.00) = `1,771.20 (A)
Labour Efficiency Variance = Std. Rate × (Std. Hrs – Actual Hrs)
= `660 × (91.42 hrs – 118.08 hrs)
= `17,595.60 (A)
Statement of Reconciliation (Actual Figures Vs Budgeted Figures)
Particulars `
Actual Cost 79,704.00
Less: Labour Rate Variance (Adverse) 1,771.20
Less: Labour Efficiency Variance (Adverse) 17,595.60
Budgeted Labour Cost (Revised)* 60,337.20
Budgeted Labour Cost (Revised)*
= Std. Hrs. × Std. Rate
= 91.42 hrs. × `660
= ` 60,337.20
16. Statement Showing Change in Profit
Particulars Large (`) Medium (`) Total (`)
I. Effect of Product Mix Changes
Revised Estimated Sales Quantity (Ratio 40:60) 62,304 93,456 1,55,760
Revised Estimated Sales Quantity (Ratio 50:50) 77,880 77,880 1,55,760
Difference in Sales Quantity (15,576) 15,576 NIL
Contribution Effect Thereon @ `8.60 and `10.60
(1,33,953.60) 1,65,105.60 31,152
© The Institute of Chartered Accountants of India

34 FINAL EXAMINATION: NOVEMBER, 2018
II Effect of Volume Change
Revised Estimate of Sales Quantity (50:50) 77,880 77,880
Original Estimate of Sales Quantity (50:50) 60,000 60,000
Difference in Sales Quantity 17,880 17,880 35,760
Contribution Effect Thereon @ `8 and `10 1,43,040 1,78,800 3,21,840
III. Effect of Price Change
Revised Estimate of Sales Quantity (Ratio 40:60)
62,304
93,456 1,55,760
Difference in Price p.u. 0.60 0.60 0.60
Contribution Effect 37,382.40 56,073.60 93,456
IV. Effect of Expenses
Sales Promotion Expenses (78,000)
Savings in Interest 9,000
Overall Increase in Profit 3,77,448
Total Improvement in Profit `3,77,448 (11.51%).
Workings
Budget for Original and Revised Contribution
Particulars Original Budget Estimate Revised Estimate
Description (`) Description (`)
Market- Sales Quantity 12,00,000 units 14,16,000
Company’s Share 1,20,000 units
(10% of total)
1,55,760 units
(11% of total)
Sales Quantity
Large 60,000 units
(50% of mix)
62,304
(40% of mix)
Medium 60,000 units
(50% of mix)
93,456
(60% of mix)
Contribution Earned
Large 60,000 units × `8 4,80,000 62,304 units × `8.60 5,35,814.40
Medium 60,000 units × `10 6,00,000 93,456 units × `10.60 9,90,633.60
Effect of Expenses
Sales Promotion --- -78,000
Interest --- 9,000
Revised Contribution 10,80,000 14,57,448
This question can also be solved by computing Sales Contribution Price Variance, Sales Contribution Mix Variance, Market Size Variance, Market Share Variance.
© The Institute of Chartered Accountants of India

PAPER – 5 : ADVANCED MANAGEMENT ACCOUNTING 35
© The Institute of Chartered Accountants of India