Embed Size (px)
Citation preview

8/3/2019 Paper 3-Fingerprint Image Enhancement
http://slidepdf.com/reader/full/paper-3-fingerprint-image-enhancement 1/10

8/3/2019 Paper 3-Fingerprint Image Enhancement
http://slidepdf.com/reader/full/paper-3-fingerprint-image-enhancement 2/10
(IJACSA) International Journal of Advanced Computer Science and Applications,
Vol. 3, No. 1, 2012
16 | P a g e
www.ijacsa.thesai.org
classified into global and local features [5]-[7]. Global featuresare those characteristics of the fingerprint that could be seenwith the naked eye. They are the features that arecharacterized by the attributes that capture the global spatialrelationships of a fingerprint. Global features include ridgepattern, type, orientation, spatial frequency, curvature, positionand count. Others are type lines, core and delta areas.
The Local Features are also known as Minutia Points.
They are the tiny, unique characteristics of fingerprint ridgesthat are used for positive identification. Local features containthe information that is in a local area only and invariant withrespect to global transformation. It is possible for two or moreimpressions of the same finger to have identical globalfeatures but still differ because they have local features(minutia points) that are different. In Fig. 2, ridge patterns (a)and (b) are two different impressions of the same finger(person). A local feature is read as bifurcation in (a) while itappears as a ridge ending in (b).
II. FINGERPRINT IMAGE ENHANCEMENT
Reliable and sound verification of fingerprints in any AFISis always preceded with a proper detection and extraction of
its features. A fingerprint image is firstly enhanced before thefeatures contained in it could be detected or extracted. A wellenhanced image will provide a clear separation between thevalid and spurious features. Spurious features are thoseminutiae points that are created due to noise or artifacts andthey are not actually part of the fingerprint. This paper adoptswith slight modifications, the algorithm implemented in [8]-[9] for fingerprint image enhancement. The overview of thealgorithm is shown in Fig. 3. Its main steps include imagesegmentation, local normalization, filtering andbinarization/thinning.
A Image Segmentation
There are two regions that describe any fingerprint image;namely the foreground region and the background region. The
foreground regions are the regions containing the ridges andvalleys. As shown in Fig. 4, the ridges are the raised and dark regions of a fingerprint image while the valleys are the lowand white regions between the ridges. The foreground regions
often referred to as the Region of Interest (RoI) is shown forthe image presented in Fig. 5. The background regions aremostly the outside regions where the noises introduced intothe image during enrolment are mostly found. The essence of
segmentation is to reduce the burden associated with imageenhancement by ensuring that focus is only on the foregroundregions while the background regions are ignored.
The background regions possess very low grey-levelvariance values while the foreground regions possess veryhigh grey-level variance values. A block processing approachused in [8]-[9] is adopted in this research for obtaining thegrey-level variance values. The approach firstly divides theimage into blocks of size W x W and then the variance V(k)for each of the pixels in block k is obtained from:
I(i,j) and J(a,b) are the grey-level value for pixel i,j and(a,b) respectively in block k.
(a) Bifurcation (b) Ridge ending
Figure 2: Different minutiae for different impressions
of the same finger
Figure 4: Ridges and valleys on a fingerprint image
Ridges
Valleys
Image Segmentation
Image Local Normalization
Image Filtering
Orientation
Estimation
Ridge
FrequencyEstimation
Gabor
Filtering
Image Binarization/ Thinning
Figure 3: The conceptual diagram of the fingerprint enhancement algorithm

8/3/2019 Paper 3-Fingerprint Image Enhancement
http://slidepdf.com/reader/full/paper-3-fingerprint-image-enhancement 3/10
(IJACSA) International Journal of Advanced Computer Science and Applications,
Vol. 3, No. 1, 2012
17 | P a g e
www.ijacsa.thesai.org
A. Image Local Normaliuzation
Normalization is performed on the segmented fingerprintimage ridge structure so as to standardize the level of variations in the image grey-level values. By normalization,the grey-level values are made to fall within certain range thatis good enough for improved image contrast and brightness.The first of the tasks of image normalization implemented in[8]-[9] and adopted for this research is the division of the
segmented image into blocks of size S x S. The grey-levelvalue for each pixel is then compared with the average grey-level value for the host block. For a pixel I(i,j) belonging to ablock of average grey-level value of M, the result of comparison produced a normalized grey-level value N(i,j)defined by the formula:
{
where an assumed value of M0 is set for the desired meanand an assumed value of V0 is set for the desired variance.
B. Image Filtering
Normalized fingerprint image is filtered for enhancementthrough removal of noise and other spurious features. Filteringis also used for preserving the true ridge and valley structures.The fingerprint image filtering structure adopted for thisresearch is in the following phases:
1) Orientation Estimation: Orientation estimation is the
first of the prerequisites for fingerprint image filtering. In
every image, the ridges form patterns that flow in different
directions. The orientation of a ridge at location x,y is the
direction of its flow over a range of pixels as shown in Fig. 6. The Least Square Mean (LSM) fingerprint ridge
orientation estimation algorithm proposed and implemented in[8]-[9] was slightly modified and used in this research. Themodified algorithm involves the following steps:
a) Firstly, blocks of size S x S were formed on the
normalized fingerprint image.
b) For each pixel, (p,q) in each block, the gradients(p,q) and (p,q) were computed as the gradient
magnitudes in the x and y directions, respectively.
(p,q) was computed using the horizontal Sobel operatorwhile (p,q) was computed using the vertical Sobel operator.
c) The local orientation of a pixel in a fingerprint image
was computed by using its S x S neighborhood in [8]-[9]. Thiswas slightly modified in this research by dividing the image
into S x S blocks and the local orientation for each block
centered at pixel I(i,j) was then computed from:
where Ɵ(i, j) is the least square estimate of the localorientation at the block centered at pixel (i, j).
d) The orientation image is then converted into a
continuous vector field defined by:
( ) ( )
where and are the x and y components of
the vector field, respectively.
e) Gaussian smoothing is then performed on the vector field as follows:
Figure 6: The orientation of a ridge pixel in a fingerprint
Background
region
Foreground
region
Figure 5: A fingerprint image and its foreground andbackground regions
0 0 0
Horizontal Sobel Operator
0 0 0
Vertical Sobel Operator

8/3/2019 Paper 3-Fingerprint Image Enhancement
http://slidepdf.com/reader/full/paper-3-fingerprint-image-enhancement 4/10
(IJACSA) International Journal of Advanced Computer Science and Applications,
Vol. 3, No. 1, 2012
18 | P a g e
www.ijacsa.thesai.org
0
where G is a Gaussian low-pass filter of size .
f) The orientation field O of the block centered at pixel
(i,j) is finally smoothed using the equation:
2) Ridge Frequency Estimation: The second prerequisite
for fingerprint image filtering is the ridge frequency
estimation. In any fingerprint image, there is a local frequency
of the ridges that collectively form the ridge frequency image.
The ridge frequency is obtained from the extraction of the
ridge map from the image. The extraction of the ridge map
involves the following steps:
a) Compute the consistency level of the orientation field obtained from the first prerequisite in the local neighborhood
of a pixel (p,q) with the following formula:
∑||
|| 00
0 0 (14)
where W represents the local neighborhood around (p,q),which is an n x n local window, (i,j) and (p,q) are localridge orientations at pixels (i,j) and (p,q) respectively.
b) If the consistency level is below a certain threshold
F c , then the local orientations in this region are re-estimated
at a lower image resolution level until the consistency is aboveF c. After the orientation field is obtained, the following two
adaptive filters are applied to the image:
{
√ √ 0
(15)
{
√
√
0 (16)
(17) (18)
(19)
The two filters are capable of stressing under differentcondition the local maximum grey level values along thenormal direction of the local ridge orientation. The normalized
image is first convolved with these two masks, h t (p,q, i, j) andhb (p,q, i, j). If both the grey level values at pixel (p,q) of theconvolved images are larger than a certain threshold Fridge,then pixel (p,q) is labeled as a ridge.
3) Orientation Estimation: Having obtained the
prerequisites, Gabor filtering is then used to improve or
enhance the fingerprint image to a finer structure. It involves
the removal of noise and artifacts. The general form of Gabor
filter is: [ ]} 0
where f is the frequency of the cosine wave along thedirection θ from the x-axis, and δx and δy are the spaceconstants along x and y axes respectively. a= xsinƟ + ycosƟ and b= xcosƟ + ysinƟ.
The values of the space constants δx and δy for the Gaborfilters were empirically determined as each is set to about half the average inter-ridge distance in their respective direction. δx and δy are obtained from δx = k xF and δy = k yF respectively. F is the ridge frequency estimate of the original image, and k x and k y are constant variables. The value of δx determines the
degree of contrast enhancement between ridges and valleyswhile the value of δy determines the amount of smoothingapplied to the ridges along the local orientation.
C. Image Binarization/Thinning
The image obtained from the Gabor filtering stage isbinarized and thinned to make it more suitable for featureextraction. The method of image binarization proposed in [10]is employed. The Method sets the threshold (T) for makingeach cluster in the image as tight as possible, therebyminimizing their overlap. To determine the actual value of T,the following operations are performed on set of presumedthreshold values:
a)
The pixels are separated into two clusters accordingto the threshold.
b) The mean of each cluster are determined.
c) The difference between the means is squared.
d) The product of the number of pixels in one cluster and
the number in the other is determined.
The success of these operations depends on the differencebetween the means of the clusters. The optimal threshold is theone that maximizes the between-class variance or, conversely,the one that minimizes the within-class variance. The within-class variance of each of the cluster is then calculated as theweighted sum of the variances from:
∑
8/3/2019 Paper 3-Fingerprint Image Enhancement
http://slidepdf.com/reader/full/paper-3-fingerprint-image-enhancement 5/10
(IJACSA) International Journal of Advanced Computer Science and Applications,
Vol. 3, No. 1, 2012
19 | P a g e
www.ijacsa.thesai.org
p(i) is the pixel value at location i, N is the intensity leveland [0 ,N − 1] is the range of intensity levels. The between-class variance, which is the difference between the within-class variance and the total variance of the combineddistribution, is then obtained from:
25)
(26) (27)
where σ 2
is the combined variance, μ B(T) is the combinemean for cluster T in the background threshold, μO(T) is thecombine mean for cluster T in the foreground threshold and μ is the combined mean for the two thresholds. The between-class variance is simply the weighted variance of the clustermeans themselves around the overall mean. Substituting μ =n B(T ) μ B(T ) +nO(T ) μO(T ) into Equation 25, the result is:
Using the following simple recurrence relations, the
between-class variance is successfully updated bymanipulating each threshold T using a constant value p asfollows: (29) (30) (31)
(32)
III. EXPERIMENTAL RESULTS
A slightly modified version of the fingerprint enhancementalgorithm used in [8]-[9] was implemented in this research byusing MATLAB Version 7.2 on the Windows Vista HomeBasic operating system. The experiments were performed on aPentium 4 – 1.87 GHz processor with 1024MB of RAM. Thepurpose of the fingerprint enhancement experiments is toanalyze the performance of the modified algorithm underdifferent conditions of images as well as generate the metricsthat could serve the basis for the comparison of the resultsfrom the research with results from related works. Two sets of experiment were conducted for the performance analysis. Thefirst set of experiments was on synthetic images. Theorientation estimation, ridge frequency estimation and Gaborfiltering experiments all employed the circsine function [11] togenerate the synthetic images. The major arguments passedinto the circsine function include a number for the size of thesquare image to be produced, a number for the wavelength inpixels of the sine wave and an optional number specifying thestandard pattern of behaviour to use in calculating the radiusfrom the centre. This defaults to 2, resulting in a circularpattern while large values give a square pattern. Wherenecessary, the MATLAB imnoise function was also used togenerate noise and artifacts on synthetic images. Thearguments passed into the imnoise function include the imageon which noise is to be generated, noise type and noise level.
The second set of experiments was on the FVC2004fingerprint database DB3 set A.
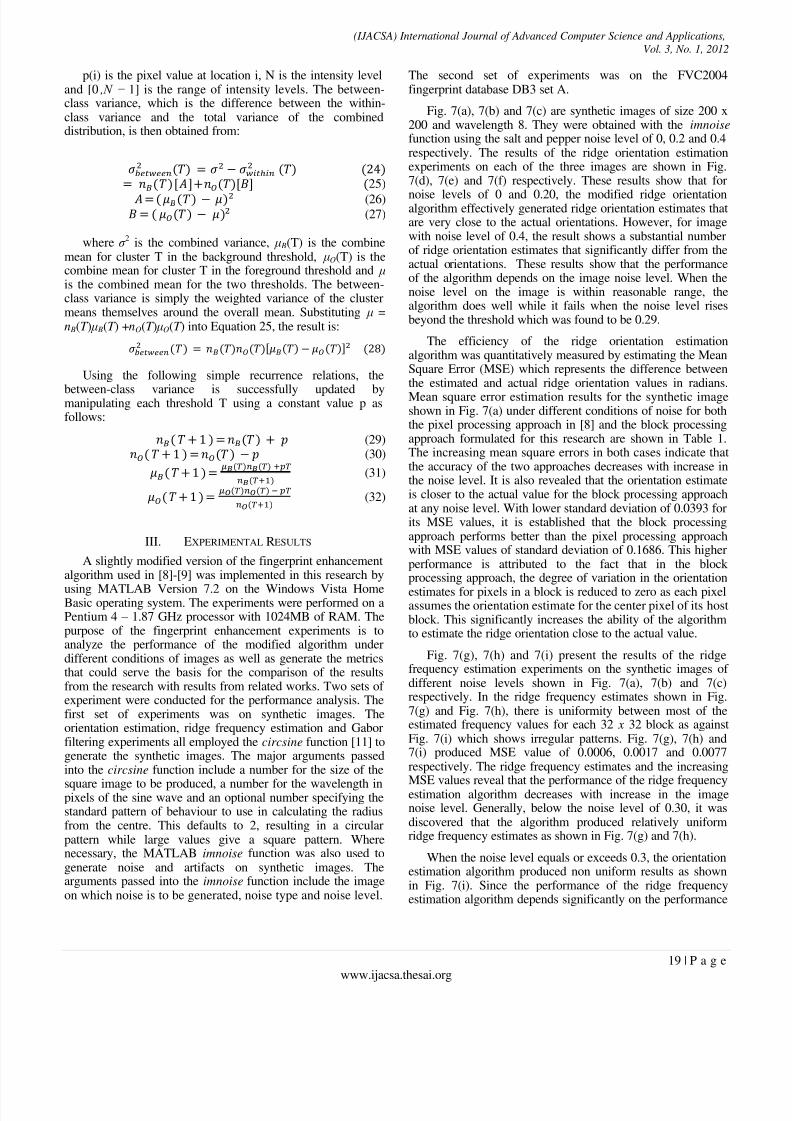
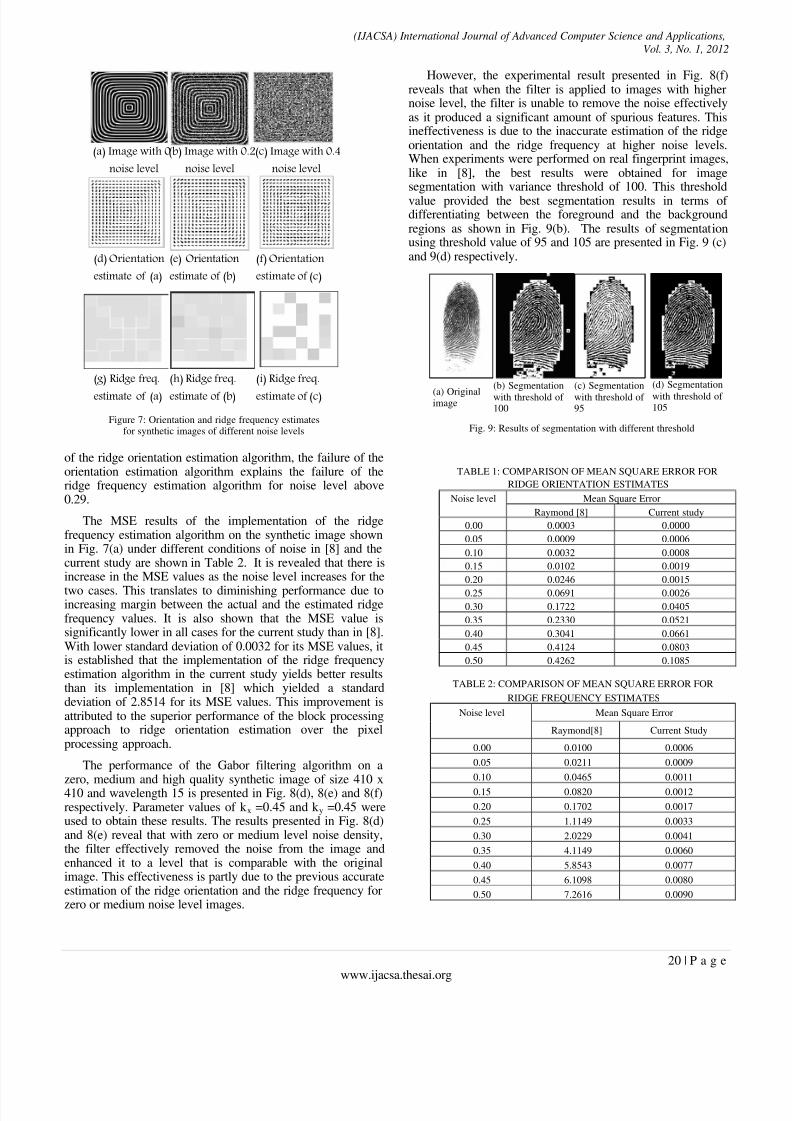
Fig. 7(a), 7(b) and 7(c) are synthetic images of size 200 x200 and wavelength 8. They were obtained with the imnoise function using the salt and pepper noise level of 0, 0.2 and 0.4respectively. The results of the ridge orientation estimationexperiments on each of the three images are shown in Fig.7(d), 7(e) and 7(f) respectively. These results show that for
noise levels of 0 and 0.20, the modified ridge orientationalgorithm effectively generated ridge orientation estimates thatare very close to the actual orientations. However, for imagewith noise level of 0.4, the result shows a substantial numberof ridge orientation estimates that significantly differ from theactual orientations. These results show that the performanceof the algorithm depends on the image noise level. When thenoise level on the image is within reasonable range, thealgorithm does well while it fails when the noise level risesbeyond the threshold which was found to be 0.29.
The efficiency of the ridge orientation estimationalgorithm was quantitatively measured by estimating the MeanSquare Error (MSE) which represents the difference between
the estimated and actual ridge orientation values in radians.Mean square error estimation results for the synthetic imageshown in Fig. 7(a) under different conditions of noise for boththe pixel processing approach in [8] and the block processingapproach formulated for this research are shown in Table 1.The increasing mean square errors in both cases indicate thatthe accuracy of the two approaches decreases with increase inthe noise level. It is also revealed that the orientation estimateis closer to the actual value for the block processing approachat any noise level. With lower standard deviation of 0.0393 forits MSE values, it is established that the block processingapproach performs better than the pixel processing approachwith MSE values of standard deviation of 0.1686. This higherperformance is attributed to the fact that in the block
processing approach, the degree of variation in the orientationestimates for pixels in a block is reduced to zero as each pixelassumes the orientation estimate for the center pixel of its hostblock. This significantly increases the ability of the algorithmto estimate the ridge orientation close to the actual value.
Fig. 7(g), 7(h) and 7(i) present the results of the ridgefrequency estimation experiments on the synthetic images of different noise levels shown in Fig. 7(a), 7(b) and 7(c)respectively. In the ridge frequency estimates shown in Fig.7(g) and Fig. 7(h), there is uniformity between most of theestimated frequency values for each 32 x 32 block as againstFig. 7(i) which shows irregular patterns. Fig. 7(g), 7(h) and7(i) produced MSE value of 0.0006, 0.0017 and 0.0077respectively. The ridge frequency estimates and the increasing
MSE values reveal that the performance of the ridge frequencyestimation algorithm decreases with increase in the imagenoise level. Generally, below the noise level of 0.30, it wasdiscovered that the algorithm produced relatively uniformridge frequency estimates as shown in Fig. 7(g) and 7(h).
When the noise level equals or exceeds 0.3, the orientationestimation algorithm produced non uniform results as shownin Fig. 7(i). Since the performance of the ridge frequencyestimation algorithm depends significantly on the performance
8/3/2019 Paper 3-Fingerprint Image Enhancement
http://slidepdf.com/reader/full/paper-3-fingerprint-image-enhancement 6/10
(IJACSA) International Journal of Advanced Computer Science and Applications,
Vol. 3, No. 1, 2012
20 | P a g e
www.ijacsa.thesai.org
of the ridge orientation estimation algorithm, the failure of theorientation estimation algorithm explains the failure of theridge frequency estimation algorithm for noise level above0.29.
The MSE results of the implementation of the ridgefrequency estimation algorithm on the synthetic image shownin Fig. 7(a) under different conditions of noise in [8] and thecurrent study are shown in Table 2. It is revealed that there isincrease in the MSE values as the noise level increases for thetwo cases. This translates to diminishing performance due toincreasing margin between the actual and the estimated ridgefrequency values. It is also shown that the MSE value issignificantly lower in all cases for the current study than in [8].With lower standard deviation of 0.0032 for its MSE values, itis established that the implementation of the ridge frequencyestimation algorithm in the current study yields better resultsthan its implementation in [8] which yielded a standarddeviation of 2.8514 for its MSE values. This improvement isattributed to the superior performance of the block processingapproach to ridge orientation estimation over the pixelprocessing approach.
The performance of the Gabor filtering algorithm on a
zero, medium and high quality synthetic image of size 410 x410 and wavelength 15 is presented in Fig. 8(d), 8(e) and 8(f)respectively. Parameter values of k x =0.45 and k y =0.45 wereused to obtain these results. The results presented in Fig. 8(d)and 8(e) reveal that with zero or medium level noise density,the filter effectively removed the noise from the image andenhanced it to a level that is comparable with the originalimage. This effectiveness is partly due to the previous accurateestimation of the ridge orientation and the ridge frequency forzero or medium noise level images.
However, the experimental result presented in Fig. 8(f)reveals that when the filter is applied to images with highernoise level, the filter is unable to remove the noise effectivelyas it produced a significant amount of spurious features. Thisineffectiveness is due to the inaccurate estimation of the ridgeorientation and the ridge frequency at higher noise levels.When experiments were performed on real fingerprint images,like in [8], the best results were obtained for imagesegmentation with variance threshold of 100. This thresholdvalue provided the best segmentation results in terms of differentiating between the foreground and the backgroundregions as shown in Fig. 9(b). The results of segmentationusing threshold value of 95 and 105 are presented in Fig. 9 (c)and 9(d) respectively.
TABLE 1: COMPARISON OF MEAN SQUARE ERROR FOR
RIDGE ORIENTATION ESTIMATES
Noise level Mean Square Error
Raymond [8] Current study
0.00 0.0003 0.0000
0.05 0.0009 0.0006
0.10 0.0032 0.0008
0.15 0.0102 0.0019
0.20 0.0246 0.00150.25 0.0691 0.0026
0.30 0.1722 0.0405
0.35 0.2330 0.0521
0.40 0.3041 0.0661
0.45 0.4124 0.0803
0.50 0.4262 0.1085
TABLE 2: COMPARISON OF MEAN SQUARE ERROR FOR
RIDGE FREQUENCY ESTIMATES
Noise level Mean Square Error
Raymond[8] Current Study
0.00 0.0100 0.0006
0.05 0.0211 0.0009
0.10 0.0465 0.00110.15 0.0820 0.0012
0.20 0.1702 0.0017
0.25 1.1149 0.0033
0.30 2.0229 0.0041
0.35 4.1149 0.0060
0.40 5.8543 0.0077
0.45 6.1098 0.0080
0.50 7.2616 0.0090
(a) Originalimage
Fig. 9: Results of segmentation with different threshold
(b) Segmentationwith threshold of 100
(c) Segmentationwith threshold of 95
(d) Segmentationwith threshold of 105
(a) Image with 0
noise level
(b) Image with 0.2
noise level
(c) Image with 0.4
noise level
(d) Orientation
estimate of (a)
(e) Orientation
estimate of (b)
(f) Orientation
estimate of (c)
(g) Ridge freq.
estimate of (a)
(h) Ridge freq.
estimate of (b)
(i) Ridge freq.
estimate of (c)
Figure 7: Orientation and ridge frequency estimatesfor synthetic images of different noise levels

8/3/2019 Paper 3-Fingerprint Image Enhancement
http://slidepdf.com/reader/full/paper-3-fingerprint-image-enhancement 7/10
(IJACSA) International Journal of Advanced Computer Science and Applications,
Vol. 3, No. 1, 2012
21 | P a g e
www.ijacsa.thesai.org
These results show inappropriate segmentation due toinaccurate variance thresholds. With lower threshold of 95,some of the background regions have been segmented to theforeground while some foreground regions are also segmented
to the background under higher threshold of 105.The result of the normalization experiment on the
fingerprint images shown in Fig. 9(a) is presented in Fig.10(a). The desire mean of zero and variance of one used in [8]were adopted and used to normalize the ridges in the images.During normalization, all positions are evenly shifted alongthe horizontal axis, which makes the structure of the ridgesand valleys to become well and suitably positioned.
The histogram plots of the original and the normalizedimages are shown in Fig. 10(b) and 10(c) respectively. Thehistogram plot of the original image shows that all theintensity values of the ridges show irregular frequency valuesand also fall within the right hand side of the 0 – 255 scale, with
no pixels in the left hand side. This leads to an image with avery low contrast.
The histogram plot of the normalized image shows that therange of intensity values for the ridges has been adjustedbetween 0-1 scale such that there is a more evenly andbalanced distribution between the dark and light pixels andthat the ridge frequencies fall within close values. Thenormalized image histogram plots also show that thenormalization process does distribute evenly the shape of theoriginal image. The positions of the values are evenly shiftedalong the x-axis, which means the structure of the ridges andvalleys are now well and suitably positioned. This shifted andimproved positioning lead to images with a very high contrastshown in Fig. 10(a).
The orientation fields for the real fingerprint images wereobtained around their singular points since they are prominentfeatures used by any AFIS for fingerprint classification andmatching. Good quality images are shown in Fig. 11(a), 11(b)and 11(c). Their orientation estimates are shown in Fig. 11(e),11(f) and 11(g) respectively.
At the singular points, the orientation field is discontinuousand unlike the normal ridge flow pattern, the ridge orientationvaries significantly. From these results, it is observed that
there exists no deviation between the actual fingerprint ridgeorientation and the estimated orientation of the vectors. In bothcases, the algorithm produces accurate estimates of theorientation vectors such that they flow smoothly andconsistently with the direction of the ridge structures in theimages. In the superimposed version of images in Fig. 11(e),11(f), 11(g) and 11(h), the contrast of the original image islowered in each case. This was done to improve the visibilityof the orientation vectors against the background.
The ridge orientation estimate for poor quality imageshown in Fig. 11(d) is presented in Fig. 11(h). The estimateindicates a fairly smooth orientation field in some well-definedregions while it gives misleading results in areas of very poorquality as evident in the top-left and bottom regions of the
estimate. The orientation estimates resulting from the pixelprocessing approach in [8] and the block processing approachof the current study for the image shown in Fig. 12(a) arepresented in Fig. 12(b) and 12(c) respectively.
Visual inspection of these results reveals that the twomethods did well in the ridge orientation estimation. However,the orientation is observed to be closer to the actual orientationin block processing than pixel processing in some regionsespecially the core areas represented by the inserted circles.The reason adduced to this is that assigning equal orientationestimate for pixels in a block rather than maintaining differentvalues is better and able to take the estimates closer to theiractual values.
(a)Norma-
lized image
Figure. 10: Normalized image and the histogram plots
(b) Histogram of
original image
(b) Histogram of
normalised image
a) 0 noise levelimage image
(b) 0.2 noise levelimage
(c) 0.4 noise levelimage
(d) Filtered (a) e Filtered b f Filtered cFigure 8: Results of applying a Gabor filter on synthetic
images of different noise levels.

8/3/2019 Paper 3-Fingerprint Image Enhancement
http://slidepdf.com/reader/full/paper-3-fingerprint-image-enhancement 8/10
(IJACSA) International Journal of Advanced Computer Science and Applications,
Vol. 3, No. 1, 2012
22 | P a g e
www.ijacsa.thesai.org
Visual inspection of the results for the ridge frequencyestimates for real fingerprint images shown in Fig. 11(a),11(b), 11(c) and 11(d) are shown in Fig. 13(a), 13(b), 13(c)
and 13(d) respectively. The mean ridge frequency (MRF),which is the average of the image ridge frequencies, is alsopresented for each image. It is noted that the MRF valuesdiffer for all the images. This difference is attributed to thefact that fingerprints exhibit variation in their average ridgefrequency characteristics and contrast levels. The intensities of frequency differ for blocks or regions within same image.Some blocks or regions exhibit high contrast while othersexhibit low contrast. Based on these, the synthetic images aremore appropriate for the evaluation of the accuracy of theridge frequency estimation algorithm.
Fig. 14 reveals the extent to which the filtering algorithmwas able to remove noise from the images shown in Fig. 11
for different values of k x and k y. The results shown in Fig.14(a), 14(b), 14(c) and 14(d) were obtained using parametervalues of k x = 0.45 and k y = 0.45. With these values, it isshown that the contrast level between ridges and valleys foreach of the images is neither too high nor too low. Appropriatelevel of smoothing is also applied to the ridges along the localorientation.
With lower parameter values of k x = 0.40 and k y = 0.40, itis shown in Fig. 14(e), 14(f), 14(g) and 14(h) that the contrastlevel between ridges and valleys is too low and this explainswhy there is a number of dark regions. The degree of smoothing is also poor as there is a good number of overlapping ridges in the filtered images. When k x=0.5 andk y=0.5 were used, the results of the filtering experimentsshown in Fig. 14(i), 14(j), 14(k) and 14(l) reveal that there is
no significant difference from the results obtained for k x=0.45and k y=0.45 except that some regions described by circlesappear to be excessively smoothened.
It is therefore stated that based on the modified algorithm,parameter values of k x=0.45 and k y=0.45 are most appropriatefor image filtering as against k x=0.50 and k y=0.50 proposed in[8]-[9]. This reduction in parameter values is due to the betterperformance of the block processing approach in theorientation and ridge frequency estimations as attested to bythe results in Table 1 and Table 2. Results presented in Fig. 14show that the filtering algorithm is able to smoothen to a finelevel with appropriate parameter values for good qualityfingerprint images.
When the quality degrades like the one shown in Fig.11(d), the performance of the algorithm diminishes as itproduces images with inappropriately filtered regions asshown in Fig. 14(d). This is also corroborated with reasonsadduced to the values presented in Table 1 and Table 2.
(a) Original
Image
(b) Orientation
estimate obtained in
[8]
(c) Orientation
estimate for current
study
Fig. 12: Orientation estimates for pixel and block
processing approaches
(a) Ridge frequency estimate
of Fig. 11(a) with mean ridge
frequency of 0.0765
(c)Ridge frequency estimate
of Fig. 11(b) with mean ridge
frequency of 0.0726
(d) Ridge frequency estimateof Fig. 11(c) with mean ridgefrequency of 0.0821
(e) Ridge frequency estimate
of Fig. 11(d) with mean
ridge frequency of 0.0637
Fig. 13: Ridge frequency estimate of selected images
Regions of false results
(a)Good qualitywhorl image
(e) Orientation
estimate of (a)
Figure 11: Fingerprint images and their orientation estimates
Singular Points
(b)Good qualityleft loop image
(c)Good qualityright loop image
(d)Poor quality image
(f) Orientation
estimate of (b)
(g) Orientation
estimate of (c)
(h) Orientation
estimate of (d)

8/3/2019 Paper 3-Fingerprint Image Enhancement
http://slidepdf.com/reader/full/paper-3-fingerprint-image-enhancement 9/10
(IJACSA) International Journal of Advanced Computer Science and Applications,
Vol. 3, No. 1, 2012
23 | P a g e
www.ijacsa.thesai.org
The results of the binarization experiments for the imagesshown in Fig. 11 are presented in Fig. 15. Visual inspection of the results shows that the binarization algorithm perfectlyseparated the ridges (black pixels) from the valleys (whitepixels).
To obtain these results, the grey-level value of each pixelin the filtered image is examined and, if the value is greaterthan the threshold value 1, then the pixel value is set to abinary value one; otherwise, it is set to zero. The thresholdvalue successfully made each cluster as tight as possible andalso eliminated all overlaps. The threshold value of 1 wastaken after a careful selection from a series of within andbetween class variance values ranging from 0 to 1 thatoptimally supported the maximum separation of the ridgesfrom the valleys. The clear separation of the ridges from thevalleys verifies the correctness of the algorithm as proposed in[9] and implemented in this research.
The results of the thinning experiment on each of theimages shown in Fig. 11 are presented in Fig. 16(a-d). TheMATLAB’s bwmorph operation using the ‘thin’ option wasused to generate the thinned images. These results show thatthe ridge thickness in each of the images has been reduced to
its smallest form or skeleton (one pixel wide). It is also shownthat the connectivity of the ridge structures is well preserved.Fig. 16(e-h) shows the results of performing binarizationexperiments on the raw images without the enhancementstages. In contrast to Fig. 15(a-d), the binary images in Fig.16(e-h) are not well connected and contain significant amountof noise and corrupted elements. Consequently, when thinningis applied to these binary images, the results in Fig. 16(i-l)show that the accurate extraction of minutiae would not bepossible due to the large number of spurious features
produced. Thus, it is shown that employing the imageenhancement stages prior to thinning is effective for accurateand speedy extraction of minutiae. Consequently, whenthinning is applied to these binary images, the results in Fig.16(i-l) show that the accurate extraction of minutiae would notbe possible due to the large number of spurious featuresproduced.
Thus, it is shown that employing the image enhancement
stages prior to thinning is effective for accurate and speedyextraction of minutiae.
IV. CONCLUSION
This paper discusses the results of the modification andverification of the fingerprint enhancement algorithmdeveloped and implemented in [8]-[9]. Some stages of thealgorithm were slightly modified for improved performance.For instance, block processing approach was introduced intothe orientation estimation algorithm in place of the pixelprocessing approach.
(a) (b) c (d
(e) (f) (g) (h)
(i) (j) (k) (l)
Thinned images without the enhancement stages
Binarized images without the enhancement stages
Thinned images with the enhancement stages
Fig. 16: Thinned and Binarized images
Filtered images for k x = 0.45 and k y = 0.45
(a) (b) (c) (d)
Filtered images for k x = 0.40 and k y = 0.40(e) (f) h
Filtered images for k x = 0.50 and k y = 0.50(i) (j) (k)
Fig. 14: Filtered images with different values for k x and k y
Fig. 15: Results of Binarization for images shown in Fig. 11(a),
11(b), 11(c) and 11(d)
(a) (b) (c) (d)

8/3/2019 Paper 3-Fingerprint Image Enhancement
http://slidepdf.com/reader/full/paper-3-fingerprint-image-enhancement 10/10
(IJACSA) International Journal of Advanced Computer Science and Applications,
Vol. 3, No. 1, 2012
24 | P a g e
www.ijacsa.thesai.org
While the pixel processing approach subjects each pixel inthe image to orientation estimation, the block processingapproach firstly divides the image into S x S blocks andobtains the orientation estimate for the center pixel. Thisresulted in higher performance as attested to by the Tables of MSE for ridge orientation and frequency estimates. Parametervalues of k x =0.45 and k y =0.45 were found to perform well inthe image filtering experiments as against k x =0.5 and k y =0.5.
The results of the experiments conducted for imagesegmentation, normalization, ridge orientation estimation,ridge frequency estimation, Gabor filtering, binarization andthinning on synthetic and real fingerprint images reveal thatwith free or minimal noise level, the algorithms perform well.Improved performance is specifically noticed for the modifiedridge orientation estimation algorithm. It is also establishedthat each stage of the enhancement process is important forobtaining a perfectly enhanced image that is acceptable andpresentable to the features extraction stage. The resultsobtained from the final stage of thinning show that theconnectivity of the image ridge structure has been preservedand improved at each stage.
REFERENCES [1] C. Roberts: ‘Biometrics’:
(http://www.ccip.govt.nz/newsroom/informoationnotes/2005/biometrics.
pdf, Accessed: July, 2009
[2] C. Michael and E. Imwinkelried: ‘Defence practice tips, a cautionary
note about fingerprint analysis and reliance on digital technology’,Public Defense Backup Centre Report., 2006
[3] M. J. Palmiotto: ‘Criminal Investigation’. Chicago: Nelson Hall, 1994
[4] Salter D.: ‘Fingerprint – An Emerging Technology’, EngineeringTechnology, New Mexico State University, 2006
[5] J. Tsai-Yang, and V. Govindaraju: A minutia-based partial fingerprint
recognition system, Center for Unified Biometrics and Sensors,
University at Buffalo, State University of New York, Amherst, NY USA
14228, 2006
[6] O. C Akinyokun, C. O. Angaye and G. B. Iwasokun: ‘A Framework for
Fingerprint Forensic’; Proceeding of the First International Conferenceon Software Engineering and Intelligent System, organized and
sponsored by School of Science and Technology, Covenant University,
Ota, Nigeria, 2010, pages 183-200.
[7] O. C. Akinyokun and E. O. Adegbeyeni: Scientific Evaluation of the
Process of Scanning and Forensic Analysis of Fingerprints on Ballot
Papers’, Proceedings of Allied Academies International Conference on
Legal, Ethics and Regulatory Measures in New Orleans, April 8 - 10,
2009; Vol. 13; No. 1; pages 1 - 13.
[8] L. Hong, Y. Wan and A. Jain: ‘Fingerprint image enhancement:
Algorithm and performance evaluation’; Pattern Recognition and ImageProcessing Laboratory, Department of Computer Science, Michigan
State University, 2006, pp1-30
[9] R. Thai: Fingerprint Image Enhancement and Minutiae Extraction, PhD
Thesis Submitted to School of Computer Science and Software
Engineering, 2003, University of Western Australia.
[10] X. Xu : ‘Image Binarization using Otsu Method’. Proceedings of NLPR -
PAL Group CASIA Conference, 2009, pp345-349[11] P. Kovesi: ‘MATLAB functions for computer vision and image
analysis’, School of Computer Science and Software Engineering,University of Western Australia,
http:/www.cs.uwa.edu.au/~pk/Research/MatlabFns/Index.html,
Accessed: 20 February 2010.