Embed Size (px)
Citation preview

Narth Sea
Maa$ursiibnt!h6kdiip
Paper 21:
LIQUID CORRECTION OF VENTURI METERREADINGS IN WET GAS FLOW
Authors:Rick de Leeuw, Shell International Exploration& Production, The Netherlands
OrganiseENorwegian Society of Chartered Engineers
Norwegian Society for Oil and Gas MeasurementCo-organise32
National Engineering Laboratory, UK
Reprints are prohibited unless permission from the authorsand the organisers

DISCLAIMER
Portions of this document may be illegiblein electronic image products. Images areproduced from the best available originaldocument.

●
LIQUID CORRECTION OF VENTURI METER READINGS IN WET GAS FLOW
Rick de Leeuw
Shell International Exploration & Production, The Hague, The Netherlands
SUMMARY
Venturi flow meters can be used to measure the actual gas flow rate in wet gasstreams, provided the liquid content is known. An empirical correlation is presentedwhich accurately predicts the effect of the liquid phase on venturi meter readings inwet gas horizontal flow. The correlation is based on a comprehensive experimentaldata set which was collected in a full scale multiphase flow test facility. The testenvelope covers the majority of the wet gas operating conditions encountered in thefield. Deviations between the new correlation and the experimental base are betterthan 2%. The new correlation differs fundamentally from the well known orificeplate correlations of Murdock and Chisholm in that the observed dependence on thegas Froude number is accounted for and the pressure dependence is verified from 15bar to effectively dense phase conditions. Test results of the overall pressure lossacross the venturi meter are also presented. The liquid content of the gas stream canbe measured using the tracer dilution method. Field experience with the tracermethod over the last couple of years have demonstrated that the flow rates of waterand condensate can be determined within the target uncertainty of 10%. At presentthe tracer method is available to the industry via two licensed contractors.
1. INTRODUCTION
The development costs of gaslcondensate fields can be reduced significantly if testseparators are replaced by venturi flow meters in each well flow line, and the wetnessof the flow is measured periodically, typically 1 to 2 times a year, using a (non-radioactive) tracer method[’ ‘z], see figure 1. The production from different fields canthen simply be commingled prior to transporting and processing by shared facilities.
The tracer method involves injection of suitable tracers into the flow line followed bysampling of the liquids. Measurement of the tracer dilution ratio allow thedetermination of the water and condensate flow rates. Combining these liquid flowrates with the venturi meter readings and the correlation predicting the effect of theentrained liquids on the readings, enable the condensate gas ratio and water to gasratio to be determined. Using the established CGR and WGR, the raw venturi

readings can be interpreted continuously in terms of gas, water and condensate flowrates, until such time that the liquid to gas ratio has substantially changed.
o
Figure 1. Wet Gas Metering Technique
To date various investigators have proposed expressions to describe the effect ofentrained liquid on venturi or orifice meter readings[sl. However, as empiricalcorrelations should only be used within their corresponding experimental range, theapplicability of these expressions is limited as they have mainly been establishedfrom experiments at low to moderate pressures and flow rates as compared to fieldconditions. Furthermore, the most well known relationships of Murdock[41 and ●Chisholm[sl apply to orifice plates only.
Previous experiments at Coevorden[6~71, a field location in The Netherlands, haveshown that the overreading of an orifice meter measuring natural gas at pressuresaround 90 bar and liquid fractions up to 4% by volume closely followed thecoinciding predictions by Murdock and Chisholm. H_owever, their apparent similarityat around 90 bar is a coincidence as extrapolation shows that for all other pressureseach correlation gives a different predicted overreading. In addition the venturi metershowed a higher overreading than the orifice meter.
The experimental test range covered at Coevorden, however, was still relativelylimited. Although natural gas at high pressure could be tested, variations in pressurewere limited. The corresponding flow conditions were all located in a small part ofthe flow map: stratified wavy flow with almost no entrainment. Therefore, acomprehensive experimental data set on the performance of a venturi flow meter in
North Sea Flow Measurement Workshop ’97 2

4
#
●
wet gas flow was called for. Such a data set was gathered at the SINTEF MultiphaseFlow Laboratory in Trondheim, Norway[81. The test envelope at this facility coveredthe majority of the wet gas flow conditions to be encountered in the field. Theresulting data set allowed a better correlation to be developed, which is presented inthis paper.
2. THE TEST SET-UP
●
The wet gas venturi tests were conducted at the SINTEF Multiphase FlowLaboratory, located near Trondheim, Norway. The line pressure of this large scalefacility could be varied between approximately 15 and 95 bar. The entire system wasinsulated and heat traced to keep the temperature constant at around 30 “C. The flowloop was equipped with a horizontal, as well as a vertical riser section. The overalllength of the loop was about 1 km. Single phase volumetric flow rates could bevaried between 26 and 11,000 m3/d for the liquid and between 1,200 and 35,000m3/d actual for the gas. All tests were performed with diesel oil as the liquid andnitrogen as the gas phase. The 4 inch test venturi had an inner pipe diameter of 97.18mm and a throat diameter of 39 mm, resulting in a beta ratio of 0.401. As the nominalpipe diameter of the test loop was 8 inch, 70 D of 4 inch pipe was installed upstreamof the venturi meter and 20 D downstream. This formed a 4 inch test section whichhad been located in the horizontal section of the test loop, approximately 850 metersfrom the beginning of the loop and 70 meters upstream from the inlet of the riser.
The venturi meter was equipped with 4 differential pressure transmitters. Two formeasuring the differential pressure over the throat of the venturi, for the flow ratecalculation, and two for measuring the overall pressure loss across the meter.Pressure and temperature transmitters were also provided, as well as a single energygamma densitometer. The densitometer was used to monitor the liquid level in thepipe in order to get an indication when a new flow condition had reached the venturisection. As the total upstream length consisted of approximately 850 meters of 8 inchpipe this could take more than half an hour, depending on the actual flow velocities.
After a flow condition .at the venturi section had stabilised two measurements weretaken, separated by approximately 5 minutes. An individual measurement consistedof 2 minutes of data logging at a sample rate of 2 samples per second. After thelogging period the averages and the standard deviations were calculated and stored.
North Sea Flow Measurement Workshop ’97 3
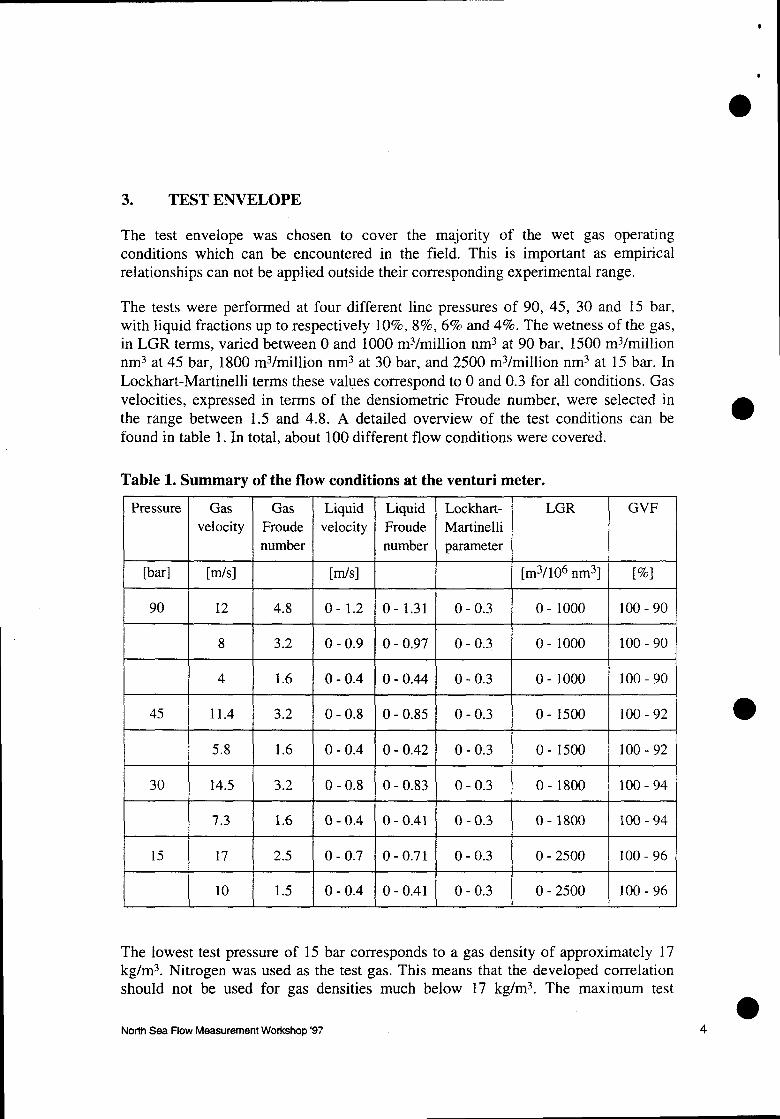
3. TEST ENVELOPE
The test envelope was chosen to cover the majority of the wet gas operatingconditions which can be encountered in the field. This is important as empiricalrelationships can not be applied outside their corresponding experimental range.
The tests were performed at four different line pressures of 90, 45, 30 and 15 bar,with liquid fractions up to respectively 109Z0,8~0, 6~0and 4~o. The wetness of the gas,in LGR terms, varied between O and 1000 mq/million nmq at 90 bar, 1500 m~/millionnms at 45 bar, 1800 mq/million nmg at 30 bar, and 2500 mg/million nm3 at 15 bar. InLockhart-Martinelli terms these values correspond to O and 0.3 for all conditions. Gasvelocities, expressed in terms of the densiometric Froude number, were selected inthe range between 1.5 and 4.8. A detailed overview of the test conditions can befound in table 1. In total, about 100 different flow conditions were covered.
Table 1. Summary of the flow conditions at the venturi meter.
Pressure Gas Gas Liquid Liquid Lockhart- LGR GVFvelocity Froude velocity Froude Martinelli
number number parameter
[bar] [m/s] [In/s] [m3/106 nm3] [%]
90 12 4.8 0- 1.2 0-1.31 0-0.3 0-1000 100-90
8 3.2 0-0.9 0-0.97 0-0.3 0-1000 100-90
4 1.6 0-0.4 0-0.44 0-0.3 0-1000 100-90
45 11.4 3.2 0-0.8 0-0.85 0-0.3 0-1500 100-92
5.8 1.6 0-0.4 0-0.42 0-0.3 0-1500 100-92
30 14.5 3.2 0-0.8 0-0.83 0-0.3 0-1800 100-94
7.3 1.6 0-0.4 0-0.41 0-0.3 0-1800 100-94
15 17 2.5 0-0.7 0-0.71 0-0.3 0-2500 100-96
10 1.5 0-0.4 0-0.41 0-0.3 0-2500 100-96
The lowest test pressure of 15 bar corresponds to a gas density of approximately 17kg/ins. Nitrogen was used as the test gas. This means that the developed correlationshould not be used for gas densities much below 17 kg/mq. The maximum test
North See Flow Measurement Workshop ’97

.
pressure was 90 bar, corresponding to a gas density of approximately 100 kg/m~.However, the new correlation is also valid for pressures above 90 bar as theoverreading reaches a well defined theoretical limit for conditions at which the gasdensity equals the liquid density.
The range of the Lockhart-Martinelli parameter from O to 0.3 corresponds to differentranges for the gas volume fraction and the liquid to gas ratio depending on the actualpressure. As can be seen from table 1. In fact, the minimum GVF, or the maximumLGR, increases at lower pressures. Basically, parameters like LGR or GVF are notparticularly suitable to compare specific flow conditions at different pressures. Therelationship between the GVF and, the Lockhart-Martinelli parameter (X) can beexpressed as:
GVF =Q, 1
r
Q:+ Q,=l+X L
P1
The relationship between the LGR and X as:
(1)
LGR=~=x- ‘g’w 1,000,000Q r
(2)g.lx Pg “Pl
Where ‘nc’ stand for normal conditions i.e. O *C and 101325 Pa. The LGR iscommonly expressed in ms of liquid per million m3 of gas at normal conditions.Often standard conditions are used of 15°C and 101325 Pa.
Wet gas flow conditions are best expressed in terms of their gas and liquiddensiometric Froude numbers, equations 3 and 4 respectively. These give a more
● consistent relationship between flow parameters and flow regimes, i.e. correspondingflow regimes are obtained by corresponding Froude numbers.
(3)
The ratio of liquid Froude number to gas Froude number is equal to the Lockhart-Martinelli parameter. This parameter has proven itself to be a successful correlationparameter in the area of multiphase flow.
r~=!!L AQg Pg
(=+,
~
North Sea Flow Measurement Workshop ’97
(5)
5
.
0
●
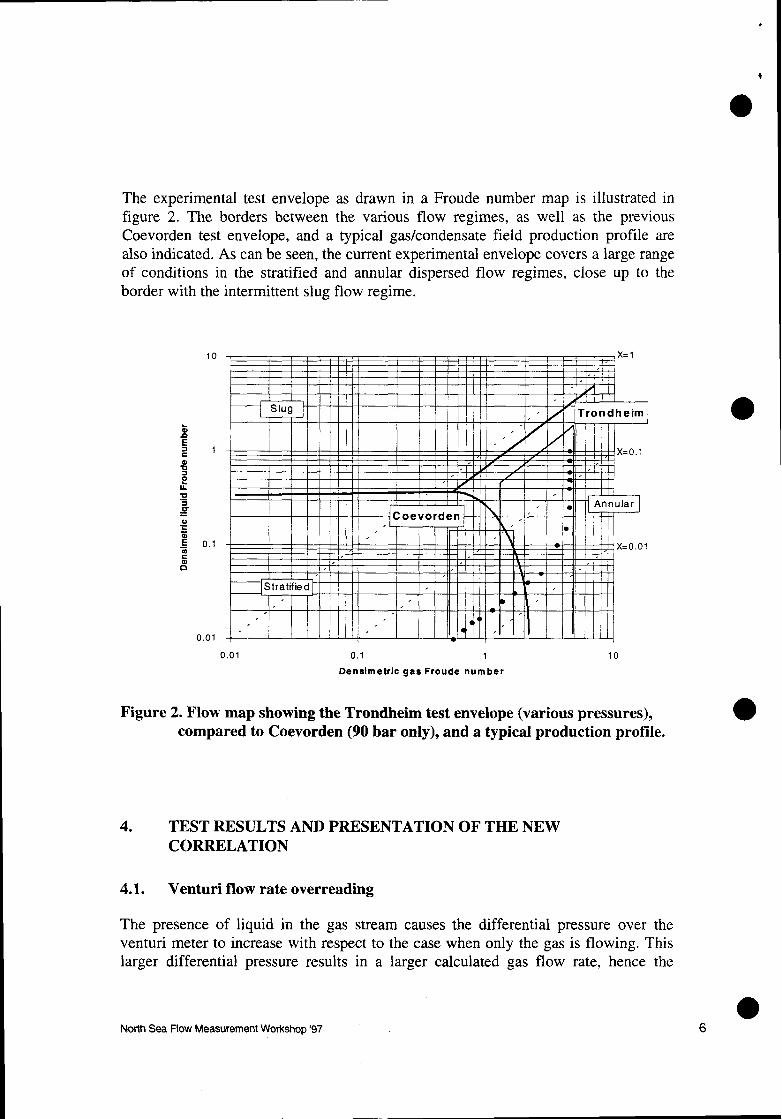
The experimental test envelope as drawn in a Froude number map is illustrated infigure 2. The borders between the various flow regimes, as well as the previousCoevorden test envelope, and a typical gas/condensate field production profile arealso indicated. As can be seen, the current experimental envelope covers a large rangeof conditions in the stratified and annular dispersed flow regimes, close up to theborder with the intermittent slug flow regime.
10
1
0.1
0.01
0.01 0.1 1 10
Densimetrlc gaa Froude number
Figure 2. Flow map showing the Trondheim test envelope (various pressures),compared to Coevorden (90 bar only), and a typical production profile.
4. TEST RESULTS AND PRESENTATION OF THE NEWCORRELATION
4.1. Venturi flow rate overreading
The presence of liquid in the gas stream causes the differential pressure over theventuri meter to increase with respect to the case when only the gas is flowing. Thislarger differential pressure results in a larger calculated gas flow rate, hence the
North Sea Flow Measurement Workshop ’97 6

.
venturi meter is said to “over-read”. In the following the term overreading will refer
to the ratio QtP/Q~ = (APWJAP~,Y)Y2.
Some typical test results are shown in figure 3. In this figure the venturi meteroverreading is plotted against the liquid fraction expressed in terms of the Lockhart-Martinelli parameter. The dependence of the overreading on the actual line pressure,or better on the gas density, can clearly be seen. The lower the pressure the higher theoverreading. At 15 bar and a Lockhart-Martinelli parameter of around 0.3 a venturimeter overreading of almost 1.8 is reached.
Figure 3 also shows the theoretical limit line. This line represents the condition forwhich the density of the gas phase equals that of the liquid. Consequently, theoverreading can never go below this line. Therefore, overreading curves for pressuresabove 90 bar have to lie between the 90 bar and the theoretical curve. The theoreticalline has been taken into account during the development of the correlation.
t
P.15 bar
I1 I I I I x-” I - i Ip=sobarl I1
P=45 bar
/ / “
o 0.05 0.1 0.15 0.2 0.25 0.3 0.35
Lockhan-Martinelli parameter (X)
Figure 3. Trondheim test results showing venturi overreading against liquidfraction, expressed as the Lockhart-Martinelli parameter. Frg = 3.2
The test results furthermore show that the venturi meter overreading is dependent onthe actual gas velocity, or gas Froude number. This is illustrated in figure 4, wherethe overreading is plotted for a single line pressure, but for two different gasvelocities, i.e. 12 rds and 6 rds, corresponding to gas Froude numbers ofapproximately 3.2 and 1.6, respectively. Without showing the similar graphs for all
North See Flow Measurement Workshop ’97 7

other pressures, it can be said that the lower the pressure the larger the spread. Thisdependence of the venturi meter overreading on the gas Froude number has not beenreported in any earlier publication. Hence, all previous reported correlations arelimited in their validity as none of them take this dependence into account.
1,6(I I
1.5
1.1
/“ ~ 1,, ,~, ,~, ,1, ,,~,o 0.05 0.1 0.15 0.2 0.25 0.3 0.35
Lockhan-Martinel II parameter (X)
Figure 4. Typical test results showing the venturi meter overreading at 45 barand two different gas velocities.
In particular, the experimental data shows that the well known relationships ofMurdock and Chisholm do not predict the correct venturi overreading. The reasonbeing, apart from the fact that they were originally developed for orifice plates, is that ●the Murdock equation neither takes the pressure nor the gas Froude numberdependence into account, while the Chisholm equation does not include the gasFroude number dependence.
4.2. Venturi overreadlng correlation
Based on the experimental data a new correlation for use with venturi meters hasbeen developed. The final relationship is given by equation 8. A more detailedderivation can be found in Appendix A.
...
North Sea Flow Measurement Workshop ’97
●8

●
n
[!()n
where: C = ~ + ~Pg P]
and (n = 0.606 I _ e47@”~g) for ~Fr 21.5 1 (8)
n=o.41 for 0.5 SFrg <1.5
Above relationship is valid for gas densities above 17 kg/m3 (up to the liquiddensity), gas Froude numbers above 0.5, and Lockhart-Martinelli parameters up to0.3.
A measure of how well the new venturi correlation describes the experimental data isshown in figure 5. This figure shows the absolute difference between the correlationand the actual test points. It can be seen that the difference stays within approximately*2%. The standard deviation of the difference is only 1Yo. Furthermore, the
individual differences have a zero mean and are normally distributed.
8%
6%
4%
2%.c0.-.s 0“/0zo
-2%
-4%
-6Y0
■ II
k II
-8%
1 1.1 1.2 1.3 1.4
Venturi over-reading
1.5 1,6 1.7 1.8
Figure 5. Plot of the difference between the developed correlation and theexperimental data expressed in percentage overreading. The results areplotted as a function of the actual overreading.
North Sea Flow Measurement Workshop ’97 9

?
To illustrate the difference between the new venturi correlation and the Murdock andChisholm expressions, a plot has been made, see figure 6, for a typical condition forwhich the gas density is 80 kg/m3 and the liquid density 7.00 kg/m3. As mentionedearlier, the Murdock and Chisholm relationships do not differ too much at thiscondition. In contrast the new correlation predicts a different overreading fordifferent gas Froude numbers, which leads to significant differences.
Gas Froude number
— 1.5 (4.3 m/s)
— 2 (5.7 mls)
~ 3 (8.6 ink.)
~ 5 (14,3 mLs)
- Murdock
— Chisholm
o 100 200 300 400 500 600 700 800 900 100+)
LGR [m3 per million nm3]
Figure 6. Illustrative comparison between the new venturi correlation and theMurdock and Chisholm orifice relationships, for the case pl=700 kg/m3and pg=80 kg/m3.
4.3. Venturi pressure loss ratio
The pressure loss across a venturi meter is larger in two-phase flow than in singlephase flow. Part of the energy which is transferred from the gas to the liquid phasewhen flowing through the inlet and throat sections, is not recovered in the diffusersection.
Some typical 90 bar test results are shown in figure 7, in which the venturi pressureloss ratio is plotted against the Lockhart-Martinelli parameter. The pressure loss ratiois defined as the ratio between the overall pressure drop across the meter divided bythe differential pressure over the throat. The results show that the pressure loss ratio
North Sea Flow Measurement Workshop ’97 10

●
depends on the actual liquid content. Similar to the venturi meter overreading, thepressure loss ratio also depends on the actual gas velocity or gas Froude number.
0.6
0.5j
0.1
0
_ -4. p=-=-- ==-== —-—>. A-- -=@-- — 0-
-e- —~
--- ~~c 1
—~— Vges. 12 tis
1—@J-vgas.8mk
‘o— Vgas.4 MS
o 0.05 0.1 0.15 0.2 025 0.3
Lockhert-h!a?tin elllparemeter (X)
Figure 7. Test results at 90 bar showing the venturi pressure loss ratio againstthe Lockhart-Martinelli parameter for various gas velocities.
The potential for the pressure loss measurement is to use it as a means to determinethe liquid content of the flow, from which the overreading factor can be determinedaccordingly. In essence this would form a simple two-phase flow meter. To date,however, no acceptable correlation formula has yet been found which would relate
● the pressure loss ratio to the actual liquid content and the overreading. Additionalexperiments might be required.
Although the exact behaviour is not yet known, the pressure loss ratio can still beused to monitor changes in the liquid content. This can be an important feature whenusing the tracer dilution technique for measuring the liquid content. Only when thepressure loss ratio has indicated a significant change in the liquid content, tracermeasurements have to be organised.
The sensitivity of the pressure loss ratio to the actual liquid content is not constant,but varies depending on the actual wetness and line pressure. The sensitivity, which isequal to the slope of the curves, is adequate in the lower wetness range, but decreaseswith increasing wetness. The change in sensitivity with pressure can be seen in figure8 where the pressure loss ratio measurements at 45 bar are shown. In this case thepressure loss ratio becomes virtually independent of the liquid content for Lockhart-Martinelli parameters larger than approximately 0.15.
North Sea Flow Measurement Workshop ’97 11

,/
e
0.6
0.5
0.1
0o 0.05 0.1 0.15 0.2 0.25 0,3
Lockhati-MarIinelll parameter (X)
Figure 8. Test results at 45 bar showing the venturi pressure loss ratio againstthe Lockhart-Martinelli parameter.
5. TRACER METHOD STATUS
To determine the liquid content of the gas stream a method based on the tracerdilution technique has been developed, which was the subject of an earlier paper[41presented at the North Sea Flow Measurement workshop in 1994. A schematic of thetechnique is included in figure 1, A suitably chosen tracer is injected into the flowingstream at a precisely metered rate. Downstream of the injection point, where the ●tracer has mixed thoroughly with the fluid, a liquid sample is taken. From the tracerdilution ratio and the injection rate the liquid flow rate can be determined.
Using different tracers the water and condensate flow rates can be measured atregular intervals. As the wetness is expeeted to change only gradually with time onceor twice a year is expected to be sufficient. More regular measurements, however,could be required during the beginning of the field to establish the wetness behaviourover time.
Over the last number of years various field trials with the tracer method have beendone to prove the technique under actual conditions. An overview of the test results isgiven in figure 9, which shows the deviation between the tracer and the referencemeasurements. It can be seen that the deviations are well within the target range of105%. Taking into account that the plotted deviation is in fact the combined
North Sea Flow Measurement Workshop ’97 12

4
.
@
uncertainty of the tracer method and the reference measurements, the uncertainty ofthe tracer method itself is even better.
After the field trials the tracer technology was licensed to SGS Redwood at EllesmerePort, UK, and Petrotech as. at Haugesund, Norway, making the tracer methodcommercially available to the industry.
1c%
5%
-5%
-10%
- 15%
F=l❑ Auk
Q Beykm
H
1 10 Irxl 1,0W3 1O,coo
Liquidflow rate [m3/d]
Figure 9. Overview of the various field tests, showing the deviation between thetracer method and reference measurements.
6. CONCLUSION
An empirical correlation to determine the overreading effect of the liquid phase onventuri meter readings in wet gas horizontal flow has been derived, which is in partsimilar to the Chisholm equation for orifice plates. The correlation is based on anextensive experimental data set, gathered at the SINTEF Multiphase Flow Laboratoryin Trondheim, Norway, covering a wide range of wet gas flow conditions. The
developed correlation describes the experimental data set better than *2% absolutewith a standard deviation of 1%, using only two free parameters. The theoreticaloverreading limit occurring at the (high) pressure for which the gas density equals theliquid density is exactly predicted. The relationships originally developed by
North Sea Flow Measurement Workshop ’97 13
Murdock and Chisholm for orifice plates do not predict the venturi overreadingcorrectly.
The experiments at SINTEF were done using a 4 inch venturi meter with a beta ratioof 0.4. Test fluids used were nitrogen and diesel oil. As the new relationship isempirical, different venturi dimensions and fluid properties should in principle bestudied for their effect. However, these effects are expected to be minimal.Experiments by earlier investigatorsIQl with orifice plates showed no significant effectof the beta ratio. Moreover, the effect of different dimensions is basically accountedfor as dimensionless Froude numbers are used. The data from the previous Coevordentests, beta ratio 0.4, nominal line size 3 inch, and natural gas and water as test fluids,overlap with the SINTEF data for similar flow conditions.
The liquid content of the gas stream can be determined by means of the tracerdilution technique. Field trials at a number of different locations have demonstratedthat the water and condensate flow rate can be measured within the target uncertaintyof 10~o. Using the new correlation this means that the gas flow rate can be correctedto within approximately 2% to 49Z0,depending on the actual liquid content. Atpresent, the tracer method is commercially available through two licensed servicecompanies, Petrotech as. in Norway and SGS Redwood in the UK. Continuousmonitoring of variations in the liquid contentpressure loss ratio.
7. LIST OF SYMBOLS AND UNITS
B venturi beta ratio (= d/D)
c variable defined in eq. 4
D internal pipe diameter
Fr~ densiometric gas Froude number
Fr, densiometric liquid Froude number
g gravitational constant
LGR Liquid to Gas Ratio
n variable defined in eq. 5
P pressure
North Sea Flow Measurement Workshop ’97
can be done by measuring the venturi
[-1
[-1
[m]
[-1
[-1
[rn/s2]
[m3/106 nm3]
[-1
[Pa]
●14
.
●
●
liquid flow rate
gas flow rate
gas flow rate calculated using the two-phase pressure drop
liquid, gas density
liquid, gas superficial velocity
Lockhart-Martinelli parameter
8. REFERENCES
[1]
[2]
[3]
[4]
[5]
[6]
[7]
[8]
[9]
[m3/s]
[m3/s]
[m3/s]
[kg/m3]
[In/s]
[-1
De Leeuw, H., “Venturi meter performance in wet gas flow,”Proceedings Multiphase ’97 conference, Cannes, Jun. 1997.
De Leeuw, H., “Wet gas flow measurement using a combination ofventuri meter and a tracer technique,” North Sea Flow MeasurementWorkshop, Peebles, Scotland, Oct. 1994.
Lin, Z.H., “Two-phase flow measurements with orifices,” Encyclopediaof Fluid Mechanics, vol. 3, Gulf Publishing Company, Houston, Texas,1986, pp. 841-862.
Murdock, J.W., “Two phase flow measurement with orifices,” Journal ofBasic Engineering, December 1962.
Chisholm, D., “Two phase flow through sharp-edged orifices,” Researchnote, Journal of Mechanical Engineering Science, 1977.
Nederveen, N., Washington, G.V., Batstra, F.H., “Wet gas flowmeasurement,” SPE 19077, June 7-91989.
Washington, G., “Measuring the flow of wet gas,” North Sea Flow
Measurement Workshop, Haugesund, Norway, Oct. 1991.
De Leeuw, H., “High pressure wet gas experiments at SINTEFNorway,” Internal report, July 1994.
Mattar, L., Aziz, K., Gregory, G., “Orifice metering of two phase flow,”SPE paper 7411, Oct. 1978.
● North Sea Flow Measurement Workshop ’97 15

APPENDIX A DERIVATION OF THE VENTURI CORRELATION
The experimental data presented in this paper shows that the well known relationshipsof Murdock and Chisholm do not predict the correct venturi overreading. The reasonbeing, apart from the fact that they were developed for orifice plates, is that theMurdock equation neither takes the pressure nor the gas Froude number dependenceinto account, while the Chisholm equation does not include the gas Froude numberdependence. This can be seen clearly if the Murdock and Chisholm relationships arewritten in terms of the Lockhart-Martinelli parameter (X).
Murdock’srelationship:
~=1+1.26XQ,
Chisholrn’srelationship:
(A-1)
$=~~ whereC=[’J”+(’~x (forx<l) (*+
It shows that the overreading predicted by the Murdock equation only depends on theLockhart-Martinelli parameter. The effect of pressure and gas Froude number on theoverreading, as illustrated in the figures 3 and 4, can therefore not be predicted. TheChisholm equation does take the line pressure into account via the C parameter whichcontains the gas density, but the explicit gas Froude number dependence shown infigure 4 is not predicted.
The general shape of the Chisholm curve, however, closely resembles those of theexperimental curves. In particular the observed small curvature at low liquid fractions ●is well predicted. In fact, the experimental data for a single gas Froude number andline pressure can be described very well by the Chisholm equationfactor.
Furthermore, it was found that a general form of Chisholm’sparameter C,
non~=lln+fiPg PI
could be used to describe
by tuning the C
relationship for
(A-3)
the pressure effect for a specific gas Froude number byselecting the right magnitude for parameter n. This is illustrated in figure A 1. A fixedvalue for n thus describes the overreading curves for a single gas Froude number butfor the whole pressure range.
PJorth Sea Flow Measurement Workshop ’97

+
-1
●Appendix A
8
5
4
3
L_.2J-_ c=m”+(fd I- [P, ) \Pl) —1--- -
I /
/’L
Froude no. 4.8
❑
t
2!’
o 0.02 0.04 0.06 0.08 0.1 0.12 0.14 0.16 0.18 0.2
Gss densityILiquid density
Figure Al. Resulting C values for the complete data set as a function of thedensity ratio and gas Froude number.
The theoretical limit condition is included automatically. When the gas density equalsthe liquid density C is equal to 2, independently of n. With C equal to 2, equation A-2and A-3 exactly describe the theoretical line which holds for dense phase conditions,i.e. very high pressures.
All the resulting values for n, which are obtained by fitting equation A-3 to the data,are shown in figure A2. These values were fitted with the following empiricalrelationship:
(~ = 0.606 1– e47w”Rg ) for Frg 21.5 (A-4)
The complete SINTEF data set has now been described by using only two freeparameters, i.e. 0.606 and 0.746.
The value of n for gas Froude numbers between 0.5 and 1.5 is derived from theprevious Coevorden data set and was foundtobe0.41. As indicated in figure A2, theCoevorden test envelope partly overlaps with the SINTEF one, but extends furtherdown to lower gas Froude numbers.
North See Flow Measurement Workshop ’97 A2

Appendix A
0.6
0.5
0.4
c~
% 0.3~>
0.2
0.1
0
0 0.5 1 1.5 2 2.5 3 3.5 4 4.5 5
Gaa Froude number
Figure A2. Resulting n values for both the Trondheim and Coevorden data.
The overlapping conditions are well predicted by the new correlation. However, theCoevorden results for Froude numbers below 1.5 show that the value of n does notdecrease any further and stays constant at about 0.41. This effect is attributed to thefact that the Coevorden flow conditions were all in the stratified flow regime with aconstant, but almost zero entrainment. At higher Froude numbers n increases as theentrainment increases.
The final relationship to calculate the venturi meter overreading is given by formula ●A-5. The relationship is valid for gas densities above 17 kg/ins (up to the liquiddensity), gas Froude numbers above 0.5, and Lockhart-Martinelli parameters up to0.3.
and n = 0.606(1- t?m’7%’Fr’) for Frg 21.5
}
(A-5)
n= O.41 for 0.5<Frg <1.5
North Sea Flow Measurement Workshop ’97 A3●