Embed Size (px)
Citation preview
7/30/2019 Paper-2 a Novel Graph Based Clustering Approach for Network Intrusion Detection
http://slidepdf.com/reader/full/paper-2-a-novel-graph-based-clustering-approach-for-network-intrusion-detection 1/10
International Journal of Computational Intelligence and Information Security, April 2013, Vol. 4 No. 4,ISSN: 1837-7823
12
A Novel Graph Based Clustering Approach for Network Intrusion
Detection
D.P.J eyepalan1 E.Kirubakaran2 1 Research Scholar, School of Computer Science, Engineering and Applications,
Bharathidasan University, Tiruchirappalli, Tamilnadu, India.
2 Additional General Manager, SSTP (Systems), Bharat Heavy Electricals Ltd,
Tiruchirappalli, India.
Abstract
Detecting the vulnerabilities in a network plays a vital role in the prevention of intrusions in a system. This paper
describes a cluster based mechanism for detecting vulnerabilities and in turn intrusions. The network is analyzed and
a graph is constructed representing the entire network. This graph is passed to a clustering algorithm that clusters the
nodes. This process of clustering is basically an elimination of edges, hence providing the number of clusters or the
shape of the cluster before the processing is not necessary. This process helps us in sorting out the outliers. These
outliers are the nodes that have the maximum vulnerability of being attacked. Analysis shows that our process has an
accuracy rate of 0.91375.
Keywords: Intrusion detection; clustering; graph based clustering
1. Introduction
Due to the increase in amount of network related transactions, network related crimes have also shown a rapid
increase. These crimes take the form of attacking a target system directly or stealing information during online
transactions. In either of the forms, a computer forms the base of the attack. This system is called the compromised
node. Detecting these compromised nodes is a very important issue in intrusion detection. The compromised nodes
has the ability to perform malicious activities like sniffing of packets, performing Denial of Service (DoS) attacks,
transmitting viruses/worms and much worse, converting other computers into compromised nodes. All other systemswithin the network become vulnerable to attacks due to the presence of a compromised node. Hence it becomes
mandatory to black list these nodes and either remove them from the network or monitor its activities for malicious
behavior and restore the system to its initial state.
Increase in the usage of data mining techniques in the areas of intrusion detection has led to the increase in amount
of specialized algorithms for detecting intrusion. Some of these include, association rule mining algorithm,
frequency scene rule mining algorithm, classification algorithm, and clustering algorithm. The first three algorithms
belong to the supervised learning category. These algorithms require training datasets describing all behaviors. Only
after applying this training dataset, the system will be able to detect anomalies. While clustering algorithm comes
under the unsupervised learning category. These types of algorithms do not depend on training data, instead they use
similarity grouping to recognize the odd one out.
The rest of this paper is organized as follows. Section 2 describes the related works and section 3 describes the
overall system architecture and an outline of the complete functioning of the system. Section 4 describes the actual
intrusion detection mechanism in detail, section 5 shows the obtained results and their analysis and section 6
provides the conclusion.

7/30/2019 Paper-2 a Novel Graph Based Clustering Approach for Network Intrusion Detection
http://slidepdf.com/reader/full/paper-2-a-novel-graph-based-clustering-approach-for-network-intrusion-detection 2/10
International Journal of Computational Intelligence and Information Security, April 2013, Vol. 4 No. 4,ISSN: 1837-7823
13
2. Related Works
In general, detection of an anomaly focuses mainly on monitoring and recording the user’s behavior. This helps us
detect unusual behavior from the normal behavior. Any kind of behavior that deviates from the normal behavior is
labeled as an anomaly or intrusion. Typical conventional anomaly detection researches [1, 2, 3] have used statistical
approaches. The statistical methods have the strong point that the size of a profile for real-time intrusion detection
can be minimized. However, the usage of statistical operators alone cannot provide best results. Further detection of false positives cannot be avoided. Furthermore, the statistical methods cannot handle infrequent but periodically
occurring activities.
Leonid Portnoy [4] introduced a clustering algorithm to detect both known and new intrusion types without the need
to label the training data. A simple variant of singlelinkage clustering to separate intrusion instances from the normal
instances was used. Though this algorithm overcomes the shortcoming of number of clusters dependency, it requires
a predefined parameter of clustering width W which is not always easy to find. The assumption that "the normal
instances constitute an overwhelmingly large portion (>98%)" is also too strong. In [5], Qiang Wang introduced
Fuzzy-Connectedness Clustering (FCC) for intrusion detection based on the concept of fuzzy connectedness which
was introduced by Rosenfeld in 1979. FCC can detect the known intrusion types and their variants, but it is difficult
to find a general accepted definition of fuzzy affinity which was used by FCC.
3. SYSTEM ARCHITECTURE
The process of Intrusion detection can be performed as described in the Figure 1.
Figure 1: I ntrusion Detection Mechanism
The initial phase deals with creating a graph for proceeding with the processing. Every system in a network is
considered as a node and every connection between the systems is marked as an edge. A complete graph is created
along with the weight details for future analysis. The graph is analyzed using the weight values provided and all
related nodes are grouped together to form clusters [10]. After the formation of clusters, the cluster analysis [6] is
performed, in which every cluster is checked for outlying items, i.e. items that are at farthest reach from the cluster
centre. These are isolated and are considered to be the vulnerable nodes. After this process, monitoring of the nodes
is performed, and if traffic anomalies were detected, then the node is labeled as an intruder.
7/30/2019 Paper-2 a Novel Graph Based Clustering Approach for Network Intrusion Detection
http://slidepdf.com/reader/full/paper-2-a-novel-graph-based-clustering-approach-for-network-intrusion-detection 3/10
International Journal of Computational Intelligence and Information Security, April 2013, Vol. 4 No. 4,ISSN: 1837-7823
14
4. Clustering Based Intrusion Detection
The Clustering based Intrusion Detection can be performed in four phases, graph creation, cluster creation, cluster
analysis and monitoring.
The graph creation phase initially marks all the nodes and edges. All systems that come under the considered
network form the nodes of the graph. The connections between these nodes form the edges of the graph. Since, all
the systems have two way connections, the edges in the graph represent two way paths. The distances between these
nodes form the weights of the graph.
LetG =(V ,E) be a graph whereV andE are, respectively, its set of nodes and edges. The number of nodes of G isn.
Each edge is represented by a pair (i, j ), where i and j are nodes fromV . Consider A =[aij ]n×n to be the adjacency
matrix of graphG. Each element of the adjacency matrix has a binary value, representing the relationship between
two nodes. Thus,aij =1 if nodes i and j are adjacent, i.e., if there is an edge linking node i to node j , and aij =0
otherwise. This paper deals with weighted graphs. LetW = [wij ]n×n be the weight matrix for the edges of a
weighted graphG. The elementwij of this matrixWis defined as the weight of the edge that links nodei to node j. If
there is no edge between a pair of nodes i and j, thenwij =0. The degree of a node i, degi , from an unweighted or
weighted graph, is calculated considering the number of its adjacent objects. It is given by
1
degn
i ij j
a=
= ∑
A measure that evaluates the clustering tendency in graphs is known as clustering coefficient. It is based on the
analysis of three node cycles around a nodei. A formulation of this measure for unweighted graphs is given by
1
1 12
deg (deg 1)
n n
ij jk ik j k j
i
i i
a a ac
−
= = +=
−
∑ ∑
Note that 1 1
1
j k j
j i k i
n n
ij jk ika a a= = +
≠ ≠
−
∑ ∑ corresponds to the number of triangles around node i. the degree degi
indicates the total number of neighbors of node i. The denominator measures the maximum possible number of
edges that could exist between the vertices within the neighborhood.
This measure evaluates the tendency of the nearest neighbors of nodei to be connected to each other.
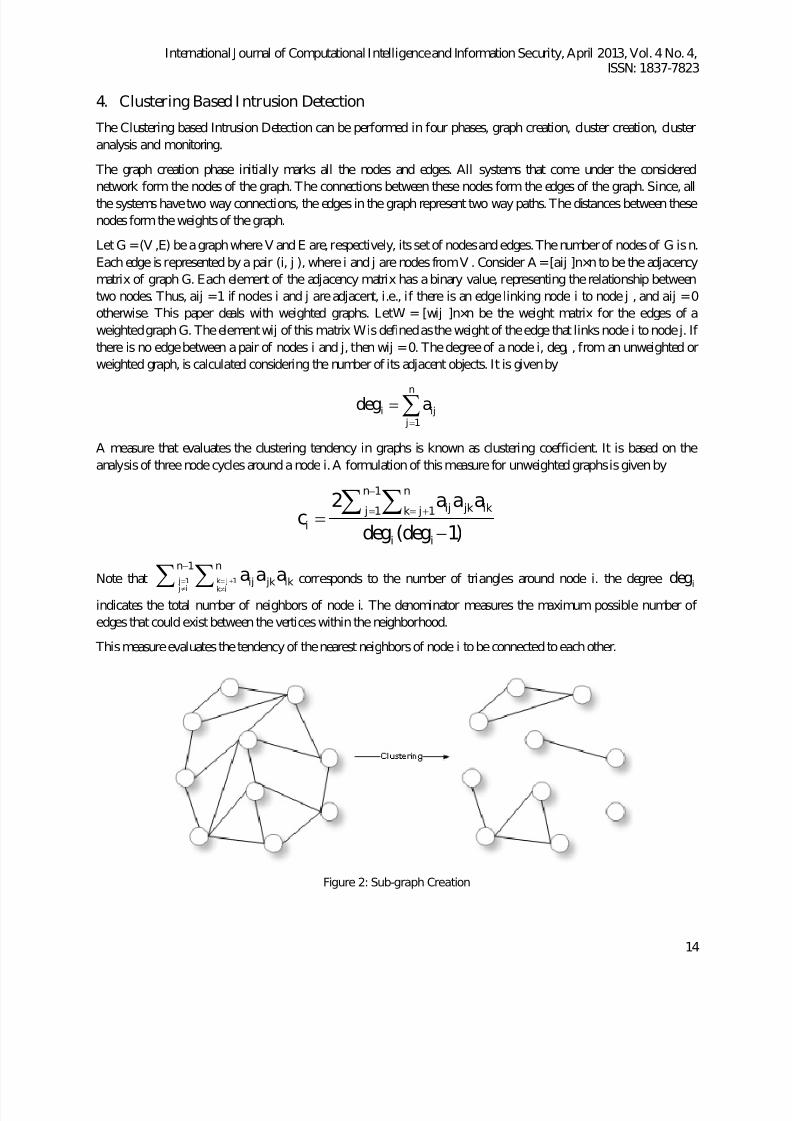
Figure 2: Sub-graph Creation

7/30/2019 Paper-2 a Novel Graph Based Clustering Approach for Network Intrusion Detection
http://slidepdf.com/reader/full/paper-2-a-novel-graph-based-clustering-approach-for-network-intrusion-detection 4/10
International Journal of Computational Intelligence and Information Security, April 2013, Vol. 4 No. 4,ISSN: 1837-7823
15
After constructing the graph, clustering is performed. The process of clustering divides the graph into several sub-
graphs. Clustering [7]&[8] is performed by providing a threshold value δ , which is calculated using the formula
min (max min) PCδ = + − ×
Where, min and max represent the minimum and maximal value of matrix A (adjacency matrix) respectively, and
CP represents theCluster Precision. So an edge is cut down from this graph if its value of weight is greater thanthreshold δ . This results in the formation of subgraphs.
Cluster analysis phase performs the process of detecting the probable outlier from the subgraphs. The following
aspects are considered while performing the outlier detection.
For any positive integer k, the k-distance of object p, denoted as k-distance (p), is defined as the distance d (p, o)
between p and object o D∈ such that:
• For at least k objects ' \ { }o D p∈ , it holds that ( ) ( ), ,' dd p po o≤
• For at most k-1 objects ' \ { }o D p∈ , it holds that ( ) ( ), ,' dd p po o< .
Given the k-distance of p, the k-distance neighborhood of p contains every object whose distance from p is not
greater than the k-distance.
N k– distance (p) = { q є D{p} | d(p,q) <k-distance (p) }
These objects q are called the k-nearest neighbors of p.
Given the k-distance of p, and p is a center of circle with radius k. All objects in this circle are k-distance
neighborhood of p. p’ is the centre of mass of this circle. So theLocal Deviation Rateis defined as:
tan ( )
( , ' )| |( ) k di s ce p
dis p pNk pLDR
−=
The dis(p, p’) is the distance between object p and centre of mass p’.
Given the k-distance neighborhood of p and LDR, theLocal Deviation Coefficient is defined as:
( )tan ( )
tan ( )| |( )
k oo Nk dis ce p
k dis ce p
LDR
Nk pLDC ∈ −
−
∑=
Intuitively, LDC is sum of the LDR of k distance neighborhood of p. The coefficient reflects the degree of
dispersion of an object’s neighborhood. Greater value of LDC means higher probability of one object being an
outlier. On the other hand, a low LDC value indicates that the density of an object’s neighborhood is high. So it’s
hardly to be an outlier. All probable outliers are shortlisted in this phase. After the completion of this phase, comes
the monitoring phase. All the shortlisted nodes that are considered vulnerable for attacks are monitored for attacks or
abnormal activities. The traffic flow to and from these nodes are monitored. I f any abnormalities were discovered,then cleanup is performed on the node for removing the vulnerabilities.

7/30/2019 Paper-2 a Novel Graph Based Clustering Approach for Network Intrusion Detection
http://slidepdf.com/reader/full/paper-2-a-novel-graph-based-clustering-approach-for-network-intrusion-detection 5/10
International Journal of Computational Intelligence and Information Security, April 2013, Vol. 4 No. 4,ISSN: 1837-7823
16
Figure 3: Intrusion Detection mechanism
5. Result Analysis
The current process is evaluated with various sets of data containing different number of data items and the obtained
values are recorded in a confusion matrix.
Table 1: Confusion Matrix
Predicted
Positive Negative
Actual Positive TP FP
Negative TN FN
Where,
TP - True positive, FP- False positive, TN – True Negative and FN – False Negative.
The two performance measures, sensitivity and specificity are used for evaluating the results.
Sensitivity is the accuracy on the positive instances (equivalent to True Positive Rate-TPR)
where TP is True Positive and FN is False Negative.
Specificity is the accuracy of the negative instances (equivalent to False Positive Rate-FPR)

7/30/2019 Paper-2 a Novel Graph Based Clustering Approach for Network Intrusion Detection
http://slidepdf.com/reader/full/paper-2-a-novel-graph-based-clustering-approach-for-network-intrusion-detection 6/10
International Journal of Computational Intelligence and Information Security, April 2013, Vol. 4 No. 4,ISSN: 1837-7823
17
where TN is True Negative and FP is False Positive.
Figure 4: A sample confusion matrix set with TPR and FPR
The simulation is conducted with KDD-Cup 99 dataset. The process was broken at regular intervals to find the
values of TP, FP, TN and FN. These function as the basis for calculating the TPR and FPR. These readings are
tabulated and the ROC [9] is plotted (Fig 5).
From Figure 5, we can see that during the initial stages, when the number of entries are minimal, the plots point to
0,0 and 0,1 points. As the number of entries keep increasing, we can see that the plotted points are clustered towards
the northwest corner and are above the diagonal. This proves that this process provides a high level of accuracy,
almost meeting the perfect standard of 0,1.
Figure 5: ROC Plot
0
0.1
0.2
0.3
0.4
0.5
0.6
0.7
0.8
0.9
1
0 0.2 0.4 0.6 0.8 1
T
P
R
FPR

7/30/2019 Paper-2 a Novel Graph Based Clustering Approach for Network Intrusion Detection
http://slidepdf.com/reader/full/paper-2-a-novel-graph-based-clustering-approach-for-network-intrusion-detection 7/10
International Journal of Computational Intelligence and Information Security, April 2013, Vol. 4 No. 4,ISSN: 1837-7823
18
Precision is the fraction of retrieved instances that are relevant, whilerecall is the fraction of relevant instances that
are retrieved. Both precision and recall are therefore based on an understanding and measure of relevance. Hence we
can use this measure to find the relevance of the readings.
Figure 6: PR Curve
Usually, precision and recall[9] scores are not discussed in isolation. Instead, either values for one measure are
compared for a fixed level at the other measure or both are combined into a single measure, such as their harmonic
mean the F-measure, which is the weighted harmonic mean of precision and recall.
2.recall
recall
precisionF
precision
⋅=
+
This is also known as the 1F measure, because recall and precision are evenly weighted.
It is a special case of the general - F β measure (for non-negative real values of β ):
2
2(1 ).
recall
recall
precisionF
precision β β
β
⋅= +
+
Two other commonly used F measures are the2
F measure, which weights recall higher than precision, and
the 0.5F measure, which puts more emphasis on precision than recall.
The F-measure was derived by van Rijsbergen (1979) so that F β
"measures the effectiveness of retrieval with
respect to a user who attaches β times as much importance to recall as precision".
It is based on van Rijsbergen's effectiveness measure.
0
0.1
0.2
0.3
0.4
0.5
0.6
0.7
0.8
0.9
1
0 0.2 0.4 0.6 0.8 1
P
r
e
c
i
s
i
o
n
Recall

7/30/2019 Paper-2 a Novel Graph Based Clustering Approach for Network Intrusion Detection
http://slidepdf.com/reader/full/paper-2-a-novel-graph-based-clustering-approach-for-network-intrusion-detection 8/10
International Journal of Computational Intelligence and Information Security, April 2013, Vol. 4 No. 4,ISSN: 1837-7823
19
11
1E
P R
α α = −
−+
Their relationship is 1F E β = + where2
1 1
α β
=
+
Figure 7: Precision, Recall and F-Measure – Sample values
6. Conclusion and Discussions
Discovering attacks in a network plays an important role in the management of a network. The attacks take place by
exploiting the vulnerabilities in a network node. Faster detection of these vulnerabilities helps in better network
maintenance. Analysis shows that our proposed system provides faster and more accurate detection rates when
compared to the existing methodologies [1][2][3][4][5].
Figure 8: Total number of nodes present Vs nodes detected for vulnerabilities
0
10
20
30
40
50
60
70
80
90
100
1 2 3 4 5 6 7 8 9 10
N
o
o
f
n
o
d
e
s
Instance number
No of nodes in network
No of nodes detected for
vulnerabilities

7/30/2019 Paper-2 a Novel Graph Based Clustering Approach for Network Intrusion Detection
http://slidepdf.com/reader/full/paper-2-a-novel-graph-based-clustering-approach-for-network-intrusion-detection 9/10
International Journal of Computational Intelligence and Information Security, April 2013, Vol. 4 No. 4,ISSN: 1837-7823
20
Figure 8 shows the detection rate of our algorithm. 15% of the total nodes show abnormalities.
Figure 9: No of nodes detected for vulnerabilities Vs Actual number of nodes attacked
Figure 9 shows the actual number of nodes detected for monitoring the vulnerabilities versus actual number of nodes
attacked. We can see that our algorithm has managed to detect most of the nodes that are vulnerable. Our system
shows a detection percentage of 84.91729.
Here, the F-Measure of our values shows a rate of 0.84833 and we obtain an average accuracy rate of 0.91375.
Further, we can see that our proposed structure reduces the amount of nodes that are to be monitored, hence
reduction in the amount of processing is observed. Further, the number and shape of the clusters is not defined.Hence any type of network can be used for the clustering process. The current process can be further fine tuned by
incorporating artificial intelligence into the system. This can help create an evolutionary system that can learn new
types of attacks and evolve in time.
7. REFERENCES
[1] Harold S.Javitz and Alfonso Valdes, "The NIDES Statistical Component Description and Justification,"
Annual Report, SRI International, 333 Ravenwood Avenue, Menlo Park, CA 94025, March 1994.
[2] Phillip A. Porras and Peter G. Neumann, "EMERALD: Event Monitoring Enabling Responses to
Anomalous Live Disturbances," 20th NISSC, October 1997.
[3] H.S. J avitz, A. Valdes, "The SRI IDES Statistical Anomaly Detector," IEEE Symposiumon Research in
Security and Privacy, May 1991.
[4] Portnoy, L., Eskin, E., Stolfo, S, “Intrusion Detection with Unlabeled Data Using Clustering”, ACM CSS
Workshop on Data Mining Applied to Security, pp. 5–8. ACM Press, Philadelphia, 2001.
[5] Qiang, W., Vasileios, M, “A Clustering Algorithm for Intrusion Detection”, The SPIE Conference on Data
Mining, Intrusion Detection, Information Assurance, and Data Networks Security, Florida, vol. 5812, pp.
31–38, 2005.
0
5
10
15
20
25
30
1 2 3 4 5 6 7 8 9 10
N
u
m
b
e
r
o
f
n
o
d
e
s
Instance number
No of nodes detected for
vulnerabilities
Actual no of nodes
attacked

7/30/2019 Paper-2 a Novel Graph Based Clustering Approach for Network Intrusion Detection
http://slidepdf.com/reader/full/paper-2-a-novel-graph-based-clustering-approach-for-network-intrusion-detection 10/10
International Journal of Computational Intelligence and Information Security, April 2013, Vol. 4 No. 4,ISSN: 1837-7823
21
[6] Joshua Oldmeadow, Siddarth Ravinutala1, and Christopher Leckie, “Adaptive Clustering for Network
Intrusion Detection” PAKDD 2004, LNAI 3056, pp. 255–259,Springer-Verlag, Berlin Heidelberg, 2004.
[7] XlONG J iajun, LI Qinghua, TU Jing, “A Heuristic Clustering Algorithm for Intrusion Detection Based on
Information Entropy”,Wuhan University Journal Of Natural Sciences, Vol. 11 No. 2 2006 355-359, 2006.
[8] Maria C.V. Nascimento, Andre C.P.L.F. Carvalho, J, “A Graph Clustering Algorithm Based On A
Clustering Coefficient For Weighted Graphs”, Brazil Computer Society, 17: 19–29 DOI 10.1007/s13173-
010-0027, 2011.
[9] Jesse Davis, Mark Goadrich, “The Relationship Between Precision-Recall and ROC Curves”, Proceedings
of the 23 rd International Conference on Machine Learning, Pittsburgh, PA, 2006.
[10] Sang-Hyun Oh and Won-Suk Lee, Z.-H. Zhou, H. Li, and Q. Yang (Eds.), “Anomaly Intrusion Detection
Based on Dynamic Cluster Updating”, PAKDD 2007, LNAI 4426, pp. 737–744, Springer-Verlag, Berlin
Heidelberg, 2007.