Embed Size (px)
Citation preview

2017
PANORAMA OF FOOD AND NUTRITION
SECURITY IN LATIN AMERICA AND
THE CARIBBEAN


Published by the Food and Agriculture Organization of the United Nations and the Pan American Health Organization
Santiago de Chile, 2017
2017PANORAMA OF
FOOD AND NUTRITION
SECURITY IN LATIN AMERICA
AND THE CARIBBEAN

COVER PHOTO: ©FAO
COMUNIDAD LAS FLORES, ALTA VERAPAZ, GUATEMALA. Acelerando el progreso del empoderamiento económico de las mujeres rurales en Guatemala.
CITATION:FAO and PAHO. 2017. Panorama of Food and Nutrition Security in Latin America and the Caribbean. Santiago de Chile.
PROGRESS IN LATIN AMERICA AND THE CARIBBEAN FOR THE
FULFILLMENT OF SUSTAINABLE DEVELOPMENT GOALS
2 AND 3The designations employed and the presentation of material in this information product do not imply the expression of any opinion whatsoever on the part of the Food and Agriculture Organization of the United Nations (FAO), or of the Pan American Health Organization (PAHO) concerning the legal or development status of any country, territory, city or area or of its authorities, or concerning the delimitation of its frontiers or boundaries. The mention of specific companies or products of manufacturers, whether or not these have been patented, does not imply that these have been endorsed or recommended by FAO or PAHO in preference to others of a similar nature that are not mentioned. The views expressed in this information product are those of the author(s) and do not necessarily reflect the views or policies of FAO or PAHO.
ISBN 978-92-5-130056-5 (FAO)
ISBN 978-92-75-11973-0 (PAHO)
© FAO and PAHO, 2017
FAO and PAHO encourage the use, reproduction and dissemination of material in this information product. Except where otherwise indicated, material may be copied, downloaded and printed for private study, research and teaching purposes, or for use in non-commercial products or services, provided that appropriate acknowledgement of FAO and PAHO as the source and copyright holder is given and that FAO’s and PAHO’s endorsement of users’ views, products or services is not implied in any way.
All requests for translation and adaptation rights and for resale and other commercial use rights should be made via www.fao.org/contact-us/licence-request or addressed to [email protected].
FAO information products are available on the FAO website (www.fao.org/publications) and can be purchased through [email protected].
Publications of PAHO are available on the website (www.paho.org).

| iv |
CONTENTSPROLOGUE VII
CHAPTER 1PROGRESS IN LATIN AMERICA AND THE CARIBBEAN FOR THE FULFILLMENT OF SUSTAINABLE DEVELOPMENT GOALS 2 AND 3 1
SDG 2: End hunger, achieve food security and improved nutrition and promote sustainable agriculture sostenible 4
SDG 3: Ensure healthy lives and promote well-being for all at all ages 18
CHAPTER 2ANALYSIS OF THE DIMENSIONS OF FOOD AND NUTRITION SECURITY 27
AVAILABILITY The region has maintained a good performance inagriculture, allowing it to have more than enoughfood for the total population 28
The region has the potential to promote supply with the growing intraregional food trade 32
Adequate amounts of food do not ensure a healthyand nutritious diet 40
Food trade policies and healthy diets 41
ACCESS 46
The current socioeconomic situation conditionsprogress, in the eradication of hunger in LatinAmerica and the Caribbean 46
Inadequate progress in income distribution maydelay the achievement of food and nutritionsecurity 48
Food prices and income are the main determinants inthe adoption of healthy diets by the most vulnerablepopulation 50
Social protection policies to ensure access to food:evidence from Conditional Cash Transfer Programmes (CCT) 66
UTILIZATION 71
Access to drinking water and basic sanitation isessential to ensure good nutritional status 71
Great inequality in coverage of drinking water andsanitation persists in rural areas and among thepoorest population groups 75
Water and sanitation policies 75
STABILITY AND SUSTAINABILITY 84
The effects of climate change increase the risks foragriculture, but agriculture also contributes to climatechange 84
Natural disasters in Latin America and the Caribbeanhave a significant effect on agriculture andlivelihoods 90
Climate change adaptation policies for family farming 93
BIBLIOGRAPHY 98
ANNEX 1: CLIMATE-CHANGE RELATED RISKS, DRIVERS AND EFFECTS ON FNS, AND MEASURES TO FACE SUCH RISK 103

Panorama of Food and Nutrition Security in Latin America and the Caribbean is an annual publication put together by the United Nations Regional Office for Latin America and the Caribbean of the Food and Agriculture Organization (FAO), in collaboration with the Pan American Health Organization /Regional Office for the Americas of the World Health Organization (PAHO/WHO).
This edition was prepared under the coordination of Ricardo Rapallo, FAO Food Security Officer, and Rubén Grajeda, Senior Advisor on Nutrition and Social Determinants at PAHO/WHO. Drafting and editing was under the responsibility of FAO staff members Sandra Caprile, Giovanni Carrasco, Francisca Nahmías and Giovanna Zamorano.
Support in the process of preparation of this document was provided by FAO staff members Cosimo Avesani, Félix Baquedano, Verónica Boero, Pablo Faret, Alejandro Grinspun, Ana Islas Ramos, Areej Jafari, Andrea Polo Galante, Israel Ríos, Silvia Saravia, Jung Eun Sohn, Eugenia Stefanelli, Florence Tartanac and Rob Vos; and PAHO/WHO staff members Fabio Gomes da Silva and Nadia Rosas.
Special thanks to FAO staff members Stefano Anibaldi, Benjamín Labatut, Germán Rojas, Marta Ramón, Maximiliano Valencia and Mariana Young, for their support in the editing, diagramming and dissemination of the document.
| vi |

FOREWORDFOREWORD
The Panorama of Food and Nutrition Security in Latin America and the Caribbean 2017, published by the Food and Agriculture Organization of the United Nations (FAO) and the Pan American Health Organization (PAHO), reports for the first time on the progress made by countries in the Region towards the Sustainable Development Goals (SDGs).
The new figures shows that, after years of marked improvement, progress in the eradication of hunger and malnutrition in the Region has stalled. After over a decade of substantive advance in the reduction of hunger, the Region first experienced a downturn in the 2011-2013 period, after which an increase in both the prevalence and the number of undernourished people has been observed. If Latin America and the Caribbean do not resume the positive trend soon, the SDG 2 target of ending hunger and all forms of malnutrition by 2030 will not be met.
In addition, there is evidence of a constant and alarming rise in overweight and obesity, both risk factors for non-communicable diseases and the leading cause of morbidity and mortality in the Region, which have a serious effect on the well-being of the population, leading to consequences that force States and governments to spend huge amounts of funds that could otherwise be used for other social needs.
On the other hand, the Region has taken significant steps to eradicate child malnutrition, and to decrease the maternal, neonatal and under-five mortality rate, as well as the mortality caused by non-communicable diseases, indicating that the Region is still on a good path to meet the first two targets of SDG 3.
This f irst measurement of the progress made in the Region towards the SDGs raises a red f lag, indicating that countries must improve the quality of their policies and programmes, increase investments urgently, and involve the entire society.
Latin American and Caribbean countries have officially adopted the commitment to end hunger by 2025, v ia the comprehensive implementation of the Plan for Maternal, Infant and Young Child Nutrition, endorsed by the World Health Organization, the Plan for Food, Nutrition and Hunger Eradication of the Community of Latin American and Caribbean States (CELAC), and the Hunger-Free Latin American and Caribbean Initiative.
To a large extent, both hunger and malnutrition, as well as overweight and obesity are the consequence of food systems that have undergone fast and profound changes since the 1980s. Although these changes have brought multiple benefits to our countries, the increased consumption of ultra-processed foods has also contributed to a rise in overweight, obesity and non-communicable diseases, indicating an urgent need to design public policies that transform food systems and ensure healthy diets. The Region must advance towards policies, legal and regulatory frameworks,
| vii |

Julio A. BerdeguéRegional Representative for Latin America and the Caribbean
Food and Agriculture Organization of the United Nations (FAO)
Dr. Carissa F. EtienneDirector of the Pan American Health Organization (PAHO) Regional Director, Regional Office of the World
Health Organization (WHO) for the Americas
programmes and interventions that promote the consumption of safe, diverse and nutritious foods as well as healthy and active life styles.
In view of the Panorama 2017 edition, FAO and PAHO urge countries to transform their food systems to stop the progress of hunger and malnutrition, with a special focus on the most vulnerable people, households and territories. Only through a huge regional effort will the current trend be reversed, returning to the path that turned Latin America and the Caribbean into an example of the fight against hunger and malnutrition in all its forms for the rest of the world.
| viii |

© FAO

3
Key messagesè Undernourishment in Latin America and the Caribbean increased in the last measurement period. After several years of stagnation, in 2016 approximately 42.5 million people did not have enough food to cover their daily calorie intake needs, accounting for an increase of 2.4 million people; that means an increase of 6% of the population being undernourished compared to the previous year.
è If this trend continues, Latin America and the Caribbean will not attain the goal of ending hunger and malnutrition by 2030, set in the Sustainable Development Goals (SDGs). This imposes a sense of urgency on the actions required for overcoming both hunger and malnutrition.
è While undernutrition declines, overweight and obesity have become an important health issue for Latin America and the Caribbean. Rising rates of adult obesity are observed, while overweight affects 7% of children under 5 years of age in Latin America and the Caribbean, a percentage that is above the global average of 6%.
CHAPTER 1 PROGRESS IN
LATIN AMERICA AND THE
CARIBBEAN FOR THE
FULFILLMENT OF
SUSTAINABLE DEVELOPMENT
GOALS 2 AND 3

The 2030 Agenda envisions a fairer world, including the realization of human rights focused on equality and inclusion, favouring sustainable development in the economic, social and environmental fronts. In this context and in the framework of the United Nations, 17 Sustainable Development Goals (SDGs) and their 169 targets were approved in 2015, to overcome a set of issues currently affecting countries around the world (FAO and PAHO, 2017).
Ratify ing the SDGs implies having to consolidate a multidimensional v iew of development, where well–being is conceived as involving the attainment of a series of broad and interrelated goals rather than just the specific reduction of certain phenomena, such as poverty and hunger (UNDP, 2016). This entails a comprehensive vision and approach, as the attainment of some of the goals will also depend on the achievement and progress made in others. For instance, Goal 2,
CHAPTER 1
PROGRESS IN LATIN AMERICA AND THE CARIBBEAN FOR THE FULFILLMENT OF SUSTAINABLE DEVELOPMENT GOALS 2 AND 3
End hunger, achieve food security and improved nutrition and promote sustainable agriculture undertakes to go even further than just ending hunger and malnutrition by promoting access to healthy diets. This is in turn directly linked to Goal 3, Ensure healthy lives and promote well–being for all at all ages, which is essential for improving the population’s nutrition and quality of life.1
Bearing in mind the wide variety of interconnections between goals 2 and 3, this chapter is aimed at reviewing some of the targets involved in these goals, based on the available information provided by the indicators (see Box 1) and their explicit l ink to hunger and malnutrition, thus describing the status of Latin America and the Caribbean with a view to 2030.
1. There is no doubt regarding the close links between SDGs 1, 2 and 3. The relationship between poverty and hunger has been broadly revised in previous versions of Panorama, while the relationship between SDGs 2 and 3 was analyzed in the 2016 edition of this publication.
| 2 |

PANORAMA OF FOOD AND NUTRITION SECURITY IN LATIN AMERICA AND THE CARIBBEAN
One of the greatest challenges posed by the SDGs is the availability of information and establishing the methodology required for the appropriate monitoring of SDG progress and achievement. After selecting 232 indicators for monitoring the 17 SDGs, efforts are being made to review and develop methods for the collection and treatment of the information required for their reconstruction.
One of the most important commitments of the 2030 Agenda is ensuring that “no one is left behind”. This calls for enhancing understanding and knowledge about the most vulnerable groups. Therefore, SDG indicators should be broken down as far as possible, by income, sex, age, race, ethnicity, migratory status, disability and geographic location, or by other characteristics that may be required (United Nations, 2017c).
At present, the disaggregated data required to identify the needs of all population groups is still scarce. This has led to a global effort aimed at improving data
integrity and increasing the availability of such information, in terms of coverage, quality and frequency. Therefore, it is necessary to consider that this process will take time, and that as we gain more knowledge and information, the adjustments and improvements required will be made. It is worth noting that the monitoring of the SDGs will be based on national and standardized data, involving a coordinated effort between national and international statistic systems (United Nations, 2016).
Indicators have been temporarily classified in three levels, based on the available methods and information:a) Level I: Indicators having an established methodology and available data.b) Level II: Indicators having an established methodology but not enough available data.c) Level III: Indicators with methodologies still under development.
Currently, about 65% of SDG indicators are levels I and II (United Nations, 2017c).
BOX 1 ON SDG INDICATORS
2017PANORAMA OF FOOD AND NUTRITION SECURITY IN LATIN AMERICA AND THE CARIBBEAN
| 3 |

CHAPTER 1 PROGRESS IN LATIN AMERICA AND THE CARIBBEAN FOR THE FULFILLMENT OF SUSTAINABLE DEVELOPMENT GOALS 2 AND 3
SDG 2: END HUNGER, ACHIEVE FOOD SECURITY AND IMPROVED NUTRITION AND PROMOTE SUSTAINABLE AGRICULTURE SOSTENIBLE
TABLE 1 TARGETS AND SELECTED INDICATORS FOR SDG 2
Targets Indicators
2.1 By 2030 end hunger and ensure access by all people, in particular the poor and people in vulnerable situations including infants, to safe, nutritious and sufficient food all year round.
2.1.1 Undernourishment prevalence
2.1.2 Prevalence of moderate or severe food insecurity in the population, according to the Food Insecurity Experience Scale.
2.2 By 2030, end all forms of malnutrition, including achieving by 2025, the internationally agreed targets on stunting and wasting in children under five years of age, and address the nutritional needs of adolescent girls, pregnant and lactating women, infants and the elderly.
2.2.1 Stunting prevalence (low height for age, standard deviation < -2 from the average growth patterns in children, of the World Health Organization (WHO) among children under the age of 5.
2.2.2 Malnutrition prevalence (low weight for height, standard deviation > +2 or < -2 from the average growth patterns in children, established by the WHO) among children under the age of 5, broken down by type (wasting and overweight).
SOURCE: Report by the Inter–Agency and Expert Group on SDG Indicators (IAEG–SDGs) (United Nations, 2017c).
Eradicating hunger and all forms of malnutrition is closely linked to the characteristics of dietary patterns (FAO and PAHO, 2017), which in turn have implications for the structure of food systems. This section will explore goals 2.1 and 2.22, described in Table 1. Other areas that are part of SDG 2, related to food production and other relevant areas of food and nutrition security shall be developed in the second chapter of this publication.3
2 It is important to note that only 6 of the 15 indicators of SDG 2 are currently classified under Level I, and 4 of them are applicable to targets 2.1 and 2.2 (United Nations, 2017c).3 For further details, review previous editions of Panorama of Food and Nutrition Security in Latin America and the Caribbean. Available at: http://www.fao.org/americas/recursos/panorama/en/.
| 4 |

PANORAMA OF FOOD AND NUTRITION SECURITY IN LATIN AMERICA AND THE CARIBBEAN 2017PANORAMA OF FOOD AND NUTRITION SECURITY IN LATIN AMERICA AND THE CARIBBEAN
TARGET 2.1: END HUNGERTarget 2.1 focuses on access to food (FAO, IFAD and WFP, 2016). It has two indicators: i) the prevalence of undernourishment, which was also used to monitor target 1C of the Millennium Development Goals (indicator 2.1.1), based on the estimated proportion of the population that fails to meet their minimum daily energy requirements for healthy liv ing; and ii) the prevalence of moderate or severe food insecurity, based on the Food Insecurity Experience Scale (indicator 2.1.2), referred to a person’s capacity to access food (see Box 2).
The latest estimates of undernourishment show a global increase. After over a decade of declining rates, in 2015 the number of undernourished people rose to 777 million people from 775.4 million in 2014; and 2016 showed a significant rise of 38 million people, resulting in 815 million undernourished people worldwide. Therefore, the percentage of undernourishment rose from 10.6% in 2015 to 11% in 2016 (Figure 1).
Latin America and the Caribbean is part of this trend. In 2016 a prevalence of 6.6% was observed in undernourishment, accounting for the first increase recorded since this measurement was performed (Figure 1). Therefore, 42.5 million people lack the food required to cover their daily energy needs, accounting for an increase of 2.4 million people, or an increase of 6% of the
SOURCE: FAO, IFAD, UNICEF, WFP AND WHO, 2017.NOTE: * projected values.
FIGURE 1PREVALENCE OF UNDERNOURISHMENT IN THE WORLD, LATIN AMERICA AND THE CARIBBEAN AND SUBREGIONS, ANNUAL FIGURES, 2000–2016
14.714.2
11.5 11.2 11 10.8 10.7 10.611
12
9.1
6.8 6.6 6.4 6.3 6.3 6.3 6.6
0
2
4
6
8
10
12
14
16
2000 2005 2010 2011 2012 2013 2014 2015 2016
World Latinamerica and the Caribbean
*
8.1 8.37.1 7.2 7.1 7.1 6.9 6.7 6.5
12.2
7.9
5.4 5.1 4.8 4.7 4.8 5 5.6
23.8 23.3
19.9 19.3 19.4 19.2 18.9 18.417.7
0
5
10
15
20
25
2000 2005 2010 2011 2012 2013 2014 2015 2016
Mesoamerica South America Caribbean
*
| 5 |

CHAPTER 1 PROGRESS IN LATIN AMERICA AND THE CARIBBEAN FOR THE FULFILLMENT OF SUSTAINABLE DEVELOPMENT GOALS 2 AND 3
undernourished population versus the previous year. The foregoing shows the urgency of implementing actions to reverse the trend and channel efforts with a view to eradicate hunger.
On the other hand, FAO also shows indicators for SDG 2.1 in three–year time frames, to keep transitory phenomena from increasing the indicator’s volatility (FAO, 2014b). Figure 2 shows the progression of undernourishment in the region.4 There has been a stagnation in the proportion of undernourished people since the triennium 2011–13; although, there is an increase in the last estimation period.
As will be shown later, a large part of this result is explained by South America, as it concentrates a larger part of the region’s population. In addition, over the last few years, Latin America and the Caribbean has faced an unfavourable economic scenario. For two consecutive years, they recorded economic downturns, influenced in part by the trajectory in primary commodity prices, which was felt differently in each subregion. Thus, South America influenced a great part of the regional performance, because several countries that are exporters of raw materials faced lower demand and lower prices. On the contrary, Mesoamerica and the Caribbean faced less exposure, given the trade connections that both subregions have with the United States. They also benefited from the low prices of some commodities as they are net primary commodity exporters (FAO, 2017a). Overall, this situation increased inflation in some economies, lead to higher unemployment or job insecurity, and increased the number of people living in poverty in the last few years, raising concern regarding the impacts that this entails for food and nutrition security.5
A subregional analysis confirms what was mentioned earlier. The plateauing decline in regional undernourishment depends greatly on the rise in undernourishment observed in South America (Figures 3 and 4). In South America, the affected population in 2014–16 is 5.1%, showing an increase of 0.3 percentage points versus the 4.8%
4 For the purposes of this document, the term “region” refers to Latin America and the Caribbean.5 For further information, see the section on access in chapter 2 of this document, and the 2016 edition of Panorama.
of the previous three–year period, resulting in 21.5 million undernourished people. Whereas, the proportion of undernourished people shows a small decline versus 2013–15, resulting in 6.7% for the triennium. However, it is important to note that between the 2010–12 and 2013–15 triennials, the proportion has remained at approximately 7%. In absolute terms, the number of undernourished people in Mesoamerica is 11.6 million. Finally, in the Caribbean, undernourishment was 18.3% in the last measurement, registering a decline versus the previous triennial. Undernourishment currently affects 7.7 million Caribbean people, showing a drop versus the previous triennium.
Country–level data confirms the heterogeneity of the region and helps to identify areas where the eradication of hunger shows greater lags (Table 2). Brazil, Cuba and Uruguay register a proportion of undernourished people under 2.5%, followed by Argentina, Barbados, Chile, Mexico, and Trinidad and Tobago; which are below or at 5%. Haiti is the country with the greatest proportion of undernourishment in the region, with nearly 47% of the population being unable to cover its minimum dietary requirements, accounting for almost 5 million undernourished Haitians, equal to more than half of the total affected people in the whole Caribbean region. Antigua and Barbuda, Bolivia and Grenada register an undernourishment rate above 20%.
The countries showing increases in the prevalence of undernourishment in the last period are Argentina, Ecuador, El Salvador, Grenada, Peru and Venezuela. Out of these countries, Venezuela is the one with the most significant increase, with 3.9 percentage points versus the previous triennium. In absolute terms, this implies an increase of 1.3 million people in Venezuela, largely explaining the higher prevalence observed in South America.
On the other hand, as may be observed in Table 2, 21 countries show a decline in the prevalence of undernourishment in the last triennium of the estimate.
As mentioned earlier, undernourishment is an estimate of energy deprivation measured in calories. Due to the new demands set by the 2030 Agenda the scope of this indicator needs to increase. Therefore, progress in hunger reduction
| 6 |

2017PANORAMA OF FOOD AND NUTRITION SECURITY IN LATIN AMERICA AND THE CARIBBEAN
SOURCE: FAO, IFAD, UNICEF, WFP AND WHO, 2017. NOTE: * 2016 values are projected.
FIGURE 2EVOLUTION OF UNDERNOURISHMENT IN LATIN AMERICA AND THE CARIBBEAN, TRIENNIALS FROM 2000–02 TO 2014–16. IN PERCENTAGES (LEFT) AND MILLIONS OF PEOPLE (RIGHT)
11.410.9
10.39.7
9.18.3
7.77.3 7.1 6.8 6.6 6.4 6.4 6.3 6.4
0
2
4
6
8
10
12
14
2000-02
2001-03
2002-04
2003-05
2004-06
2005-07
2006-08
2007-09
2008-10
2009-11
2010-12
2011-13
2012-14
2013-15
2014-16
Prevalence
60.758.7
56.654.0
50.947.5
44.6 42.8 41.7 40.9 40.0 39.4 39.3 39.6 40.7
0
10
20
30
40
50
60
70
2000
-02
2001
-03
2002
-04
2003
-05
2004
-06
2005
-07
2006
-08
2007
-09
2008
-10
2009
-11
2010
-12
2011
-13
2012
-14
2013
-15
2014
-16
Millions of people
| 7 || 7 || 7 |

CHAPTER 1 PROGRESS IN LATIN AMERICA AND THE CARIBBEAN FOR THE FULFILLMENT OF SUSTAINABLE DEVELOPMENT GOALS 2 AND 3
SOURCE: FAO, IFAD, UNICEF, WFP and WHO, 2017.
SOURCE: FAO, IFAD, UNICEF, WFP and WHO, 2017.
FIGURE 3EVOLUTION OF UNDERNOURISHMENT IN LATIN AMERICA AND THE CARIBBEAN SUBREGIONS, 2000–02 TO 2014–16. IN PERCENTAGES
FIGURE 4EVOLUTION OF UNDERNOURISHMENT IN SUBREGIONS, 2000–02 TO 2014–16. IN MILLIONS OF PEOPLE
8.9
11.0
40.8
8.9
11.7
26.9
7.9
11.7
20.4
7.9
11.8
19.6
7.8
11.8
20.0
7.7
11.6
21.5
0
10
20
30
40
50
60
70
2000-02 2005-07 2010-12 2012-14 2013-15 2014-16
Caribbean Mesoamerica South America
23.722.6
19.6 19.2 18.8 18.3
7.8 7.87.1 7.0 6.9 6.7
11.5
7.1
5.1 4.8 4.8 5.1
0
5
10
15
20
25
Caribbean Mesoamerica South America
2000-02 2005-07 2010-12 2012-14 2013-15 2014-16
| 8 |

2017PANORAMA OF FOOD AND NUTRITION SECURITY IN LATIN AMERICA AND THE CARIBBEAN
By decision of UN member countries, FAO is the agency in charge of indicators for target 2.1 of the SDGs: By 2030, end hunger and ensure access by all people, in particular the poor and people in vulnerable situations including infants, to safe, nutritious and sufficient food all year round. To this end, FAO has worked on a more adequate metric to account for progress in SDG 2, and particularly target 2.1, aimed at identifying the population groups affected by hunger and food insecurity inside countries, including countries where hunger has already become a minor issue.
To meet this goal, the Food Insecurity Experience Scale (FIES) supplements the prevalence of undernourishment indicator, thus allowing a better characterization of hunger. Both indicators are related but not equivalent, given that their measurement targets and methodologies are different. Therefore, they call for a joint analysis to improve the understanding of hunger and food insecurity.
The prevalence of undernourishment estimates the percentage of people who fail to cover their energy requirements for healthy living. The inputs required for this estimate are: 1) average dietary energy consumption; 2) dispersion of dietary energy consumption; and 3) the minimum consumption threshold for healthy living. FAO is permanently working on improving its estimates, leading to methodological reviews and the expansion of available information. The estimates presented this year comprise a series of innovations versus previous estimates, which include:
- Improvements in energy supply estimates.- More updated estimates to measure the dispersion of consumed energy, using information based on the national surveys available.
- Updated estimates of energy requirements, after updating height, sex and gender data, via the information gathered in demographic and health surveys.
The FIES helps to estimate the prevalence of moderate and severe levels of food insecurity, using information gathered from surveys of people over 15 years of age. Thus, the FIES offers estimates on the proportion of the population that struggles to access food. In general terms, it is to be expected that the estimated prevalence of food insecurity experience and the prevalence of undernourishment should show similar trends. However, the FIES helps to detect the presence of broader issues linked to access restrictions. To this end, the instrument has 8 questions that help to determine the severity of food insecurity. These questions gather information about the last 12 months, on whether the person surveyed has been worried about not having enough food due to lack of money or other resources; whether he/she has been forced to decrease the quality or quantity of the food consumed; or whether he/she has gone whole days without eating.
To have comparable prevalence rates among countries, a global scale of FIES is determined and the country scales are then calibrated against the global scale, thus arriving at comparable severity metrics. For the first measurement period of this indicator, an average has been estimated for Latin America and for the Mesoamerica and South America subregions. In addition, there are national estimates for seven countries in the region. In the coming years, and within the framework of the development of the 2030 agenda, it is expected that there will be greater availability of information, in order to extend the coverage of the indicator to the rest of the LAC countries.
BOX 2 INDICATORS FOR A COMPREHENSIVE ANALYSIS OF FOOD AND NUTRITION SECURITY
SOURCE: FAO, IFAD, UNICEF, WFP and WHO, 2017.
| 9 |

CHAPTER 1 PROGRESS IN LATIN AMERICA AND THE CARIBBEAN FOR THE FULFILLMENT OF SUSTAINABLE DEVELOPMENT GOALS 2 AND 3
has been measured for the first time by means of the Food Insecurity Experience Scale (FIES).6 As pointed out in Box 2, these two indicators are complementary and provide a fuller picture of the hunger and food insecurity phenomena.
Figure 5 shows the estimates of the food insecurity prevalence indicator. As shown, in Mesoamerica, 5.7% of the population registers severe food insecurity for the 2014–16 triennium, accounting for 9.9 million affected people. While in South America, 5.1% of the population is afflicted by severe food insecurity, accounting for over 21 million on average for 2014–16.
6 Both estimates, the FIES and undernourishment, show strong degrees of correlation (FAO, IFAD, UNICEF, WFP and WHO, 2017). Although the two indicators account for the lack or deprivation of food, it is important to bear in mind that they involve different definitions, concepts and methodologies (see Box 2). For instance, drought and its consequences on food security may not be fully captured by the undernourishment indicator, given that the impacts of drought will be captured by the food balance sheets, if such information is available. The reason for this is that data collection does not capture such effects automatically. However, the FIES may capture short–term fluctuations in the conditions that affect access to food.
An analysis of the national estimates available shows that El Salvador and Guatemala register a proportion above 10%. Ecuador shows a prevalence of food insecurity of 6.6%, whereas Brazil, Chile, Costa Rica and Mexico register metrics under 5% on average for 2014–16.
A joint analysis of the two indicators for target 2.1 raises concern. In the first place, undernourishment has increased in the last triennials, whereas in previous triennials the decline in this indicator had stagnated or slowed down. Although there is no benchmark for severe food insecurity yet, because this is the first period it has been measured, it shows values that are in
SOURCE: FAO, IFAD, UNICEF, WFP and WHO, 2017.
FIGURE 5SEVERE FOOD INSECURITY STATUS IN LATIN AMERICA, 2014–16. IN PERCENTAGES (LEFT) AND MILLIONS OF PEOPLE
5.7
5.1
0.3
3.3
3.8
4.8
6.6
10.9
12.4
0 2 4 6 8 10 12 14
Mesoamerica
South America
Brazil
Mexico
Chile
Costa Rica
Ecuador
Guatemala
El Salvador
Prevalence (%)
9.9
21.4
0.7
4.2
0.7
0.2
1.1
1.8
0.8
0 5 10 15 20 25
Mesoamerica
South America
Brazil
Mexico
Chile
Costa Rica
Ecuador
Guatemala
El Salvador
Millions of people
| 10 |

2017PANORAMA OF FOOD AND NUTRITION SECURITY IN LATIN AMERICA AND THE CARIBBEAN
TABLE 2 EVOLUTION OF UNDERNOURISHMENT IN LATIN AMERICAN AND CARIBBEAN COUNTRIES, 2004–06 TO 2014–16. IN PERCENTAGES (LEFT) AND MILLIONS OF PEOPLE (RIGHT)
SOURCE: FAO, IFAD, UNICEF, WFP and WHO, 2017.
Prevalence (%) Millions of People
2004–06 2010–12 2012–14 2013–15 2014–16 2004–06 2010–12 2012–14 2013–15 2014–16
Antigua and Barbuda 31.5 27.8 27.1 27.2 26.7 <0.1 <0.1 <0.1 <0.1 <0.1 N/A
Argentina 4.7 3.9 3.6 3.4 3.6 1.9 1.6 1.5 1.5 1.6
Bahamas 10.0 11.9 10.7 10.3 10.0 <0.1 <0.1 <0.1 <0.1 <0.1 N/A
Barbados 5.9 4.9 4.6 4.5 4.4 <0.1 <0.1 <0.1 <0.1 <0.1 N/A
Belize 4.6 5.8 6.3 6.3 6.2 <0.1 <0.1 <0.1 <0.1 <0.1 N/A
Bolivia 30.3 24.6 21.9 20.8 20.2 2.8 2.5 2.3 2.2 2.2 =
Brazil 4.5 <2.5 <2.5 <2.5 <2.5 N/A 8.6 n.s. n.s. n.s. n.s. N/A
Chile 4.0 4.1 3.8 3.8 3.7 0.6 0.7 0.7 0.7 0.7 =
Colombia 9.7 10.9 8.8 7.7 7.1 4.2 5.0 4.2 3.7 3.4
Costa Rica 5.4 5.2 5.6 5.7 5.6 0.2 0.2 0.3 0.3 0.3 =
Cuba <2.5 <2.5 <2.5 <2.5 <2.5 N/A n.s. n.s. n.s. n.s. n.s. N/A
Dominica 5.7 5.6 6.1 6.0 5.8 <0.1 <0.1 <0.1 <0.1 <0.1 N/A
Dominican Republic 24.4 14.6 13.6 13.7 13.5 2.3 1.5 1.4 1.4 1.4 =
Ecuador 17 11.7 11.7 11.9 12.1 2.3 1.8 1.8 1.9 1.9 =
El Salvador 10.7 12.9 12.4 12.1 12.3 0.6 0.8 0.8 0.7 0.8
Grenada 27.8 25.5 25.3 25.4 25.5 <0.1 <0.1 <0.1 <0.1 <0.1 N/A
Guatemala 16 15.6 16.4 16.2 15.6 2.1 2.4 2.6 2.6 2.5
Guyana 9.1 11.0 9.4 8.9 8.5 <0.1 <0.1 <0.1 <0.1 <0.1 N/A
Haiti 57.1 49.6 49.4 48.2 46.8 5.3 5.0 5.2 5.1 5.0
Honduras 17.2 15.5 15.7 15.8 14.8 1.2 1.2 1.2 1.3 1.2
Jamaica 6.9 9.0 9.5 9.2 8.4 0.2 0.2 0.3 0.3 0.2
Mexico 5.5 4.6 4.5 4.4 4.2 6.1 5.5 5.5 5.5 5.4
Nicaragua 24.4 20.0 17.9 17.1 17.0 1.3 1.2 1.1 1.0 1.0 =
Panama 23.1 11.9 9.9 9.5 9.3 0.8 0.4 0.4 0.4 0.4 =
Paraguay 11.9 11.9 12.3 12.4 12 0.7 0.7 0.8 0.8 0.8 =
Peru 19.6 10.1 8.3 7.6 7.9 5.4 3.0 2.5 2.4 2.5
Saint Lucia 14.2 17.2 17.2 17.0 17.0 = <0.1 <0.1 <0.1 <0.1 <0.1 N/A
Saint Vincent and the Grenadines
9.1 6.4 6.0 6.0 6.0=
<0.1 <0.1 <0.1 <0.1 <0.1 N/A
Suriname 11.1 8.1 8.3 8.1 7.9 <0.1 <0.1 <0.1 <0.1 <0.1 N/A
Trinidad and Tobago
11.8 8.6 6.5 5.8 4.8 0.2 0.1 <0.1 <0.1 <0.1 N/A
Uruguay 4.3 <2.5 <2.5 <2.5 <2.5 N/A 0.1 n.s. n.s. n.s. n.s. N/A
Venezuela 10.5 3.7 6.5 9.1 13.0 2.8 1.1 2.0 2.8 4.1
Latin America and The Caribbean
9.1 6.6 6.4 6.3 6.4 50.9 40 39.3 39.6 40.7
Caribbean 23.4 19.6 19.2 18.8 18.3 9.1 7.9 7.9 7.8 7.7
Central America 8.3 7.1 7.0 6.9 6.7 12.3 11.7 11.8 11.8 11.6
South America 7.9 5.1 4.8 4.8 5.1 29.5 20.4 19.6 20.0 21.5
| 11 || 11 || 11 |
CHAPTER 1 PROGRESS IN LATIN AMERICA AND THE CARIBBEAN FOR THE FULFILLMENT OF SUSTAINABLE DEVELOPMENT GOALS 2 AND 3
line with those observed in undernourishment. This does not only call for enhancing the actions aimed at ensuring access to food both in terms of adequate quantity as well as quality, but also requires the acceleration and expansion of efforts to meet the 2030 goal. n
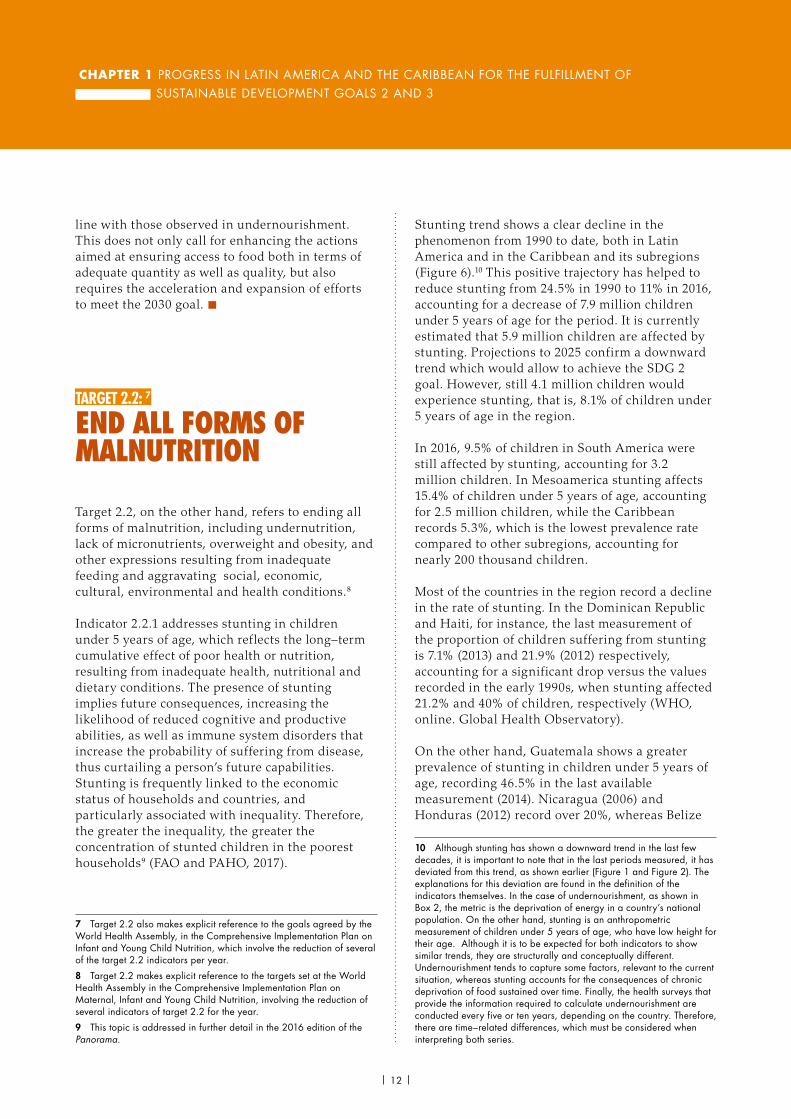
TARGET 2.2: 7 END ALL FORMS OF MALNUTRITION
Target 2.2, on the other hand, refers to ending all forms of malnutrition, including undernutrition, lack of micronutrients, overweight and obesity, and other expressions resulting from inadequate feeding and aggravating social, economic, cultural, environmental and health conditions.8
Indicator 2.2.1 addresses stunting in children under 5 years of age, which reflects the long–term cumulative effect of poor health or nutrition, resulting from inadequate health, nutritional and dietary conditions. The presence of stunting implies future consequences, increasing the likelihood of reduced cognitive and productive abilities, as well as immune system disorders that increase the probability of suffering from disease, thus curtailing a person’s future capabilities. Stunting is frequently linked to the economic status of households and countries, and particularly associated with inequality. Therefore, the greater the inequality, the greater the concentration of stunted children in the poorest households9 (FAO and PAHO, 2017).
7 Target 2.2 also makes explicit reference to the goals agreed by the World Health Assembly, in the Comprehensive Implementation Plan on Infant and Young Child Nutrition, which involve the reduction of several of the target 2.2 indicators per year.8 Target 2.2 makes explicit reference to the targets set at the World Health Assembly in the Comprehensive Implementation Plan on Maternal, Infant and Young Child Nutrition, involving the reduction of several indicators of target 2.2 for the year.9 This topic is addressed in further detail in the 2016 edition of the Panorama.
Stunting trend shows a clear decline in the phenomenon from 1990 to date, both in Latin America and in the Caribbean and its subregions (Figure 6).10 This positive trajectory has helped to reduce stunting from 24.5% in 1990 to 11% in 2016, accounting for a decrease of 7.9 million children under 5 years of age for the period. It is currently estimated that 5.9 million children are affected by stunting. Projections to 2025 confirm a downward trend which would allow to achieve the SDG 2 goal. However, still 4.1 million children would experience stunting, that is, 8.1% of children under 5 years of age in the region.
In 2016, 9.5% of children in South America were still affected by stunting, accounting for 3.2 million children. In Mesoamerica stunting affects 15.4% of children under 5 years of age, accounting for 2.5 million children, while the Caribbean records 5.3%, which is the lowest prevalence rate compared to other subregions, accounting for nearly 200 thousand children.
Most of the countries in the region record a decline in the rate of stunting. In the Dominican Republic and Haiti, for instance, the last measurement of the proportion of children suffering from stunting is 7.1% (2013) and 21.9% (2012) respectively, accounting for a significant drop versus the values recorded in the early 1990s, when stunting affected 21.2% and 40% of children, respectively (WHO, online. Global Health Observatory).
On the other hand, Guatemala shows a greater prevalence of stunting in children under 5 years of age, recording 46.5% in the last available measurement (2014). Nicaragua (2006) and Honduras (2012) record over 20%, whereas Belize
10 Although stunting has shown a downward trend in the last few decades, it is important to note that in the last periods measured, it has deviated from this trend, as shown earlier (Figure 1 and Figure 2). The explanations for this deviation are found in the definition of the indicators themselves. In the case of undernourishment, as shown in Box 2, the metric is the deprivation of energy in a country’s national population. On the other hand, stunting is an anthropometric measurement of children under 5 years of age, who have low height for their age. Although it is to be expected for both indicators to show similar trends, they are structurally and conceptually different. Undernourishment tends to capture some factors, relevant to the current situation, whereas stunting accounts for the consequences of chronic deprivation of food sustained over time. Finally, the health surveys that provide the information required to calculate undernourishment are conducted every five or ten years, depending on the country. Therefore, there are time–related differences, which must be considered when interpreting both series.
| 12 |

2017PANORAMA OF FOOD AND NUTRITION SECURITY IN LATIN AMERICA AND THE CARIBBEAN
SOURCE: WHO (online). Global Health Observatory (GHO) data.
FIGURE 6EVOLUTION OF STUNTING PREVALENCE IN LATIN AMERICA AND THE CARIBBEAN, BY SUBREGION. 1990 – 2025, IN PERCENTAGES
24.5
18.4
13.4
11.0
8.1
16.0
10.6
6.95.3
3.5
33.7
25.5
18.7
15.4
11.3
21.4
15.8
11.59.5
7.0
0
5
10
15
20
25
30
35
LAC Caribbean Mesoamerica South America
1990 2000 2010 2016 2025
(2011) and Panama (2008) record nearly 19%. Chile (2014), Santa Lucia (2012) and Costa Rica (2008) show the lowest rates in the region, with 1.8%, 2.5% and 5.6% respectively (Figure 7).
Indicator 2.2.2 addresses the co–existence of wasting and overweight in children under 5 years of age.11 Wasting is defined as low weight for height and it accounts for inadequate or insufficient nutrient intake in the short run. Wasting may also facilitate the presence of infections or diseases, implying a significant risk of mortality when not addressed early (FAO and PAHO, 2017). On the other hand, overweight resulting from unhealthy lifestyles involving excessive intake of food and/or calorie dense foods containing high levels of sodium and fat, leads to weight gain and the accumulation of fat, which is in turn linked to some non–communicable diseases (NCDs) that will be analyzed further below (FAO and PAHO, 2017).
Figures 8 and 9 show the status of the two phenomena at a regional and country level. As may be observed, in 2016 wasting affected 1.3% of
11 It should be noted that although the indicators for SDG 2 account for several forms of malnutrition, they do not capture some manifestations such as micronutrient deficiency. Box 4 provides information on the evolution of these indicators in the region.
children in Latin America and the Caribbean, with a prevalence below the values observed worldwide. The countries most affected by this phenomenon are Barbados, Guyana, Haiti and Trinidad and Tobago, with a prevalence above 5%.
Overweight affects 7% of children under 5 years of age in Latin America and the Caribbean, in a proportion that exceeds the global value. There is a concern for the increased risk of diseases and other health and psychosocial complications in childhood and adolescence, in addition to increasing the probability that an overweight child may present this situation in adulthood, and develop some NCDs such as cardiovascular diseases, diabetes or various types of cancer, which may lead to significant consequences for their health and personal development (see Box 3). n
| 13 |

CHAPTER 1 PROGRESS IN LATIN AMERICA AND THE CARIBBEAN FOR THE FULFILLMENT OF SUSTAINABLE DEVELOPMENT GOALS 2 AND 3
FIGURE 7EVOLUTION OF STUNTING PREVALENCE IN COUNTRIES OF LATIN AMERICA AND THE CARIBBEAN, BY SUBREGION. DIFFERENT YEARS, IN PERCENTAGES (LEFT AXIS) AND THOUSANDS OF CHILDREN (RIGHT AXIS)
SOURCE: WHO (online). Global Health Observatory (GHO) data.
0
50
100
150
200
250
300
0
5
10
15
20
25
HTI(2012)
BRB(2012)
DOM(2013)
CUB(2000)
JAM(2012)
TTO(2000)
LCA(2012)
Prevalence Number of children
Caribbean
0
500
1.000
1.500
2.000
0
10
20
30
40
50
GTM(2015)
NIC(2006)
HND(2012)
BLZ(2011)
PAN(2008)
SLV(2014)
MEX(2012)
CRI(2008)
Prevalence Number of children
Mesoamerica
0
200
400
600
800
1.000
1.200
1.400
0
5
10
15
20
25
30
ECU(2012)
BOL(2012)
PER(2014)
VEN(2009)
COL(2010)
GUY(2014)
PRY(2012)
URY(2011)
SUR(2010)
ARG(2005)
BRA(2007)
CHL(2014)
Prevalence Numbre of children
South America
| 14 |

2017PANORAMA OF FOOD AND NUTRITION SECURITY IN LATIN AMERICA AND THE CARIBBEAN
SOURCE: WHO (online). Global Health Observatory (GHO) data.
SOURCE: WHO (online). Global Health Observatory (GHO) data.
FIGURE 8PREVALENCE OF WASTING AMONG CHILDREN UNDER 5 YEARS OF AGE, LATIN AMERICAN, CARIBBEAN AND GLOBAL VALUES, IN 2016 (LEFT), AND IN COUNTRIES IN LATIN AMERICA AND THE CARIBBEAN, IN DIFFERENT YEARS (RIGHT).
FIGURE 9PREVALENCE OF OVERWEIGHT AMONG CHILDREN UNDER 5 YEARS OF AGE, LATIN AMERICAN, CARIBBEAN AND GLOBAL VALUES, IN 2016 (LEFT), AND IN COUNTRIES OF LATIN AMERICA AND THE CARIBBEAN (RIGHT).
0.9
1.3
1.3
3.0
7.7
0 2 4 6 8
Mesoamerica
LAC
South America
Caribbean
World
0.3
0.6
0.7
0.9
1.0
1.3
1.4
1.5
1.6
1.6
1.6
2.0
2.3
2.4
2.6
3.0
3.3
3.7
4.1
5.0
5.2
5.2
6.4
6.8
0 2 4 6 8
CHL(2014)
PER(2014)
GTM(2015)
COL(2010)
CRI(2008)
URY(2011)
HND(2012)
NIC(2006)
BRA(2007)
BOL(2012)
MEX(2012)
SLV(2014)
ECU(2012)
DOM(2013)
PRY(2012)
JAM(2012)
BLZ(2011)
LCA(2012)
VEN(2009)
SUR(2010)
HTI(2012)
TTO(2000)
GUY(2014)
BRB(2012)
6.0
6.0
6.9
7.0
7.4
0 2 4 6 8
Mesoamerica
World
Caribbean
LAC
South America
0.9
1.3
1.3
3.0
7.7
0 2 4 6 8
Mesoamerica
LAC
South America
Caribbean
World
| 15 |
CHAPTER 1 PROGRESS IN LATIN AMERICA AND THE CARIBBEAN FOR THE FULFILLMENT OF SUSTAINABLE DEVELOPMENT GOALS 2 AND 3
Obesity is a growingly widespread phenomenon in the region. According to the latest calculations, 24 countries in Latin America and the Caribbean record a proportion of obese people in values close to or above 20% of the population. For instance, in Uruguay, Antigua and Barbuda, Argentina and Trinidad and Tobago, nearly 29% of the population is obese; while Chile registers 30% and the Bahamas 32%. On the contrary, the lowest rates are observed in Haiti, with 11%, and Honduras, Bolivia, Guatemala, Paraguay, Nicaragua and Ecuador, with rates under 20%. At a regional level, obesity rates have generally increased in all countries, between 1980 and 2014, being more prevalent in women, as shown in Figure 3.1.
Overweight and obesity represent an imbalance between food intake and energy expenditure, with the subsequent body fat accumulation that poses a health risk. This phenomenon has multiple causes, including changes in eating patterns in the region, with an increased availability of ultra–processed products (with high sugar, fat and salt content) and a decline in
traditional dishes prepared with fresh and healthy foods (FAO and PAHO, 2017). Compounded by sedentary life styles, long work hours, deregulation of marketing and advertising of unhealthy food products, tax incentives and other market failures that favour products that promote weight gain, in addition to urbanization processes without planning for a more active and less motorized mobility; the foregoing creates a context that facilitates weight gain and obesity.1
Overweight and obesity have serious consequences, including a greater likelihood of developing non–communicable diseases (NCDs), which as shown in this chapter are among the leading causes of death by disease in the world. It is important to note that NCDs, such as cardiovascular disease, diabetes, hypertension and cancer are among the 10 leading causes of death in the countries in the region.
1 Source: http://www.who.int/mediacentre/factsheets/fs311/es/, revised on 15/07/2017.
BOX 3ADULT OBESITY
| 16 |

2017PANORAMA OF FOOD AND NUTRITION SECURITY IN LATIN AMERICA AND THE CARIBBEAN
FIGURE 3.1 EVOLUTION OF OBESITY RATES (BMI > 30 KG/M2) AMONG THE ADULT POPULATION (OVER 18) BY GENDER AND COUNTRIES IN LATIN AMERICA AND THE CARIBBEAN, 1980–2014
6.7
16 16.117.8 17 16.6
15.5
18.7
15.2
20.7 20.9 21.1
24.6
1.52.9 3
5.62.9 3.6 3.1
4.7 3.8 4.3 3.9 4.5
8.3
0
5
10
15
20
25
30
35
40
HTI DOM VCT CUB LCA DMA GRD BRB JAM KNA TTO ATG BHS
2014 1980
Caribbean (Male)
17
28.5 29.1 29.4 30.3 30.8 3132.8 33 33.9 34.3
35.637.2
4.8
9 9.7
14.1
9.411.5
9.9
13.2 13.7 13.1 12.314.3
20.9
0
5
10
15
20
25
30
35
40
HTI DOM VCT CUB LCA DMA GRD BRB JAM KNA TTO ATG BHS
2014 1980
Caribbean (Female)
23.9 24.225.3
26.728.3 28.5
30.432.4
7.79.4
10.8 10.9 10.6 10.312.1
15.4
0
5
10
15
20
25
30
35
40
HND GTM NIC SLV BLZ CRI PAN MEX
2014 1980
Mesoamerica (Female)
2223.1 23.6 24 24.6 25.4
29.4 30.1 30.3 31.3 32.2 32.8
6.58.5 9.1 9.5
10.8 10.9
16.315.1
10.5
15.317.4
15
0
5
10
15
20
25
30
35
40
PRY BOL ECU BRA COL PER VEN ARG GUY URY SUR CHL
2014 1980
South America (Female)
12.313.4 12.6
15.7 15
19.1 19.8
23.7
3.2 3.9 4.8 4.6 4.3 5 5.47.8
0
5
10
15
20
25
30
35
40
HND GTM NIC SLV BLZ CRI PAN MEX
2014 1980
Mesoamerica (Male)
1512.4
14.517.1
15.8 15
21.9
26.7
13.9
23.5
18.6
24.8
3.6 3.8 3.9 4.7 5 5
8.6
12.5
3.4
10.5
5.7
10
0
5
10
15
20
25
30
35
40
PRY BOL ECU BRA COL PER VEN ARG GUY URY SUR CHL
2014 1980
South America (Male)
SOURCE: Global Health Observatory (GHO) (OMS, en línea).
BOX 3 (CONTINUATION)
| 17 |

CHAPTER 1 PROGRESS IN LATIN AMERICA AND THE CARIBBEAN FOR THE FULFILLMENT OF SUSTAINABLE DEVELOPMENT GOALS 2 AND 3
SDG 3: ENSURE HEALTHY LIVES AND PROMOTE WELL–BEING FOR ALL AT ALL AGES
This section provides an analysis of the targets and indicators related to maternal and child mortality and non–communicable diseases (NCDs), given their close link with SDG 2 (FAO and PAHO, 2017). Table 3 shows the targets and indicators to be considered.
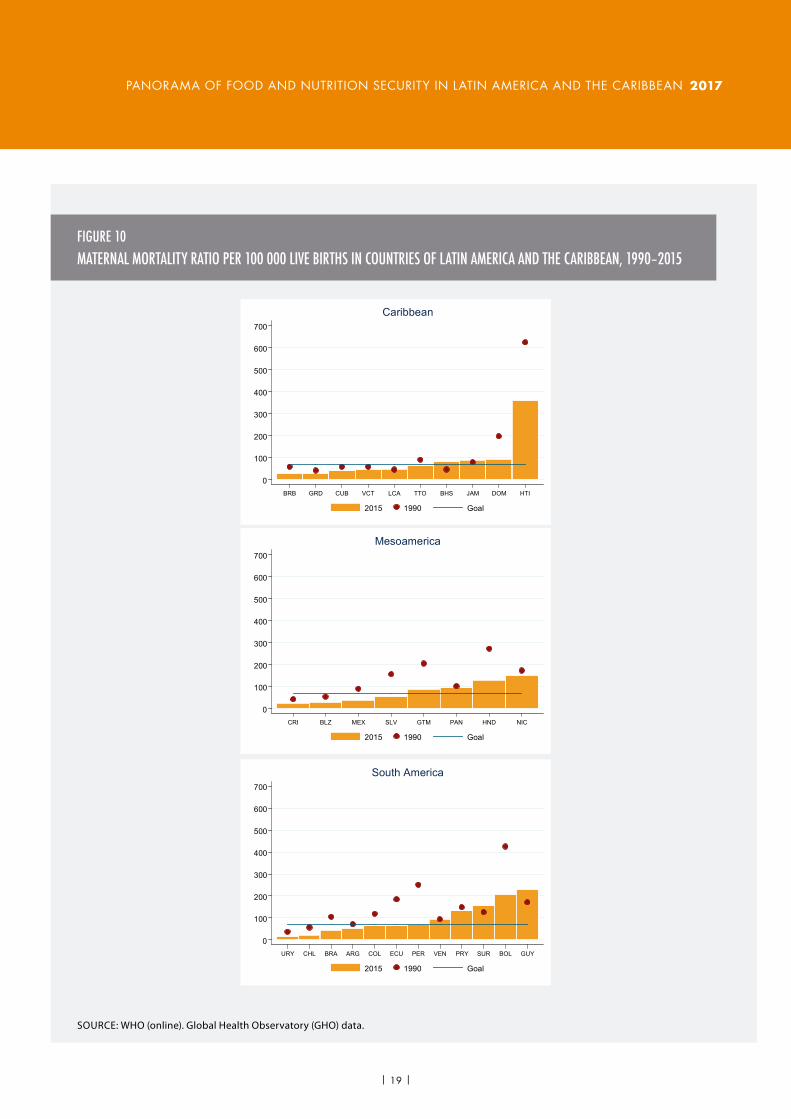
Target 3.1 proposes a reduction in the maternal mortality ratio to less than 70 deaths per 100 000 live births. Globally, nearly all maternal deaths occur in low–income settings and they could be prevented (United Nations, 2016). Practically all countries in Latin America and the Caribbean have registered progress since 1990. According to the latest figures available, 17 countries of the region are already below the target value. Haiti is the country with the highest ratio, with 359 deaths per 100 000 live births; whereas, Uruguay registered 15
TABLE 3 TARGETS AND SELECTED INDICATORS FOR SDG 3
Target Indicators
3.1 By 2030, reduce the global maternal mortality ratio to less than 70 per 100 000 live births. 3.1.1 Maternal mortality ratio
3.2 By 2030, end preventable deaths of newborns and children under 5 years of age, with all countries aiming to reduce neonatal mortality to at least as low as 12 per 1000 live births and under-5 mortality to at least as low as 25 per 1000 live births.
3.2.1 Under-5 mortality rate
3.2.2 Neonatal mortality rate
3.4 By 2030, reduce by one third premature mortality from non–communicable diseases through prevention and treatment and promote mental health and well–being.
3.4.1 Mortality rate attributed to cardiovascular disease, cancer, diabetes or chronic respiratory diseases.
SOURCE: United Nations, 2017c.
deaths per 100 000 live births. The rates observed for Bahamas, Guyana, Jamaica, Suriname and, to a lesser extent, Santa Lucia and Venezuela have worsened from 1990 to date (Figure 10).
Target 3.2 proposes a reduction in the deaths of neonates and children under 5 years of age, depending on the following indicators: the under–5 mortality rate (indicator 3.2.1) and the neonatal mortality rate (indicator 3.2.2). The targets to be met by 2030 are for 25 and 12 deaths per 1 000 live births, respectively. It should be noted that globally 45%12 of childhood deaths are related to malnutrition, given that children are more vulnerable to developing serious diseases. Children suffering from severe wasting are more likely to die from diseases such as diarrhea and pneumonia.13
According to the latest estimations, all the countries observed in Latin America and the Caribbean have advanced towards the reduction in the mortality rate of children under 5 years of age, compared to in 1990 (Figure 11). This trend is partially explained by the coverage of health care services and public policies implemented by countries in this area. Programs for maternal and
12 Obtained from http://www.who.int/mediacentre/factsheets/fs178/es/, revised on 07/19/2017.13 Ibid.
| 18 |
2017PANORAMA OF FOOD AND NUTRITION SECURITY IN LATIN AMERICA AND THE CARIBBEAN
SOURCE: WHO (online). Global Health Observatory (GHO) data.
FIGURE 10MATERNAL MORTALITY RATIO PER 100 000 LIVE BIRTHS IN COUNTRIES OF LATIN AMERICA AND THE CARIBBEAN, 1990–2015
0
100
200
300
400
500
600
700
BRB GRD CUB VCT LCA TTO BHS JAM DOM HTI
2015 1990 Goal
Caribbean
0
100
200
300
400
500
600
700
CRI BLZ MEX SLV GTM PAN HND NIC
2015 1990 Goal
Mesoamerica
0
100
200
300
400
500
600
700
URY CHL BRA ARG COL ECU PER VEN PRY SUR BOL GUY
2015 1990 Goal
South America
| 19 |

CHAPTER 1 PROGRESS IN LATIN AMERICA AND THE CARIBBEAN FOR THE FULFILLMENT OF SUSTAINABLE DEVELOPMENT GOALS 2 AND 3
SOURCE: WHO (online). Global Health Observatory (GHO) data.
FIGURE 11UNDER-5 MORTALITY PER 1 000 LIVE BIRTHS IN COUNTRIES OF LATIN AMERICA AND THE CARIBBEAN, 1990–2015
0
20
40
60
80
100
120
140
160
ATG BHS BRB CUB DMA DOM GRD HTI JAM KNA LCA VCT TTO
2015 1990 Goal
Caribbean
0
20
40
60
80
100
120
140
160
BLZ CRI SLV GTM HND MEX NIC PAN
2015 1990 Goal
Mesoamerica
0
20
40
60
80
100
120
140
160
ARG BOL BRA CHL COL ECU GUY PRY PER SUR URY VEN
2015 1990 Goal
South America
| 20 |

2017PANORAMA OF FOOD AND NUTRITION SECURITY IN LATIN AMERICA AND THE CARIBBEAN
SOURCE: WHO (online). Global Health Observatory (GHO) data.
FIGURE 12NEONATAL MORTALITY RATE PER 1 000 LIVE BIRTHS IN COUNTRIES OF LATIN AMERICA AND THE CARIBBEAN, 1990–2015
0
5
10
15
20
25
30
35
40
45
ATG BHS BRB CUB DMA DOM GRD HTI JAM KNA LCA VCT TTO
2015 1990 Goal
Caribbean
0
5
10
15
20
25
30
35
40
45
BLZ CRI SLV GTM HND MEX NIC PAN
2015 1990 Goal
Mesoamerica
0
5
10
15
20
25
30
35
40
45
ARG BOL BRA CHL COL ECU GUY PRY PER SUR URY VEN
2015 1990 Goal
South America
| 21 |

CHAPTER 1 PROGRESS IN LATIN AMERICA AND THE CARIBBEAN FOR THE FULFILLMENT OF SUSTAINABLE DEVELOPMENT GOALS 2 AND 3
child health care have been implemented in almost all countries, seeking to reduce maternal and neonatal mortality in the first year of life, while reinforcing immunization and promoting breastfeeding. Besides, other initiatives such as food aid and prenatal control programs have also been implemented.
At present, there are five countries which have not yet managed to attain the target established for the goal: Haiti with 89 deaths per 1 000 live births, Guyana (38.4), Bolivia (38.4), the Dominican Republic (30.9) and Guatemala (29.1).
Figure 12 shows the latest neonatal mortality estimations, registering the same downward trend. Except for Dominica, all other countries have made progress in this front. There are seven countries which have not managed to reduce neonatal mortality to 12 deaths per 1 000 live births.
Under target 3.4, countries undertake to reduce premature mortality14 due to non–communicable diseases (NCD). This target is monitored by indicator 3.4.1, which measures the mortality rate attributable to cardiovascular diseases, cancer, diabetes and chronic respiratory diseases.
Globally, NCDs are responsible for 70% of total deaths, with over half of them being premature deaths (United Nations, 2016). The causes of these diseases include smoking, harmful alcohol use and physical inactivity. As mentioned earlier, the global and regional overweight trend is on the rise. This is a risk factor for suffering NCDs such as Type 2 diabetes, hypertension and cardiovascular diseases, putting more pressure on health care systems. On the other hand, micronutrient deficiency, also known as “hidden hunger” is a less–visible form of malnutrition, which has serious consequences for both maternal and child death (see Box 4) (United Nations, 2014).
Figure 13 shows the likelihood of dying prematurely due to NCDs15 , comparing the current situation with 2000. Evidence shows that practically all countries presented improvements in
14 Premature death is understood as death before 70 years of age. 15 Refers to the likelihood of dying between 30 and 70 years of age.
this area. However, progress must be accelerated to be able to fulfill the 2030 target.
Healthy eating is an important condition for reducing all forms of malnutrition. It is particularly essential for the reduction of overweight and obesity. It also gains importance as a factor for the fulfillment of target 3.4, becoming an axis that links SDGs 2 and 3 (FAO and PAHO, 2017). n
| 22 |

2017PANORAMA OF FOOD AND NUTRITION SECURITY IN LATIN AMERICA AND THE CARIBBEAN
SOURCE: WHO (online). Global Health Observatory (GHO) data.
FIGURE 13LIKELIHOOD OF PREMATURE MORTALITY DUE TO NON–COMMUNICABLE DISEASES: CARDIOVASCULAR, CANCER, DIABETES AND RESPIRATORY DISEASES, BETWEEN 30 AND 70 YEARS OF AGE, 2000 AND 2015. IN PERCENTAGES
19
16
1917
21
1617
16
19 19
2725
2324
18
15
27
20
30
2625
24
0
5
10
15
20
25
30
ATG BHS BRD CUB DOM GRD HTI JAM LCA TTO VCT
Caribbean
2000 2015 Goal
26
22
14
11
15 1517
14
1715
19
1615
1416
14
0
5
10
15
20
25
30
BLZ CRI GTM HND MEX NIC PAN SLV
Mesoamerica
2000 2015 Goal
20
17
20
16
25
17
14
11
19
1517
13
28 28
1513
21
18
28
2120
17
2018
0
5
10
15
20
25
30
ARG BOL BRA CHL COL ECU GUY PER PRY SUR URY VEN
South America
2000 2015 Goal
| 23 |

CHAPTER 1 PROGRESS IN LATIN AMERICA AND THE CARIBBEAN FOR THE FULFILLMENT OF SUSTAINABLE DEVELOPMENT GOALS 2 AND 3
Micronutrient deficiency, understood as the lack of vitamins and minerals, is added to the challenges of reducing malnutrition, overweight and obesity. Known also as “hidden hunger”, it has implications for health, and physical and cognitive development, with direct effects on quality of life. One of the consequences is anemia, caused by the lack of iron or the development of some diseases, becoming one of the nutritional issues with more significant health implications, especially during pregnancy, as it is a risk factor for maternal death and low birth weight (FAO and PAHO, 2017). In the first years of life, anemia has severe effects on the psychomotor development of children,
affecting their learning capacity, increasing the risk of disease and even death. On the other hand, anemia in women of child–bearing age (15–49), increases the likelihood of maternal and child mortality, turning it into a first order public health issue (Mujica–Coopman et.al, 2015).
Between 2005 and 2015, most countries of the region have registered a decline in the proportion of women in child–bearing age with anemia, as shown in Figure 4.1.
BOX 4MICRONUTRIENT DEFICIENCY AND BREASTFEEDING
FIGURE 4.1 PREVALENCE OF ANEMIA AMONG WOMEN OF CHILD–BEARING AGE IN COUNTRIES OF LATIN AMERICA AND THE CARIBBEAN, 2005 AND 2015
0
5
10
15
20
25
30
35
40
45
50
COL LCA ECU GUY TTO PER ATG PAN GRD BRB BLZ JAM GTM VCT SLV SUR MEX BHS HND CUB BOL VEN DOM HTI CRI NIC PRY ARG URY CHL BRA
2015 1990
SOURCE: WHO (online). Global Health Observatory (GHO) data.
| 24 |

2017PANORAMA OF FOOD AND NUTRITION SECURITY IN LATIN AMERICA AND THE CARIBBEAN
On the other hand, breastfeeding (Figure 4.2) is a key factor for promoting a good nutritional status in children. A series of benefits for childhood health are generated when exclusive breastfeeding is maintained until six months of age. These include the reduction in
childhood mortality resulting from disease (diarrhea and respiratory infections), prevention of overweight and some non–communicable diseases (FAO and PAHO, 2017).
FIGURE 4.2EXCLUSIVE BREASTFEEDING RATE IN CHILDREN UNDER 6 YEARS OF AGE, IN COUNTRIES OF LATIN AMERICA AND THE CARIBBEAN. DIFFERENT YEARS
32.7 33.2
64.3
42.8
32.5 33.2
4.7
53.2
23.3
31.2
39.7
23.8
14.4
31.7
21.5
68.4
47.0
2.8
0
5
10
15
20
25
30
35
40
45
50
55
60
65
70
ARG(2012)
BLZ(2016)
BOL(2012)
COL(2010)
CRI(2011)
CUB(2014)
DOM(2014)
GTM(2015)
GUY(2014)
HND(2012)
HTI(2012)
JAM(2011)
MEX(2012)
NIC(2012)
PAN(2014)
PER(2012)
SLV(2014)
SUR(2010)
SOURCE: WHO (online). Global Health Observatory (GHO) data.
BOX 4 (CONTINUATION)
| 25 |

© FAO
| 26 |

PANORAMA DE LA SEGURIDAD ALIMENTARIA Y NUTRICIONAL EN AMÉRICA LATINA Y EL CARIBE
CHAPTER 2 ANALYSIS OF THE DIMENSIONS OF
FOOD AND NUTRITIONSECURITY
| 27 |

THE REGION HAS MAINTAINED A GOOD PERFORMANCE IN AGRICULTURE, ALLOWING IT TO HAVE MORE THAN ENOUGH FOOD FOR THE TOTAL POPULATION. Having proper food production levels16 is one of the most important factors required to ensure the achievement of food and nutrition security. The region has been characterized over the last few decades for having more than enough food to cover the needs of its population, as observed in Figure 14.17
Figure 15 shows the evolution of food production by subregion. An upward trend is clearly observed in South America and Mesoamerica, despite declines in some specific periods. After a marked decline in the indicator during the 1990s, the Caribbean registered a significant rise beginning in the mid–2000s. Per–capita production shows growth in food production above that of population growth in the three subregions. It was only in the 1990s that the Caribbean’s population growth exceeded food production.
Further breakdown at the level of some commodities confirms the previous trend. Figure
16 Food production includes products considered edible and with nutritional value. Therefore, coffee and tea are excluded because despite being edible they have scarce nutritional value.17 It is important to note that the regional values conceal the large differences existing between regions and even inside them. South America, given its size, explains a large part of the food production trend in the Latin American and Caribbean subregion, accounting for 80% of the region’s food production, as shown in Figure 13.
Key messagesè The region produces enough food to cover the needs of its population. Yet, this does not ensure a healthy and nutritious diet, as the availability of diverse and safe foods of good nutritional quality is required to end hunger and all forms of malnutrition.
è Latin America and the Caribbean have great production capacity, which positions them as global suppliers. However, there are differences among countries and subregions, with varied thresholds of domestic production. Hence, trade plays an important role in food and nutrition security. Food trade offers an opportunity to benefit from the synergies between countries in the region and other regions to ensure food availability.
è Varied food availability with respect to the standards estimated for healthy eating varies between countries, not necessarily responding to their production capacity. Thus, factors such as trade and the food environment are key for establishing a supply of healthy foods.
AVAILABILITY
CHAPTER 2
ANALYSIS OF THE DIMENSIONS OF FOOD AND NUTRITION SECURITY
| 28 |

PANORAMA OF FOOD AND NUTRITION SECURITY IN LATIN AMERICA AND THE CARIBBEAN 2017PANORAMA DE LA SEGURIDAD ALIMENTARIA Y NUTRICIONAL EN AMÉRICA LATINA Y EL CARIBE
rise. When comparing yields20 in Latin America and the Caribbean with those of other regions significant gaps are found (FAO, 2015a; FAO and PAHO, 2017), proving there is still room for growth in the region in this area. Growth in production and productivity must obviously be developed in an environmentally and socially sustainable production framework, making it possible to respond to the pressures of higher food demand driven by demographic changes, urbanization, aging populations, and changes in the way demand is structured, due to higher incomes (FAO, 2017a).
As mentioned earlier, food production plays a vital role in food and nutrition security; but, what is the weight of production in the region’s food availability? Figure 17 depicts the importance of production in domestic supply21 , showing that agricultural and livestock production provides almost all the volume of the national supply. Within the food groups observed, the production of roots, tubers and pulses is insufficient to cover the national supply, while the production of oil crops, fruit, cereals and meat exceeds the national supply level. Things are different in the Caribbean, where production by itself is not enough to meet the domestic supply in all the commodities observed, except for fruit. In Mesoamerica, on the
20 In previous versions of the Panorama of Food and Nutrition Security, yields are addressed in further detail from a production perspective (e.g. ton/hectare) and Agricultural Added Value per worker.21 Supply refers to the nutritional component of basic commodities, meaning the total amount of the commodity available for human consumption in one year. This considers production, stock variations, imports and exports.
16 shows that production has been on the rise in the eight food groups observed.18 In the last decade, oil crops and cereals are the food groups showing the most dynamic growth, with levels of 60% and 43%, respectively; the same applies to meat and dairy products, which registered marked hikes during this period, with growth rates of 37% and 31% for each group.
In some cases, these increases are explained by higher yield, while in others they are due to an increase in cultivated cropland. For instance, cereals registered a rise in yield of almost one third versus the 2002–04 triennial, with an average of 4.1 tons per hectare in the last observed period, while the increase in cropland area was lower, with 8.3% over an equal period. In the case of oil crops, on the other hand, there was a significant increase in cultivated cropland, which rose to nearly 50% over the last decade, with approximately 60 million hectares, mainly made up of soy plantations, while the oil crop yield rose by 6.6%. In turn, pulses have registered a 16% drop in cultivated cropland over the last decade, with 7.2 million hectares, and an increase in yield of 43% over the same period, thus explaining the 22% rise in regional production.19
Growth prospects for agricultural and livestock for the next few years are favorable. The region has natural resources to continue growing, and productivity, as may be observed, is also on the
18 Oil crops, fruits, vegetables, roots and tubers, pulses, cereals, milk and meat.19 Calculations based on FAO (online). FAOSTAT.
2017PANORAMA OF FOOD AND NUTRITION SECURITY IN LATIN AMERICA AND THE CARIBBEAN
| 29 || 29 |

CHAPTER 2 ANALYSIS OF THE DIMENSIONS OF FOOD AND NUTRITION SECURITY
SOURCE: Compiled by authors with information from FAO (online) FAOSTAT.
0
100
200
300
1970 1980 1990 2000 2010 2014
South America Mesoamerica Caribbean
FIGURE 14NET FOOD PRODUCTION EVOLUTION IN LATIN AMERICA AND THE CARIBBEAN, 1961–2013
| 30 |

2017PANORAMA OF FOOD AND NUTRITION SECURITY IN LATIN AMERICA AND THE CARIBBEAN
SOURCE: Compiled by authors with information from FAO (2017, FAOSTAT).*/Note: An increase in per capita production accounts for food production growth above that of population growth.
FIGURE 15EVOLUTION OF THE NET FOOD PRODUCTION INDEX AND PER CAPITA INDEX, SUBREGIONS OF LATIN AMERICA AND THE CARIBBEAN, 1961–2013 (BASIS: 2004–06=100)
0
50
100
150
1961 1971 1981 1991 2001 2011
South America
0
50
100
150
1961 1971 1981 1991 2001 2011
Mesoamerica
0
50
100
150
1961 1971 1981 1991 2001 2011
Caribbean
Food Production Per capita production
| 31 |

CHAPTER 2 ANALYSIS OF THE DIMENSIONS OF FOOD AND NUTRITION SECURITY
other hand, while vegetable and fruit production is more than sufficient to meet the national supply, the situation is not the same for the remaining commodities.
The foregoing shows that food production is not the only way countries make up their domestic supply. Although domestic production is an important factor it is not the only one. Food trade also plays a significant role. In cases where production is more than enough to meet subregional demand, it enables food exports, while imports play an important role in the supply of some of the commodities observed. The trade status of some foods is addressed in further detail in the following section. n
THE REGION HAS THE POTENTIAL TO PROMOTE SUPPLY WITH THE GROWING INTRAREGIONAL FOOD TRADE.
The good production performance mentioned above has positioned the region as a relevant player in international markets, where it has become a global food and livestock commodity supplier. Thus, the region allocates an important portion of the production of some commodities to exports. Figure 18 shows that the share of production destined for international markets has increased versus the previous decade for all the observed commodity groups: 35% of oil crop production, 33% of fruit and 31% of cereals are destined for export.22 Thus, the region is responsible globally for 38% of oil crops, 30% of fruits and 19% of meat exports.23
In aggregated terms, the Latin American and Caribbean region is a net agrifood24 exporter. In 2016, food and agricultural commodity exports exceeded 205 billion dollars, accounting for a 0.5% drop versus the previous year’s agrifood exports. On the other hand, imports stood nearly at 83 billion dollars, 1.3% over the purchases of the region for the previous year, resulting in a trade balance above 122 billion (Figure 19).
The countries with the largest economies in the region are also the main exporters of agricultural and livestock products. For example, Brazil was responsible for slightly over one third of the shipments of meat for the region in 2016, registering a drop of 5.3%. On the contrary, Argentina and Mexico registered increases in their agrifood shipments, with 5.3% and 7.6%, respectively, between 2015 and 2016. In general, these three countries concentrate two thirds of the region’s exports. The South American countries of Colombia, Uruguay and Venezuela also registered declines in their agrifood exports versus 2015; and Central American and Caribbean countries showed
22 The figure confirms that most of the production is destined for the domestic markets while a smaller portion is destined for international markets.23 Calculations based on FAOSTAT.24 AgriFoods comprise all the products listed in chapters 01 to 24 of the Harmonized System, including both primary and processed food items.
| 32 |

2017PANORAMA OF FOOD AND NUTRITION SECURITY IN LATIN AMERICA AND THE CARIBBEAN
SOURCE: Compiled by authors with information from FAO (2017, FAOSTAT).
FIGURE 16PRODUCTION EVOLUTION BY SELECTED FOOD GROUPS IN LATIN AMERICA AND THE CARIBBEAN, 1962–64 TO 2012–14. AVERAGES IN MILLIONS OF TONS
0
50
100
150
200
Meat Cereals Fruits Vegetables Milk Pulses Oil crops Roots andtubers
1962-64 1972-74 1982-84 1992-94 2002-04 2012-14
| 33 |

CHAPTER 2 ANALYSIS OF THE DIMENSIONS OF FOOD AND NUTRITION SECURITY
SOURCE: Compiled by authors with information from FAO (online). FAOSTAT.*/ Values over 100 show that production is greater than the domestic supply, whereas values under 100 indicate that the subregional production by itself is not enough to cover the supply, creating room for trade.
FIGURE 17RATIO BETWEEN DOMESTIC PRODUCTION AND SUPPLY OF SELECTED AGRICULTURAL AND LIVESTOCK COMMODITIES, IN THE SUBREGIONS OF LATIN AMERICA AND THE CARIBBEAN, 1970–73 TO 2010–13
0
50
100
150
200
Meat Cereals Fruits Vegetables Milk Pulses Oil Crops Roots andtubers
South America
0
50
100
150
200
Meat Cereals Fruits Vegetables Milk Pulses Oil crops Roots andtubers
Mesoamerica
0
50
100
150
200
Meat Cereals Fruits Vegetables Milk Pulses Oil crops Roots andtubers
Caribbean
1970-73 1990-93 2010-13
| 34 |

2017PANORAMA OF FOOD AND NUTRITION SECURITY IN LATIN AMERICA AND THE CARIBBEAN
SOURCE: Compiled by authors with information from FAO (online). FAOSTAT.
FIGURE 18RATIO BETWEEN EXPORTS AND PRODUCTION OF SELECTED FOOD AND LIVESTOCK COMMODITIES, LATIN AMERICA AND THE CARIBBEAN, 1970–73 TO 2010–13
0
10
20
30
40
Meat Cereals Fruits Vegetables Milk Pulses Oil crops Roots andtubers
1970-73 1980-83 1990-93 2000-03 2010-13
| 35 |
CHAPTER 2 ANALYSIS OF THE DIMENSIONS OF FOOD AND NUTRITION SECURITY
drops in their exports compared to the previous year.
As for imports, Mexico, the main agrifood importer registered a slight decrease of 1% in 2016 versus the previous year. Brazil, which registered an increase of 14% during the same period is the second importer followed by Caribbean countries, which registered a decline of 12.7%.25
Table 4 shows that most of the countries in the region are net exporters. However, their exporting capacity differs in some cases. El Salvador, Panama, Venezuela and the Caribbean subregion, as a whole, were the only net exporters in 2016.
In the context of the 2030 Agenda, trade plays a role in the achievement of the SDGs. The eradication of different forms of malnutrition requires that the countries provide sufficient amounts of safe and diversified foods, forming part of nutritious and healthy diets. Although the potential that trade has for food and nutrition security is recognized (FAO, 2015b; FAO and PAHO, 2017), the effects that the food trade can have on food supply are heterogeneous, calling for a wide set of variables for their analysis. For instance, trade has helped expand the food supply and diversity that forms part of nutritious diets. Trade also helps stabilize the food supply 26 (FAO, 2016a). On the other hand, trade is responsible for a portion of the product supply which contributes to overweight, obesity and malnutrition (FAO, 2016a).
Trade becomes key when the production of certain goods is not sufficient by itself to meet the demand. An example of this is depicted in Figure 20, showing that South America is a net exporter of almost all the seven food groups analyzed 27; while the Caribbean is a net importer of almost all the food groups considered.
25 Trade figures for some Caribbean countries are mirror statistics. 26 However, it is important to bear in mind that as countries become more open to international trade, they become exposed to greater degrees of vulnerabilities, resulting from sudden changes in agricultural markets (FAO, 2015b). This situation may affect prices for consumers and producers.27 Tubers, pulses, dairy products, vegetables, fruits, cereals and meats.
Out of the commodities listed in Figure 20, dairy, cereals and meat comprise the main cost items in import turnover. The source of these foods indicates the major markets for each subregion (Figure 21). In the Caribbean region, the US is a major vendor of meat and cereals, accounting for 67% and 47% of purchases of these commodities, respectively; whereas the European Union is an important vendor of dairy products (33%), although South American countries have also been a relevant source of these foods. In Mesoamerica, the relevance of US imports in the three commodities analyzed (between 22% and 86%) is evident. However, this is due largely to the weighting of Mexico in imports for the subregion. When considering only Central American countries, significant trade in dairy products (55%) and meat (30%) may be observed within the subregion itself. Finally, in South America, the subregion itself is the main vendor of these three food items. This shows the importance of intra–regional trade and the availability of some basic food commodities for the region. n
| 36 |
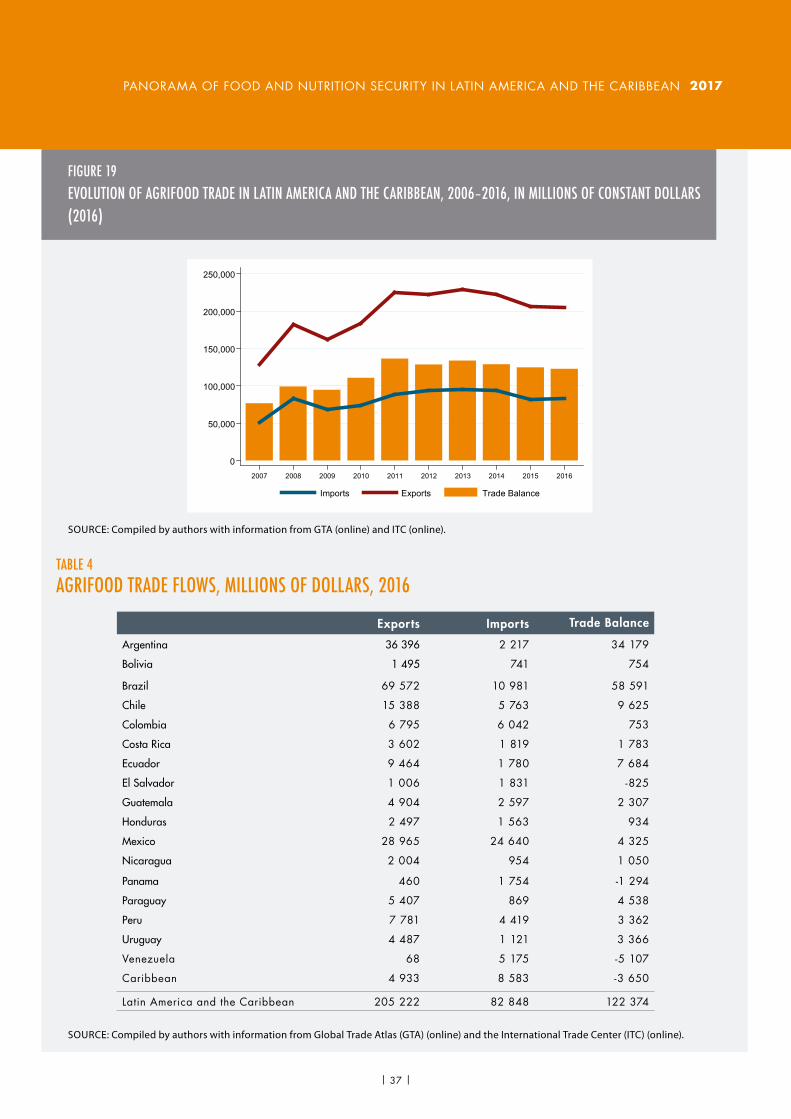
2017PANORAMA OF FOOD AND NUTRITION SECURITY IN LATIN AMERICA AND THE CARIBBEAN
SOURCE: Compiled by authors with information from GTA (online) and ITC (online).
SOURCE: Compiled by authors with information from Global Trade Atlas (GTA) (online) and the International Trade Center (ITC) (online).
FIGURE 19EVOLUTION OF AGRIFOOD TRADE IN LATIN AMERICA AND THE CARIBBEAN, 2006–2016, IN MILLIONS OF CONSTANT DOLLARS (2016)
0
50,000
100,000
150,000
200,000
250,000
2007 2008 2009 2010 2011 2012 2013 2014 2015 2016
Imports Exports Trade Balance
| 37 |
TABLE 4 AGRIFOOD TRADE FLOWS, MILLIONS OF DOLLARS, 2016
Exports Imports Trade Balance
Argentina 36 396 2 217 34 179
Bolivia 1 495 741 754
Brazil 69 572 10 981 58 591
Chile 15 388 5 763 9 625
Colombia 6 795 6 042 753
Costa Rica 3 602 1 819 1 783
Ecuador 9 464 1 780 7 684
El Salvador 1 006 1 831 -825
Guatemala 4 904 2 597 2 307
Honduras 2 497 1 563 934
Mexico 28 965 24 640 4 325
Nicaragua 2 004 954 1 050
Panama 460 1 754 -1 294
Paraguay 5 407 869 4 538
Peru 7 781 4 419 3 362
Uruguay 4 487 1 121 3 366
Venezuela 68 5 175 -5 107
Caribbean 4 933 8 583 -3 650
Latin America and the Caribbean 205 222 82 848 122 374

CHAPTER 2 ANALYSIS OF THE DIMENSIONS OF FOOD AND NUTRITION SECURITY
SOURCE: Compiled by authors with information from World Integrated Trade Solutions (WITS), ITC.
FIGURE 20TRADE BALANCE OF THE SELECTED AGRIFOOD PRODUCTS, SUBREGIONS OF LATIN AMERICA AND THE CARIBBEAN, 2013–15. IN MILLIONS OF DOLLARS.
0 5,000 10,000 15,000 20,000
Roots and tubers
Dairy products
Pulses
Vegetables
Fruits
Cereals
Meat
South America
-4,000 -2,000 0 2,000 4,000 6,000
Roots and tubers
Dairy products
Pulses
Vegetables
Fruits
Cereals
Meat
Mesoamerica
Mexico
Central America
-1,500 -1,000 -500 0 500
Roots and tubers
Dairy products
Pulses
Vegetables
Fruits
Cereals
Meat
Caribbean
| 38 |

2017PANORAMA OF FOOD AND NUTRITION SECURITY IN LATIN AMERICA AND THE CARIBBEAN
SOURCE: Compiled by authors with information from WITS, ITC.
FIGURE 21SOURCE OF DAIRY, CEREAL AND MEAT IMPORTS , SUBREGIONS OF LATIN AMERICA AND THE CARIBBEAN, 2013–15. IN MILLIONS OF DOLLARS
0 20 40 60 80 100
Dairy products
Cereals
Meat
South America
South America MesoamericaUnited Stated of America European Union (27)
0 20 40 60 80 100
Mex
ico
Cen
tral A
mer
ica
Dairy products
Cereals
Meat
Dairy products
Cereals
Meat
Mesoamerica
South America MesoamericaUnated States of America European Union (27)
0 20 40 60 80 100
Dairy products
Cereals
Meats
Caribbean
South America Mesoamerica CaribbeanUnited States of America European Union (27)
28
28 The tariff classification codes used for each food group are: Cereals: Chapter 10; Meat: Chapter 02; Fruit: Chapter 08; Dairy: sub–headings 0401, 0402, 0403, 0404, 0405, 0406; Vegetables: sub–headings 0702, 0703, 0704, 0705, 0706, 0707, 0709, 0710, 0711, 0712; Tubers and roots: sub–headings 0701, 0714; and Pulses: Leguminous vegetables 0708, 0713.
| 39 |

CHAPTER 2 ANALYSIS OF THE DIMENSIONS OF FOOD AND NUTRITION SECURITY
containing the appropriate amount of nutrients required to maintain proper body weight and lead an active and healthy life. As set forth in the Action Framework of the Second International Conference on Nutrition (ICN2) and in the SDGs, this premise gains far more relevance in considering the nutrient deficiency and the rates of overweight and obesity, which register alarming levels, with the well–known consequences such factors have on people’s health.30 On this front, healthy eating is essential for eradicating all forms of malnutrition and preventing non–communicable diseases (NCDs) (WHO, Healthy diet FACT SHEET N°394, 2015).
On the other hand, not only the amount and food source of calories is important but also what these calories imply in terms of macronutrients. The WHO (2003) laid down guidelines in this respect, by offering among other recommendations, that fat intake should not exceed 30% of the total calories consumed by one person per day, and sugar intake should be below 10% and even less than 5% of the calories consumed per day, while protein consumption should be between 10% and 15% of the daily calorie intake, and recommending an intake of least 400 grams of fruits and vegetables. According to the data shown in Figure 23, the increase in the availability of fruits and vegetables makes it possible to meet the recommendations set forth by WHO in this respect, the availability of proteins is within the recommended range, while fat availability exceeds the adequate range (FAO and PAHO, 2017). n
30 As set forth in chapter 1 of this edition.
ADEQUATE AMOUNTS OF FOOD DO NOT ENSURE A HEALTHY AND NUTRITIOUS DIET
In all the countries with available information, except for Haiti, on average, food availability exceeds the population’s dietary requirements.29
Figure 22 shows the most common indicator in terms of food availability, such as the average dietary energy supply adequacy. On average, food availability exceeds energy requirements by 31% in South America, by 27% in Mesoamerica, and by 15% in the Caribbean.
Cereals are the main source of calories in the region, accounting for nearly 36% of the available energy (FAO and PAHO, 2017). However, the existence of food items that are more energy–dense, conceals the importance of other less–energy dense but nutritionally relevant foods, such as fruits and vegetables, which in total exceed the volume of available cereals. Figure 23 shows that practically all the food groups observed have increased their supply per capita, registering significant increments in some cases, over the period between 1961–63 and 2011–13. For instance, vegetables increased from 78 grams to 196 grams per day per person in the Caribbean, and they more than doubled in Mesoamerica, rising to 147 grams per person per day, while in South America they rose by 33%. The available amount of meat per capita has more than doubled in the three subregions. On the other hand, cereals have also registered increases, albeit more modest ones, and their relative importance has declined versus other food groups. Finally, in South America, tubers have decreased both in quantity (by 30%) and relative importance, whereas in Mesoamerica, the availability of legumes has declined by 18%. It is also important to mention that the availability of fish has decreased by 8% in the Caribbean, during the period in question.
Although an increase in food supply is necessary to ensure adequacy, this does not guarantee that the population will consume a balanced diet,
29 The regulatory standard used as reference for adequate nutrition is the Average Dietary Energy Requirement (ADER), which is an indicator developed by FAO.
| 40 |

2017PANORAMA OF FOOD AND NUTRITION SECURITY IN LATIN AMERICA AND THE CARIBBEAN
FOOD TRADE POLICIES AND HEALTHY DIETS
Much of the discussion in this chapter has centered on agricultural and livestock trade trends, and particularly the food trade, as a determinant of food availability. In fact, trade is a key element in the composition of food supply, not only through imports but also through its direct impact on food production and its characteristics (FAO, 2015b). For instance, demand for certain commodities in international markets may generate incentives to increase production, triggering increases in supply.
In turn, a greater availability of such products may have positive effects on the amount and prices of available foods for the population.
The discussion of the linkage between trade and food and nutrition security is certainly not limited to availability. It has been set forth that trade has effects on domestic economic variables, such as production, competition, the job market, public infrastructure and budgets; and that these in turn have indirect effects on variables such as food supply, household income, and the presence of public services, which are determinants of the status of the four dimensions of food and nutrition security (FAO, 2015b).
There is also a growing debate on the role of trade in nutrition. International commitments, such as the SDGs or ICN 2 have highlighted the close links between food and nutrition security, and how they become particularly manifest in the characteristics of diets as a common factor of phenomena such as hunger and malnutrition (FAO and PAHO, 2017). The need to improve the coherency of public policies to increase the positive impacts of trade on nutrition and reduce to a minimum its negative effects, is particularly evident (UNSCN, 2015).
Finally, it has been observed that trade also has effects on the characteristics of dietary patterns, promoting the increase in the availability of certain foods and products at a domestic level, thus increasing the convergence of food habits in the world (Hawkes, 2006; UNSCN, 2017; Friel et al., 2013). Considering this, food trade is an important component to take into account when promoting healthy diets. n
FOOD TRADE AND CHARACTERISTICS OF FOOD AVAILABILITY
International trade may have varied effects on food availability, depending on country characteristics. For instance, a rise in imports for a country that is a net food importer may have positive impacts on the quantity and variety of available foods in the short term. However, it may also affect food availability in the medium and long term, by having a negative impact on domestic production, if it is unable to compete with imported foods. From the exports point of view, trade liberalization may generate incentives for increasing the production of commodities with a high value in international markets. Provided that the production of such commodities does not solely benefit the more privileged economic sectors, the rise in income levels in small–scale farming and rural workers devoted to such crops, may have positive effects for increasing food availability (FAO, 2015b).
In general, evidence shows that trade, particularly imports, has increased together with per–capita food production in developing countries. On the other hand, at an aggregate level, there is no evidence indicating that imports have had any significant effects on the reduction of production (Díaz–Bonilla, 2015). However, just as the rising trade flows have increased food availability in terms of both quantity and variety, they have also entailed access to processed food with high sugar and fat content. At least at a global level, some studies propose that although food production and the number of available calories have increased steadily over the last 50 years, the sources of such availability have remained relatively unchanged during the same period (Remans, Wood, Saha, Anderman, & DeFries, 2014). The increase in imports, on the other hand, is linked to the “nutritional transition” currently observed in middle and low– income countries, which has implied a rise in the consumption of meat, dairy, processed and ultra–processed products (FAO, 2015b). As mentioned earlier, this change in diet patterns is one of the underlying causes of the rise in obesity and overweight, and the ensuing increase in the prevalence of NCDs (FAO and PAHO, 2017).
| 41 |

CHAPTER 2 ANALYSIS OF THE DIMENSIONS OF FOOD AND NUTRITION SECURITY
SOURCE: FAO, Food Security Indicators 2016.*Note: The indicator is expressed as a percentage of the daily energy supply per person (DES) in excess of the Average Daily Energy Requirements (ADER). Values over 100 indicate that the energy supply exceeds the energy requirements.
SOURCE: Compiled by authors with data from FAO (online). FAOSTAT.
FIGURE 22AVERAGE DIETARY ENERGY SUPPLY ADEQUACY (%).
FIGURE 23FOOD AVAILABILITY BY FOOD GROUP, LATIN AMERICA AND CARIBBEAN SUBREGIONS, 1961–63 TO 2011–13. AVERAGES EXPRESSED IN KG/DAY/PERSON
90
100
110
120
130
1994-96 1990-01 2004-06 2009-11 2014-160
Latin America and the Caribbean South America Mesoamerica Caribbean
0
500
1,000
1,500
2,000
Caribbean Mesoamerica South America1961-63 2011-13 1961-63 2011-13 1961-63 2011-13
Cereals Fish Meat Milk PulsesRoots and tubers Sugar Vegetables Fruits
| 42 |

2017PANORAMA OF FOOD AND NUTRITION SECURITY IN LATIN AMERICA AND THE CARIBBEAN
Does trade have a role to play in diets? And, if so, how can trade contribute to improve nutrition and establish healthy eating patterns? For instance, the increase in ultra–processed and/or “unhealthy” foods, in some island states of the Pacific Ocean is linked to a rise in the share that such foods have in household spending and calorie consumption (Estimé, Lutz, & Strobel, 2014), which in turn raises a warning for island countries and net food importers.31 As for Latin America and the Caribbean, Thow and Hawkes (2009) studied the effects of trade liberalization from 1990 onward in the food supply of Central America32, and they observed increases in the availability of basic grains such as rice and yellow corn. In turn, the increase in the availability of corn, implied an increase in the availability of chicken. Although the data is limited, the study points out that snack imports have increased and it also describes the high dependency on imports in some countries to sustain the growing supply of pre–fried French fries, which in turn are mainly offered by fast–food restaurants.
On the other hand, Hawkes (2006) describes the effects of another phenomenon derived from trade and liberalization, such as the increase in Foreign Direct Investment (FDI). Studying the case of Mexico, he explains how between 1995 and 2003, there was an increase in investment by trade partners such as the US in the processed food industry. This investment entailed a rise in the availability and consumption of ultra–processed foods and sugary beverages, which became more accessible not only in large cities but also in small towns and suburban areas.
These studies agree with the findings of the United Nations System Standing Committee on Nutrition (UNSCN, 2015), regarding the positive effects that trade and liberalization may have on nutrition, insofar as policies are aligned with the targets for improving nutrition:1) Adequate, nutritious and healthy food for all;
31 The 2016 edition of Panorama offers an analysis of the key role of food and nutrition education in tackling the rise in the availability of ultra–processed foods. For instance, Caribbean countries such as Saint Vincent and the Grenadines or Jamaica have implemented initiatives to reduce the intake of fats and increase consumption of fruits and vegetables, respectively (FAO and PAHO, 2017).32 Therefore, it does not include Mexico or Belize.
2) Adequate quantities of micronutrient consump-tion for all;
3) Safe food consumption for all;4) Poverty reduction;
5) Breastfeeding for infants.
COHERENCE OF TRADE POLICIES AND NUTRITION: BRIEF REGIONAL BACKGROUND
Trade policies are defined as policies, with a potential to affect trade flows, either through international or domestic market instruments (FAO, 2015b). Hence, trade policies define how states regulate transactions within their national borders and abroad, and they are designed not only to influence the physical flow of goods but also the rendering of services and economic exchange (UNSCN, 2015).
The policies related to the international exchange of goods and services are characterized in this section, under the framework of examples of recent measures carried out in countries in the region, and their potential interaction with nutrition and healthy diets is analyzed. It is important to note that this does not imply, under any circumstances, the establishment of causal relationships between the implementation of certain policies in the region and the nutritional status of the countries that comprise it, as that is beyond the scope of this section.
Tariff Policies: Food import and export duties comprise one of the most common types of trade policies, since they can be easily implemented to face events, such as increases in international food prices (FAO, 2015b). Tariffs are also an important source of tax revenues, which can then be used to implement policies aimed at mitigating the negative effects of trade on food and nutrition security, as well as to benefit more from the positive effects of trade.
There has been a trend to decrease tariffs in the last few years in the region, either via the permanent reduction of import duties or by creating tariff quotas, allowing the import of a given quantity of products at lower–than–expected
| 43 |

CHAPTER 2 ANALYSIS OF THE DIMENSIONS OF FOOD AND NUTRITION SECURITY
import duty rates. This may be observed, for instance, in the elimination of tariffs by Guatemala, on the import of U.S. chicken leg quarters, within the framework of the Central America Free Trade Agreement– Dominican Republic (CAFTA DR); or in the temporary clearance for the import of zero–duty foods in Brazil (corn), Bolivia (corn, wheat, sorghum and wheat flour) and Venezuela (a total of 94 agrifood products).
The direct effect of reducing import duties is the increase in the supply and decrease in the prices of the foods involved. However, it is important to note that, in the case of some net food importing countries, import duties are already low. Therefore, their decrease or elimination may have a lower impact on consumer prices (FAO, 2015b).
In some countries around the world, it has been observed that the decrease in fruit and vegetable import duties has had a positive impact on their domestic availability. However, there is no clear evidence showing that this measure benefits low–income households (UNSCN, 2015). The decrease in import duties leads to a reduction in domestic prices for all consumers and not necessarily for those who need to improve their diets.
Trade Restrictions: Just as tariffs provide positive and negative incentives for trade in certain products, another policy instrument used in this field is the partial or total restriction of imports or exports. During the 2007–2008 food price crisis, for instance, several net food exporters established restrictions to ensure the domestic food supply (FAO, 2015b). In this policy category, it may be observed that in the last few years Argentina replaced the system known as “Registry of Export Operations” (ROE) for grains and oilseeds, with the Affidavits of Foreign Sales (known in Spanish as Las Declaraciones Juradas de Ventas al Exterior, or DJVEs). While the ROE sought to regulate the exports volume, to guarantee domestic supply, the DJVEs do not set any limits for the export of such products.
In general, export restrictions may have positive short–term effects on food supply at a domestic level, by increasing availability and decreasing prices. However, in the medium–term, producer prices below international prices will tend to
discourage agrifood production, with negative effects on the availability of adequate food for the population (FAO, 2015b).
Trade restrictions may also form part of phytosanitary measures, for instance, via the temporary suspension of imports from some specific trade partner, due to violations of sanitary import regulations. This happened recently between Brazil and some countries in the region. Panama suspended the import of meat products from Brazil, until they could certify compliance with Panamanian sanitary standards. Measures, such as this one, make it possible to fulfill the nutritional target of ensuring safe food.
Trade Agreements: Trade agreements are the main mechanism used by States to regulate trade liberalization. Regional and binational treaties allow the preferential access to goods between the countries that sign the agreement, and usually they are accompanied by the harmonization of sanitary and trade regulations. For instance, the North American Free Trade Agreement (NAFTA), ensures equal treatment among domestic and foreign investors, whereas MERCOSUR establishes a modality of nutrition labelling for all its members (UNSCN, 2015).
Currently, trade agreements have been signed between countries in the region, such as the Free Trade Agreements (FTAs) between Chile and Uruguay, Colombia and Costa Rica or Peru and Honduras. Trade agreements have also been established with other countries in the world, such as the FTA between South Korea and 6 countries in Mesoamerica (Nicaragua, Costa Rica, El Salvador, Honduras, Guatemala and Panama).
Trade agreements such as the FTAs may have positive effects on food availability. However, as mentioned earlier, the ensuing effect of Foreign Direct Investment (FDI) may have crucial effects on food patterns, affecting nutrition targets related to the consumption of healthy food and the adequate intake of micronutrients for all the population. In particular, Hawkes (2006) focuses on the role of the transnational food industry and how its growing presence may generate a double effect of convergence and adaptation of dietary patterns. This refers mainly to the fact that certain food products have become rapidly integrated in
| 44 |
2017PANORAMA OF FOOD AND NUTRITION SECURITY IN LATIN AMERICA AND THE CARIBBEAN
the food supply of countries, but such mainstreaming is in turn differentiated by niche markets determined by consumption capacity. Considering the example used previously about the availability of fruits and vegetables, countries register changes in their dietary patterns due to this increase in food availability, which for higher income groups may mean access to a greater variety of healthy food, while for more vulnerable segments it may imply an increase in the consumption of calorie–dense and nutritionally–poor foods.
To address this, the UNSCN (2015) proposal considers increasing the coherency between trade policies and nutrition, by establishing complementary policies that weigh such effects. Thus, trade policies aimed at food and nutrition security (FNS) and healthy diets must be considered as part of a package which includes other interventions geared to producers and consumers, especial those who are more vulnerable (FAO, 2015b). For instance, the reduction of poverty and inequality will play a key role in allowing the whole population to consume more varied and healthier foods, by decreasing the effect of income on access to food. n
| 45 |

CHAPTER 2 ANALYSIS OF THE DIMENSIONS OF FOOD AND NUTRITION SECURITY
Key messages:è The downturn in the region’s economic growth and the lower momentum of poverty and extreme poverty reduction dynamics in the last few years, hinder the eradication of hunger and malnutrition. Likewise, the persisting income inequality exerts pressure on access to food, and consequently on food and nutrition security.
è Poor people use a larger portion of their income to purchase food. In an economic downturn, with lower income and purchasing power, the amount of quality foods that the most vulnerable segments of the population can access is threatened, thus increasing the consumption of less expensive calorie–dense foods with lower nutritional value.
ACCESS THE CURRENT SOCIOECONOMIC SITUATION CONDITIONS PROGRESS, IN THE ERADICATION OF HUNGER IN LATIN AMERICA AND THE CARIBBEAN
ECONOMIC DOWNTURN HAS REPERCUSSIONS ON EMPLOYMENT AND POVERTY
Economic growth is one of the basic indicators used to determine income generation and availability. The region registers a downward trend in the last period. A decline in GDP is observed since 2012, whereas 2015 shows negative growth, reaching -1.3 % in 2016, comprising the first recession of over one year since the 1980s (Figure 24). This is largely explained by a marked decline in commodity prices in the international markets, mainly affecting South American countries, most of which are exporters of such products. Although commodity prices have registered an upturn of 28 % since January 2016 to date, they are still under previous price levels33 (IMF, 2017). This is compounded by the context of uncertainty in international policy, and the development of different types of political processes in the countries of the region, with repercussions on investment and consumption levels in Latin America and the Caribbean. Hence, a slow recovery is expected for the next few years, with growth projections of merely 1.1 % for 2017, which would reach 2.5 %, in 2018 (UN, 2017b).
Due to the economic slowdown, the urban unemployment rate in Latin America and the Caribbean for 2016 reached 8.9 %, representing an increase of 1.6 percentage points versus 2015 (Figure 25), which is the greatest annual increase in over two decades (ECLAC and ILO, 2017). In the region, 13 out of 20 countries registered increases in urban unemployment rates, with South American countries having the greatest increments. As mentioned earlier, this is linked to the deeper effects of the economic slowdown registered in the subregion.
33 The total commodity index of the IMF as at June 2016 is 106.84. The values registered before the decline as from 2014 stand at nearly 180.
| 46 |

2017PANORAMA OF FOOD AND NUTRITION SECURITY IN LATIN AMERICA AND THE CARIBBEAN
SOURCE: UN, 2017a and 2017b.e/ Estimatedp/ Projected
SOURCE: ECLAC and ILO, 2017.a/ preliminary figure
FIGURE 24REAL GDP GROWTH IN LATIN AMERICA AND THE CARIBBEAN, IN PERCENTAGES.
FIGURE 25URBAN UNEMPLOYMENT IN LATIN AMERICA AND THE CARIBBEAN, 2005–2016. IN PERCENTAGES.
6.0
4.5
2.9 2.8
0.7
-0.6
-1.3
1.1
2.5
-2
-1
0
1
2
3
4
5
6
2010 2011 2012 2013 2014 2015 2016e 2017p 2018p
9.7
8.78.2
7.6
8.8
8.2
7.4 7.3 7.1 6.97.3
8.9
0
2
4
6
8
10
2005 2006 2007 2008 2009 2010 2011 2012 2013 2014 2015 2016a
| 47 |
CHAPTER 2 ANALYSIS OF THE DIMENSIONS OF FOOD AND NUTRITION SECURITY
From a national point of view, the greatest hike in unemployment was registered in Brazil, where the rate rose to 13% in 2016, representing 3.7 percentage points above the previous year (ECLAC and ILO, 2017). Deterioration in job quality was also observed, with an increase of 1.9 %34 in the rate of self–employment. In economic slowdown contexts such as the current one, self–employment becomes an alternative income–generation option for the unemployed and for the new members of the labor market who are unable to find formal employment (ECLAC and ILO, 2017).
The slow recovery of GDP and the rise in unemployment entail lower incomes at the household level, which is mainly reflected in the stagnation of the poverty and extreme poverty reduction trend as from 2013.
Figure 26 shows how the sustained GDP growth per capita went along with an important decline in poverty and undernourishment. However, in the last periods of the economic slowdown, there were increments in poverty. Thus, after several years of marked reductions, between 2013 and 2015, the number of poor people rose from 166 to 175 million, increasing from 28.1% to 29.2% of the population during the same period. The downward trend in extreme poverty registered since 2002 also began to reverse, rising from 66 million (11.3%) in 2012 to 75 million in 2015 (12.4%) (ECLAC, 2015).
The foregoing also jeopardizes the great progress made in food and nutrition security, by considering that people who fall below the extreme poverty line, by definition, lack sufficient income to meet their basic dietary needs.35 Figure 27 shows the ratio between extreme poverty and undernourishment. In an analysis of 18 countries of the region36, the correlation coefficient between extreme poverty and undernourishment is 67.2 %.37
34 Weighted average of occupation rates in 12 countries in the region (ECLAC and ILO, 2017).35 The basic food basket (BFB) comprises the necessary items to meet the nutritional needs of the population. It is used by ECLAC to determine the extreme poverty line in each country. 36 Argentina, the Plurinational State of Bolivia, Brazil, Chile, Colombia, Costa Rica, Ecuador, El Salvador, Guatemala, Honduras, Mexico, Nicaragua, Panama, Paraguay, Peru, Bolivarian Republic of Venezuela, Dominican Republic and Uruguay.37 Values above zero indicate a positive correlation between both variables. The closer the value is to 1, the greater the correlation.
This means that the greater the extreme poverty rates, the greater the prevalence of undernourishment. In fact, Figure 26 also shows how undernourishment declines as poverty and extreme poverty decrease, while in the last few years there has been a plateau in the reduction of undernourishment at the regional level, in line with the slowdown in poverty reduction.
It is important to analyze what areas, sectors or people are significantly affected, to focus the efforts of public policies according to the needs of the population. In the region, as shown in Figure 28, the rate of both poverty and extreme poverty is much greater than that of rural and urban areas. Although this difference has tended to decrease over the last few years, both extreme rural poverty and rural poverty are still 20 and 22 percentage points above urban areas, respectively. According to the latest available information, the prevalence of rural extreme poverty for 2014 is 27.6 %, and the prevalence for urban poverty is 8 %, while rural poverty is 46.2 % and urban poverty is 23.8 % (ECLAC, on line). n
INADEQUATE PROGRESS IN INCOME DISTRIBUTION MAY DELAY THE ACHIEVEMENT OF FOOD AND NUTRITIONAL SECURITY
The reduction of inequality is crucial for sustained growth (Ostry, Berg, & Tsangarides, 2014), just as the effect of inequality on economic growth is more pronounced in developing countries than in developed countries (Cunha Neves, Afonso, & Tavares Silva, 2016). Therefore, in the region, inequality is an important variable that affects development and hinders growth. Besides, in countries where inequality is greater, economic downturns have a disproportionate effect on lower–income sectors in terms of food and nutrition security, since they use large portions of their income to buy food.
An improvement in income distribution may be observed in the region, from early 2000 until today. As may be observed in Figure 29, the ratio between the average income of the wealthiest quintile and the average income of the poorest quintile has decreased considerably, and the share in income of
| 48 |

2017PANORAMA OF FOOD AND NUTRITION SECURITY IN LATIN AMERICA AND THE CARIBBEAN
SOURCE: Compiled by authors with information from ECLAC (online). CEPALSTAT.; World Bank (2017) and FAO, IFAD, UNICEF, WFP and WHO (2017).Note: The undernutrition prevalence rates are by triennial.
SOURCE: Compiled by authors using information from ECLAC (online). CEPALSTAT.; World Bank (2017) and FAO, IFAD, UNICEF, WFP and WHO (2017).
FIGURE 26GDP PER CAPITA, POVERTY, EXTREME POVERTY, AND UNDERNOURISHMENT IN LATIN AMERICA AND THE CARIBBEAN. 1994–2015, IN PERCENTAGES.
FIGURE 27RATIO BETWEEN EXTREME POVERTY AND UNDERNOURISHMENT
0
2000
4000
6000
8000
10000
12000
0
5
10
15
20
25
30
35
40
45
50
1995 2000 2005 2010 2015
Poverty Extreme Poverty Undernourishment GDP per capita (right axis)
0
10
20
30
40
50
60
Und
erno
uris
hmen
t (%
)
0 10 20 30 40 50 60Extreme Poverty (%)
| 49 |

CHAPTER 2 ANALYSIS OF THE DIMENSIONS OF FOOD AND NUTRITION SECURITY
the poorest quintiles has increased. However, the decline has plateaued since 2012. The average for the 18 countries for the year 2014 shows that the highest quintile still registers an average income that is 15.7 times greater than the average income of the poorest quintile. Thus, even with the improvements observed in the region’s income distribution, the share of income of the richest quintile is on average 54 %, while the poorest quintile receives on average only 4 % of income (ECLAC, on line).
Likewise, the Gini concentration index has shown improvements since 2002, standing at 0.469 in 2015, and although it continues to drop, it has decreased at a lower rate over the last few years (ECLAC, online). Besides, despite the improvements shown in the Gini coefficient in the region, a deeper analysis conducted by ECLAC (2016) shows that there has not been a more equitable distribution of remuneration and work, given that in several countries the share of wages in the GDP decreased for the same period in which the declines in the Gini coefficient are observed. In addition, a study performed in Mexico shows that wealth distribution among families is higher than the inequality measured merely by regular income (ECLAC, 2016). It is worth noting that wealth inequality affects growth much more than income inequality (Cunha Neves, Afonso, & Tavares Silva, 2016).
Hence, the region still has a long way to go in terms of progress in inequality and such progress must be focused on seeking redistribution policies that ensure the reduction of inequality in various aspects. Considering that in the current economic downturn context, inequality may hinder economic recovery even further, lower–income households are exposed to the risks of protracted dietary deficiencies. n
FOOD PRICES AND INCOME ARE THE MAIN DETERMINANTS IN THE ADOPTION OF HEALTHY DIETS BY THE MOST VULNERABLE POPULATION.
The most vulnerable sectors use a larger share of their incomes to purchase food, and in turn have less savings capacity. Unemployment, higher prices of food or other commodities, or the decline in income may significantly worsen the living conditions of this segment, as these households are unable to reduce the consumption of other goods to ensure their access to food. This may lead to poorer diet quality, due to less nutritious food choices with higher calorie concentration, jeopardizing the food and nutrition security of the whole household.
BASIC FOOD BASKET AND MINIMUM WAGE RATIO
The Basic Food Basket (BFB) includes the necessary goods to meet the nutritional needs of the population, and it is used to determine the extreme poverty line of each (ECLAC, online). On the other hand, as the minimum wage is established to cover the minimum needs of workers and their families, considering the economic and social conditions of countries (ILO, 2017), comparing the cost of the BFB to the amount of minimum wage may help analyze the degree of vulnerability of the poorest households in terms of food and nutrition security.
To this end, an analysis of nine countries in the region38 was performed, and in all of them the minimum wage exceeds the cost of the individual BFB. However, in some countries the BFB represents a high percentage of the minimum wage (Figure 30). Besides, it is important to consider that many times one minimum wage must cover the needs of more than one person, even those of a whole family. Therefore, the cost of the BFB per family group39 should also be analyzed. In this
38 Chile, Costa Rica, Ecuador, El Salvador, Guatemala, Mexico, Nicaragua, Panama and Dominican Republic.39 In fact, in Ecuador, El Salvador, Guatemala, Nicaragua, Panama and the Dominican Republic, the calculation of the BFB is based on a representative family group of the country. In Chile, Costa Rica and Mexico, the BFB is calculated per person. To facilitate the comparison, a four–person family group was used in this analysis.
| 50 |

2017PANORAMA OF FOOD AND NUTRITION SECURITY IN LATIN AMERICA AND THE CARIBBEAN
SOURCE: Compiled by authors with information from ECLAC (online). CEPALSTAT.
SOURCE: Compiled by authors with information from ECLAC (on line). CEPALSTAT.
FIGURE 28DIFFERENCE BETWEEN URBAN AND RURAL POVERTY AND EXTREME POVERTY IN LATIN AMERICA AND THE CARIBBEAN, 1990–2014. IN PERCENTAGE POINTS.
FIGURE 29RATIO BETWEEN THE INCOME OF THE RICHEST QUINTILE AND THE POOREST QUINTILE IN LATIN AMERICA, AVERAGE OF 18 COUNTRIES, 1997–2014
24.823.8
26.425.6 26.1
27.426.727.0
25.024.1
23.0
25.8
21.9
24.3
20.8
24.122.8
27.3
22.7
27.1
21.8
26.8
21.3
25.5
21.1
25.6
20.5
24.5
19.6
22.4
0
5
10
15
20
25
30
1990 1994 1997 1999 2002 2005 2006 2007 2008 2009 2010 2011 2012 2013 2014
Extreme Poverty Difference Poverty Difference
20.8
22.7 22.4
19.919.3
17.316.2 16.5
15.7
0
5
10
15
20
25
1997 1999 2002 2005 2008 2010 2012 2013 2014
| 51 |
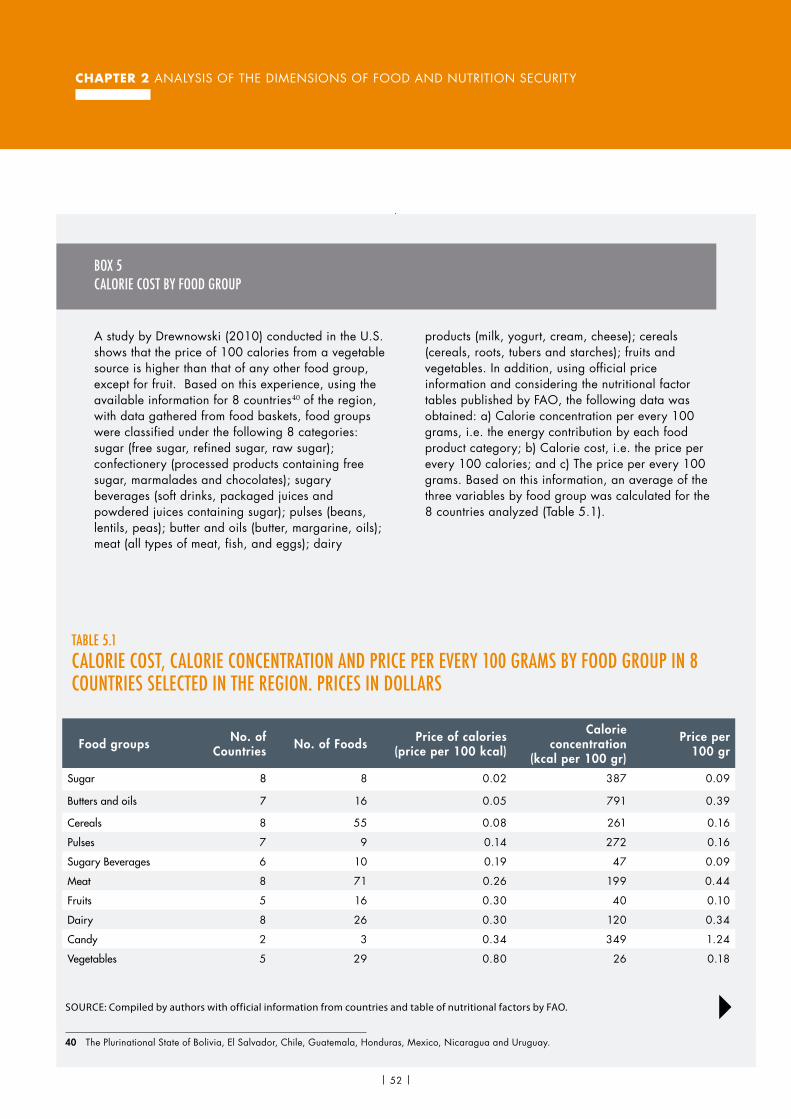
CHAPTER 2 ANALYSIS OF THE DIMENSIONS OF FOOD AND NUTRITION SECURITY
Al analizar el costo calórico promedio de los distintos grupos alimentarios en los ochos países estudiados, se observa que el azúcar, la mantequilla y los aceites son los grupos con menor costo calórico, con valores inferiores a los USD 0,05. Les siguen los cereales y las legumbres, con un costo calórico de USD 0,08 y USD 0,14, respectivamente. El costo calórico del grupo de las carnes, que contempla también el pescado y el huevo, es de USD 0,26; las frutas y los lácteos tienen un costo calórico similar de USD 0,30. Las verduras,
finalmente, tienen el mayor costo calórico, con un promedio de USD 0,80. Grupos especiales de productos ultraprocesados, como las golosinas (chocolates y mermeladas) muestran un costo calórico promedio de USD 0,34, mientras que el costo promedio de las bebidas azucaradas es de USD 0,19. Es decir a mayor concentración calórica, menor tiende a ser el costo por cada 100 calorías (Figura 5. 1).
A study by Drewnowski (2010) conducted in the U.S. shows that the price of 100 calories from a vegetable source is higher than that of any other food group, except for fruit. Based on this experience, using the available information for 8 countries of the region, with data gathered from food baskets, food groups were classified under the following 8 categories: sugar (free sugar, refined sugar, raw sugar); confectionery (processed products containing free sugar, marmalades and chocolates); sugary beverages (soft drinks, packaged juices and powdered juices containing sugar); pulses (beans, lentils, peas); butter and oils (butter, margarine, oils); meat (all types of meat, fish, and eggs); dairy
products (milk, yogurt, cream, cheese); cereals (cereals, roots, tubers and starches); fruits and vegetables. In addition, using official price information and considering the nutritional factor tables published by FAO, the following data was obtained: a) Calorie concentration per every 100 grams, i.e. the energy contribution by each food product category; b) Calorie cost, i.e. the price per every 100 calories; and c) The price per every 100 grams. Based on this information, an average of the three variables by food group was calculated for the 8 countries analyzed (Table 5.1).
BOX 5CALORIE COST BY FOOD GROUP
SOURCE: Compiled by authors with official information from countries and table of nutritional factors by FAO.
40
40 The Plurinational State of Bolivia, El Salvador, Chile, Guatemala, Honduras, Mexico, Nicaragua and Uruguay.
| 52 |
TABLE 5.1 CALORIE COST, CALORIE CONCENTRATION AND PRICE PER EVERY 100 GRAMS BY FOOD GROUP IN 8 COUNTRIES SELECTED IN THE REGION. PRICES IN DOLLARS
Food groups No. of Countries No. of Foods Price of calories
(price per 100 kcal)
Calorie concentration
(kcal per 100 gr)
Price per 100 gr
Sugar 8 8 0.02 387 0.09
Butters and oils 7 16 0.05 791 0.39
Cereals 8 55 0.08 261 0.16
Pulses 7 9 0.14 272 0.16
Sugary Beverages 6 10 0.19 47 0.09
Meat 8 71 0.26 199 0.44
Fruits 5 16 0.30 40 0.10
Dairy 8 26 0.30 120 0.34
Candy 2 3 0.34 349 1.24
Vegetables 5 29 0.80 26 0.18

2017PANORAMA OF FOOD AND NUTRITION SECURITY IN LATIN AMERICA AND THE CARIBBEAN
When analyzing the average cost per calorie of the different food groups in the 8 countries analyzed, it is observed that sugar, butter and oils are the groups with the lowest cost per calorie, with values under USD 0.05. They are followed by cereals and pulses, with a cost per calorie of USD 0.08 and USD 0.14 respectively. The cost per calorie of the meat group, which includes fish and eggs, is USD 0.26, and fruits and dairy products have a similar cost per calorie of
USD 0.30. Finally, vegetables have the highest cost per calorie, with an average of USD 0.80. Special ultra–processed product groups, such as confectionery (chocolates and marmalades) have an average cost per calorie of USD 0.34, whereas the average cost of sugared beverages is USD 0.19. That is, the greater the calorie density, the lower the cost per 100 calories (Figure 5. 1).
FIGURE 5.1 CALORIE DENSITY (PER 100 GRAMS) VERSUS COST PER CALORIE BY FOOD GROUP. AVERAGE OF 8 COUNTRIES
SOURCE: Compiled by authors with official country information.Based on FAO and PAHO, 2017
Sugar
Oils and butter
GrainLegumes
Sweetened products
Meat
Fruits
Milk and milk products
Vegetables
Sweetened
products
beverages
0
100
200
300
400
500
600
700
800
900
Ene
rgy
Den
sity
(kca
l/100
gr)
0 10.2 0.4 0.6 0.8 1.2 1.4 1.6 1.8Energy Cost (Price/100 kcal)
BOX 5 (CONTINUATION)
| 53 |
CHAPTER 2 ANALYSIS OF THE DIMENSIONS OF FOOD AND NUTRITION SECURITY
case, as depicted in Figure 31, not all the countries analyzed, manage to cover the cost of a family BFB with the income from a minimum wage and some would even need more than twice the value of a minimum wage to do so.
In other countries, although the minimum wage is sufficient to cover the family BFB, it represents more than half the family income (Table 7). Besides, it is important to consider that not all the basic needs of a family group are included in the cost of the BFB. Therefore, small price fluctuations may jeopardize the food and nutrition security of the family group.
It is important to note that the cost of the BFB can vary day to day, according to the fluctuations in the prices of the products that make up a BFB, whereas adjustments to the minimum wage41, are usually carried out once or twice a year. Therefore, during such period, variances in the cost of the BFB may not be offset by the increments in the minimum wage, thus increasing their negative effects. In the long term in most of the countries analyzed in the region, increments in the minimum wage tend to be greater than the cost of the basic food basket, except for Guatemala, where between 2004 and 2016, the increase in the basic food basket is higher by three percentage points; and Mexico, where the cost of the BFB is more than one percentage point above the minimum wage (Table 8).
Households that spend a large share of their income on food may end up buying less food than the amount required by the family group, or may opt to replace food items with options that are less healthy or have less nutritional value, when they are unable to cover the cost of a BFB, either due to the lack of sufficient income, price fluctuations or the need to spend on other items. n
41 Job quality, considering compliance with the minimum wage and social protection mechanisms in a context of macroeconomic stability has contributed to food and nutrition security.
FOOD EXPENDITURE BY INCOME QUINTILES: A HOUSEHOLD SURVEY APPROACH
Food expenditure by family group depends on different variables and realities, especially on income, which is a major determinant of the share spent on food, and the composition of such expenditure. To examine the impact of income level on food expenditure, the household surveys of five countries in the region were analyzed42 (The Plurinational State of Bolivia, Colombia, Ecuador, Peru and Mexico) and then the distribution of such expenditure and the calories consumed by food group were revised.
As may be observed in Figure 32, the low–income quintile spends most of its income43 on food. Among the countries analyzed, Colombia spends the largest percentage of income on food in all quintiles: 95% in the first quintile and 57.8 % in the wealthiest quintile. Next in line is Bolivia, where the poorest quintile spends 70.4 %, followed by Ecuador with 61.3% and Peru with 60.3%. Mexico, on the other hand, is further down the line, with 42.6% for the first quintile. It is interesting to observe that the difference between the share of food expenditure between the fourth and fifth quintiles is greater than that observed in the first four quintiles. This may reflect the income gap between the wealthiest groups and most of the population.
42 The food security module of the World Bank’s ADePT software was applied to the following national surveys: Bolivia: Household Survey 2009Colombia: National Income and Expenditure Survey 2006–07Ecuador: National Income and Expenditure Survey of Urban and Rural Households 2014Mexico: National Income and Expenditure Household Survey (ENIGH) 2014Peru: Living Conditions and Poverty Survey – ENAHO 2016.
43 For Bolivia, Colombia and Mexico, the income used is a proxy calculated on the total expenditure (including daily consumption expenses, goods, services and taxes). For Ecuador and Peru, the income used is a proxy calculated on the total daily consumption expenses, excluding goods, services and taxes.
| 54 |

2017PANORAMA OF FOOD AND NUTRITION SECURITY IN LATIN AMERICA AND THE CARIBBEAN
SOURCE: Compiled by the authors with official country information and data from the ILO (online). ILOSTAT.Note: In Ecuador, El Salvador, Guatemala, Nicaragua, Panama and the Dominican Republic the published BFB was divided by the number of family members it represents in each country. In Chile, Costa Rica and Mexico, the published BFB was used, given that it is based on one person. In Panama, El Salvador and Mexico, the BFB used is urban. Values are expressed in dollars using the applicable exchange rate for the relevant year.
SOURCE: Compiled by the authors with official country information and data from the ILO (online). ILOSTAT.Note: In Ecuador, El Salvador, Guatemala, Nicaragua, Panama and the Dominican Republic the published BFB that includes a representative family group of each country was used. In Chile, Costa Rica and Mexico, the published BFB is based on one person. Therefore, the BFB value published by these countries was multiplied by 4 persons. In Panama, El Salvador and Mexico, the BFB used is urban. Values are expressed in dollars using the applicable exchange rate for the relevant year.
FIGURE 30MINIMUM WAGE AND COST OF AN INDIVIDUAL BFB, IN SOME COUNTRIES OF LATIN AMERICA AND THE CARIBBEAN. IN DOLLARS. FOR DIFFERENT YEARS.
FIGURE 31MINIMUM WAGE AND COST OF THE FAMILY BFB, IN SOME COUNTRIES OF LATIN AMERICA AND THE CARIBBEAN. IN DOLLARS. FOR DIFFERENT YEARS.
0
100
200
300
400
500
600
CHL(2016)
CRI(2015)
ECU(2016)
SLV(2013)
GTM(2016)
MEX(2013)
NIC(2013)
PAN(2013)
DOM(2015)
Individual Basic Food Basket Minimum wage
0
100
200
300
400
500
600
CHL(2016)
CRI(2015)
ECU(2016)
SLV(2013)
GTM(2016)
MEX(2013)
NIC(2013)
PAN(2013)
DOM(2015)
Basic Food Basket (Home) Minimum wage
| 55 |

CHAPTER 2 ANALYSIS OF THE DIMENSIONS OF FOOD AND NUTRITION SECURITY
SOURCE: Compiled by authors with official country information and ILO data (online). ILOSTAT.a/ In these countries the BFB is calculated per person. For this analysis, a four–member family group was considered.
SOURCE: Compiled by authors with official country information and ILO data (online). ILOSTAT.
| 56 |
TABLE 6AVERAGE ANNUAL GROWTH OF THE MINIMUM WAGE AND THE BASIC FOOD BASKET IN SOME COUNTRIES OF LATIN AMERICA AND THE CARIBBEAN, FOR DIFFERENT PERIODS. IN PERCENTAGE VALUES.
TABLE 5WEIGHTING OF THE COST OF THE INDIVIDUAL AND FAMILY BASIC FOOD BASKET IN THE MINIMUM WAGE, IN SOME COUNTRIES OF LATIN AMERICA AND THE CARIBBEAN. FOR DIFFERENT YEARS. IN AVERAGE VALUES.
CountryWeighting of the BFB per
person in the minimum wage (%)
Weighting of the family BFB in the minimum
wage (%)Number of Persons
per household
Chile (2016)/a 16.1 64.2 4
Costa Rica (2015)/a 16.3 65.0 4
Ecuador (2016) 14.8 59.3 4
El Salvador (2013) 23.7 88.3 3.73
Guatemala (2016) 26.1 140.3 5.38
Mexico (2013)/a 72.0 287.8 4
Nicaragua (2013) 33.7 202.2 6
Panama (2013) 23.4 89.8 3.48
Dominican Republic (2015) 19.8 98.9 5
País Período Crecimiento salario mínimo (%) Crecimiento CBA (%)
Chile 2011–2016 6.44 5.66
Costa Rica 2005–2015 10.55 8.64
Ecuador 2014–2016 4.81 3.06
El Salvador 2003–2013 3.97 2.75
Guatemala 2004–2016 6.00 9.58
Mexico 2001–2013 4.62 5.82
Nicaragua 2011–2013 12.89 6.22
Panama 2010–2013 6.28 6.26
Dominican Republic 2012–2015 7.00 3.83

2017PANORAMA OF FOOD AND NUTRITION SECURITY IN LATIN AMERICA AND THE CARIBBEAN
| 57 |
Currently, overweight affects over 50 % of the population in Latin America and the Caribbean and stunting is still an issue in several countries in the region. In this context, it has been set forth that the establishment of healthy eating patterns may allow the joint reduction of all forms of malnutrition (FAO and PAHO, 2017). Therefore, it is interesting to analyze whether the most vulnerable sectors have access to healthy diets, since they are the ones who are the most impacted by these afflictions. As mentioned earlier, the BFB includes the goods required to meet the basic needs of the population and it is used to determine the extreme poverty line of each country, considering consumption habits (ECLAC, online). However, the composition of the BFB does not necessarily reflect a healthy dietary pattern.
In the case of Chile, in 2015, changes were made in the basic food basket to meet the nutritional energy, protein and fat intake needs (Ministry of Social
Development, 2015). However, according to Cuadrado and García (2015), the basic food basket includes foods that are based on poor nutritional criteria and are not recommendable. Therefore, the authors offered a proposed approach, aiming at a healthier food basket, and put together a Quality Food Basket, based on the original composition of the BFB. To this end, they used the recommendations offered by Chilean dietary guidelines. Simple carbohydrates, sugars and ultra–processed foods were reduced to a minimum; the percentage of available proteins from healthy sources was increased; the consumption of fluids other than mere water was reduced; and the intake of dietary fiber was increased. Table 6.1 shows the improvements in nutritional terms offered by the QFB versus the BFB (Cuadrado and Garcia, 2015).
BOX 6 QUALITY FOOD BASKET (QFB) APPROACH IN CHILE
TABLE 6.1 COMPARED NUTRITIONAL INDICATORS BETWEEN THE BASIC FOOD BASKET AND THE QUALITY FOOD BASKET, SHOWING THE RESULTING DIFFERENCES IN DIFFERENT UNITS
Indicators Basic Food Basket Quality Food Basket Variance
Grams of fruits and vegetables / day
303 626 106.6
% Proteins from animal sources 43.5% 47.5% 3.9
% Healthy proteins* 79% 98% 18.6
Servings of fish per week 1.79 2.2 23.2
Servings of dairy products per day 0.82 3.04 271.8
Servings of pulses per week 1.73 2.52 45.6
Servings of fruits and vegetables per day
3.66 7.37 101.6
Milligrams of salt per day 1347 1393 3.4
Added sugar 8.3% 4.5% -3.8
Total dietary fiber per day 16.8 24.3 44.9
Total kilocalories 2025 2025
Source of Kilocalories
Proteins 14.2% 16.1% 1.9
Lipids 27.9% 25.5% -2.5
Carbohydrates 57.8% 58.5% 0.6
SOURCE: Cuadrado y Garcia, 2015* The healthy sources of protein considered are poultry, fish, pulses, cereals and vegetables in general, excluding red meat.

CHAPTER 2 ANALYSIS OF THE DIMENSIONS OF FOOD AND NUTRITION SECURITY
Additionally, there are differences within each quintile, with respect to the distribution of consumption, in monetary value and calories, per each food group. As observed in Figure 33, in all the countries analyzed, the predominant foods in the poorest quintile are cereals and tubers, both in spending (cash value) and calories. However, the share of these food groups within calorie consumption is greater than the expenditure, reflecting the low cost compared to the calories provided by cereals and tubers.
On the other hand, as incomes increase, households of the countries analyzed tend to increase their consumption of ready–to–eat food and they also tend to eat meals away from home, which may result in a higher intake of ultra–processed foods that tend to have higher concentrations of sugar, fats, and sodium, than home–cooked meals (PAHO, 2015) (da Costa Louzada, y otros, et al, 2015) (Martínez Steele, y otros, et al, 2016). Hence, in the wealthiest quintile there is a predominance of food expenditure on ready–to–eat food and meals away from home, except for Colombia, where the share of food expenditure in cereals and tubers is the highest in the wealthiest quintile. As for calorie consumption in the wealthiest quintile, in Bolivia and Colombia, the greatest share is in cereals and tubers, while in the rest of the countries analyzed there is a
predominance of expenditure on ready–to–eat foods and meals away from home.
It is also observed that both fruits and vegetables, as well as meat and fish, account for a large share of food expenditure for both quintiles. However, when analyzing the distribution of consumption in calories, the share represented by these two groups drops significantly, reflecting the high cost involved for households when consuming these products. At the quintile level, the share in expenditure is similar for both quintiles. However, in terms of calories, in all the countries analyzed, the share is lower in the poorest quintile, especially, in Peru and Colombia, where the share in the poorest quintile is nearly half that of the richest.
In dairy products and eggs, Mexico stands out as the country with the largest share of expenditure in the poorest quintile. However, the share of calories in this same quintile is half that of the richest quintile, showing that the poorest households may find it too expensive to consume products from this food group.
The share of expenditure and calorie consumption in sugars, oils and fats, is greater in the first quintile, compared to the fifth quintile in the countries analyzed. In the case of sugars, the
| 58 |
Hence, there was a 5% decrease in calories from bread and cereals; a 59% reduction in meat; a 200% increase in dairy products and eggs; a 51% increase in fruits, vegetables, tubers and pulses; a 36% reduction in sugar, coffee, tea, sweets and condiments; and beverages other than water as well as food consumed away from home were eliminated.
As a result, the QFB is 36.1% more expensive than the BFB, which means that 27.1% of the Chilean population would be unable to access a minimum healthy diet (Cuadrado and Garcia, 2015).
BOX 6 (CONTINUATION)

2017PANORAMA OF FOOD AND NUTRITION SECURITY IN LATIN AMERICA AND THE CARIBBEAN
SOURCE: Compiled by authors with information from official country surveys, using the food security module of the World Bank’s ADePT software.
FIGURE 32PERCENTAGE OF FOOD EXPENDITURE BY QUINTILE, IN SOME COUNTRIES OF LATIN AMERICA AND THE CARIBBEAN, IN DIFFERENT PERIODS.
70.465.5
60.356.2
40.0
95.1
83.7
73.871.5
57.861.3
57.452.6
46.0
32.7
42.638.035.6
31.1
22.1
60.3
51.346.6
41.5
31.2
0
10
20
30
40
50
60
70
80
90
100
Bolivia (2009) Colombia (2007) Ecuador (2014) Mexico (2014) Peru (2016)
Quintile 1 Quintile 2 Quintile 3 Quintile 4 Quintile 5
countries that stand out are Colombia and Mexico, where the share of consumption in calories in the poorest quintile is twice that of the wealthiest quintile. Besides, in Colombia, in the poorest quintile, the share in food expenditure is three times higher than that of the fifth quintile.
The foregoing is in line with the study conducted by Drewnowski (2010) with respect to the cost–per–calorie of the different food groups, showing that the cost–per–calorie of fruits and vegetables is higher than the cost–per–calorie of carbohydrates and oils. Hence, when having to cover the minimum calories at a lower cost, the households that spend a large part of their income on food, have a higher tendency to choose calorie–dense foods such as cereals and tubers, sugars, oils and fats, which may not contain adequate nutrient levels for a healthy diet, compared to the higher–income households. In addition, small increments in the price of cereals or tubers may lead the poorest households to decrease the consumption of
other food groups with a higher cost–per–calorie, such as fruits and vegetables, to make up for the price increases in these food groups, as they represent the greatest share of their expenditure and consumption.
The monetary value of food expenditure does not only consider the purchase of food but also food sourced from people´s own production, and food away from home, as well as other sources, showing differences in distribution by quintile, which may prove relevant when analyzing households with a high percentage of food consumption with respect to income.
As shown in Figure 34, in all the countries analyzed, the poorest quintiles tend to consume a greater percentage of food from their own production. Bolivia and Peru stand out in this respect, with the poorest quintile consuming a relevant share of food from their own production, accounting for over 20% of the total calories
| 59 |

CHAPTER 2 ANALYSIS OF THE DIMENSIONS OF FOOD AND NUTRITION SECURITY
consumed, versus the percentage of the richest quintile, which is less than 4%. Thus, in the poorest quintile the share of expenditure in fruits and vegetables is quite relevant. Colombia also stands out, given that in the poorest quintile, at least 93% of the calories consumed, comes from purchased food, i.e. only 3.9% comes from people’s own production. This is important because, as shown earlier, food consumption represents 95% of the income of the poorest quintile, resulting in the concentration of food consumption in the most calorie–dense foods. Thus, among the countries analyzed, Colombia is the one with the greatest share of food expenditure spent on cereals and tubers (45%) and the one with less share allocated to fruits and vegetables (4%).
On the other hand, in the countries analyzed, food away from home tends to be greater in the highest quintiles, and Mexico is the country with the highest percentage in the richest quintile, reaching nearly 50%. The high percentage of food away from home registered in Peru in the poorest quintile is also noteworthy, as it is above 20%. n
RECENT GENERAL INFLATION AND FOOD TREND IN COUNTRIES OF THE REGION PASSED ON TO WAGES
Increases in general prices and food prices have a direct repercussion on the food and nutrition security of households, above all in the poorest quintiles, where, as observed earlier, the share of income spent on food is very high. On the other hand, wage adjustments are not as frequent and do not necessarily offset variations in inflation.
Given the economic situation of the region, in 2016 food inflation in South American countries tended to be higher versus the rates registered in 2015. In this context, adjustments in real average wages in 2016 for the countries in the subregion tended to register contractions or moderate growth (ECLAC and ILO, 2017). In Brazil, Colombia and Paraguay, the average real wage tended to decrease, and in Chile the variation was lower than the previous year. However, Uruguay registered an increment equal to that of the previous year, and in Peru the
variation was positive. In Central America and Mexico, on the other hand, real wages have benefitted from the decreasing inflation rates of 2016. Costa Rica, Mexico and Nicaragua had positive variations, albeit lower than the previous year. However, in Guatemala the average real wage declined versus the previous year.
Inflation has tended to improve in 2017, with the strengthening of national currencies (World Bank, 2017). Table 9 shows that in South America44, most countries have registered lower food inflation rates compared to the same months in the previous year, except for Peru, where the “El Niño Costero” weather phenomenon affected normal food supply45; and Paraguay, where inflation rates were much higher. In Central America46 rates are also lower than last year’s and some are even negative, such as those of Nicaragua, Panama and El Salvador. In Mexico, food inflation has tended to be higher, in a context of uncertainty with respect to US policies, currency depreciation and the increase in fuel prices.
In the Caribbean, after the high food inflation rates of 2016, in Haiti, rates are lower. However, they are still higher than those registered in 2015. Thus far, Jamaica, shows food inflation rates that are significantly lower than those registered in the same months of 2016, although they have tended to rise over the last few months. Trinidad and Tobago also register lower rates, while Belize shows negative food inflation rates.
44 As there is no available information on inflation in Venezuela for years 2016 and 2017 for this edition, it is not included in this analysis. In Argentina, as from May 2016, a new consumer price index series was presented. Therefore, the annual inflation rates for 2016 and early 2017 are not available.45 National Institute of Statistic and Informatics of Peru. Technical Report No. 4– April 2017: Variation of price indicators of the economy, March 2017.46 In June 2015 Costa Rica presented a change of Base. The figures considered in this report for previous months correspond to the Consumer Price Index Base July 2006=100. That is why there is no information on the annual variation for 2016.
| 60 |

2017PANORAMA OF FOOD AND NUTRITION SECURITY IN LATIN AMERICA AND THE CARIBBEAN
SOURCE: Compiled by authors with information from official country surveys, using the food security module of the World Bank’s, ADePT software.
FIGURE 33FOOD CONSUMPTION DISTRIBUTION IN MONETARY VALUE AND CALORIES, IN SOME COUNTRIES IN LATIN AMERICA AND THE CARIBBEAN, IN THE FIRST AND FIFTH QUINTILE, IN DIFFERENT PERIODS.
0 10 20 30 40 50 60 70 80 90 100
PER
MEX
EC
UC
OL
BO
L
Quintil 5Quintil 1
Quintil 5Quintil 1
Quintil 5Quintil 1
Quintil 5Quintil 1
Quintil 5Quintil 1
Calories
0 10 20 30 40 50 60 70 80 90 100
PER
MEX
EC
UC
OL
BO
L
Quintil 5Quintil 1
Quintil 5Quintil 1
Quintil 5Quintil 1
Quintil 5Quintil 1
Quintil 5Quintil 1
Monetary value
Cereals, roots and tubers Meat and fish
Vegetables and fruits Milk, cheese and eggsFood eaten away from homeand prepared food
Stimulants, alcoholicbeverages and spices
Oils and fats Sugars and syrups
Non alcoholic beverages Pulses and oil crops
| 61 |

CHAPTER 2 ANALYSIS OF THE DIMENSIONS OF FOOD AND NUTRITION SECURITY
SOURCE: Compiled by authors with information from official country surveys, using the food security module of the World Bank’s ADePT software.The 2008 survey was used for Mexico in this case, because it has disaggregated information on the percentage of food away from home, while the 2014 survey does not provide such information.
FIGURE 34FOOD CONSUMPTION PERCENTAGES IN CALORIES ACCORDING TO THEIR SOURCE, IN DIFFERENT COUNTRIES OF LATIN AMERICA AND THE CARIBBEAN, IN THE FIRST AND FIFTH QUINTILE, DURING DIFFERENT PERIODS.
0
20
40
60
80
100
BOL COL ECU MEX PER
Quintile 1Quintile 5 Quintile 1Quintile 5 Quintile 1Quintile 5 Quintile 1Quintile 5 Quintile 1Quintile 5
Purchased food Own produced foodFood consumed away from home Other sources
| 62 |

2017PANORAMA OF FOOD AND NUTRITION SECURITY IN LATIN AMERICA AND THE CARIBBEAN
When analyzing the series of budget surveys conducted in Mexico, from 2004 to 2014, important changes can be observed in households’ food expenditure (Figure 7.1). The share of income spent on food consumption has tended to increase in all
quintiles, increasing from 39% to 42.6% in the poorest quintile, and from 15.6% to 22% in the wealthiest quintile.
At the food group level, changes can be observed in the distribution of calories, which may favor the establishment of healthy eating patterns. The share of calorie consumption in fruits and vegetables increased for all quintiles, from 11% in the poorest quintile to 14.2% in the richest quintile. This also resulted in a higher share of food expenditure in the first three quintiles. On the other hand, it represented a decrease in the fourth and fifth quintiles (Table 7.1). Also, the share of calories represented by fats and oils dropped in almost all the quintiles, except for the highest quintile. However, it represented a significant increase
of 19.2% in the share of expenditure in the poorest quintile. Pulses and dried fruit and nuts registered significant increases in their share of calories in the third, fourth, and fifth quintiles, although, in monetary terms, this implied a marked reduction in the share of expenditure for the richest quintile. The share of calorie consumption from sugars dropped by over 30% in the poorest quintile. However, the percentage of spending rose by almost 30% in the same quintile.
BOX 7FOOD CONSUMPTION EVOLUTION IN MEXICO BETWEEN 2004 AND 2014
FIGURE 7.1 SHARE OF FOOD EXPENDITURE BY QUINTILE IN MEXICO, IN DIFFERENT YEARS. IN PERCENTAGES.
SOURCE: Compiled by authors with information from official country surveys, using the food security module of the World Bank’s ADePT software.
39.237.9
41.5 42.6
34.633.2
36.238.0
30.628.9
32.6
35.6
26.224.7
28.331.1
15.614.1
17.1
22.1
0
5
10
15
20
25
30
35
40
45
Quintile 1 Quintile 2 Quintile 3 Quintile 4 Quintile 5
2004 2006 2008 2014
| 63 |
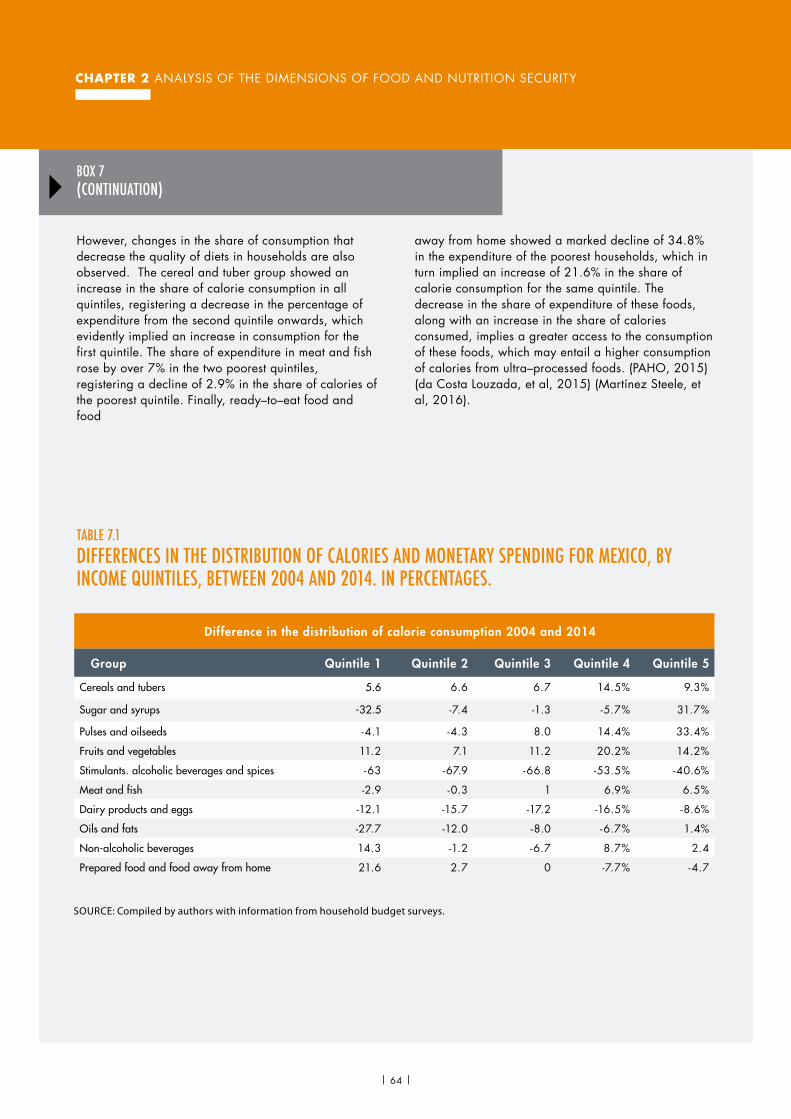
CHAPTER 2 ANALYSIS OF THE DIMENSIONS OF FOOD AND NUTRITION SECURITY
| 64 |
However, changes in the share of consumption that decrease the quality of diets in households are also observed. The cereal and tuber group showed an increase in the share of calorie consumption in all quintiles, registering a decrease in the percentage of expenditure from the second quintile onwards, which evidently implied an increase in consumption for the first quintile. The share of expenditure in meat and fish rose by over 7% in the two poorest quintiles, registering a decline of 2.9% in the share of calories of the poorest quintile. Finally, ready–to–eat food and food
away from home showed a marked decline of 34.8% in the expenditure of the poorest households, which in turn implied an increase of 21.6% in the share of calorie consumption for the same quintile. The decrease in the share of expenditure of these foods, along with an increase in the share of calories consumed, implies a greater access to the consumption of these foods, which may entail a higher consumption of calories from ultra–processed foods. (PAHO, 2015) (da Costa Louzada, et al, 2015) (Martínez Steele, et al, 2016).
BOX 7(CONTINUATION)
TABLE 7.1 DIFFERENCES IN THE DISTRIBUTION OF CALORIES AND MONETARY SPENDING FOR MEXICO, BY INCOME QUINTILES, BETWEEN 2004 AND 2014. IN PERCENTAGES.
Difference in the distribution of calorie consumption 2004 and 2014
Group Quintile 1 Quintile 2 Quintile 3 Quintile 4 Quintile 5
Cereals and tubers 5.6 6.6 6.7 14.5% 9.3%
Sugar and syrups -32.5 -7.4 -1.3 -5.7% 31.7%
Pulses and oilseeds -4.1 -4.3 8.0 14.4% 33.4%
Fruits and vegetables 11.2 7.1 11.2 20.2% 14.2%
Stimulants. alcoholic beverages and spices -63 -67.9 -66.8 -53.5% -40.6%
Meat and fish -2.9 -0.3 1 6.9% 6.5%
Dairy products and eggs -12.1 -15.7 -17.2 -16.5% -8.6%
Oils and fats -27.7 -12.0 -8.0 -6.7% 1.4%
Non-alcoholic beverages 14.3 -1.2 -6.7 8.7% 2.4
Prepared food and food away from home 21.6 2.7 0 -7.7% -4.7
SOURCE: Compiled by authors with information from household budget surveys.

2017PANORAMA OF FOOD AND NUTRITION SECURITY IN LATIN AMERICA AND THE CARIBBEAN
| 65 |
BOX 7(CONTINUATION)
TABLE 7.2 DIFFERENCES IN THE DISTRIBUTION OF CALORIES AND MONETARY SPENDING FOR MEXICO, BY INCOME QUINTILES, BETWEEN 2004 AND 2014. IN PERCENTAGES.
Difference in the distribution of monetary spending 2004 and 2014
Group Quintile 1 Quintile 2 Quintile 3 Quintile 4 Quintile 5
Cereals and tubers 0.1 -2.4 -4.3 -10.6 -11..8%
Sugar and syrups 29.4 -6.2 -16.8 -19.1 -92.1
Pulses and oilseeds 8.6 10.5 1.1 -4.4 -29.3
Fruits and vegetables 7.6 6.3 2.4 -4.8 -8.7
Stimulants, alcoholic beverages and spices 23.7 27.6 30.5 27.1 8.7
Meat and fish 7.4 7.3 5.4 0.3 -0.6
Dairy products and eggs 3.3 3.6 6 9 5
Oils and fats 19.2 9.1 8.1 12.4 2.7
Non-alcoholic beverages 6.3 10.3 16.9 10.4 7
Prepared food and food away from home -34.8 -17.8 -11.5 -2.2 1.6
SOURCE: Compiled by authors with information from household budget surveys.

CHAPTER 2 ANALYSIS OF THE DIMENSIONS OF FOOD AND NUTRITION SECURITY
SOCIAL PROTECTION POLICIES TO ENSURE ACCESS TO FOOD: EVIDENCE FROM CONDITIONAL CASH TRANSFER PROGRAMMES (CCT)
Considering that, as has been observed, income is an important conditioning factor for access to a healthy diet, analyzing the social policies implemented in the region can provide information on how to tackle this issue. In fact, over the last few years, Latin America and the Caribbean have designed and implemented a series of social protection policies and programmes, aimed at increasing available income for the most vulnerable population (FAO and PAHO, 2017).
Despite some institutional and economic liabilities caused by the structural adjustment process in late 1980s and early 1990s, the States of the region have managed to make promising headway in social protection coverage.47 In comparison with other regions of the world, Latin America and the Caribbean have made a greater effort to expand social protection coverage48 during the 1998–2015 period, including on average 59.6% of the population, exceeding by far the indicators of other developing regions, such as Sub–Saharan Africa (19.2%), South Asia (27%), North Africa and the Middle East (52.8%), East Asia and Pacific (58.9%), being only surpassed by Europe and Central Asia (69.3%).49 This progress at a regional level reflects: (i) greater political commitment and accrued technical experience in social protection in comparison with other regions, given the expansion and consolidation of social assistance systems during the 2000s, especially by means of conditional cash transfer programmes (CCTs), social pensions and school meal programmes; and (ii) the greater social
47 Social protection is the set of measures implemented in a society to ensure income levels that allow a minimum level of living conditions, facilitate access to social services and social promotion, and contribute to the expansion of decent employment (Cecchini and Martínez, 2011: 18). In the achievement of these goals, it is possible to implement measures for the direct provision and protection, prevention of specific risks, promotion of livelihoods and the transformation to promote social inclusion (Devereux and Sabates–Wheeler, 2004). An operational approach of social protection makes it possible to identify different types of interventions, according to their nature: social assistance (non–contributory social protection), social security (contributory social protection) and labor market policies (regulations to promote standards of decent work and employment benefits).48 Considering social assistance, social security and labor regulations.49 World Bank (online). 2017. The Atlas of Social Protection: Indicators of Resilience and Equity (ASPIRE).
security coverage due to economic growth, and the greater formalization of employment in urban areas, observed in the 2000s (Weller, 2014).
Conditional Cash Transfer programmes (CCTs) originated under the influence of two complementary facts observed in the countries in the region: (1) generally low social protection coverage in Latin America and the Caribbean; and (2) growing acknowledgement of the role of the State in the enforcement of Economic, Social and Cultural Rights (ESCR) (Cecchini and Nieves, 2015). Hence, CCTs are structured as initiatives to ensure the minimum wage for the most defenseless and vulnerable segments of the population. The nature of CCTs, which goes beyond the traditional concept of contributory social protection developed historically in the region during the 20th century, implies leaving behind the previous concept of having a specific safety net for emergencies and discretional assistance prevalent in the 1980s, moving onto a more universal type of social protection, reaching out in a more systematic and structured way to the most vulnerable population (Kliksberg and Novacovsky, 2015).
Several publications50 have addressed development and the role of CCTs in the eradication of hunger and poverty in Latin America and the Caribbean. Currently, 20 out of the 33 countries in the region have CCTs in operation, with a regional coverage of 20.2% of the population. It is worth noting that this corresponds to a slight but sustained decline of 1.8 percentage points in coverage between 2013 and 2016 (Cecchini & Atuesta, 2017), observed in a context in which both poverty and undernourishment have increased in the region. In turn, despite the extensive coverage they have achieved in most countries in Latin America and the Caribbean, many CCTs suffer from serious targeting issues, leading to the undue exclusion of broad segments of the population afflicted by severe scarcity. In fact, the scale of CCTs in the countries in the region is such that, if they were perfectly targeted in the poorest households of each
50 Which include: Bastagli, F., Hagen–Zanker, J., Harman, L., Barca, V., Sturge, G., Schmidt, T., and Pellerano, L. (2016). Cash transfers: what does the evidence say? A rigorous review of programme impact and of the role of design and implementation features. London: ODI. Cecchini, S. and Madariaga, A. 2011. Programas de Transferencias Condicionadas. Balance de la experiencia reciente en América Latina y el Caribe. Santiago de Chile, ECLAC; and Cecchini, Simone; Filgueira, Fernando; Martínez, Rodrigo and Rossel, Cecilia. 2015. Instrumentos de protección social: caminos latinoamericanos hacia la universalización. Santiago de Chile, ECLAC.
| 66 |

2017PANORAMA OF FOOD AND NUTRITION SECURITY IN LATIN AMERICA AND THE CARIBBEAN
TABLE 7 ANNUAL FOOD INFLATION RATES IN COUNTRIES OF LATIN AMERICA AND THE CARIBBEAN, 2015 TO 2017
Food Inflation
2015 2016 2017
Country Feb Mar Apr May Feb Mar Apr May Feb Mar Apr May
Antigua and Barbuda 3.2 2.7 1.3 2.6 0.3 -0.2 1.3 -0.9 ... ... ... ...
Argentina e 13.0 11.7 11.6 11.8 ... ... ... ... ... ... 29.1 25.9
Bahamas 6.4 5.2 4 3.7 ... ... ... ... ... ... ... ...
Barbados 1.9 0.9 1.3 1.1 2.4 4.7 4 7.6 ... ... ... ...
Belize -1 -0.7 -0.3 -0.2 0.9 1.2 1.1 0.4 -2.1 -2.1 ... ...
Bolivia 8.1 5.9 4.4 4.4 2 4.1 6.6 9.6 5.6 5.7 3. -1.2
Brazil 9 8.2 8 8.8 13.2 12.3 12.5 11.8 4.1 4.0 3.5 2.4
Chile 8.8 8 8 7.7 4 4.2 3.4 4.2 3.5 3.7 4.2 2.6
Colombia 6.8 7.4 7.7 6.2 11.9 12.4 12.6 13.5 5.2 3.7 2.5 2.1
Costa Rica a 8.2 7.7 6.4 3.5 ... ... ... ... 0.8 0.7 0.1 0
Dominica 0.3 0.5 0.7 0.5 0.9 0.3 0.1 0.2 ... ... ... ...
Ecuador b 4 3 4.1 5.3 3.7 3.9 2.8 2.8 1.2 1.3 1.8 1
El Salvador 3 3.5 4.2 3.8 1.6 0.7 -0.2 -0.5 -2.1 -1.2 -0.4 -0.4
Granada 2 2.2 2.1 1.6 -2.3 -2.7 -2.5 -2.3 ... ... ... ...
Guatemala 9 9.4 10 10.2 11.9 10.8 10.1 10 5.9 7.1 7.5 7.6
Guyana ... -1.1 ... ... ... 2 2.5 3.9 ... 5.2 4.2 ...
Haiti 6 5.9 5.7 6.3 16.1 16.4 16.8 13.9 14.1 14.3 ...
Honduras 5.2 5.4 4.7 3.8 2 1.5 1.1 1.3 0.4 0.8 1.5 1.1
Jamaica 8.6 7.9 8.1 7.9 7.8 7.4 6.4 6 2.2 3. 3.7 ...
Mexico 5 4.9 5.4 4.3 4.8 4.3 3.8 4.3 2.9 4.4 5.9 6.7
Nicaragua 9.3 9.5 9.4 7.6 2.1 3.1 2 2.3 -0.4 -0.9 -0.4 -1.2
Panama ... ... ... ... 2.2 2.3 2.5 1.9 0.5 0.1 -0.1 -0.1
Paraguay 5.3 3 1.1 4.4 5.7 5.6 5.5 2.9 2.8 3.7 5.8 5.1
Peru 4.7 4.9 4.6 4.4 4.2 4.4 4 3.2 4 6.4 5.6 4
Dominican Republic 8.2 5.7 3.7 3.7 5.3 5.1 5.2 4.9 0.3 0.9 2.5 2.5
Saint Kit ts and Nevis d -5.9 -5.6 -10.9 -11.5 -10 -10.2 -4.6 -4.6 ... ... ... ...
Saint Vincent and the Grenadines
-0.4 6.3 -0.8 -1.1 -2.4 -8.9 -1.1 0.6 ... ... ... ...
Saint Lucia 4.1 4.7 5.4 -0.4 -5.3 -5 -5.9 -0.6 ... ... ... ...
Surinam f 7.1 6.7 6.5 8 18.2 21.3 ... ... ... ... ... ...
Trinidad and Tobago 11.8 9.7 9.1 8.5 9.4 8.6 10 9.6 2.9 3.7 ... ...
Uruguay 9.1 8.5 8.7 9.6 9 9.7 10 11.6 4.5 4.1 3.5 1.1
Venezuela g 136.4 140.9 141.3 152.2 ... ... ... ... ... ... ... ...
| 67 |
SOURCE: Compiled by authors with official country information.a/ In June 2015 Costa Rica presented a Base Change. The figures considered in this report for previous months correspond to the Consumer Price Index Base July 2006=100b/ For January 2014 Ecuador presented a Base Change to 2014=100. The figures considered in this report for previous months correspond to the Consumer Price Index Base 2004=100.c/ For November 2013, Panama started the publication of the Consumer Price Index with the annual base 2013=100. The figures considered in this report for previous months correspond to the Consumer Price Index Base October 2002=100.d/For Saint Kitts and Nevis as from March 2016, data is being used since 2010. Prior to that, the information was only for Saint Kitts.e/ As from May 2016 a new consumer price index series was presented in Argentina. The information available for 2015 corresponds to the previous series.f// For the month of April 2016 Surinam began publishing the Consumer Price Index with annual base 2016=100. g/ There is no available information for Venezuela for 2016 and 2017 for this edition.
| 67 |
CHAPTER 2 ANALYSIS OF THE DIMENSIONS OF FOOD AND NUTRITION SECURITY
country, they would manage to cover the whole population living in extreme poverty and even nearly three fourths of the poor population.51 In practice, however, a considerable number of households living in extreme poverty (in some countries, nearly 50% of the total) are not covered by CCTs, evidencing that there are high levels of exclusion, conspiring against the achievement of greater efficacy in the efforts to reduce hunger and poverty in the region (Cecchini and Atuesta, 2017).
A distinctive aspect of CCTs is that the delivery of cash transfers is subject to compliance with co–responsibilities, most of them linked to areas of education and health (Cecchini and Madariaga, 2011). In turn, many of these conditional cash transfers, include among their specific goals that of promoting access to a greater variety of food and other basic commodities. In some cases, this has been implemented via specific calculation methods of the amounts to be transferred, the different transfer components of the programme, outreach mechanisms and nutritional education, or by restricting the use of the magnetic card to the purchase of food and other basic commodities. Likewise, the reduction in liquidity restrictions of the participating households, can also lead to small production investments, which may improve the food and nutrition security, and stabilize their agricultural means of subsistence.52 That is why it is estimated that by increasing the available income of a household, they would have effects on the reduction of poverty due to income and hunger, but at the same time, they could have positive effects on the dietary patterns of the most vulnerable social segments of the population.
An important number of CCTs have been assessed and/or studied to account for their effects on poverty, hunger and malnutrition. Table 10 provides a non–exhaustive summary of such effects.
51 However, this statement must be moderated, according to the diversity of situations present in the different countries of the region. Thus, while the size (coverage) of CCTs exceeds the number of destitute people in countries such as Argentina, Bolivia, Brazil, Colombia, Costa Rica, Ecuador, Mexico, Peru, Dominican Republic and Uruguay, it merely covers nearly half or less of the extremely poor people in lower middle–income countries of the region, such as Belize, El Salvador, Guatemala, Haiti, Honduras and Paraguay.52 In Latin America and the Caribbean, some examples are: the cases of Mexico in Gertler, Martínez and Rubio–Codina, (2006) and Todd, Winters and Hertz, (2010); and for Paraguay, Veras Soares, Perez Ribas and Hirata, (2008), as well as the systematic review conducted by FAO in the case of Tirivayi, Knowles and Davis (2013).
The effects included in the Table may be grouped under four categories:
1) Effects on income poverty: Through regular, predictable and constant delivery of cash transfers, CCTs may help reduce income poverty in programme users, and to improve inequality among income groups. This has direct effects on diets, as income is one of the main conditioning factors influencing access to food;
2) Effects on education and health: The co–responsibilities linked to school attendance and health care led to improvements in indicators such as user schooling level, and they have also enhanced impacts on the reduction of infectious diseases and the increase in vaccination, among other outcomes. Considering that nutritional education in elementary and secondary school settings is one of the most important channels for the promotion of healthy diets (FAO and PAHO, 2017), higher school attendance rates may have positive effects on long–term eating habits. In turn, the co–responsibilities linked to health care, together with the consumption of more and better foods, plus complementary interventions, have helped decrease malnutrition. However, it is important to point out that there are some cases, such as Mexico, where an increase in BMI has been reported in the minors who use the programme, which in turn has implications for the overweight and obesity rates in the most vulnerable population groups.
3) Effects on diets: Countries such as Argentina, Brazil, Colombia, Ecuador, El Salvador, Mexico and Peru report direct improvements in food consumption and dietary variety. This confirms the importance of CCTs in sustaining changes in dietary patterns, besides raising the need to expand research regarding the role that CCTs may play in this area.
4) Effects on food production: Finally, some programs also have effects on food production, especially in the case of families living in rural areas, by increasing purchases in farm inputs and boosting labor and land productivity (Tiribayi, Knowles and Davies, 2013). This may have positive implications for both self–consumption and the creation of permanent sources of income.54 n
54 A recent study coordinated by Higinio et.al (2016) explores the synergies between some social programs and rural production development in Latin America. Among other outcomes, the study identifies improvements in farming practices, an increase in assets used for production purposes and working capital in Peru, as well as greater crop diversification in El Salvador.
| 68 |
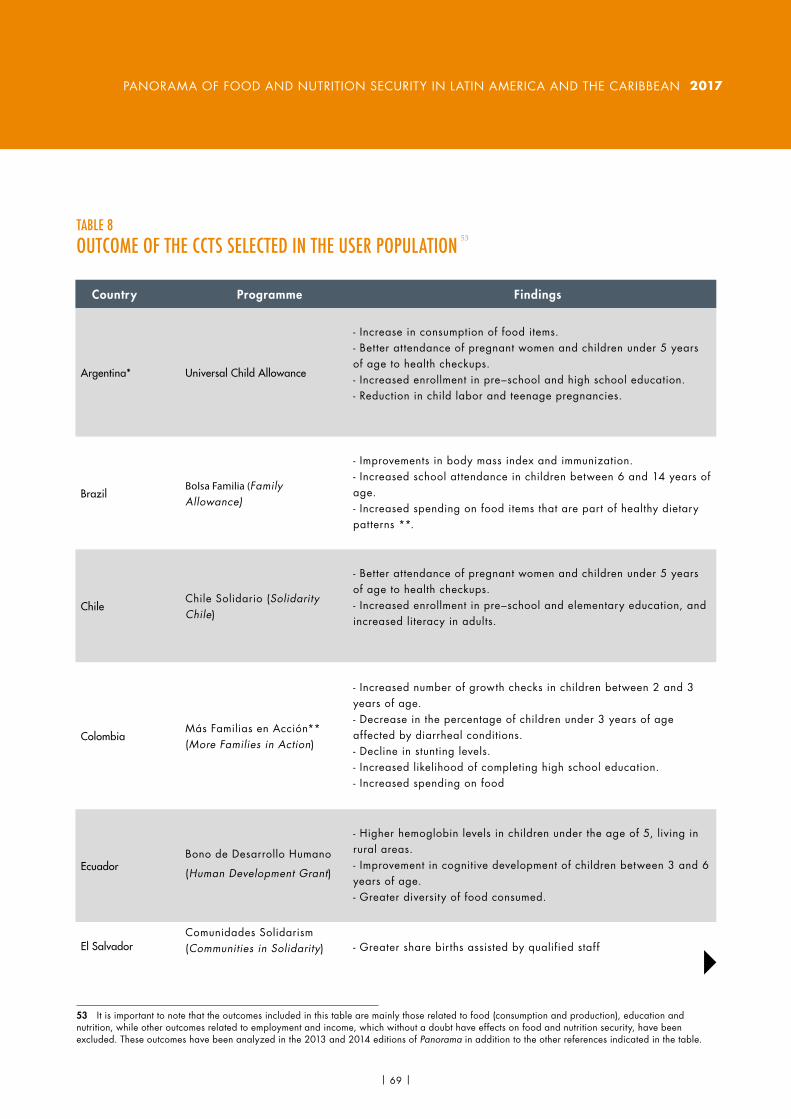
2017PANORAMA OF FOOD AND NUTRITION SECURITY IN LATIN AMERICA AND THE CARIBBEAN
53
53 It is important to note that the outcomes included in this table are mainly those related to food (consumption and production), education and nutrition, while other outcomes related to employment and income, which without a doubt have effects on food and nutrition security, have been excluded. These outcomes have been analyzed in the 2013 and 2014 editions of Panorama in addition to the other references indicated in the table.
| 69 |
TABLE 8 OUTCOME OF THE CCTS SELECTED IN THE USER POPULATION
Country Programme Findings
Argentina* Universal Child Allowance
- Increase in consumption of food items.- Better attendance of pregnant women and children under 5 years of age to health checkups.- Increased enrollment in pre–school and high school education. - Reduction in child labor and teenage pregnancies.
BrazilBolsa Familia (Family Allowance)
- Improvements in body mass index and immunization.- Increased school attendance in children between 6 and 14 years of age. - Increased spending on food items that are part of healthy dietary patterns **.
ChileChile Solidario (Solidarity Chile)
- Better attendance of pregnant women and children under 5 years of age to health checkups.- Increased enrollment in pre–school and elementary education, and increased literacy in adults.
ColombiaMás Familias en Acción** (More Families in Action)
- Increased number of growth checks in children between 2 and 3 years of age.- Decrease in the percentage of children under 3 years of age affected by diarrheal conditions.- Decline in stunting levels.- Increased likelihood of completing high school education.- Increased spending on food
EcuadorBono de Desarrollo Humano
(Human Development Grant)
- Higher hemoglobin levels in children under the age of 5, living in rural areas.- Improvement in cognitive development of children between 3 and 6 years of age.- Greater diversity of food consumed.
El SalvadorComunidades Solidarism (Communities in Solidarity) - Greater share births assisted by qualified staff

CHAPTER 2 ANALYSIS OF THE DIMENSIONS OF FOOD AND NUTRITIONAL SECURITY
| 70 |
TABLE 8 CONTINUATION
SOURCE: Compiled by authors based on information from: Rossel, Cecilia; Nieves Rico, María and Filgueira, Fernando. 2015. “Primera Infancia e Infancia” in Cecchini, Simone; Filgueira, Fernando; Martínez, Rodrigo and Rossel, Cecilia. 2015. Instrumentos de protección social: casinos Latin-Americans’ haka la universalización. ECLAC: Santiago de Chile. Pp. 85–125; and Bastagli, F., Hagen–Zanker, J., Harman, L., Barca, V., Sturge, G., Schmidt, T., and Pellerano, L. 2016. Cash transfers: what does the evidence say? A rigorous review of programme impact and of the role of design and implementation features. ODI: London.* For the case of Argentina: Kliksberg, Bernardo and Novacovksy, Irene (2015). El gran desafío: romper la trampa de la desigualdad desde la infancia. Aprendizajes de la Asignación Universal por Hijo. Editorial Biblos: Buenos Aires. ** Bortoletto Martins, Ana Paula and Monteiro, Carlos. 2016. Impact of the Bolsa Familia program on food availability of low–income Brazilian families: a quasi–experimental study. BMC Public Health 16, 827. ***The findings included in the table also refer to the Families in Action programme (Colombia) and Oportunidades programme (Mexico).****Tiribayi, N; Knowles, M. and Davies, B. 2013. The interaction between social protection and agriculture: a review of evidence. FAO: Roma.*****For the cases of Dominican Republic and Uruguay, respectively: Suriel, Altagracia (2015) “Progresando con Solidaridad: Principal estrategia del gobierno para reducir la pobreza extrema” and Labat, Juan Pablo (2015) “Evaluación y seguimiento del Plan Equidad”. Presentations at International Seminar: “Social Protection and Inclusion Systems in Latin America”. Buenos Aires, May 21, 2015.
Country Programme Findings
MexicoPROSPERA Social Inclusion Programme (formerly – “Oportunidades”) ***
- Increased food consumption, calorie intake, and dietary diversity.- Reduction of underweight in rural areas.- Increased school attendance and improved enrollment in high school education in rural areas.- Increased spending on food.- Improved dietary diversity.- Increased BMI in minors, with risks of increasing overweight ****.- Increased use of land and livestock ownership ****.
Paraguay **** Tekoporã- Decrease in food spending.- Increase in likelihood of buying livestock.
PeruJUNTOS (Together) National Programme of Direct Support to the Poorest
- Increased attendance to health checkups for children under 5 years of age.- Increased school attendance.
Dominican Republic ***** Progressing with Solidarity
- Greater percentage of minors who are users of the programme and have their vaccination and health checkups in order, compared to minors who are eligible but are not beneficiaries of the programme.- Reduction in the percentage of student dropout rate in students who are users of the programme, compared to students who are eligible but are not beneficiaries of the programme.
Uruguay***** Family Allowances - Increased enrollment in high school education.
2017PANORAMA OF FOOD AND NUTRITION SECURITY IN LATIN AMERICA AND THE CARIBBEAN
Key Messages:è Drinking water and sanitation infrastructure are basic conditions to eradicate malnutrition and ensure adequate use and transformation of food. Coverage of utilities such as drinking water and sanitation in the region has improved in the last 15 years, but access to safe water sources is still under the global average.
è Important differences are observed in access to utilities in the region, both among and inside countries. Rural areas and low–income population groups have significantly less access to drinking water and sanitation in Latin America and the Caribbean.
è Efforts by governments in the region to ex-pand coverage of drinking water and sanitation are reported, both with respect to investment in infrastructure and subsidies to ensure economic access to these services.
UTILIZATION ACCESS TO DRINKING WATER AND BASIC SANITATION IS ESSENTIAL TO ENSURE GOOD NUTRITIONAL STATUS
Difficult access to basic drinking water and sanitation infrastructure is one of the underlying causes of malnutrition, especially in children. Although the quality and coverage of these services has improved over time, there are still important risks, with negative consequences for food and nutrition security (HLPE, 2015b). Lack of these services does not only affect people’s health but also adds barriers to the reduction of poverty, by limiting socioeconomic development and harming the environment (ECLAC, 2017). In regards to child health and nutrition, undernourishment can be linked to the absence of adequate drinking water and sanitation facilities in the household, which increases the risk of contracting diseases that contribute to the development and severity of undernourishment (UNICEF, 2006).55
The importance of having the necessary access conditions to basic drinking water and sanitation services is acknowledged in the 2030 Agenda, which addresses not only aspects of coverage but also the quality and sustainability of water. This agenda seeks to make progress in providing more equitable and efficient access to such services and shows concern for the environmental impact of their implementation. In Latin America and the Caribbean there are still important gaps to be bridged in the coverage of water and sanitation facilities. Progress in this front is heterogeneous and responds to different strategies in each country, which in turn depend on geographic, socioeconomic, cultural and institutional characteristics (ECLAC, 2017).
Access to unpolluted water is essential for food production and preparation. Many diseases are transmitted via food consumption and may originate in the use of water that is unsuitable for human consumption, which may have been used
55 By way of example, in Andean countries, the prevalence of underweight is lower in households where water comes from piped connections versus households were water comes from unsafe sources (UNICEF, 2006).
| 71 || 71 |

CHAPTER 2 ANALYSIS OF THE DIMENSIONS OF FOOD AND NUTRITION SECURITY
either in the production or preparation of food. Contaminated water is the vehicle for the transmission of any pathogens and pollutants from the environment to the food chain, with ensuing implications for food safety (ECLAC, 2017). Overcoming these issues may help reduce the incidence of some diseases linked to contaminated water, or eradicate them completely. Evidence suggests that improved access to water and sanitation infrastructure has a direct incidence on the reduction of child mortality, by preventing the development of diseases such as diarrhea, and consequently improving nutritional status (HLPE, 2015b).
Figure 35 depicts coverage of drinking water 56 in Latin America and the Caribbean and its subregions. In the region, 65% of the population has drinking water facilities and 31% has sanitation infrastructure. In South America, in 2015 these figures reached 74% and 22% respectively, while in Mesoamerica they reached 50% and 47%, respectively. In the Caribbean, the population that has access to at least basic services is 88% of the subregional population. For all cases, coverage of the population that has access to at least basic services increased between 2000 and 2015. However, when compared to global averages, the region is under the coverage rates of safely–managed water sources, which stand at 71% of the global population versus 65% for Latin America and the Caribbean.
In any event, 96% of the regional population has access to at least basic infrastructure, accounting for an increase in coverage of 133.5 million people, versus the year 2000. However, as at 2015, nearly 8 million people lack access to any type of basic
56 Drinking water services refer to accessibility, availability and quality of the main water source sued by households for drinking, cooking, personal hygiene and other domestic purposes. The classification used is:- Safely managed water service: drinking water from an improved water source which is located on the premises, available when needed and free of contamination.- Basic service: drinking water from and improved source, provided collection time is not more than 30 minutes for a roundtrip.- Limited service: drinking water from an improved source where collection time exceeds over 30 minutes for a roundtrip to collect water. - Unimproved source: drinking water from an unprotected dug well or unprotected spring.- Surface water: drinking water collected directly from a river, dam, lake, pond, stream, canal or irrigation channel.
facilities, and therefore must extract water directly from rivers, lakes or other surface water source. Thus, 16.2 million people have access to unimproved or limited sources of water. In this last case, collecting water implies trips of more than half an hour (roundtrip), and in most countries this task is usually performed by women or girls.57
As for sanitation infrastructure58, access to improved facilities increased between 2000 and 2015, both for the whole of Latin America and the Caribbean and its subregions. During this period, coverage of at least basic sanitation infrastructure expanded to more than 147.5 million people (Figure 36). Although the number of people without coverage has dropped significantly, during the period, over 19 million people still lack sanitation infrastructure, in addition to over 39.3 million people who have access to unimproved sanitation facilities, and nearly 32 million people in Latin America and the Caribbean who share sanitation facilities with other households. n
57 https://data.unicef.org/topic/water–and–sanitation/drinking–water/58 Sanitation services refers to the management of excreta in facilities used by persons, by emptying and transporting them offsite. The classification used is: - Safely managed service: use of improved sanitation facilities not shared with other households and where excreta are safely disposed of in situ or transported and treated off–site.- Basic service: use of improved sanitation facilities not shared with other households. - Limited services: use of improved sanitation facilities shared by two or more households.- Unimproved sanitation: use of pit latrines or similar facilities. - Open defecation: disposal of human feces in fields, forests, bushes, open bodies of water, beaches and other open spaces.
| 72 |
2017PANORAMA OF FOOD AND NUTRITION SECURITY IN LATIN AMERICA AND THE CARIBBEAN
Utilization is related to food consumption and transformation, and the absorption and incorporation of nutrients that allow people to lead healthy and active lifestyles, or which on the contrary, may result in different forms of malnutrition, anomalies in growth, cognitive development, immune system, and a higher risk of suffering from non–communicable diseases early life stages. The conditions in which these processes are carried out such as living conditions related to access to drinking water, sanitation and public health care, and the quality and quantity of food consumed are also important. Hence, the food system must focus on ensuring the availability, quality and variety of food, and on fostering the consumption of adequate quantities of nutritious and safe foods that make up healthy diets.
Nutritional status affects different development phases in a person’s life cycle, and nutritional deficiencies will have different impacts depending on the stage in which they occur. Therefore, the nutritional status of mothers, infants and children is paramount, as they are the groups who will suffer a greater impact from the consequences of malnutrition throughout their life course (from early childhood to adulthood), affecting their future physical and mental development possibilities.
Malnutrition comes in many forms and is present in a considerable share of the region’s population. On the one hand, in terms of child undernutrition, the region has made important progress, although there are countries with considerably high prevalence of child undernutrition in all its forms, particularly in the poorest groups and rural areas. On the other hand, overweight and obesity are health issues with a generalized
upward trend, mainly affecting women. In addition, a less evident but not less important health issue is the deficiency of micronutrients required for good health and development, which is also known as “hidden hunger”.
In this context, the countries in the region have implemented a series of measures seeking to improve the nutritional health of the population. Some examples of these measures include the “Universal Prenatal Subsidy”, implemented by the Plurinational State of Bolivia to reduce maternal and child mortality rates, where beneficiaries receive food packages with high nutritional content until child birth. On the other hand, El Salvador together with the World Food Programme, launched the project known as “Nutrimos El Salvador” (“Nourishing El Salvador”), which gives nutritional bonuses to communities living near or under the poverty line, seeking to prevent stunting in the first thousand days of a child’s life.
Food and nutrition education, on the other hand, seeks to improve knowledge on food and nutrition and change the eating habits of the target population. The countries in the region have implemented different measures to achieve this. In Costa Rica, for instance, there is a campaign urging mothers to “Breastfeed your baby: it’s healthier” that seeks to convey messages in different multimedia platforms promoting breastfeeding during the first year of life. Paraguay launched an initiative called “National Strategy for the Prevention and Control of Obesity 2015–2025”, which includes in its six strategic axes, one which is especially aimed at promoting health and overweight and obesity prevention, and another one aimed at the surveillance, research and information on nutrition.
BOX 8ON THE BIOLOGICAL UTILIZATION OF FOOD
SOURCE: Compiled with information from FAO and PAHO, 2017.
| 73 |

CHAPTER 2 ANALYSIS OF THE DIMENSIONS OF FOOD AND NUTRITION SECURITY
SOURCE: WHO/UNICEF Joint Monitoring Programme for Water Supply and Sanitation.*/ Having at least basic infrastructure involves safely–managed and basic services.
SOURCE: WHO/UNICEF Joint Monitoring Programme for Water Supply and Sanitation.*/ Having at least basic infrastructure involves safely–managed and basic services.
FIGURE 35DRINKING WATER COVERAGE, SUBREGIONS OF LATIN AMERICA AND THE CARIBBEAN. 2000–2015, PERCENTAGE (%) OF THE POPULATION
FIGURE 36SANITATION COVERAGE, SUBREGIONS OF LATIN AMERICA AND THE CARIBBEAN. 2000–2015, PERCENTAGE (%) OF THE POPULATION
61
29
163
65
31
12 1
75
17
52
74
22
01 2
43
45
183
50
47
12 1
85
375
88
391
0
20
40
60
80
100
Latin America and the Caribbean South America Centroamerica Caribbean2000 2015 2000 2015 2000 2015 2000 2015
Safely managed service Basic Services At least basic servicesLimited services Unimproved source Surface water
10
65
4
11
10
22
63
563
10
66
3
12
9
22
65
373
8
66
6
9
11
28
59
742
71
9
10
10
74
13
76
0
20
40
60
80
100
Latin America and the Caribbean South America Central America Caribbean2000 2015 2000 2015 2000 2015 2000 2015
Safely managed service Basic service At least basic serviceLimited service Unimproved source Open defecation
| 74 |

2017PANORAMA OF FOOD AND NUTRITION SECURITY IN LATIN AMERICA AND THE CARIBBEAN
GREAT INEQUALITY IN COVERAGE OF DRINKING WATER AND SANITATION PERSISTS IN RURAL AREAS AND AMONG THE POOREST POPULATION GROUPS
Considering the foregoing scenario, it is necessary to highlight the existing gaps and disparities in the region, in the access to basic drinking water and sanitation services, both between and inside countries. The poor and people living in rural areas are usually the ones who face more difficulties when it comes to having improved facilities of accessing these services.
Figure 37 depicts sanitation services by geographic area. As may be observed, in some cases, the difference is significantly greater, with lower coverage in rural areas compared to urban sectors. For instance, in Haiti, almost two thirds of the rural population have no access to sanitation facilities or have improved sanitation versus 22% of the urban population. In Guatemala, nearly 40% of the population is in this situation in the rural area, compared to 8.9% of the urban population, while in Bolivia, 67% of the rural population has no services or only access to unimproved sanitation, versus 8.8% of the urban population. On the other hand, in general terms, the percentage of people who share sanitation facilities is greater in the urban sector than in the rural area.
The situation is similar with respect to coverage of the population with access to drinking water, which is greater in the urban population than in rural areas. However, in most countries, the gap is smaller between geographic areas. On the other hand, in several countries this service either has universal or close to universal coverage.
On the other hand, when comparing access to services by income level, it is usually more difficult for the poorest quintile to access such services (Figure 39). Among the countries with available information, the poorest population groups of Bolivia and Haiti are the ones who are more lacking in this aspect, with 80% of the poor having no access to improved sanitation facilities, and in the case of drinking water, with only 40% and 64%, respectively, having access to such service. n
WATER AND SANITATION POLICIES
Access to water and sanitation lies at the basis of human development, being fundamental for the agricultural, industrial, energy and household sectors, particularly for the development of human settlements and ecosystems. The existence of adequate water and sanitation services is essential for preventing infectious and parasitic diseases, many of which are caused by undernutrition. Lack of appetite, inadequate nutrient absorption, hypermetabolism and greater loss of blood are some of the impacts of such diseases and infections, which may increase the risk of stunting, affect cognitive development, result in weaker immune systems, cause anemia, premature labor, child undernutrition, impaired growth, and may even compromise the efficacy of nutritional interventions (WHO, UNICEF and USAID, 2015).
Water and sanitation interventions may interrupt the transmission pathways of pathogens from the environment to people via water. By implementing actions to remove such pathogens, sanitation erects a primary barrier preventing pathogens from entering water sources and farm fields, besides preventing contamination by flies (WHO, UNICEF and USAID, 2015).
On the other hand, scarcity of water for agricultural and food systems is an issue that several countries in Latin America and the Caribbean are facing, as availability of water is very different across geographic regions, depending on rainwater, and surface and groundwater levels. Besides, climate change adds uncertainty to the availability of water, as it affects precipitation, runoff, hydrological flows, water quality, water temperature, and groundwater recharge. According to the High–Level Panel of Experts (HLPE), land and water management needs to preserve ecosystem functions and ensure the future of the resource to achieve food security, since it is key for ensuring the quantity and quality of water (HLPE, 2015b).
Access to drinking water and sanitation services is one of the indicators that make up the Human Development Index (HDI), which is a composite of average achievement in key dimensions of human
| 75 |

CHAPTER 2 ANALYSIS OF THE DIMENSIONS OF FOOD AND NUTRITION SECURITY
SOURCE: WHO/UNICEF Joint Monitoring Programme for Water Supply and Sanitation.
FIGURE 37COVERAGE OF SANITATION IN COUNTRIES OF LATIN AMERICA AND THE CARIBBEAN. 2015, PERCENTAGE (%) OF THE POPULATION BY AREA OF RESIDENCE
0 20 40 60 80 100
VEN
URY
PRY
PER
ECU
COL
CHL
BRA
BOL
ARG
UrbanRural
UrbanRural
UrbanRural
UrbanRural
UrbanRural
UrbanRural
UrbanRural
UrbanRural
UrbanRural
UrbanRural
South America
0 20 40 60 80 100
SLV
PAN
NIC
MEX
HND
GTM
CRI
UrbanRural
UrbanRural
UrbanRural
UrbanRural
UrbanRural
UrbanRural
UrbanRural
Mesoamerica
0 20 40 60 80 100
SUR
LCA
JAM
HTI
GUY
DOM
CUB
BLZ
UrbanRural
UrbanRural
UrbanRural
UrbanRural
UrbanRural
UrbanRural
UrbanRural
UrbanRural
Caribbean
At least basicLimited service
Unimproved and without service
| 76 |

2017PANORAMA OF FOOD AND NUTRITION SECURITY IN LATIN AMERICA AND THE CARIBBEAN
SOURCE: WHO/UNICEF Joint Monitoring Programme for Water Supply and Sanitation
FIGURE 38COVERAGE OF DRINKING WATER IN COUNTRIES OF LATIN AMERICA AND THE CARIBBEAN. 2015. PERCENTAGE (%) OF POPULATION BY AREA OF RESIDENCE
0 20 40 60 80 100
VEN
URY
PRY
PER
ECU
COL
CHL
BRA
BOL
ARG
UrbanRural
UrbanRural
UrbanRural
UrbanRural
UrbanRural
UrbanRural
UrbanRural
UrbanRural
UrbanRural
UrbanRural
South America
0 20 40 60 80 100
SLV
PAN
NIC
MEX
HND
GTM
CRI
UrbanRural
UrbanRural
UrbanRural
UrbanRural
UrbanRural
UrbanRural
UrbanRural
Mesoamerica
0 20 40 60 80 100
SUR
LCA
JAM
HTI
GUY
DOM
CUB
BLZ
UrbanRural
UrbanRural
UrbanRural
UrbanRural
UrbanRural
UrbanRural
UrbanRural
UrbanRural
Caribbean
At least basic service
Limited serviceUnimproved and without service
| 77 |
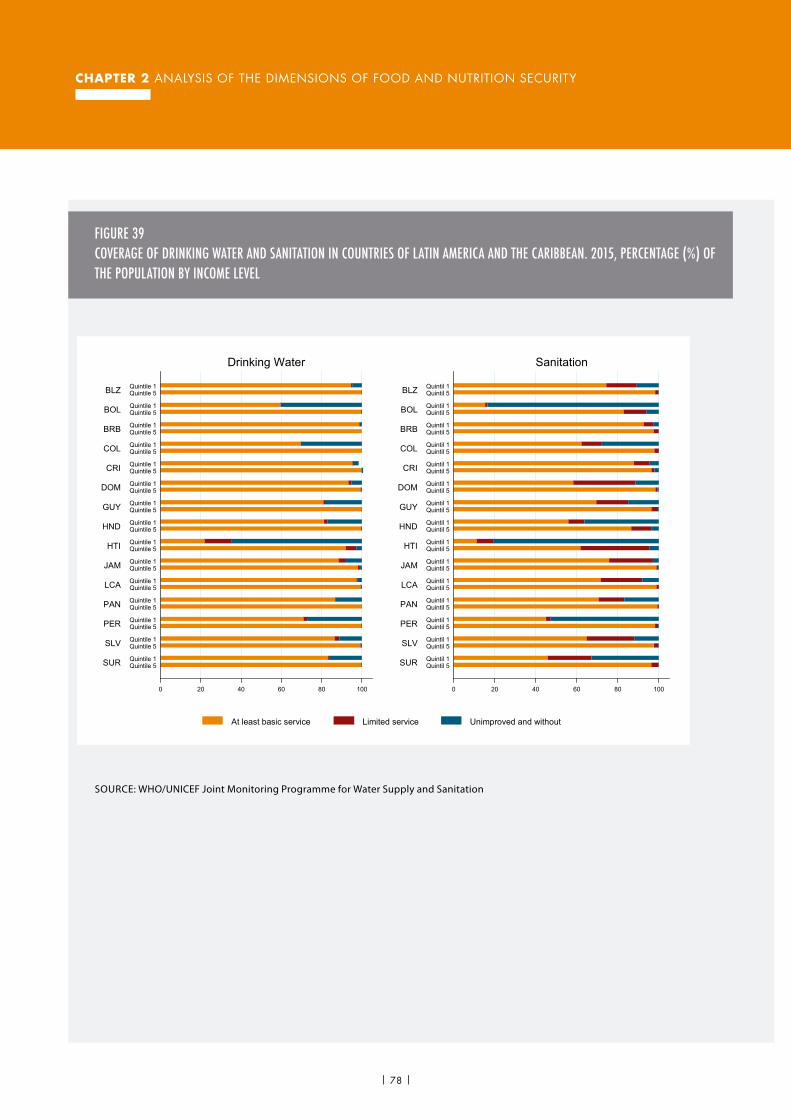
CHAPTER 2 ANALYSIS OF THE DIMENSIONS OF FOOD AND NUTRITION SECURITY
SOURCE: WHO/UNICEF Joint Monitoring Programme for Water Supply and Sanitation
FIGURE 39COVERAGE OF DRINKING WATER AND SANITATION IN COUNTRIES OF LATIN AMERICA AND THE CARIBBEAN. 2015, PERCENTAGE (%) OF THE POPULATION BY INCOME LEVEL
0 20 40 60 80 100
SUR
SLV
PER
PAN
LCA
JAM
HTI
HND
GUY
DOM
CRI
COL
BRB
BOL
BLZ
Quintile 5Quintile 1
Quintile 5Quintile 1
Quintile 5Quintile 1
Quintile 5Quintile 1
Quintile 5Quintile 1
Quintile 5Quintile 1
Quintile 5Quintile 1
Quintile 5Quintile 1
Quintile 5Quintile 1
Quintile 5Quintile 1
Quintile 5Quintile 1
Quintile 5Quintile 1
Quintile 5Quintile 1
Quintile 5Quintile 1
Quintile 5Quintile 1
Drinking Water
0 20 40 60 80 100
SUR
SLV
PER
PAN
LCA
JAM
HTI
HND
GUY
DOM
CRI
COL
BRB
BOL
BLZ
Quintil 5Quintil 1
Quintil 5Quintil 1
Quintil 5Quintil 1
Quintil 5Quintil 1
Quintil 5Quintil 1
Quintil 5Quintil 1
Quintil 5Quintil 1
Quintil 5Quintil 1
Quintil 5Quintil 1
Quintil 5Quintil 1
Quintil 5Quintil 1
Quintil 5Quintil 1
Quintil 5Quintil 1
Quintil 5Quintil 1
Quintil 5Quintil 1
Sanitation
At least basic service Limited service Unimproved and without
CHAPTER 2 ANALYSIS OF THE DIMENSIONS OF FOOD AND NUTRITION SECURITY
| 78 |

2017PANORAMA OF FOOD AND NUTRITION SECURITY IN LATIN AMERICA AND THE CARIBBEAN
Diarrhea is the second cause of child mortality in the world, being both the source and the consequence of inadequate nutrition, affecting nutrient absorption and food intake (HLPE, 2015b).
Based on the Demographic Health Surveys (DHS), it is possible to observe that the prevalence of this disease in children under 5 years of age is found in households with no proper drinking water and sanitation facilities, in some countries in the region.
Table 7.1 shows that a significant share of children under 5 years of age suffer from this disease in the selected countries. In 2012, Bolivia has a prevalence of 22.8%, Haiti 20.8% and Guatemala 19.2%.
BOX 9PREVALENCE OF DIARRHEA IN CHILDREN UNDER FIVE YEARS OF AGE
SOURCE: The DHS Program.
TABLE 9.1 PREVALENCE OF DIARRHEA IN CHILDREN UNDER 5 YEARS OF AGE, IN SOME COUNTRIES OF LATIN AMERICA AND THE CARIBBEAN
Country/year Prevalence of diarrhea in children under 5 years of age
Bolivia (2012) 22.8
Dominican Republic (2013) 18
Guatemala (2014–15) 19.2
Guyana (2009) 9.9
Honduras (2011–12) 17.8
Peru (2014) 12.7
Haiti (2012) 20.8
As for sanitation services and the prevalence of diarrhea, Table 7.2 shows that in Bolivia, households with no access to such services register a higher prevalence of diarrhea in children under 5 years of age, than households with sanitation services, either improved, not shared or shared. Prevalence is also higher in households with shared sanitation services than in households with unimproved sanitation services. In Guatemala, prevalence in households with
shared sanitation services stands at 23.2%, while in households with unimproved sanitation services it is 19.3%; in Haiti, the same ratio registers a prevalence of 24.6% and 21.1%, respectively. Finally, in Guyana, prevalence is twice as high in unimproved or shared sanitation services.
| 79 || 79 |

BOX 9(CONTINUATION)
TABLE 9.2 PREVALENCE OF DIARRHEA IN CHILDREN UNDER 5 YEARS OF AGE IN SOME COUNTRIES OF LATIN AMERICA AND THE CARIBBEAN, BY SANITATION SERVICE
Prevalence of diarrhea in children under 5 years of age, by sanitation service
CountryImproved
or not shared
Unimproved or shared Shared Unimproved No
Service
Bolivia, 2008 24.8 25.2 28.4
Dominican Republic, 2013 17.5 19
Guatemala, 2014–15 18.3 23.2 19.3
Guyana, 2009 8.1 15.4
Peru, 2014 11.4 12.9
Haiti, 2012 15.1 24.6 21.1
SOURCE: The DHS Program
Finally, according to UNICEF (2004), 88% of these type of diseases are caused by inadequate water sources and deficient sanitation facilities. If the quality
of water used inside the household improves, a significant reduction of these episodes is estimated (approximately 35% and 39%).
CHAPTER 2 ANALYSIS OF THE DIMENSIONS OF FOOD AND NUTRITION SECURITY
| 80 |

2017PANORAMA OF FOOD AND NUTRITION SECURITY IN LATIN AMERICA AND THE CARIBBEAN
development, such as a long and healthy life, knowledge acquisition, and a decent standard of living; and the Human Opportunity Index (HOI) which measures how far or close a society is to achieving universal access to an essential good or service, and how equitably access is distributed among people (World Bank, 2016b). Although, poverty and extreme poverty levels have declined in Latin America and the Caribbean, their incidence is still high, reflecting inadequate provision of public services, both due to lack of access and to the quality of such services. This becomes far more obvious, when observing the unequal distribution of poverty and extreme poverty rates between rural and urban areas (FAO and PAHO, 2017).
Sustainable Development Goal 6 proposes to ensure availability and sustainable management of water and sanitation for all, thus decreasing the diseases and deaths related to access to such services (United Nations, n.d.). Access to water, sanitation and hygiene is a human right closely linked to the right to life, food and health. Besides, it represents vital factors for human well–being and development, such as adequate nutrition, eradication of poverty and gender equality.
Currently, 96% of the population of Latin America and the Caribbean has access to basic and improved drinking water services; and 86% has access to basic and improved sanitation services, with the poor rural population group having less coverage. Although the existing gap between the rural and urban area has been reduced, there still are differences. As at 2015, 98.8% of urban population had access to drinking water. However, in the same year, the figure for the rural area was 85.4%. A similar situation may be observed in access to sanitation. While 90% of the urban population had access to such services, in rural areas only 68.4% of the population did. These figures evidence the challenges faced in this aspect in the region, which mainly involve reducing the differences between urban and rural areas. This may be observed in the fact that in the last few years rural coverage has increased more than urban coverage, which is practically at a standstill since 2000 (WHO and UNICEF, online). From 2000 to 2015, coverage of basic water and improved sanitation services has increased by 15% and more than 21%, respectively.
Although Latin America and the Caribbean register high rates in the use of improved drinking water sources and sanitation, over 24 million and more than 90 million people have no access to basic or improved water and sanitation services, respectively. To reduce disease and deaths from the lack of access to drinking water and basic sanitation, in order to increase wellbeing, improve health and promote productivity, countries in the region have developed and implemented a series of public policies that promote, improve, regulate and/or govern access to water and sanitation services.
There is a wide variety of laws addressing the matter across the region, including general water acts, sectorial health or environmental laws or specific sectorial national or subnational water and sanitation laws.59 For instance, countries such as Ecuador, Nicaragua, Uruguay and several English–speaking countries of the Caribbean have general water acts or sectoral health or environmental laws, governing water and sanitation services. Among other countries, Bolivia, Chile, Peru, Paraguay, Costa Rica and Honduras have specific sectoral national laws for water and sanitation; while Argentina has subnational sectoral laws due to its federative character. Depending on the effective coverage in water and sanitation services, countries in the region have also addressed the matter by means of broad plans, such as national development plans or in guidelines such as sectoral development policies or plans. For instance, Argentina, Barbados, Chile, Costa Rica, Uruguay, Colombia and Trinidad and Tobago do not have specific national sectoral plans, either because of the large coverage of their services or, as in Argentina due to their federative character. As for the various institutional frameworks in place in LAC, marked differences may be observed across countries, either as regards the governing institution, the entity in charge of supervision and the body providing the services. In some cases, a single body may perform all the cited functions.
59 Laws regulate the essential basis of a legal order, on a general and mandatory basis; complementary or detailed aspects are then regulated by statutory regulations. Sectoral laws, on the other hand, address the issue of access to water and sanitation services and regulate the matter, in the context of health or the environment. Finally, national or subnational sectoral laws establish the area of application of the sectoral institutional framework (national or subnational) and determine the way in which services are to be provided.
| 81 |

CHAPTER 2 ANALYSIS OF THE DIMENSIONS OF FOOD AND NUTRITION SECURITY
There are also differences in the public or private character of the service providers. In general, in countries of smaller geographic scale, with an operator in charge of national coverage, the governing entity is usually also the entity providing the water and sanitation services. Most countries also have a company that regulates the services on an exclusive basis or which regulates several public services simultaneously. As for the organizational setups of the service providers, there are national, state, province and administrative region–level institutions and even municipal and inter–municipal institutions, which adopt various legal constitutional forms. For instance, countries such as Barbados, Costa Rica, El Salvador, Jamaica, Nicaragua, Panama, Trinidad and Tobago and Uruguay have a predominantly urban service provider, which may even be a national service provider. In turn, provincial, state or administrative regional–scale companies are found in Argentina, Brazil, Chile, Dominican Republic and Venezuela. In addition, these could coexist with municipal, cooperative and private service providers. Municipal and inter–municipal service providers are common, in countries were municipal decentralization processes have been carried out. In rural areas, the predominant examples are community–based, with similar organizational structures in most countries (ECLAC, 2014). To achieve the goals of equality and social inclusion, quality and environmental protection in the area of water and sanitation services, and in turn, reduce the existing gaps, effective regulation of water and sanitation services is essential (CAF, 2012).
The participation of civil society in water and sanitation matters may have a positive impact on the provision of water and sanitation services, since it decreases asymmetries in information, limits discretional technical and financial actions, prevents corruption, supports the social response capacity of decisions, channels people’s concerns and drives conflict resolution (CAF, 2012). For instance, in Colombia, the National Statute of Users of Residential Public Services was issued via Decree 1842/91 (as amended), and Law 142/94 established the residential public service regime, which sets forth the mandatory intervention of committees in the control and discussion of service fees and in planning by service providers. The legislation establishes that there must be Social
Development and Control Committees for Residential Public Services in all the municipal districts. These committees are made up of users, service subscribers or potential service subscribers. The number of members varies according to the population of the municipal divisions and/or districts. One of their tasks is to study and analyze the amounts of the subsidies granted by the municipality to low–income users, and they must also analyze the distribution criteria and mechanisms of such subsidies. Having information systems may improve the formulation of public policies and the implementation of actions aimed at improving the water and sanitation services. These information systems gather data and information from various bodies, such as the national and local statistics agencies, water and sanitation service regulators and providers, and from other public sources, to generate products that support decision–making on the matter. For instance, the National Sanitation Information System (Sistema Nacional de Informações sobre Saneamento) (SNIS) of Brazil, collects information on the provision of water and sewerage services, urban solid waste management, and drainage and management of rainwater. The system then publishes the diagnoses of the provision of basic sanitation services every year. The resulting information is used at a central, state and municipal level to: plan public policies for the sector; serve as a guideline for the application of public revenues; for assessing performance and supervision; to improve management; to implement guidance actions for regulating and supervising the owners’ activity; as a contribution to social control; and to compare and measure the sector’s global and regional information (CAF, 2012).
According to CAF (2012), although the population has water and sanitation services at its disposal, it sometimes does not access such services. This is due to the cost implied and because accessing such services does not entail immediate benefits, thus overshadowing the importance of having improved sanitation conditions. To reduce the costs of water and sanitation services, a series of fees and subsidies have been implemented. For instance, countries such as Chile, Colombia and Peru have put in place fee mechanisms based on economic regulation models. In the first case, prices may
| 82 |

2017PANORAMA OF FOOD AND NUTRITION SECURITY IN LATIN AMERICA AND THE CARIBBEAN
reflect the real cost of economic scarcity and consumers may then pay a flat fee for equal levels of usage. However, the State subsidizes the most vulnerable consumers who cannot pay their bills. In the case of Colombia, cross–services operate and there are differentiated fees for all residential consumers, based on the economic category to which they belong. In Peru, fees must include all costs of the service provision, at the efficiency level, and there are subsidized fees applicable to everyone. In Uruguay, on the other hand, administrative procedures for cost recovery have been set up. They have a fee structure that includes a flat rate, made up of a fixed portion that covers overhead costs and a variable portion that covers the variable or proportional costs of consumption. The country also establishes a bill with discounts for vulnerable people. In Brazil, they use a cost mechanism adjusted according to inflation. The countries in the region may have other systems that combine the components mentioned above. With respect to subsidies, there are cross–subsidies operating in all the services in the region. In some cases, such as Ecuador and El Salvador, the subsidies coexist with direct tax subsidies. In this respect, there is great dispersion in how beneficiaries are identified and the value of the subsidy. n
| 83 |

CHAPTER 2 ANALYSIS OF THE DIMENSIONS OF FOOD AND NUTRITION SECURITY
Key messages:è Sustainable food production will play a crucial role in ensuring adequate diets, and in turn, the food and nutrition security of Latin America and the Caribbean in the future.
è Climate–related disasters impact livelihoods, with consequences for food and nutrition security. In the last few years, the impact of disasters both in terms of economic impacts and affected persons has increased in Latin America and the Caribbean, imposing a sense of urgency on the actions required for mitigation and adaptation.
STABILITY AND SUSTAINABILITY
THE EFFECTS OF CLIMATE CHANGE INCREASE THE RISKS FOR AGRICULTURE, BUT AGRICULTURE ALSO CONTRIBUTES TO CLIMATE CHANGEClimate change60 is one of the greatest concerns in the 2030 Agenda. It represents a threat to the attainment of many of the established goals, including food and nutrition security. The effects of climate change, including: rising temperatures; the higher frequency of weather events; soil degradation; ocean acidification; rising sea levels; and loss of biodiversity (FAO, 2016b), increase the risks for agriculture and add to the challenges already faced by the sector, such as increased population, growing urbanization and changes in food demand, among other effects61 (FAO, 2017a), enhancing even further their negative consequences.
Climate change affects the stability and sustainability of food systems, impacting food availability by reducing expected crop yields, production levels, food quality and access to water resources, either directly through changes in rainfall and temperature patterns, or indirectly, through an increase in the incidence of pests. Such incidence does not only affect the production phase but also post–production, for instance, by disrupting storage conditions (FAO, 2016c). Climate shocks in agricultural areas may affect global food supply, impacting in turn, international and local prices.62 The direct effects on agricultural production entail additional risks for food and nutrition security, particularly for the population groups whose diets and livelihoods depend on agriculture. On the other hand, the indirect effects include the implications on price volatility and trade flows, both local and international. This explains why the risks and effects linked to climate change are broad, generating economic, social and environmental consequences,
60 The United Nations Framework Convention on Climate Change (UNFCCC) defines climate change as a “a change of climate which is attributed directly or indirectly to human activity that alters the composition of the global atmosphere and which is in addition to natural climate variability observed over comparable time periods”.61 FAO estimates indicate that global agricultural and livestock production must increase by 60% by 2050.62 Some examples of this are: the impacts on corn prices after the US drought in 2012, which raised international prices and increased the region’s cereal exports (FAO, 2015b); while in Brazil, coffee crop yields dropped up to 10% following the 2007 drought, also with an impact on international prices (FAO, 2015c).
| 84 |

2017PANORAMA OF FOOD AND NUTRITION SECURITY IN LATIN AMERICA AND THE CARIBBEAN
which as a whole, impact the stability of the dimensions of food and nutrition security.
Greenhouse gas emissions are closely linked to climate change (IPCC, 2014a). Latin America and the Caribbean currently generate nearly 10% of global CO2 emissions, and at the regional level, their emissions rose by 22% between 1990 and 2010, which is under the global average which reached 30% in the same period (Figure 39).
On the other hand, the share of agriculture in greenhouse gas emissions is significant, especially via CO2, CH4 and nitrous oxide (FAO, 2016c). Globally, emissions from agriculture, forestry and other land use account for 21% of the total greenhouse gas emissions, largely explained by deforestation, livestock production, and land and nutrient management (FAO, 2016d). This share changes drastically from a regional point of view: Figure 41 shows that agriculture is responsible for over half the greenhouse gas emissions in Latin America and the Caribbean. The region also accounts for one fourth of the emissions generated by agriculture, forestry and other land use at a global level. This highlights the urgency of decision making regarding the sustainability of agricultural production, to decrease its contribution to climate change, especially given the important role of the region in the world food market.
It is important to point out that greenhouse emissions from the agricultural sector do not include the stages that take place before and after food production, given that the emissions from those stages are reported by other sectors such as industry and transport. Some estimates indicate that if the share of emissions (either direct or indirect) of each stage of the food value chain were included, the share of emissions could rise by one third. In any event, in developing countries, the emissions from the production stage are proportionately higher than those generated in other stages of the food value chain, while in higher–income countries the emissions generated in earlier and subsequent phases are equivalent to those generated during the production stage (FAO, 2016d).
An analysis by agricultural sub–sectors shows the magnitude of the challenge faced by Latin America and the Caribbean in the reduction of greenhouse emissions from agricultural and livestock sources.
Figure 42 shows that meat production is the sub–sector with the highest emissions per kilogram of meat. For instance, in the region, emissions from sheep farming for ovine meat production more than double the global average, generating 49 kilograms CO2 equivalent. In the case of goat meat and beef, the region exceeds the global average by bar, with 37% and 29%, respectively. This becomes even more significant, considering that the region accounts for nearly 30% of global beef production, and 16% of all meat production.
This is but one of the challenges faced by livestock production from an environmental point of view. Livestock production is cited among the leading reasons for the rise in deforestation, as 70% of total farmland is used for such production, while water consumption by the livestock sector accounts for 8% of global water consumption. In Latin America and the Caribbean, in particular, livestock production is the main source of deforestation (FAO, 2009a).
Besides the magnitude of greenhouse gases, another important area where agriculture contributes to climate change, is in the extensive use of natural resources, such as water and soil. In the first case, freshwater is mainly used by agriculture, as depicted in Table 11, accounting for 70% of the global level, while the share in the region exceeds the global average (71%). The table also shows that higher–income countries use a smaller share of water for agriculture, which is consistent with their greater water productivity. Improvements in productivity depend on better water management. This may mainly be achieved by increasing the areas with irrigation infrastructure. Although the region has advanced in this area, progress is still modest. In 2014, 3.2% of farmland in Latin America and the Caribbean was outfitted with irrigation equipment. This value is below the global average of 6.8% for the same year.
Finally, in the use of soil, it is worth noting that the farmland surface in Latin America and the Caribbean has increased since 1990 at a greater rate than the global average, with a variation of 10.1% and 1.4%, respectively, between 1990 and 2014 (Figure 43). This increase is mostly due to the rise in arable land and permanent crop surface, while forestland has also decreased at a higher rate in the region: in the same period, there has been a reduction of 9.1% in forestland surface, which exceeds the global level of 3%. n
| 85 |

CHAPTER 2 ANALYSIS OF THE DIMENSIONS OF FOOD AND NUTRITION SECURITY
SOURCE: Compiled by the authors based on information from FAO (online). FAOSTAT.
SOURCE: Compiled by the authors with information from FAO (online). FAOSTAT.*/ “Agriculture and land use” includes forestry and other land uses. “Other” includes international vessel fuels, waste and other sources.
FIGURE 40SHARE AND GROWTH OF GREENHOUSE GAS EMISSIONS, BETWEEN 1990 AND 2010, IN PERCENTAGES, BY WORLD REGIONS
FIGURE 41SHARE OF EMISSIONS BY ECONOMIC SECTOR IN 2010, IN THE WORLD, AND IN LATIN AMERICA AND THE CARIBBEAN
-50 0 50 100
Africa
Oceania
North America
World
Europe
Asia
LAC
Growth between 1990-2010
22
47
6
7
8
11
World
56
22
34
4
11
LAC
Agriculture and land use Energy Others Industrial processesResidential, commercial, institutional Transport
0 10 20 30 40 50
Africa
Oceania
North America
Europe
Asia
LAC
Share (%) 2010
CHAPTER 2 ANALYSIS OF THE DIMENSIONS OF FOOD AND NUTRITION SECURITY
| 86 |

2017PANORAMA OF FOOD AND NUTRITION SECURITY IN LATIN AMERICA AND THE CARIBBEAN
SOURCE: Compiled by authors with information from FAO (online). FAOSTAT.*/ The intensity of emissions varies considerably between producers. These differences are partially explained by different agro–ecological conditions, production practices and management modalities of the supply chains (FAO, 2013a)
FIGURE 42CO2 EQUIVALENT EMISSIONS PER KILOGRAM IN 2014, BY AGRICULTURAL SUB–SECTOR
0 10 20 30 40 50
Whole cow milk
Whole sheep milk
Whole goat milk
Chicken eggs
Cereals without rice
Chicken meat
Ovine meat
Beef
Pig meat
Goat meat
Rice, paddy
Europe World LAC
| 87 |

CHAPTER 2 ANALYSIS OF THE DIMENSIONS OF FOOD AND NUTRITION SECURITY
TABLE 9FRESHWATER EXTRACTION (IN PERCENTAGES) AND WATER PRODUCTIVITY, 2014
SOURCE: World Bank (online). World Development Indicators.
% of total freshwater extraction
Total Water Productivity (GDP per m3 of total
freshwater withdrawal)Group of countries Agricultural
useHousehold
use Industrial use
High income 40.9 15.1 43.9 48.3
Upper middle income 67.8 13.3 19.0 14.4
Middle income 79.0 10.4 10.6 8.5
Lower middle income 88.3 8.0 3.6 3.6
Low income 90.4 7.0 2.9 4.0
World 69.9 11.5 18.6 18.3
Latin America & Caribbean 71.4 16.7 11.9 17.8
SOURCE: Compiled by authors with information from FAO (online). FAOSTAT.*/ Agricultural area includes arable land and permanent crops, and temporary meadows and pastures.
FIGURE 43LAND USE CHANGE, 1990–2014, IN LAC AND THE WORLD, VARIATIONS (%) IN AREA
-10
0
10
20
30
Agriculturalarea
Arable landand
permanent crops
Permanentmeadows
and pastures
Forest Other land
LAC World
| 88 |

2017PANORAMA OF FOOD AND NUTRITION SECURITY IN LATIN AMERICA AND THE CARIBBEAN
Food loss estimates are significant. Globally, they account for one third of food produced for human consumption. In Latin America and the Caribbean, FLW accounts for 34% of food, representing a volume of nearly 127 tons, or 223 kilograms per person. The existence of FLW highlights the inefficiencies of the food system. Producing food that is finally not consumed implies the unnecessary use of natural resources, such as water and soil, in addition to labor, among other resources. Besides, it is estimated that at a global level, FWL implies 3.3 Gt of CO2 equivalent.
The foregoing shows the importance of advancing in FLW reduction, explaining its inclusion in the
Sustainable Development Goals (target 12.3). By contributing to sustainability, FLW reduction does not only help make efficient use of natural resources, which are under growing stress, but also implies economic and dietary benefits.
Hence, proper FLW management is one of the necessary conditions for having sustainable and efficient food systems. FLW volumes are unacceptably high, especially considering that 40.7 million people in Latin America and the Caribbean lack sufficient food.
BOX 10REDUCING FOOD LOSS AND WASTE (FLW) ENTAILS BENEFITS FOR ENVIRONMENTAL SUSTAINABILITY AND FOOD AND NUTRITION SECURITY
SOURCE: FAO and PAHO, 2017; FAO, 2017b.
| 89 |

CHAPTER 2 ANALYSIS OF THE DIMENSIONS OF FOOD AND NUTRITION SECURITY
NATURAL DISASTERS IN LATIN AMERICA AND THE CARIBBEAN HAVE A SIGNIFICANT EFFECT ON AGRICULTURE AND LIVELIHOODS
The frequency of natural disasters (climate–related or geophysical) shows a rising trend. Rural population groups and small producers are often the hardest hit by these hazards, since their livelihoods depend largely on the natural resources affected by these disasters, such as soil (usually of low productivity) or water. These population groups have low resiliency to natural disasters and are therefore the ones who struggle more to recover from them (FAO and PAHO, 2017).
Figure 44 shows that out of the climate–related events in the region, floods are the most frequent, although in the last five–year period, a change in the trend has been observed, with lower frequency than the previous period. However, these events have resulted in greater costs, both in the number of people affected and in the impact on the economy.
Floods are the most frequent event in South America, and for some periods, also for Mesoamerica. However, it is important to point out, that in Mesoamerica storms are also relevant. In the Caribbean, on the other hand, hurricanes have historically been the most frequent type of hazard and also the one with the greatest economic cost for the region as a whole . As for the number of affected people, there has been an increase in the last five years, with drought being the event that has affected the largest number of people. The consequences of these hazards depend on the magnitude of the disaster and on the geographic characteristics of the affected place and the socioeconomic situation of the population. They are also particularly dependent on the production activities carried out in the affected area, such as agriculture, trade and/or tourism. Impacts are broad in areas such as housing, health, nutrition, infrastructure, transport, communications, connectivity and water and sanitation facilities, among other sectors (FAO, 2015c).
A study (FAO, 2015c) shows that agriculture absorbs nearly one fourth of the impacts generated by natural hazards. In Latin America and the
Caribbean, the losses linked to these events in agriculture and livestock production between 2003 –2013, totaled almost USD 11 billion; with floods accounting for most of the damages caused during that period, followed by droughts and storms. These losses entailed an average 2.7% decline in the growth of agricultural added value per event, and an increase of USD 13 billion in the value of imports required to make up for the drop in domestic production. This in turn led to a reduction in exports of USD 1 billion in the same period. The crops that suffered the greatest losses because of natural disasters were coffee, sugarcane, tropical fruits, cassava, potatoes, and cereals.
Figure 45 shows the frequency of natural hazards and the number of people affected by them in the last year. In 2016, 10.7 million people were affected by natural disasters, with droughts, hurricanes, floods and earthquakes causing the most negative effects (OCHA, 2016a). Following the same trend, in the last few years, floods were the most recurrent event in 2016. However, droughts accounted for the largest number of affected people.
One of the natural hazards that generated more concern was hurricane Matthew, which pummeled Haiti and Cuba in October 2016, with consequences still prevalent to date. In Haiti, it affected over 20% of the population, leaving more than 1.5 million people in food insecurity and 280 000 in severe food insecurity. Many of the crops destined for self–consumption were damaged, and the availability of meat and fresh products was affected. Significant losses were also generated in livestock production, and in some of the hardest hit areas where all crops were either damaged or lost completely, causing problems for both human and animal food consumption (FAO, 2017c). This hazard is one of the many triggered by the El Niño weather phenomenon, which already affected food production and hindered access to freshwater. These effects had a direct impact on the capacity to purchase food and the agricultural inputs to start and/or resume production.
In early 2016 the region continued facing the consequences of the drought caused at the end of 2015 in Central America (OCHA, 2016b). The Dry Corridor of Central America suffered one of the worst droughts in the last decade, affecting small–scale production and rural communities the most,
| 90 |

2017PANORAMA OF FOOD AND NUTRITION SECURITY IN LATIN AMERICA AND THE CARIBBEAN
SOURCE: EM–DAT.
FIGURE 44FREQUENCY (IN ABSOLUTE NUMBERS), ECONOMIC IMPACT (IN USD) AND NUMBER OF PEOPLE AFFECTED BY SELECTED CLIMATE–RELATED HAZARDS IN LATIN AMERICA AND THE CARIBBEAN, DURING SEVERAL PERIODS.
0
100
200
300
1972-76 1977-81 1982-86 1987-91 1992-96 1997-01 2002-06 2007-11 2012-16
Frecuency
0
10.000
20.000
30.000
1972-76 1977-81 1982-86 1987-91 1992-96 1997-01 2002-06 2007-11 2012-16
Economic Impact
0
20
40
60
1972-76 1977-81 1982-86 1987-91 1992-96 1997-01 2002-06 2007-11 2012-16
Affected People
Drought Extreme temperatureFlood Storm
| 91 |

CHAPTER 2 ANALYSIS OF THE DIMENSIONS OF FOOD AND NUTRITION SECURITY
SOURCE: OCHA, 2016a.
FIGURE 45NATURAL HAZARDS IN 2016, FREQUENCY AND NUMBER OF PEOPLE AFFECTED BY THEM IN ABSOLUTE NUMBERS
0 5 10 15 20 25
Earthquakes
Drought
Others
Cold waves
Floods
Tropical cyclone
Frequency
0 1 2 3 4
Earthquakes
Drought
Others
Cold waves
Floods
Tropical cyclone
People affected, in millions
and causing serious adverse effects in their livelihoods. Losses in agricultural production affected food stocks, raising concern over the increase in cases of undernourishment, especially in children.
Heavy rains pummeled several South American countries, in the first quarter of 2017, leaving behind a considerable number of affected people and damage in agriculture, road infrastructure, and housing, and hindering access to sanitation services and water sources. The most affected countries include Peru, with over one million affected people; followed by Colombia, with 15,000 people affected directly by rain and floods; and Ecuador, with over 122 000 affected people.
Table 12 shows the natural hazards that the region has faced during 2016 and part of 2017.
In the last few years, natural disasters in Latin America and the Caribbean have been heavily marked by El Niño. This weather phenomenon will continue being the leading cause of climate variability in the region. This makes it more likely to expect a greater frequency of phenomena linked
to altered rainfall patterns, such as droughts and floods that have a direct effect on livelihoods, infrastructure, and access to basic services, which in turn have negative impacts on the stability of food and nutrition security (FAO, 2016c).
Given the recent trend, the consequences of climate–related phenomena will continue being a cause of great concern, for food and nutrition security. Floods, droughts and other natural hazards, affect food supply, both in terms of food and commodity prices, both at a local and global level. They also affect livelihoods and may entail a significant reduction in the income of the population groups that face such events, which enhances their vulnerability in the food access dimension, both in terms of physical access and affordability. Besides, in the utilization dimension, climate–related phenomena may affect infrastructure (roads, housing, production and/or sanitary facilities), as well as food quality and safety, by disrupting production and post–production conditions, or water quality, fostering the development of diseases linked to water consumption, among other conditions.
| 92 |
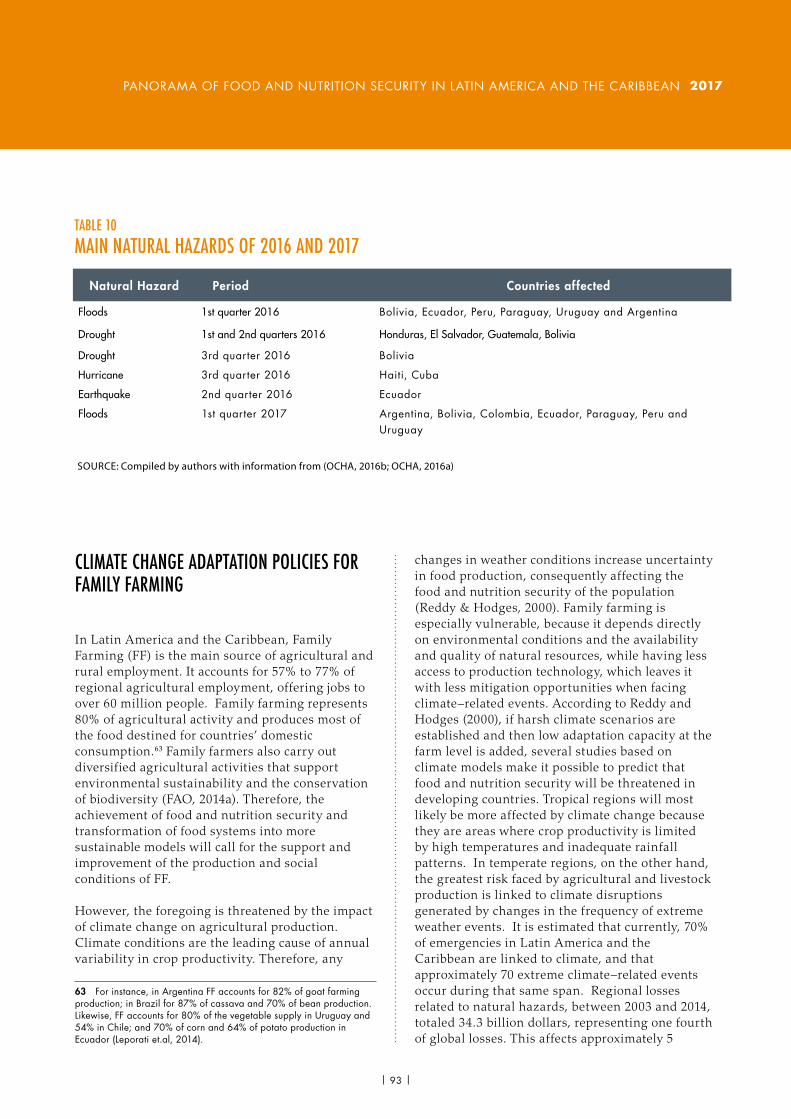
2017PANORAMA OF FOOD AND NUTRITION SECURITY IN LATIN AMERICA AND THE CARIBBEAN
SOURCE: Compiled by authors with information from (OCHA, 2016b; OCHA, 2016a)
TABLE 10 MAIN NATURAL HAZARDS OF 2016 AND 2017
Natural Hazard Period Countries affected
Floods 1st quarter 2016 Bolivia, Ecuador, Peru, Paraguay, Uruguay and Argentina
Drought 1st and 2nd quarters 2016 Honduras, El Salvador, Guatemala, Bolivia
Drought 3rd quarter 2016 Bolivia
Hurricane 3rd quarter 2016 Haiti, Cuba
Earthquake 2nd quarter 2016 Ecuador
Floods 1st quarter 2017 Argentina, Bolivia, Colombia, Ecuador, Paraguay, Peru and Uruguay
CLIMATE CHANGE ADAPTATION POLICIES FOR FAMILY FARMING
In Latin America and the Caribbean, Family Farming (FF) is the main source of agricultural and rural employment. It accounts for 57% to 77% of regional agricultural employment, offering jobs to over 60 million people. Family farming represents 80% of agricultural activity and produces most of the food destined for countries’ domestic consumption.63 Family farmers also carry out diversified agricultural activities that support environmental sustainability and the conservation of biodiversity (FAO, 2014a). Therefore, the achievement of food and nutrition security and transformation of food systems into more sustainable models will call for the support and improvement of the production and social conditions of FF.
However, the foregoing is threatened by the impact of climate change on agricultural production. Climate conditions are the leading cause of annual variability in crop productivity. Therefore, any
63 For instance, in Argentina FF accounts for 82% of goat farming production; in Brazil for 87% of cassava and 70% of bean production. Likewise, FF accounts for 80% of the vegetable supply in Uruguay and 54% in Chile; and 70% of corn and 64% of potato production in Ecuador (Leporati et.al, 2014).
changes in weather conditions increase uncertainty in food production, consequently affecting the food and nutrition security of the population (Reddy & Hodges, 2000). Family farming is especially vulnerable, because it depends directly on environmental conditions and the availability and quality of natural resources, while having less access to production technology, which leaves it with less mitigation opportunities when facing climate–related events. According to Reddy and Hodges (2000), if harsh climate scenarios are established and then low adaptation capacity at the farm level is added, several studies based on climate models make it possible to predict that food and nutrition security will be threatened in developing countries. Tropical regions will most likely be more affected by climate change because they are areas where crop productivity is limited by high temperatures and inadequate rainfall patterns. In temperate regions, on the other hand, the greatest risk faced by agricultural and livestock production is linked to climate disruptions generated by changes in the frequency of extreme weather events. It is estimated that currently, 70% of emergencies in Latin America and the Caribbean are linked to climate, and that approximately 70 extreme climate–related events occur during that same span. Regional losses related to natural hazards, between 2003 and 2014, totaled 34.3 billion dollars, representing one fourth of global losses. This affects approximately 5
| 93 |

CHAPTER 2 ANALYSIS OF THE DIMENSIONS OF FOOD AND NUTRITION SECURITY
million people, and implies serious economic consequences.64
The Intergovernmental Panel of Experts on Climate Change (IPCC) highlighted that the global warming and drying trend, rising sea levels, cyclones, rainfall and extreme rainfall, snow cover, and carbon dioxide fertilization, are climate drivers that generate a series of risks in the region (see Annex 1). Such drivers lead to: i) wild–fire induced loss of ecosystem integrity, property loss, human morbidity and mortality; ii) increased flooding in urban, river and coastal areas, leading to property and infrastructure damages; supply chain, ecosystem and social system disruption; and water quality impairment; iii) water availability in semi–arid and glacier–melt–dependent regions and Central America; flooding and landslides in urban and rural areas; iv) decreased food production and food quality; v) spread of vector–borne diseases in altitude and latitude; vi) loss of livelihoods, coastal settlements, infrastructure, ecosystem services and economic stability; and vii) low–lying coastal areas permanently threatened by rising sea level (IPCC, 2014b). Based on the foregoing, climate change is expected to provoke unprecedented social, economic, environmental and political repercussions, threatening sustainable development, the eradication of poverty and consequently, food and nutrition security.
It must be noted that although climate change affects the dimension of stability of food and nutrition security directly, it also influences access to food, usage and availability. The reason for this is that for people to be in a food security situation, they need to have safe access to an adequate amount of healthy and safe food always and uninterruptedly (FAO, 2016c). Furthermore, agriculture and country development are impacted by climate change given that crop yield may be impaired, which may affect the price level of food both in the consumption and production stages, the per–capita calorie consumption and child nutrition.
Besides the direct link between lower food production and quality and food insecurity, other
64 http://www.fao.org/americas/noticias/ver/es/c/892866/, revisado el 14/08/2017.
effects of climate change that have an impact on food and nutrition security include supply chain disruptions caused by fires or f loods and decreased water availability and loss of livelihoods. These all have serious consequences for food and nutrition security, ref lecting significantly on family farming. Climate change alters food systems as a whole, decreasing productivity in the agricultural sector. It also affects the availability and access to biodiversity and the national resources on which family farming depends, thus impacting livelihoods. (FAO, 2016c). Considering that in Latin America and the Caribbean, family farming supplies between 27% and 67% of food production (FAO, 2012), climate change could have serious repercussions on the stability of food supply. Therefore, it is essential to have the means required for adapting to and mitigating climate change effects and to guarantee food and nutrition security.
Hence, to reduce the risks of climate change, mitigate its impacts on family agriculture and enhance the adaptation capacity of FF, the governments of Latin American and Caribbean countries have implemented a series of measures, aimed at addressing climate change from the perspective of reducing poverty, strengthening food and nutrition security, and promoting disaster risk management and sustainable use of resources (FAO, 2016c). Some of the most noteworthy adaptation measures proposed are described below.
Solving the issue of variable crop yields is crucial for helping family farmers subsist as well as to ensure a stable food supply. Developing agricultural systems that are adapted to agroweather conditions enables farmers to have stable production levels. Part of the solution may lie in diversifying production, either via multi–cropping or poly–cropping, or by means of traditional agro–ecosystems. Both systems are complex and diversified and help to achieve production stability despite unfavorable agroweather conditions. Traditional agro–ecosystems represent a reservoir of food and food recipes, adapted and reconfigured, according to the cultural preferences of families in such system, thus becoming part of peoples’ culture and worldview, expressing traditional ecological knowledge (IPGRI, 2002). Both multi–cropping or poly–cropping and traditional
| 94 |

2017PANORAMA OF FOOD AND NUTRITION SECURITY IN LATIN AMERICA AND THE CARIBBEAN
agro–ecosystems are less vulnerable to losses from catastrophes, due to the diversity of crops and varieties they produce, which help offset any losses (Universidad de Murcia, 2008). Law No. 338, of the Peasant Economic Organization – OECAS and Community Economic Organizations – OECOM, for the integration of sustainable family farming and food sovereignty in Bolivia, reclaims traditional family farming methods declaring that family farming is a matter of public and national interest because it is the basis of food sovereignty for the Bolivian people. The law promotes diversification as a production strategy implemented by sustainable family farming to increase production variety and the use of existing resources. It also ensures the preservation, promotion and dissemination of the traditional farming practices of the OECAS and OECOM, and organized indigenous, peasant, inter–cultural and Afro–Bolivian farming families, to enhance cultural identity, the transfer of knowledge, and the recovery of good production practices. The Law also recognizes the contribution of family farming to the sustainable in–situ preservation of phytogenetic resources and the native agrobiodiversity of the country, as well as its input to the diversification to production activities.
Agricultural and weather insurance is another adaptation and risk management measure for natural hazards, aimed at reducing the vulnerability of agriculture and farmers to climate change. These types of instruments provide compensation to farmers if any climate–related event affects crop yields, helping farmers resume production activities, by providing them with a contingency income source. A study by the World Bank (2016a) identified the effect of Mexico’s weather–index insurance on crop yields, income, and per capita spending, providing evidence that the existence of insurance cover in the selected municipal districts was significant, having a positive effect on corn productivity. Outcomes indicate that crop yields rose by approximately 6%, and that the existence of insurance and coverage65 at the municipal level has a significant and positive impact on household income and per capita spending.
65 The programme seeks to support small farmers who own no more than 20 hectares and are affected by atypical weather contingencies. (World Bank, 2016a)
In turn, policies focused on modernizing agriculture to provide resources and financing to farmers so that they can improve their production conditions and productivity, thus helping to reduce their vulnerability to climate change impacts. These types of policies include i) policies aimed at providing land tenure security, either by granting usufruct rights, or land under lease, and access to credit, or by formalizing land titles; ii) production and post–production infrastructure policies that deliver individual or collective physical capital to family farmers, to boot agricultural production and reduce losses; iii) capacity–development policies to strengthen human capital, providing people with more tools for personal development and to develop their businesses.
On the other hand, social protection policies seek to help family farmers be better prepared for the social and economic risks, and environmental hazards they must face. Direct support for the incomes of the most vulnerable families helps alleviate extreme poverty and overcome food insecurity. With the addition of greater income security and investment in rural livelihoods, social protection measures can help boost agricultural productivity, drive local economic development, promote sustainable uses of natural resources and foster social inclusion. The literature (FAO, 2013b) indicates that improvements in assets, inputs, agricultural production and investment are attributed to the relief of credit and liquidity restrictions, and to the predictability of cash transfers and public cash–based systems. Providing economic incentives for the conservation of natural resources may have positive effects on the adaptation and/or mitigation of climate change effects by family farming, because they support the population’s efforts to use resources sustainably, thus contributing to their conservation. This kind of instrument also helps to improve the living conditions of programme beneficiaries. Some examples are the programme of Payments for Environmental Services of Costa Rica and the Forest Partners Programme of Ecuador. The first example “has led to positive impacts by reducing deforestation rates, recovering forest cover and degraded lands; reducing illegal tree logging, promoting non–traditional exports, contributing to rural development, reducing poverty and contributing to global environmental goals” (FAO, 2016c, p. 20). The Forest Partners Programme, on
| 95 |

CHAPTER 2 ANALYSIS OF THE DIMENSIONS OF FOOD AND NUTRITION SECURITY
the other hand, has been set up as a mechanism to increase the resiliency of families linked to the programme and of the community as a whole. It also represents a source of income to low–income farmers, by providing annual payments to them for maintaining and preserving forests, leading to improvements in their standard of living and diversification of household income (FAO, 2016c).
Conditional Cash Transfer programmes can also help protect household incomes from the negative factors of climate change. According to various studies (FAO, 2008; International Poverty Centre, 2008), the beneficiary families of the Tekoporã programme in Paraguay, invest between 45% and 50% more in agricultural activities than non–beneficiaries, thanks to the conditional cash transfers, plus the social family and community support provided by the programme. The programme has even increased the likelihood of families implementing family vegetable gardens and purchasing cattle, poultry and pigs. n
| 96 |

2017PANORAMA OF FOOD AND NUTRITION SECURITY IN LATIN AMERICA AND THE CARIBBEAN
LA OCURRENCIA DE DESASTRES NATURALES EN
AMÉRICA LATINA Y EL CARIBE AFECTA SIGNIFICATIVAMENTE A LA AGRICULTURA Y LOS MEDIOS DE VIDA
La frecuencia de desastres naturales (climatológicos y geofísicos) muestra una tendencia creciente, siendo la población rural y los pequeños productores quienes se ven afectados en mayor medida por estos eventos, ya que sus medios de vida dependen en gran parte de recursos que se ven afectados por los desastres naturales, tales como los suelos (usualmente de baja productividad) o el agua. Su resiliencia frente a estos eventos es baja, y, del mismo modo, presentan mayores dificultades para recuperarse una vez que estos se presentan (FAO y OPS, 2017).
Las consecuencias de estos eventos dependen de su magnitud, de las características geográficas del lugar afectado y de las características socioeconómicas de la población, y en particular de las actividades productivas que se desarrollen en la zona afectada, ya sea agricultura, comercio y/o turismo. Los impactos son amplios en áreas como vivienda, salud, nutrición, infraestructura, transporte, comunicaciones, conectividad e instalaciones de agua y saneamiento, entre otras (FAO, 2015c).
En la Figura 44 se observa que, de los eventos climatológicos observados en la región, las inundaciones son el evento de mayor frecuencia, aunque en el último quinquenio se aprecia un cambio de tendencia y una menor frecuencia en comparación con el anterior. Sin embargo, estos eventos han resultado más costosos en tanto en personas afectadas como en daños económicos.
Las inundaciones son el evento de mayor ocurrencia en Sudamérica y para algunos períodos también en Mesoamérica, aunque cabe señalar que en esta última las tormentas tienen gran
By 2050, the world’s population is estimated to reach 9.1 billion people. An increase of 70% in food production will be required to meet food demand. Annual cereal production will need to rise from 2.1 billion tonnes to 3 billion tonnes, while annual meat production will have to increase from 200 million to 470 million tonnes (FAO, 2009b).
Both net food imports and food production will have to increase to face this scenario and ensure food stability for the global population. This will put growing pressure on agriculture, and even more pressure on biodiversity. Limited resources such as land and water will have to be distributed between human settlements and an ever–growing number of agricultural operations, all within the context of climate change. Besides, future total demand for agricultural commodities may exceed the demand for food and feed, depending on the expansion of demand for biofuels and the technology used for converting biomass into biofuels (FAO, 2009b, p. 8).
However, natural resources will not be the only resources subject to greater pressure: biodiversity, another essential resource for agriculture and food production, is threatened by the factors mentioned above. Biodiversity is a key driver for the subsistence of humankind. It is important for ensuring healthy diets because it comprises the set of ecosystems, species and genetic diversity of land, marine and aquatic habitats.
Agricultural biodiversity includes all the components of biological diversity that are relevant for food and agriculture, along with the components of biological
diversity that make up the agro–ecosystem: the variety and variability in animals, plants and microorganisms, at the genetic, species and ecosystem level, that sustain the functions, structure and processes of the agro–ecosystem. (FAO, 2016c, p. 20)
However, pollution, urbanization and conversion of wetlands pose a threat to plant and animal species. Although agricultural biodiversity is composed of a variety of cultivated plants and domestic animals, agricultural modernization, changes in diets and increased population density have resulted in our diets becoming more increasingly dependent on a limited number of animal and plant species. Fourteen species of mammals and birds provide 90% of animal–sourced food while four crop species provide half of plant–based calories.
Preserving the diversity of species and their genetic diversity is essential to ensure future food stability: having a diversity of genetic and ecosystem species provides the means to adapt to changing conditions, and in turn, contributes to a nutritious and varied diet (FAO, s.f.). According to the High–Level Panel of Experts on Food and Nutrition Security –HLPE (2012), to adapt efficiently to climate change, it is necessary to improve access to genetic resources that are similar to existing crops, and to any varieties that may be used in the future. They also mention that agricultural biodiversity can increase, if measures to promote the development of markets for underused species are implemented, and actions to increase consumer awareness about the importance of eating a varied diet are carried out.
BOX 11CONSERVING BIODIVERSITY TO ENSURE THE FUTURE STABILITY OF HEALTHY DIETS.
| 97 |

BIBLIOGRAPHYBastagli, F., Hagen–Zanker, J., Harman, L., Sturge, G., Barca, V., Schmidt, T. y Pellerano, L. (2016). Cash Transfers: What Does the Evidence Say? A Rigorous Review of Programme Impact and of the Role of Design and Implementation Features. Londres: ODI.
Bortoletto Martins, A. P. y Monteiro, C. (2016). Impact of the Bolsa Familia Program on Food Availability of Low–Income Brazilian Families: a Quasi Experimental Study. BMC Public Health, 16, 827.
CAF, Development Bank of Latin America (2012). Water Supply and Sanitation in Latin America: Goals and Sustainable Solutions. Available in Development Bank of Latin America: http://www.scioteca.caf.com/bitstream/handle/123456789/500/libro_agua_eng.pdf?sequence=1&isAllowed=y|
Cecchini, S., & Atuesta, B. (2017). Programas de transferencias condicionadas en América Latina y el Caribe: tendencias de cobertura e inversión. Santiago de Chile: ECLAC.
Cecchini, F., Filgueira, R. y Rossel, C. (2015). Instrumentos de protección social: caminos latinoamericanos hacia la universalización. Santiago de Chile: ECLAC.
Cuadrado, C. y García, J. (2015). Estudio sobre el cálculo de indicadores para el monitoreo del impacto socioeconómico de las enfermedades no transmisibles en Chile. Santiago de Chile: Chilean Ministry of Health, PAHO y ECLAC.
Cunha Neves, P., Afonso, Ó. y Tavares Silva, S. (2016). A Meta–Analytic Reassessment of the Effects of Inequality on Growth. World Development, 78: 386–400.
Da Costa Louzada, M., Bortoletto Martins, A. P., Silva Canella, D., Galastri Baraldi, L., Bertazzi Levy, R., Moreira Claro, R.y Monteiro, C. A. (2015). Ultra–processed Foods and the Nutritional Dietary Profile in Brazil. Revista de Saúde Pública, 49:38.
Díaz–Bonilla, E. (2015). Lost in Translation: the Fractured Conversation about Trade and Food Security. Rome: FAO.
Drewnowski, A. (2010). The Cost of US food as Related to their Nutritive Value. The American Journal of Clinical Nutrition, 92, 1181–8.
ECLAC (2013). Comercio internacional y desarrollo inclusivo. Santiago de Chile: ECLAC.
ECLAC (2015). Panorama Social de América Latina. Santiago de Chile: ECLAC.
ECLAC (2016). Panorama Social de América Latina. Santiago de Chile: ECLAC.
ECLAC (2017). América Latina y el Caribe hacia los Objetivos de Desarrollo Sostenible en agua y saneamiento. Reformas recientes de las políticas sectoriales. Santiago de Chile.
ECLAC (online). CEPALSTAT. Obtained in June 10, 2017 from http://estadisticas.cepal.org/cepalstat/WEB_CEPALSTAT/ESTADISTICASIndicadores.asp
ECLAC and ILO (2017). Coyuntura Laboral en América Latina y el Caribe. Santiago de Chile ECLAC.
EM–DAT (online). The International Disaster Database. Available in http://www.emdat.be/
Estimé, M. S., Lutz, B. y Strobel, F. (2014). Trade as a Structural Driver of Dietary Risk Factors for Noncommunicable Diseases in the Pacific: an Analysis of Household Income and Expenditure Survey Data. Globalization and Health, 10:48.
FAO (2009a). La larga sombra del ganado: problemas ambientales y opciones.
FAO (2009b). Cómo alimentar al mundo en 2050. Obtained from Food and Agriculture Organization of
| 98 |
PANORAMA OF FOOD AND NUTRITION SECURITY IN LATIN AMERICA AND THE CARIBBEAN
the United Nations: http://www.fao.org/fileadmin/templates/wsfs/docs/synthesis_papers/C%C3%B3mo_alimentar_al_mundo_en_2050.pdf
FAO (2012). Marco Estratégico de Mediano Plazo de Cooperación de la FAO en Agricultura Familiar en América Latina y el Caribe 2012–2015. Obtained from Food and Agriculture Organization of the United Nations: http://www.fao.org/docrep/019/as169s/as169s.pdf
FAO (2013a). Enfrentando el Cambio Climatico a través de la Ganadería . Rome: FAO.
FAO (2013b). The Interaction Between Social Protection and Agriculture. A Review of Evidence. Obtained from Food and Agriculture Organization of the United Nations: http://www.fao.org/docrep/019/i3563e/i3563e.pdf?utm_source=ESConnect&utm_medium=newsletter&utm_campaign=PtoPupdate
FAO (2014a). Agricultura Familiar en América Latina y el Caribe: Recomendaciones de Políticas. Obtained from Food and Agriculture Organization of the United Nations: http://www.fao.org/docrep/019/i3788s/i3788s.pdf
FAO (2014b). Panorama de la Seguridad Alimentaria y Nutricional en América Latina y el Caribe 2014. Santiago de Chile.
FAO (2015a). Panorama de la Inseguridad Alimentaria en América Latina y el Caribe 2015. Santiago de Chile: FAO.
FAO (2015b). The State of Agricultural Commodity Markets 2015–16. Rome: FAO.
FAO (2015c). The Impact of Disasters on Agriculture and Food Security. Rome: FAO.
FAO (2016a). Agricultura Sostenible y Bioviversidad Un vínculo indisociable. Obtained from Food and Agriculture Organization of the United Nations: http://www.fao.org/3/a–i6602s.pdf
FAO (2016b). Nutrition in the Trade and Food Security Nexus. Rome: FAO.
FAO. (2016c). El estado mundial de la agricultura y la alimentación. Rome: FAO.
FAO. (2016d). Cambio climático y seguridad alimentaria y nutricional América Latina y el Caribe, orientaciones de política. Santiago de Chile: FAO.
FAO (2017a). Boletin de la Seguridad Alimentaria y Nutricional, primer trimestre.
FAO (2017b). La biodiversidad es fundamental para la agricultura y la producción de alimentos. Obtained from Food and Agriculture Organization of the United Nations: http://www.fao.org/docrep/006/y5418s/y5418s00.htm
FAO (2017c). The Future of Food and Agriculture – Trends and Challenges. Rome: FAO.
FAO (2017d). Reflexiones sobre el sistema alimentario en América Latina y el Caribe y perspectivas para alcanzar su sostenibilidad. Santiago de Chile: FAO.
FAO (2017e). FAO Haiti: Hurricane Matthew – Situation report 16 March 2017.
FAO (online), FAOSTAT. Obtained in July 3, 2017, from http://www.fao.org/faostat/en/#home
FAO, IFAD, UNICEF, WFP and WHO. 2017. The State of Food Security and Nutrition in the World 2017. Building resilience for peace and food security. Rome, FAO. (also available at www.fao.org/3/a–I7695e.pdf).
FAO, IFAD and WFP (2016). Seguimiento de la Seguridad Alimentaria y la nutrición en apoyo a la Agenda 2030 para el Desarrollo Sostenible. Balance y persepectivas. Rome: FAO.
| 99 |
FAO and PAHO (2017). Panorama de la Seguridad Alimentaria y Nutricional en América Latina y el Caribe 2016. Santiago de Chile: FAO.
Filgueira, R. Martínez, y C. Rossel (2015). Instrumentos de protección social: caminos latinoamericanos hacia la universalización: 85–125. Santiago de Chile: ECLAC.
Hawkes, C. (2006). Uneven Dietary Development: Linking the Policies and Processes of Globalization with the Nutrition Transition, Obesity and Diet–Related Chronic Diseases. Globalization and Health, 2–4.
HLPE (2015). Water for Food Security and Nutrition. Obtenido de High Level Panel of Experts on Food Security and Nutrition of the Committee on World Food Security: www.fao.org/cfs/cfs–hlpe
ILO (online). ILOSTAT. Obtained in July 20, 2017, from http://www.ilo.org/ilostat/faces/ilostat–home/download;ILOSTATCOOKIE=kpx_UjPEyB8bqO4-AxrNgynLRvDP0YCuDsKJ0eRQqCQKrEZMQl8z!-1549909784?_adf.ctrl-state=2ggi20831_4&_afrLoop=1413949332889763&_afrWindowMode=0&_afrWindowId=null#!%40%40%3F_afrWindowId%3Dnull%26
IMF (online). IMF Primary Commodity Prices. obtained in July 11, 2017, from https://www.imf.org/external/np/res/commod/index.aspx
INEI. (2017). Informe Técnico n° 4– Abril 2017: Variación de los indicadores de precios de la economía. Lima: INEI.
IPCC (2014a). Cambio climático 2014: Informe de síntesis. Contribución de los Grupos de trabajo I, II y III al Quinto Informe de Evaluación del Grupo. Geneva.
IPCC (2014b). Cambio Climático 2014. Impactos, adaptación y vulnerabilidad. Obtenido de Intergovernmental Panel on Climate Change: http://www.ipcc.ch/pdf/assessment–report/ar5/wg2/ar5_wgII_spm_es.pdf
IPGRI (2002). Manejo de la diversidad cultivada en los agroecosistemas tradicionales. Available in Bioversity International: Research for Development in Agricultural and Tree Biodiversity: http://www.bioversityinternational.org/uploads/tx_news/Manejo_de_la_diversidad_cultivada_en_los_agroecosistemas_tradicionales___Managing_crop_diversity_in_traditional_agroecosystems_785.pdf
Kliksberg, B. y Novacovksy, I. (2015). El gran desafío: romper la trampa de la desigualdad desde la infancia. Aprendizajes de la Asignación Universal por Hijo. Buenos Aires: Editorial Biblos.
Labat, J. P. (2015) Evaluación y seguimiento del Plan Equidad. Presentación en Seminario Internacional: Sistemas de Protección e Inclusión Social en América Latina. Buenos Aires, May 21, 2015.
Martínez Steele, E., Galastri Baraldi, L., Da Costa Louzada, M. L., Moubarac, J.–C., Mozaffarian, D. y Monteiro, C. A. (2016). Ultra–processed Foods and Added Sugars in the US Diet: Evidence from a Nationally Representative Cross–sectional Study . BMJ Journals.
Ministry of Social Develpment of Chile. (2015). Nueva Metodología de Medición de la Pobreza por Ingresos y Multidimensional. Santiago de Chile.
Mujica–Coopman, M. F., Brito, A., López de Romaña, D., Ríos–Castillo, I., Cori, H., & Olivares, M. (2015). Prevalence of anemia in Latin America andthe Caribbean. Food and nutrition bulletin, 119–128.
OCHA (2016a). Boletín Humanitario América Latina y el Caribe, Volumen 30 | Noviembre – Diciembre 2016.
OCHA (2016b). Boletín Humanitario América Latina y el Caribe Volumen 25, Enero – Febrero 2016.
Ostry, J., Berg, A y Tsangarides, C. (2014). IMF Staff Discussion Note: Redistribution, Inequality and Growth.
PAHO (2015). Alimentos y bebidas ultraprocesados en América Latina: tendencias, efecto sobre la obesidad e implicaciones para las políticas públicas. Washington D.C.
Reddy, K. R. y Hodges, H. F. (2000). Climate Change and Global CropProductivity: an Overview. Obtained from ResearchGate: https://www.researchgate.net/publication/260705281_Climate_Change_and_Global_Crop_Productivity
Remans, R., Wood, S. A., Saha, N., Anderman, T. L. y DeFries, R. S. (2014). Measuring Nutritional Diversity of National Food Supplies. Global Food Security.
Rossel, C., Nieves Rico, M. y Filgueira, F. (2015). Primera Infancia e Infancia.
BIBLIOGRAPHY
| 100 |

PANORAMA OF FOOD AND NUTRITION SECURITY IN LATIN AMERICA AND THE CARIBBEAN
Ecológica: https://www.agroecologia.net/recursos/publicaciones/revistas–seae/revista–agroecologia3/Agroecologia%203%202008.pdf
UNSCN (2015). Enhancing Coherence between Trade Policy and Nutrition Action: Implementing the Framework for Action of the Second International Conference on Nutrition. Geneva: WHO.
USAID (online). The DHS Program. Obtained in June 27, 2017, de https://dhsprogram.com/
WHO (2003). Dieta, nutrición y prevención de enfermedades crónicas (Serie de Informes Técnicos – 916). Geneva.
WHO (2015). Healthy diet FACT SHEET N°394.
WHO (online). Global Health Observatory (GHO) data. Obtained in May 22, 2017, from http://www.who.int/gho/en/
WHO and UNICEF (online). Data. Obtenido de Joint Monitoring Programme: https://washdata.org/data
WHO, UNICEF and USAID (2015). Improving Nutrition Outcomes with Better Water, Sanitation and Hygiene: Practical Solution for Policies and Programmes. Obtained in the United Nations International Children's Emergency Fund: https://www.unicef.org/media/files/IntegratingWASHandNut_WHO_UNICEF_USAID_Nov2015.pdf
World Bank (2016a). Drought and Retribution, Evidence from a Large–Scale Rainfall–Indexed Insurance Program.
Worl Bank (2016b). En busca de oportunidades para todos. Índice de Oportunidades Humanas en América Latina y el Caribe. Available in World Bank: http://documents.worldbank.org/curated/en/239931476729953435/pdf/109075-REVISED-SPANISH-PUBLIC-ACS.pdf
World Bank (2017). Global Economic Prospects, Junio 2017. Washington.
World Bank (online). World Development Indicators. Obtained on July 7, 2017, from http://databank.worldbank.org/data/reports.aspx?source=world-development-indicators
World Bank (on line). The Atlas of Social Protection: Indicators of Resilience and Equity (ASPIRE). Obtained on July 10, 2017, from http://datatopics.worldbank.org/aspire/
Suriel, A. (2015) Progresando con solidaridad: principal estrategia del gobierno para reducir la pobreza extrema. Presentación en Seminario Internacional: Sistemas de Protección e Inclusión Social en América Latina. Buenos Aires, May 21, 2015
Tiribayi, N., Knowles, M. y Davies, B. (2013). The Interaction Between Social Protection and Agriculture: a Review of Evidence. Rome: FAO.
Thow, A. M y Hawkes, C. (2009). The Implications of Trade Liberalization for Diet and Health: a Case Study from Central America. Globalization and Health.
UN (2014). Desarrollo agrícola, seguridad alimentaria y nutrición. New York: UN.
UN (2016a). Procesos en los objetivos de Desarrollo Sostenible. New York: UN
UN (2016b). Progresos en los objetivos de Desarrollo Sostenible. New York: UN
UN (2017a). World Economic Situation and Prospects 2017. New York: UN.
UN (2017b). World Economic Situation and Prospects Update as of mid–2017. New York: UN.
UN (2017c). Informe del Grupo Interinstitucional y de Expertos sobre los Indicadores de los Obejtivos de Desarrollo Sostenible. New York.
UN (n.d.). Objetivos de Desarrollo Sostenible. Obtained from United Nations: http://www.un.org/sustainabledevelopment/es/water–and–sanitation/
UNDP (2016). Progreso multidimensional: bienestar más allá del ingreso. New York: UNDP.
UNFCCC. (1992). United Nations Framework Convention on Climate Change.
UNICEF (2004). Relación del agua, el saneamiento y la higiene con la salud, hechos y cifras.
UNICEF (2006). Desnutrición infantil en América Latina y el Caribe. Boletín de la infancia y adolescencia sobre el avance de los objetivos de desarrollo del Milenio, Número 2, abril de 2006.
University of Murcia (2008). Agroecología Vol.3. Obtenido de Sociedad Española de Agricultura
| 101 |

BIBLIOGRAFÍA
© FAO
| 102 |

PANORAMA OF FOOD AND NUTRITION SECURITY IN LATIN AMERICA AND THE CARIBBEAN 2017PANORAMA DE LA SEGURIDAD ALIMENTARIA Y NUTRICIONAL EN AMÉRICA LATINA Y EL CARIBE
ANNEX CLIMATE-CHANGE
RELATED RISKS, DRIVERS AND
EFFECTS ON FNS, AND MEASURES TO
FACE SUCHRISKS
| 103 |

ANNEX
Risk Climate–related drivers of impacts Impacts on food and nutrition security Adaptation and mitigation measures to face risks
Wildfire induced loss of ecosystem integrity, property loss, human morbidity and mortality, as a result of the increased drying trend and temperature trend.
1. Warming trend2. Drying trend
1. Disruption in production conditions2. Disruption in storage or in production chains 3. Decline in production 4. Higher food prices5. Reduced purchasing power6. Changes in dietary patterns
1. Fire protection measures2. Prescribed burning3. Introduction of resilient vegetation 4. Agroforestry as a strategy for reducing slash–and–burn practices
Urban floods in riverine and coastal areas, inducing property and infrastructure damage; supply chain, ecosystem, and social system disruption; public health impacts; and water quality impairment, due to rising sea level, extreme rainfall and cyclones.
1. Extreme rainfall2. Cyclone3. Sea level
1. Disruption in sanitary conditions2. Disruption in food safety
1. Drainage management1. Low–risk strategies with shared benefits, comprising less impervious areas allowing greater recharge of groundwater, green infrastructure, and gardens and vegetable gardens in rooftops.2. Updating old design standards for rainfall used, to reflect current climate conditions.2. Preservation of wetlands, especially mangroves 3. Land–use planning strategies
Water availability in semi–arid and glacier–melt–dependent regions and Central America; flooding and landslides in urban and rural areas due to extreme rainfall.
1. Warming trend2. Drying trend3. Snow cover4. Extreme rainfall
1. Disruption in production conditions2. Decline in production3. Higher food prices4. Reduced purchasing power5. Changes in dietary patterns
1. Comprehensive water–resource management2. Urban and rural flood management (including infrastructure), early warning systems, improved weather and runoff forecasting, and infectious disease control.
Decreased food production and food quality 1. Extreme temperature2. Carbon dioxide fertilization3. Extreme rainfall4. Rainfall
1. Higher food prices2. Reduced purchasing power3. Changes in dietary patterns
1. Developing new crop varieties that are more adapted to climate change (temperature and drought)2. Offsetting impacts of lower food quality on human and animal health3. Offsetting economic impacts of changes in land use4. Strengthening of systems and practices based on traditional indigenous knowledge
Spread of vector–borne diseases in altitude and latitude 1. Warming trend2. Extreme temperature3. Extreme rainfall4. Rainfall
1. Disruption in production conditions2. Decline in production3. Higher food prices4. Reduced purchasing power5. Changes in dietary patterns
1. Developing early warning systems for the control and mitigation of climate–related or other type of relevant diseases. There are many factors, leading to greater vulnerability.2. Establishing programmes to expand basic public healthcare services.
Loss of livelihoods, coastal settlements, infrastructure, ecosystem services, and economic stability.
1. Drying trend2. Cyclone3. Ocean acidification4. Sea level5. Extreme rainfall
1. Disruption in production conditions2. Disruption in storage or production chains 3. Decline in production4. Higher food prices5. Reduced purchasing power6. Changes in dietary patterns
1. New resources and technologies for improving the adaptation response of islands.2. Maintenance and improvement of ecosystem functions and services and water and food safety.
The interaction of global mean sea level in the 21st century, with high–water–level events will threaten low–lying coastal areas.
1. Cyclone2. Sea level
1. Disruption in production conditions2. Decline in production3. Higher food prices4. Reduced purchasing power5. Changes in dietary patterns
1. Maintenance and restoration of topography and coastal ecosystems.2. Improving management of soil and freshwater resources3. Updating construction codes and laying down proper settlement guidelines
| 104 |

PANORAMA OF FOOD AND NUTRITION SECURITY IN LATIN AMERICA AND THE CARIBBEAN
Risk Climate–related drivers of impacts Impacts on food and nutrition security Adaptation and mitigation measures to face risks
Wildfire induced loss of ecosystem integrity, property loss, human morbidity and mortality, as a result of the increased drying trend and temperature trend.
1. Warming trend2. Drying trend
1. Disruption in production conditions2. Disruption in storage or in production chains 3. Decline in production 4. Higher food prices5. Reduced purchasing power6. Changes in dietary patterns
1. Fire protection measures2. Prescribed burning3. Introduction of resilient vegetation 4. Agroforestry as a strategy for reducing slash–and–burn practices
Urban floods in riverine and coastal areas, inducing property and infrastructure damage; supply chain, ecosystem, and social system disruption; public health impacts; and water quality impairment, due to rising sea level, extreme rainfall and cyclones.
1. Extreme rainfall2. Cyclone3. Sea level
1. Disruption in sanitary conditions2. Disruption in food safety
1. Drainage management1. Low–risk strategies with shared benefits, comprising less impervious areas allowing greater recharge of groundwater, green infrastructure, and gardens and vegetable gardens in rooftops.2. Updating old design standards for rainfall used, to reflect current climate conditions.2. Preservation of wetlands, especially mangroves 3. Land–use planning strategies
Water availability in semi–arid and glacier–melt–dependent regions and Central America; flooding and landslides in urban and rural areas due to extreme rainfall.
1. Warming trend2. Drying trend3. Snow cover4. Extreme rainfall
1. Disruption in production conditions2. Decline in production3. Higher food prices4. Reduced purchasing power5. Changes in dietary patterns
1. Comprehensive water–resource management2. Urban and rural flood management (including infrastructure), early warning systems, improved weather and runoff forecasting, and infectious disease control.
Decreased food production and food quality 1. Extreme temperature2. Carbon dioxide fertilization3. Extreme rainfall4. Rainfall
1. Higher food prices2. Reduced purchasing power3. Changes in dietary patterns
1. Developing new crop varieties that are more adapted to climate change (temperature and drought)2. Offsetting impacts of lower food quality on human and animal health3. Offsetting economic impacts of changes in land use4. Strengthening of systems and practices based on traditional indigenous knowledge
Spread of vector–borne diseases in altitude and latitude 1. Warming trend2. Extreme temperature3. Extreme rainfall4. Rainfall
1. Disruption in production conditions2. Decline in production3. Higher food prices4. Reduced purchasing power5. Changes in dietary patterns
1. Developing early warning systems for the control and mitigation of climate–related or other type of relevant diseases. There are many factors, leading to greater vulnerability.2. Establishing programmes to expand basic public healthcare services.
Loss of livelihoods, coastal settlements, infrastructure, ecosystem services, and economic stability.
1. Drying trend2. Cyclone3. Ocean acidification4. Sea level5. Extreme rainfall
1. Disruption in production conditions2. Disruption in storage or production chains 3. Decline in production4. Higher food prices5. Reduced purchasing power6. Changes in dietary patterns
1. New resources and technologies for improving the adaptation response of islands.2. Maintenance and improvement of ecosystem functions and services and water and food safety.
The interaction of global mean sea level in the 21st century, with high–water–level events will threaten low–lying coastal areas.
1. Cyclone2. Sea level
1. Disruption in production conditions2. Decline in production3. Higher food prices4. Reduced purchasing power5. Changes in dietary patterns
1. Maintenance and restoration of topography and coastal ecosystems.2. Improving management of soil and freshwater resources3. Updating construction codes and laying down proper settlement guidelines
| 105 |

2017PANORAMA OF
FOOD AND NUTRITION
SECURITY IN LATIN AMERICA AND
THE CARIBBEAN Undernourishment in Latin America and the Caribbean increased in the last measurement period. After a plateau of several years, in 2016 approximately 42.5 million people do not have enough food to meet their required daily calorie intake, accounting for an increase of 2.4 million people versus the previous year.
If necessary actions are not taken to overcome both hunger and malnutrition, Latin America and the Caribbean will not attain the goal of ending hunger and malnutrition by 2030, set in the Sustainable Development Goals.
Despite the decline in child undernutrition, overweight and obesity continue posing important health issues for Latin America and the Caribbean. The prevalence of obesity in adults is on the rise and overweight in children under 5 years of age affects 7% the population, ranking above the 6% of overweight children registered worldwide.
Although Latin America and the Caribbean produce enough food to meet the needs of their population, this does not ensure healthy and nutritious diets. There is a need for creating sustainable and nutrition-sensitive food systems to provide varied and safe foods, with good nutritional quality that help put an end to hunger and all forms of malnutrition.
Both the economic slowdown in Latin America and the Caribbean and the slower pace of poverty and extreme poverty reduction dynamics over the last few years have hindered the eradication of hunger and malnutrition. Furthermore, persisting income inequality puts pressure on access to food, with the ensuing impact on food and nutrition security.
Marked differences in access to basic services are observed in Latin America and the Caribbean, both among and within countries. Rural areas and low-income population groups have far less access to drinking water and sanitation in the region.
Weather-related disasters have caused considerable economic damages and severe consequences for food and nutrition security. This scenario has imposed a sense of urgency on the actions required for the mitigation and adaptation actions required.
KEY MESSAGES
I7914EN/1/12.17
ISBN 978-92-5-130056-5
9 7 8 9 2 5 1 3 0 0 5 6 5