Embed Size (px)
Citation preview

ERCOT Public STUDY REPORT
© 2014 Electric Reliability Council of Texas, Inc. System Planning
PANHANDLE RENEWABLE ENERGY ZONE (PREZ) STUDY REPORT
April 2014
Prepared by ERCOT System Planning

Panhandle Renewable Energy Zone Study ERCOT Public
© 2014 Electric Reliability Council of Texas, Inc. All rights reserved.
Disclaimer
The Electric Reliability Council of Texas (ERCOT) System Planning staff prepared this document. It is a report of the ERCOT transmission system, identifying the potential system constraints and transmission upgrade needs to accommodate wind generation projects in Texas Panhandle. Transmission system planning is a continuous process. Conclusions reached in this report can change with the addition (or elimination) of plans for new generation, transmission facilities, equipment, or loads.
ERCOT AND ITS CONTRIBUTING MEMBER COMPANIES DISCLAIM ANY WARRANTY, EXPRESSED OR IMPLIED, INCLUDING ANY WARRANTY OF MERCHANTABILITY OR FITNESS FOR ANY PARTICULAR PURPOSE WHATSOEVER WITH RESPECT TO THE INFORMATION BEING PROVIDED IN THIS REPORT.
The use of this information in any manner constitutes an agreement to hold harmless and indemnify ERCOT, its Member Companies, employees, and/or representatives from all claims of any damages. In no event shall ERCOT, its Member Companies, employees, and/or representatives be liable for actual, indirect, special, or consequential damages in connection with the use of this data. Users are advised to verify the accuracy of this information with the original source of the data.
Acknowledgement
ERCOT acknowledges the support, cooperation, and contribution of the ERCOT Regional Planning Group and ERCOT Transmission Service Providers.
Document Revisions
Date Version Description Author(s)
04/18/2014 1.0 Final Shun-Hsien (Fred) Huang, John Schmall, Yang Zhang, Ying Li
Reviewed by: Jeff Billo, Warren Lasher

Panhandle Renewable Energy Zone Study ERCOT Public
© 2014 Electric Reliability Council of Texas, Inc. All rights reserved. i
EXECUTIVE SUMMARY
Background
The Competitive Renewable Energy Zone (CREZ) transmission improvements were endorsed by the
Public Utility Commission of Texas (PUCT) in 2008 in order to accommodate an incremental 11,553 MW of
wind generation capacity in West Texas. These projects include new transmission facilities in the Texas
Panhandle. Prior to the CREZ project, there were no ERCOT transmission lines extending into the Texas
Panhandle and therefore no load or generation in the area connected to ERCOT. Furthermore, at the time the
PUCT ordered the CREZ transmission projects to be constructed, there were no generation plants with signed
generation interconnection agreements (SGIA) for connection to the proposed Panhandle CREZ facilities. The
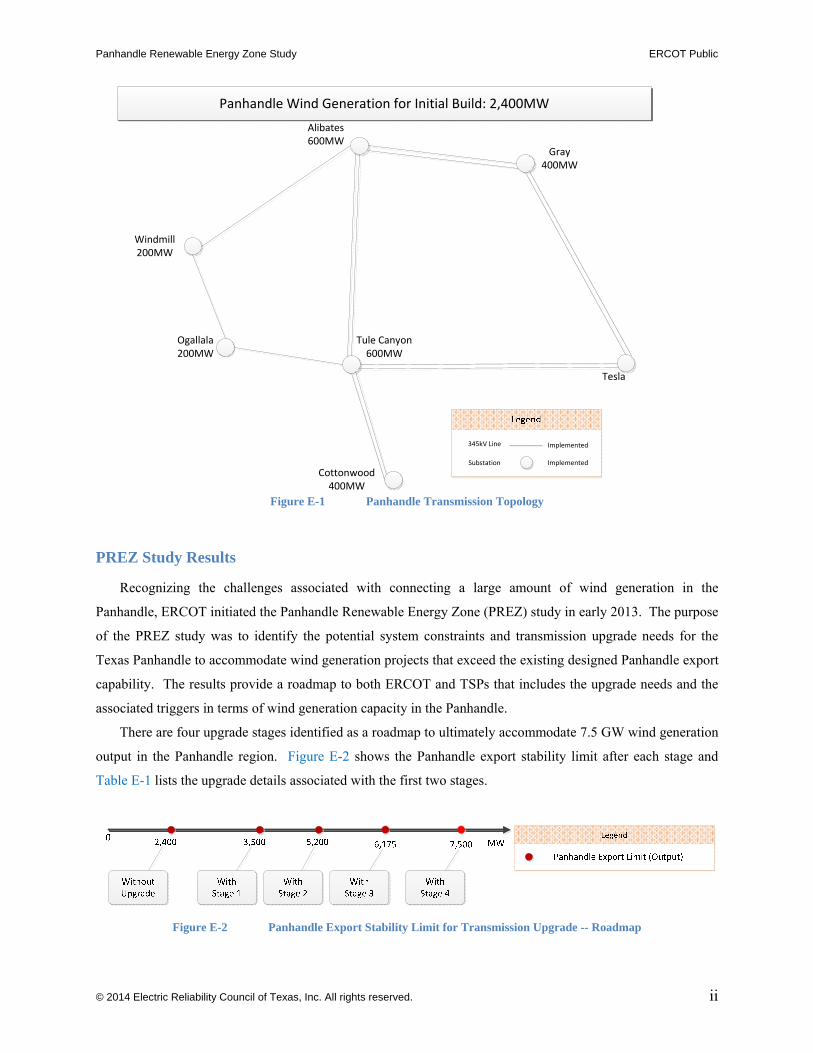
reactive equipment necessary to support the export of power from the Panhandle was implemented for 2,400
MW of wind generation capacity (shown in Figure E-1), even though the transmission lines were constructed
to accommodate a much larger capacity. This decision was made because the size and location of any
additional equipment would be dependent upon the size and location of the wind generation that actually
developed in the area.
The Panhandle region is currently experiencing significantly more interest from wind generation
developers than what was initially planned for the area. The ERCOT 2012 Long-Term System Assessment
(LTSA) report indicated that the northwestern-most portion of the Panhandle CREZ system could see a
significant amount of wind generation development and resulting voltage stability limits would cause the
constraining of wind power delivery to the rest of the ERCOT system. As of 2013, there was over 11 GW of
wind generation in service on the ERCOT system. According to the Generation Interconnection Request list
reviewed in December 2013, there was over 4 GW of wind generation capacity with a signed interconnection
agreement (SGIA) in the Texas Panhandle and more than 10 GW wind generation capacity proposed to
connect to the Texas Panhandle that was progressing through the interconnection process. This information
indicates that the wind generation projects located in the Texas Panhandle are likely to exceed the 2,400 MW
capacity for which reactive support was initially installed.
The ERCOT Panhandle grid is remote from synchronous generators and requires long distance power
transfer to the load centers in ERCOT. All wind generation projects in the Panhandle are expected to be
equipped with advanced power electronic devices that will further weaken the system strength due to limited
short circuit current contributions. Dynamic response in the Panhandle will be dominated by power electronic
devices (wind plants, SVC, etc.) such that voltage control becomes very difficult because of the high voltage
sensitivity of dV/dQ. In other words, under weak grid conditions, a small variation of reactive support results
in large voltage deviations. Stability challenges and weak system strength are expected to be significant
constraints for Panhandle export.
Panhandle Renewable Energy Zone Study ERCOT Public
© 2014 Electric Reliability Council of Texas, Inc. All rights reserved. ii
Figure E-1 Panhandle Transmission Topology
PREZ Study Results
Recognizing the challenges associated with connecting a large amount of wind generation in the
Panhandle, ERCOT initiated the Panhandle Renewable Energy Zone (PREZ) study in early 2013. The purpose
of the PREZ study was to identify the potential system constraints and transmission upgrade needs for the
Texas Panhandle to accommodate wind generation projects that exceed the existing designed Panhandle export
capability. The results provide a roadmap to both ERCOT and TSPs that includes the upgrade needs and the
associated triggers in terms of wind generation capacity in the Panhandle.
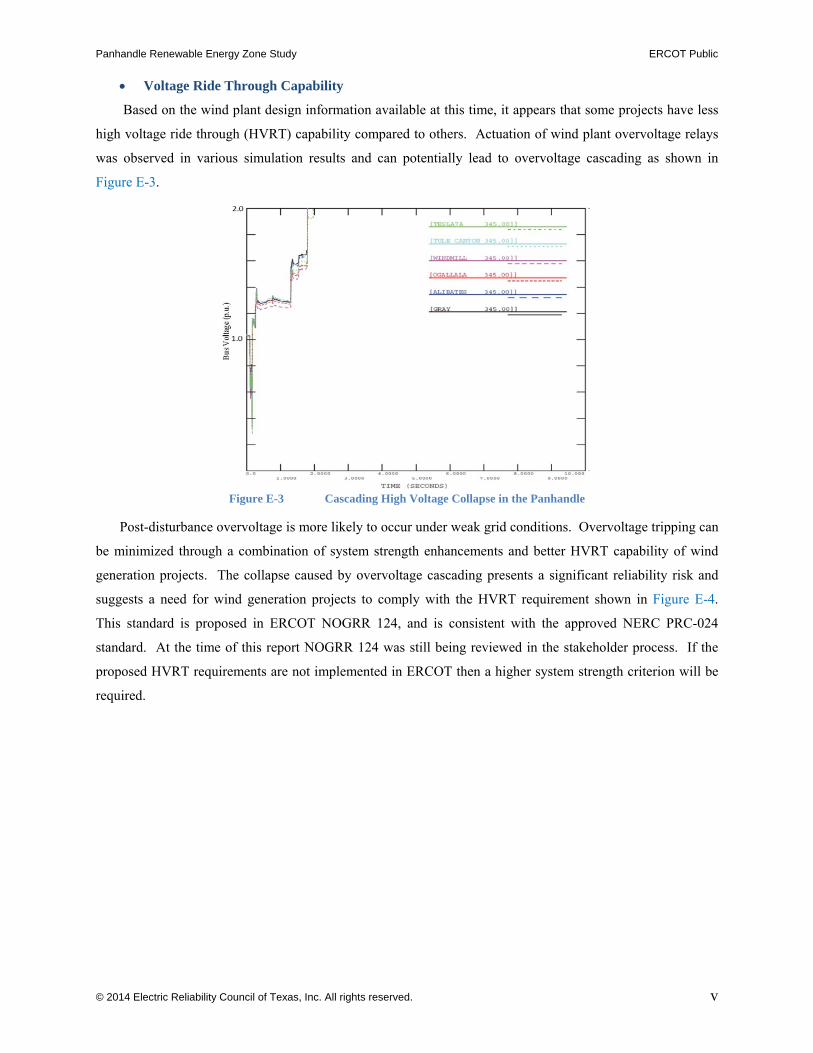
There are four upgrade stages identified as a roadmap to ultimately accommodate 7.5 GW wind generation
output in the Panhandle region. Figure E-2 shows the Panhandle export stability limit after each stage and
Table E-1 lists the upgrade details associated with the first two stages.
Figure E-2 Panhandle Export Stability Limit for Transmission Upgrade -- Roadmap
Alibates600MW
Windmill200MW
Ogallala200MW
Tule Canyon600MW
Gray400MW
Cottonwood400MW
Tesla
345kV Line Implemented
Panhandle Wind Generation for Initial Build: 2,400MW
Substation Implemented

Panhandle Renewable Energy Zone Study ERCOT Public
© 2014 Electric Reliability Council of Texas, Inc. All rights reserved. iii
Table E-1 Panhandle Transmission Upgrade Roadmap -- Detailed Project List
Stage
Panhandle Export Stability Limit (MW)
Trigger for Upgrade (Panhandle Wind Capacity) (MW)* Upgrade Element
Estimated Upgrade Cost ($M)
Existing grid 2,400 - - -
1 3,500 3,000 MW
• Add second circuit on the existing Panhandle grid
• 200 MVA synchronous condensers • 150 MVAr reactors 115
2 5,200 6,500 MW
• Add one new 345 kV double circuit -- (Ogallala-Long Draw)
• 750 MVA synchronous condensers • 350 MVAr reactors 560
*assuming the limit will be enforced at 90% of the stability limit
Several transmission improvements can be implemented at a relatively low cost and in a relatively short
time frame to increase the Panhandle export capability. These include installing shunt reactors, synchronous
condensers, and adding the second circuit on the existing towers that were constructed to be double-circuit
capable with originally just one circuit in place. Additional improvements to increase export limits will
include new transmission lines on new right of way (ROW). These improvements will require significant
wind generation development commitment in order to be economically justified.
It should be noted that the identified improvements were based on the assumptions used in this study.
Should these assumptions change, the results of this analysis will need to be updated which could yield a
different set of transmission improvements or trigger points. Assumptions that could change the results of this
analysis include the size and location of actual wind generation development in the Panhandle, a change to the
assumed high voltage ride through requirement, connection of a proposed DC-tie in the Panhandle,
transmission upgrade cost estimates, or natural gas price projections.
Although additional synchronous generators in the Panhandle region can improve the system strength and
provide dynamic voltage support, it is unlikely that such synchronous generators will be on-line under high
wind output conditions since synchronous generators typically have a higher marginal cost than wind plants.
Therefore, the addition of new synchronous generators in the Panhandle region is not expected to change the
study results.
Key Observations and Findings
Panhandle Weak Grid Characteristics
The Panhandle grid is remote from synchronous generators and load centers and is considered a weak grid
when integrating a large amount of wind generation. Several system characteristics and challenges that can
occur in a weak grid are:

Panhandle Renewable Energy Zone Study ERCOT Public
© 2014 Electric Reliability Council of Texas, Inc. All rights reserved. iv
In a highly compensated weak grid, voltage collapse can occur within the normal operating
voltage range (0.95 to 1.05 pu) masking voltage stability risks in real time operations. Static
capacitor and static var compensators contribute to this effect and have limited effectiveness for
further increasing transfer capability.
A grid with low short circuit ratios and high voltage sensitivity of dV/dQ requires special
coordination of various complex control systems. Typical voltage control settings can result in
aggressive voltage support in a weak system and lead to un-damped oscillations, overvoltage
cascading or voltage collapse.
Wind projects connected to the Panhandle region are effectively connected to a common point of
interconnection (POI) such that each wind plant may interact with other Panhandle wind plants.
Weighted Short Circuit Ratio (WSCR)
There is currently no industry-standard approach to calculate the proper short circuit ratio (SCR) index for
a weak system with a high penetration of wind power plants. To take into account the effect of interactions
between wind plants and give a better estimate of the system strength, a more appropriate quantity is the
weighted short circuit ratio (WSCR), defined by:
2)(
*
/)*(
N
iRMWi
N
iRMWiSCMVAi
N
iRMWi
N
iRMWi
N
iRMWiSCMVAi
N
iRMWi
SCMVA
P
PS
P
PPS
P
SWeightedWSCR
(E-1)
Where SSCMVAi is the short circuit capacity at bus i before the connection of wind plant i and PRMWi is the
MW rating of wind plant i to be connected. N is the number of wind plants fully interacting with each other
and i is the wind plant index.
The proposed WSCR calculation method is based on the assumption of full interactions between wind
plants. This is equivalent to assuming all wind plants are connected to a single virtual Point of Interconnection
(POI). For a real power system, there is usually some electrical distance between each wind plant’s POI and
the wind plants will not fully interact with each other. The WSCR obtained with this method gives a
conservative estimate of the system strength and is considered as a proper index to represent the system
strength for the Panhandle region.
Panhandle Renewable Energy Zone Study ERCOT Public
© 2014 Electric Reliability Council of Texas, Inc. All rights reserved. v
Voltage Ride Through Capability
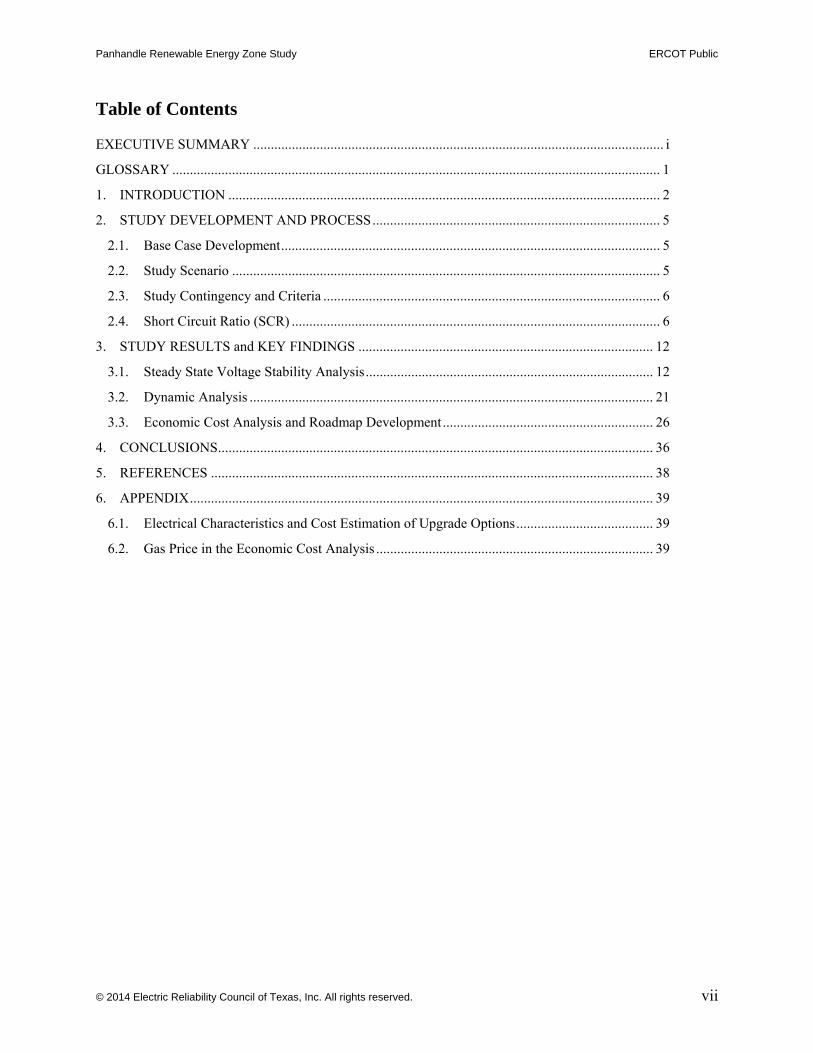
Based on the wind plant design information available at this time, it appears that some projects have less
high voltage ride through (HVRT) capability compared to others. Actuation of wind plant overvoltage relays
was observed in various simulation results and can potentially lead to overvoltage cascading as shown in
Figure E-3.
Figure E-3 Cascading High Voltage Collapse in the Panhandle
Post-disturbance overvoltage is more likely to occur under weak grid conditions. Overvoltage tripping can
be minimized through a combination of system strength enhancements and better HVRT capability of wind
generation projects. The collapse caused by overvoltage cascading presents a significant reliability risk and
suggests a need for wind generation projects to comply with the HVRT requirement shown in Figure E-4.
This standard is proposed in ERCOT NOGRR 124, and is consistent with the approved NERC PRC-024
standard. At the time of this report NOGRR 124 was still being reviewed in the stakeholder process. If the
proposed HVRT requirements are not implemented in ERCOT then a higher system strength criterion will be
required.

Panhandle Renewable Energy Zone Study ERCOT Public
© 2014 Electric Reliability Council of Texas, Inc. All rights reserved. vi
Figure E-4 Proposed Voltage Ride Through Capability for Wind Generation Resources
System Strength Enhancement
An appropriately conservative system strength calculation, WSCR, was used to characterize Panhandle
system strength. A WSCR of 1.5 was proposed as the minimum system strength need for the Panhandle. The
need for system strength enhancement should be determined based on wind generation output instead of wind
generation capacity when there is a constraint to limit wind plant output in real time operations.
Applicability of Study Results
The Panhandle wind generation resources modeled in the study case were based on each project’s
available generation interconnection information at the time the study was performed. As of 2013, there were
no generation projects in-service in the Panhandle, and the proposed upgrades may need to be revised based on
actual installed wind generation projects. The study results serve as a reference to both ERCOT and TSPs to
identify the challenges, constraints, and upgrade needs in the Panhandle region. These identified projects are
not approved transmission projects and may require additional Regional Planning Group (RPG) review prior to
implementation.
Future Work
ERCOT staff will continue to work with TSPs to evaluate alternative upgrade options proposed by TSPs
and/or stakeholders. ERCOT also will monitor the generation interconnection status for actual implementation
of wind projects in the Panhandle region. The impact of a proposed DC-tie connection to the Panhandle may
require further study.
Panhandle Renewable Energy Zone Study ERCOT Public
© 2014 Electric Reliability Council of Texas, Inc. All rights reserved. vii
Table of Contents
EXECUTIVE SUMMARY ..................................................................................................................... i
GLOSSARY ........................................................................................................................................... 1
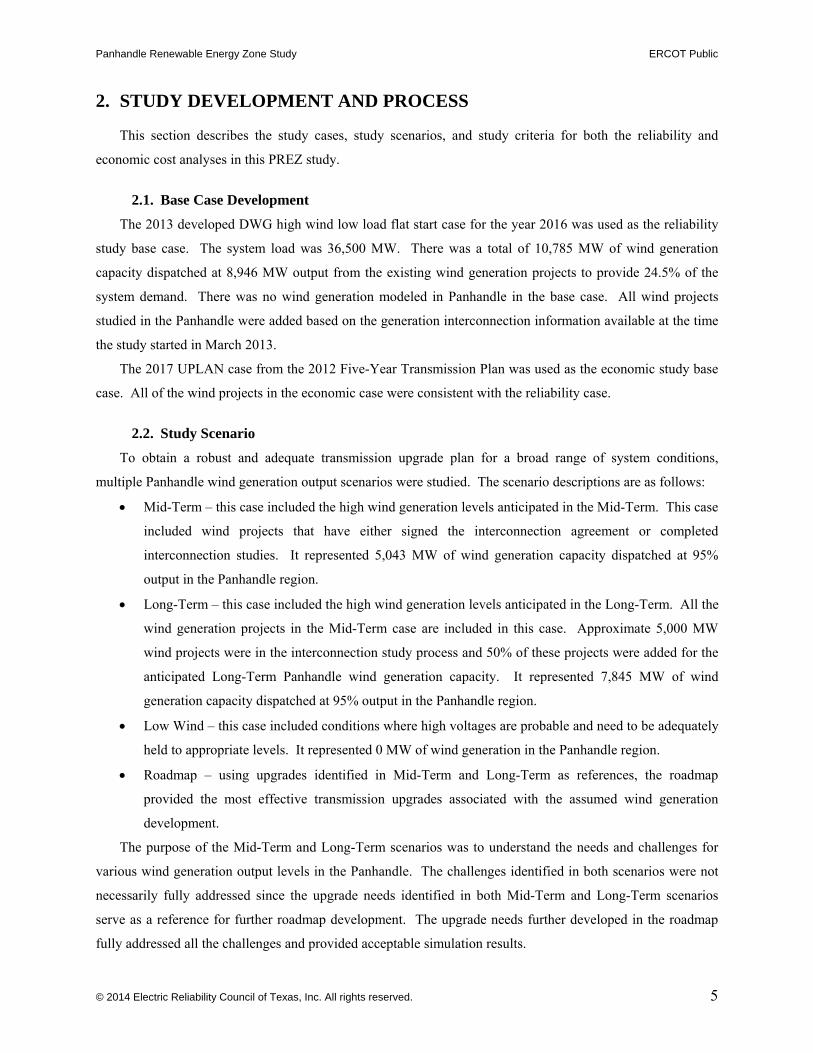
1. INTRODUCTION ........................................................................................................................... 2
2. STUDY DEVELOPMENT AND PROCESS .................................................................................. 5
2.1. Base Case Development ............................................................................................................ 5
2.2. Study Scenario .......................................................................................................................... 5
2.3. Study Contingency and Criteria ................................................................................................ 6
2.4. Short Circuit Ratio (SCR) ......................................................................................................... 6
3. STUDY RESULTS and KEY FINDINGS .................................................................................... 12
3.1. Steady State Voltage Stability Analysis .................................................................................. 12
3.2. Dynamic Analysis ................................................................................................................... 21
3.3. Economic Cost Analysis and Roadmap Development ............................................................ 26
4. CONCLUSIONS ............................................................................................................................ 36
5. REFERENCES .............................................................................................................................. 38
6. APPENDIX .................................................................................................................................... 39
6.1. Electrical Characteristics and Cost Estimation of Upgrade Options ....................................... 39
6.2. Gas Price in the Economic Cost Analysis ............................................................................... 39

Panhandle Renewable Energy Zone Study ERCOT Public
© 2014 Electric Reliability Council of Texas, Inc. All rights reserved. viii
Table of Figures
Figure 1-1 CREZ Projects - TSP's .............................................................................................. 2
Figure 1-2 Panhandle Topology ................................................................................................. 3
Figure 1-3 Accumulated Panhandle Wind Generation Project Capacity with SGIA ................. 4
Figure 2-1 Four Wind Generation Plants Integrated into the System with Weak Connections . 8
Figure 2-2 Wind Generation Oscillation Under Weak Conditions ............................................ 9
Figure 2-3 Voltage Response at WPP’s Point of Interconnection ............................................ 10
Figure 2-4 Process to Identify Synchronous Condenser Rating/Location ................................ 11
Figure 3-1 PV Analysis Scenario for ERCOT Panhandle Region ........................................... 12
Figure 3-2 PV Curves of Panhandle Buses – Base Case .......................................................... 14
Figure 3-3 PV Curves of Panhandle Buses – with Reactive Compensation ............................ 15
Figure 3-4 Cascading High Voltage Collapse in Panhandle .................................................... 22
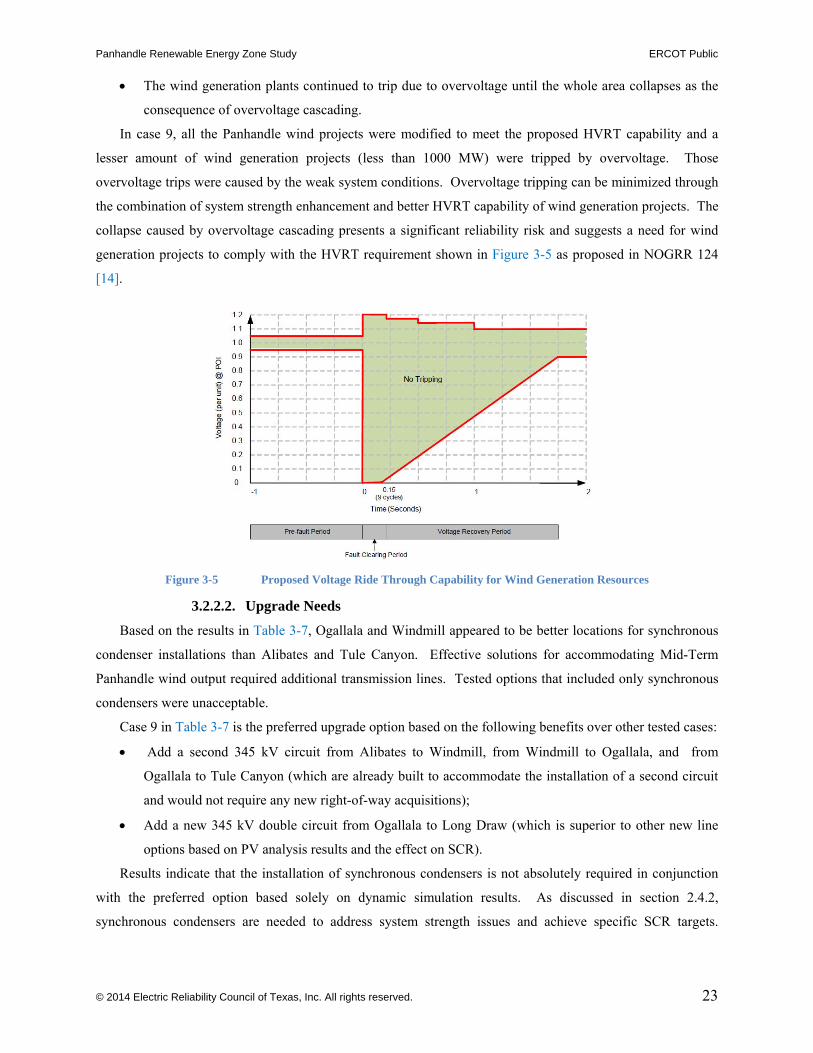
Figure 3-5 Proposed Voltage Ride Through Capability for Wind Generation Resources ....... 23
Figure 3-6 Monthly Wind Capacity Factors in ERCOT ........................................................... 27
Figure 3-7 Trigger Point and Export Limit for Stage 1 Upgrade ............................................. 28
Figure 3-8 Trigger Point and Export Limit for Stage 2 Upgrade ............................................. 30
Figure 3-9 Panhandle Export Stability Limit for Transmission Upgrade Roadmap ................ 33
Figure 3-10 Un-Damped Voltage Oscillation under High Wind Output Condition .................. 34
Figure 3-11 Improved Voltage Oscillation Damping under Low Wind Output Condition ....... 34
Figure 3-12 Panhandle Windmill 345 kV Bus Voltage Response under Studied Conditions.... 35

Panhandle Renewable Energy Zone Study ERCOT Public
© 2014 Electric Reliability Council of Texas, Inc. All rights reserved. ix
Table of Tables
Table 2-1 Wind Capacity and SCR Values Assuming No Interaction ...................................... 8
Table 2-2 Comparison of System Strength Enhancement Options ........................................... 9
Table 3-1 Panhandle Wind Projects Modeled in the PV Study .............................................. 13
Table 3-2 PV Analysis Result of 2016 HWLL Base Case ...................................................... 13
Table 3-3 PV Study Results of Tested System Upgrades for the Mid-Term Scenario ........... 15
Table 3-4 Select Upgrades for the Mid-Term Scenario .......................................................... 17
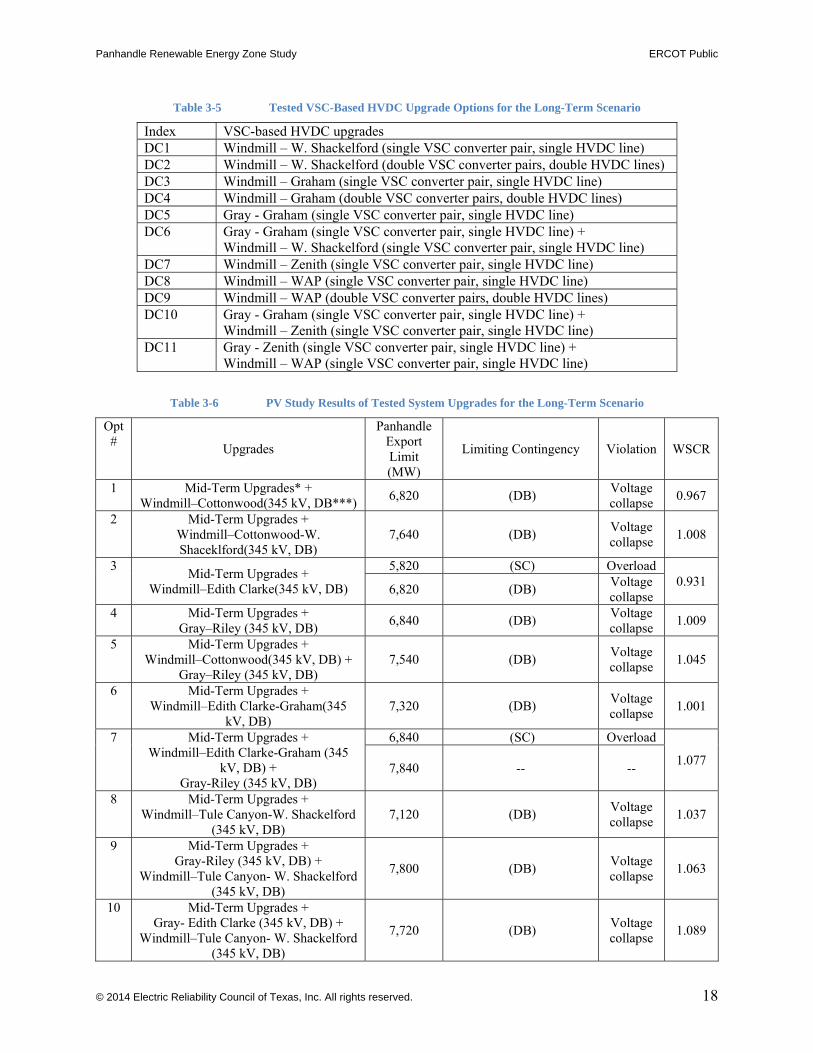
Table 3-5 Tested VSC-Based HVDC Upgrade Options for the Long-Term Scenario ........... 18
Table 3-6 PV Study Results of Tested System Upgrades for the Long-Term Scenario ......... 18
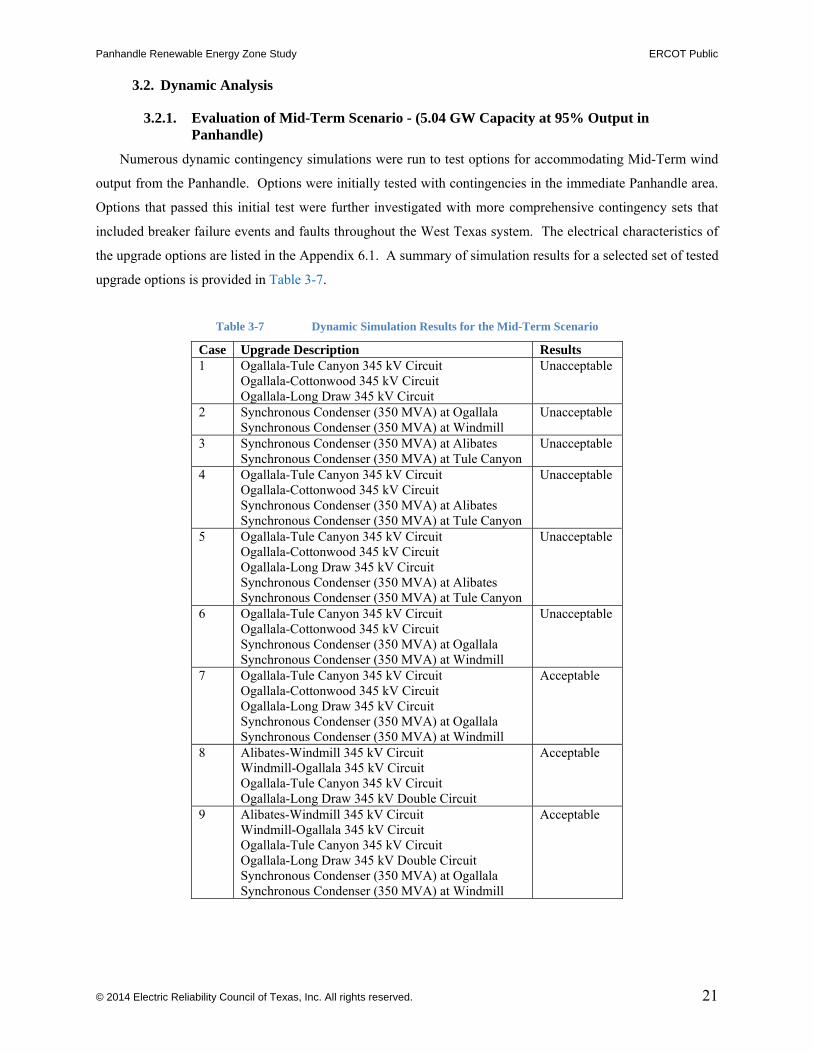
Table 3-7 Dynamic Simulation Results for the Mid-Term Scenario ...................................... 21
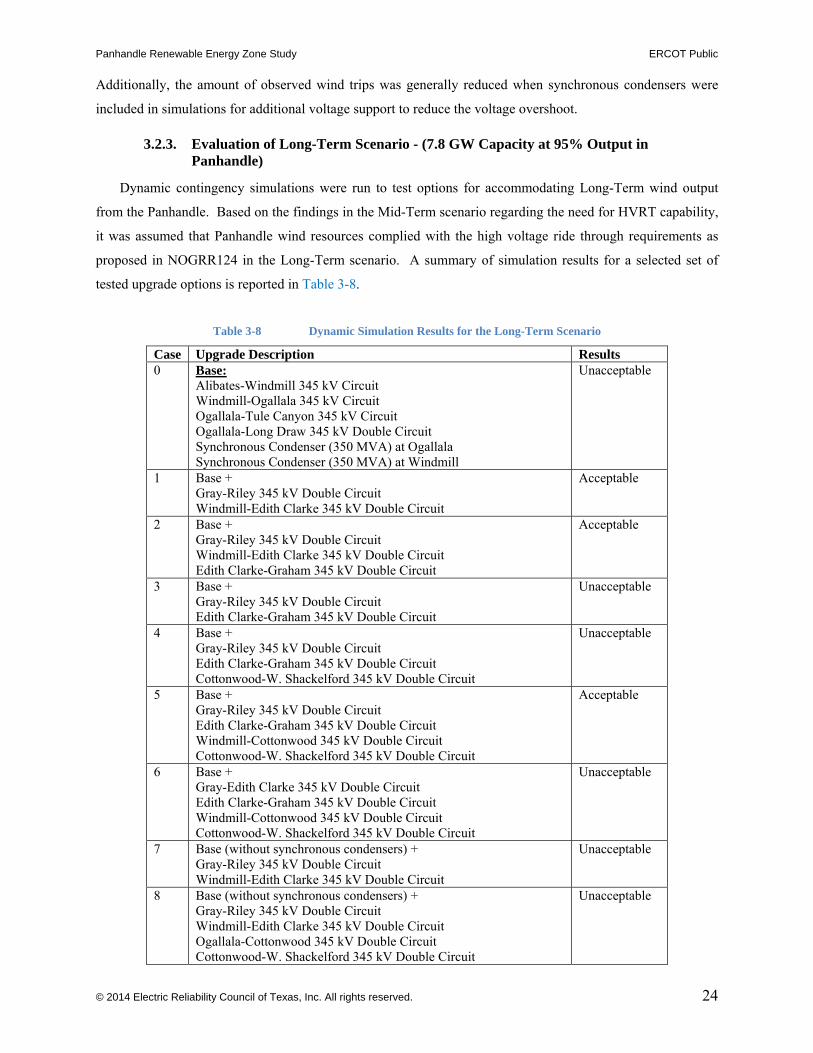
Table 3-8 Dynamic Simulation Results for the Long-Term Scenario ..................................... 24
Table 3-9 Panhandle Interface Definition ............................................................................... 27
Table 3-10 Transmission Projects for Stage 1 Upgrade ............................................................ 28
Table 3-11 Production Cost Simulation Cases for Stage 1 Upgrade ........................................ 28
Table 3-12 Transmission Projects for Stage 2 Upgrade ............................................................ 30
Table 3-13 Production Cost Simulation Cases for Stage 2 Upgrade ........................................ 30
Table 3-14 Additional Transmission Path Options after Stage 2 Upgrade ............................... 31
Table 3-15 Study Results Comparison for Three Stage 3 Transmission Options ..................... 31
Table 3-16 Panhandle Transmission Upgrade Roadmap -- Detailed Project List .................... 33
Table 3-17 Study Case Conditions for WSCR Sensitivity Analysis ......................................... 35

Panhandle Renewable Energy Zone Study ERCOT Public
© 2014 Electric Reliability Council of Texas, Inc. All rights reserved. 1
GLOSSARY
HVRT – High Voltage Ride Through
NERC - North American Electric Reliability Corporation
PREZ – Panhandle Renewable Energy Zone
PSS/E - Power System Simulator for Engineering, Version 32.0
PV - Power versus Voltage relationship
SSWG - Steady-State Working Group under the ERCOT Reliability and Operations Subcommittee
SVC - Static VAR Compensator (a device for providing dynamic reactive support)
STATCOM – Static Synchronous Compensator (a device for providing dynamic reactive support)
VFT - Variable Frequency Transformer

Panhandle Renewable Energy Zone Study ERCOT Public
© 2014 Electric Reliability Council of Texas, Inc. All rights reserved. 2
1. INTRODUCTION
A Competitive Renewable Energy Zone (CREZ) is a geographic area with optimal conditions for the
economic development of wind power generation facilities. The Public Utility Commission of Texas (PUCT)
issued a final order in Docket No. 33672 in 2008, designating a number of transmission projects to be
constructed to transmit wind power from the CREZs to the highly populated metropolitan areas of the state.
The approved CREZ projects were largely completed in 2013 and Figure 1-1 shows the overall projects by
Transmission Service Provider (TSP) [1].
Figure 1-1 CREZ Projects - TSP's
The designated CREZ transmission improvements include over 2,300 miles of new 345 kV right-of-way
and were planned to accommodate an incremental 11,553 MW of wind generation capacity in West Texas.
ERCOT, in conjunction with the CREZ TSPs, commissioned the CREZ Reactive Power Study to identify the
size, type, and location of equipment needed to control, condition, and route the power flowing through the
CREZ transmission projects. This study was awarded to ABB Inc. and was completed in December 2010.
The results of the CREZ Reactive Power Study were reviewed by the TSPs and additional reactive power
capacity was added as recommended [2].

Panhandle Renewable Energy Zone Study ERCOT Public
© 2014 Electric Reliability Council of Texas, Inc. All rights reserved. 3
Prior to the CREZ project there were no ERCOT transmission lines extending into the Texas Panhandle
and therefore no load or generation in the area connected to ERCOT. Furthermore, at the time the PUCT
ordered the CREZ transmission projects to be constructed, there were no generation plants with signed
generation interconnection agreements (SGIA) for connection to the proposed Panhandle CREZ facilities. The
reactive equipment necessary to support the export of power from the Panhandle was implemented for 2,400
MW, even though the transmission lines were constructed to accommodate a much larger capacity. Figure 1-2
shows the implemented Panhandle transmission topology. There were two main drivers for this decision.
First, at the time, there was not a clear indication of how much wind generation capacity would interconnect in
the area or how quickly it would develop. Second, since the CREZ Reactive Power Study indicated that the
export of power from the Panhandle will be voltage-stability constrained, the location and amount of wind
generation facilities within the area will dictate the location and size requirement for additional reactive
support devices. Hence, the details concerning additional reactive equipment needs for the Panhandle were left
for later studies when more information would be available.
Figure 1-2 Panhandle Topology
The ERCOT 2012 Long-Term System Assessment (LTSA) report [3] indicated that the northwestern-most
portion of the Panhandle CREZ system could see a significant amount of wind generation development and
could exceed voltage stability limits which would lead to constraining wind power delivery to the rest of the
ERCOT system. As of 2013, there was over 11 GW of wind generation in service on the ERCOT system.
According to the Generation Interconnection Request list reviewed in December 2013, there was over 4 GW of
Alibates600MW
Windmill200MW
Ogallala200MW
Tule Canyon600MW
Gray400MW
Cottonwood400MW
Tesla
345kV Line Implemented
Panhandle Wind Generation for Initial Build: 2,400MW
Substation Implemented

Panhandle Renewable Energy Zone Study ERCOT Public
© 2014 Electric Reliability Council of Texas, Inc. All rights reserved. 4
wind generation capacity with a signed interconnection agreement (SGIA) in the Texas Panhandle. The
accumulated Panhandle wind generation capacity with SGIA based on the signing date as reviewed in
December 2013 is shown in Figure 1-3. Additionally, more than 10 GW of wind generation capacity proposed
to connect to the Texas Panhandle was actively progressing through the interconnection process. This
indicates that the wind generation projects located in the Texas Panhandle will likely exceed the 2,400 MW
capacity for which reactive support was initially installed.
The ERCOT Panhandle grid is remote from both synchronous generators and load centers. It requires long
distance power transfer from the Panhandle region to the load centers in ERCOT. Large amounts of wind
generation with advanced power electronic devices that are expected to be installed in Panhandle grid will
further weaken the system strength. Dynamic response in the area will be dominated by power electronic
devices (wind plants, SVC, etc.) such that voltage control will be very difficult because of the high voltage
sensitivity of dV/dQ. In other words, under weak grid conditions, a small variation of reactive support results
in large voltage deviations.
Based on the abovementioned reasons and observations, stability challenges and weak system strength are
expected to be the significant constraints for Panhandle export. The purpose of the PREZ study was to identify
the potential system constraints and upgrade needs for the Panhandle region to accommodate wind generation
projects that exceed the existing designed Panhandle export capability. The PREZ study included both
reliability and economic cost analysis. The reliability analysis identified the upgrade needs to integrate
Panhandle wind generation. The economic cost analysis, following the ERCOT economic planning criteria in
ERCOT Protocol 3.11.2 [4], determined the trigger point for when the upgrades will be economically justified.
Figure 1-3 Accumulated Panhandle Wind Generation Project Capacity with SGIA
149
1328
24902990
3490
4338
0
1000
2000
3000
4000
5000
3Q, 2012 4Q, 2012 1Q, 2013 2Q, 2013 3Q, 2013 4Q, 2013
MW
SGIA Signed Data
Accumulated Panhandle Wind Generation Project Capacity with
SGIA (MW)
Panhandle Renewable Energy Zone Study ERCOT Public
© 2014 Electric Reliability Council of Texas, Inc. All rights reserved. 5
2. STUDY DEVELOPMENT AND PROCESS
This section describes the study cases, study scenarios, and study criteria for both the reliability and
economic cost analyses in this PREZ study.
2.1. Base Case Development
The 2013 developed DWG high wind low load flat start case for the year 2016 was used as the reliability
study base case. The system load was 36,500 MW. There was a total of 10,785 MW of wind generation
capacity dispatched at 8,946 MW output from the existing wind generation projects to provide 24.5% of the
system demand. There was no wind generation modeled in Panhandle in the base case. All wind projects
studied in the Panhandle were added based on the generation interconnection information available at the time
the study started in March 2013.
The 2017 UPLAN case from the 2012 Five-Year Transmission Plan was used as the economic study base
case. All of the wind projects in the economic case were consistent with the reliability case.
2.2. Study Scenario
To obtain a robust and adequate transmission upgrade plan for a broad range of system conditions,
multiple Panhandle wind generation output scenarios were studied. The scenario descriptions are as follows:
Mid-Term – this case included the high wind generation levels anticipated in the Mid-Term. This case
included wind projects that have either signed the interconnection agreement or completed
interconnection studies. It represented 5,043 MW of wind generation capacity dispatched at 95%
output in the Panhandle region.
Long-Term – this case included the high wind generation levels anticipated in the Long-Term. All the
wind generation projects in the Mid-Term case are included in this case. Approximate 5,000 MW
wind projects were in the interconnection study process and 50% of these projects were added for the
anticipated Long-Term Panhandle wind generation capacity. It represented 7,845 MW of wind
generation capacity dispatched at 95% output in the Panhandle region.
Low Wind – this case included conditions where high voltages are probable and need to be adequately
held to appropriate levels. It represented 0 MW of wind generation in the Panhandle region.
Roadmap – using upgrades identified in Mid-Term and Long-Term as references, the roadmap
provided the most effective transmission upgrades associated with the assumed wind generation
development.
The purpose of the Mid-Term and Long-Term scenarios was to understand the needs and challenges for
various wind generation output levels in the Panhandle. The challenges identified in both scenarios were not
necessarily fully addressed since the upgrade needs identified in both Mid-Term and Long-Term scenarios
serve as a reference for further roadmap development. The upgrade needs further developed in the roadmap
fully addressed all the challenges and provided acceptable simulation results.

Panhandle Renewable Energy Zone Study ERCOT Public
© 2014 Electric Reliability Council of Texas, Inc. All rights reserved. 6
2.3. Study Contingency and Criteria
Both three-phase-fault normal clearing and single-line-to-ground-fault stuck breaker events were tested in
the reliability analysis. The following criteria were applied in the studies.
Steady state voltage stability analysis
Thermal: 100% rate A for base case and 100% rate B for contingency analysis
Voltage: 0.95~1.05 pu for base case and 0.9~1.05 pu for contingency analysis
Transient stability analysis
Post disturbance voltage recovers within the range from 0.9 to 1.1 pu
Post disturbance frequency recovers within the range from 59.4 Hz to 60.4 Hz
Economic cost analysis
Thermal: 100% rate A for base case and 100% rate B for contingency analysis
2.4. Short Circuit Ratio (SCR)
2.4.1. Introduction to System Strength and Short Circuit Ratio
System strength is a common concern in the integration of renewable energy sources. The performance of
various components in a power system depends on the system strength, which reflects the sensitivity of system
variables to various disturbances. Short circuit ratio (SCR) is often used as an index of the system strength to
show how strong a network bus is with respect to the rated power of a device. SCR is defined as the ratio of
the short circuit capacity at the bus the device is located to the MW rating of the device [5]. A strong AC
system is defined as having an SCR above five, and the SCR of a weak system is below three [6].
Wind plants are often connected to weaker portions of the system remote from synchronous generators and
load centers. Voltage stability issues caused by large-scale wind integration in weak systems are important
topics to be addressed [7]-[9]. Some wind turbines have minimum system strength requirements. For
example, the default GE wind turbine model parameters are suitable for SCRs that are 5 or higher. For
connection to weaker systems, additional analyses are required to ensure proper tuning of model parameters
[10]. Specially designed control schemes of wind turbines or system strength enhancement are necessary to
ensure acceptable performance.
2.4.2. SCR Calculation Method
Conventionally, SCR is defined as the ratio of the short circuit capacity at the bus the device is located to
the MW rating of the device. Based on this definition, SCR is given by:
SCR = (1)
where SSCMVA is the short circuit capacity at the bus before the connection of the device and PRMW is the
rated MW of the device to be connected. Equation (1) is the commonly used SCR calculation method when
evaluating system strength. The key assumption and limitation of this SCR calculation method is that the

Panhandle Renewable Energy Zone Study ERCOT Public
© 2014 Electric Reliability Council of Texas, Inc. All rights reserved. 7
studied wind plant does not interact with other wind plants in the system. When wind plants are electrically
close to each other, they may interact with each other and oscillate together. In such cases, the SCR
calculation using equation (1) can result in an overly optimistic result.
There is currently no industry-standard approach to calculate the proper SCR index for a weak system with
high penetration of wind power plants. To take into account the effect of interactions between wind plants and
give a better estimate of the system strength, a more appropriate quantity is the weighted short circuit ratio
(WSCR), defined by:
2)(
*
/)*(
N
iRMWi
N
iRMWiSCMVAi
N
iRMWi
N
iRMWi
N
iRMWiSCMVAi
N
iRMWi
SCMVA
P
PS
P
PPS
P
SWeightedWSCR
(2)
Where SSCMVAi is the short circuit capacity at bus i before the connection of wind plant i and PRMWi is the
MW rating of wind plant i to be connected. N is the number of wind plants fully interacting with each other
and i is the wind plant index.
The proposed WSCR calculation method is based on the assumption of full interactions between wind
plants. This is equivalent to assuming that all wind plants are connected to a virtual Point of Interconnection
(POI). For a real power system, there is usually some electrical distance between each wind plant’s POI and
the wind plants will not fully interact with each other. The WSCR obtained with this method gives a
conservative estimate of the system strength and is considered as a proper index to represent the system
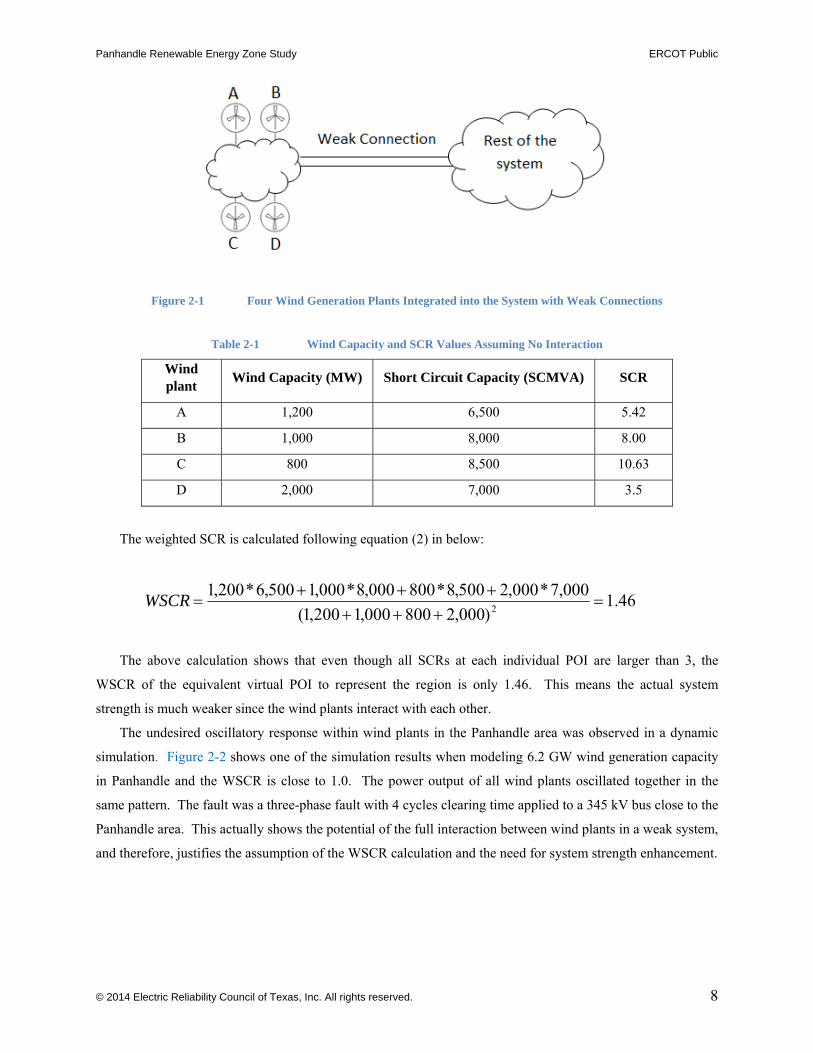
strength for the studied Panhandle region. A small sample system with four wind plants, as shown in Figure
2-1, is used to demonstrate the proposed WSCR concept. The subsystem consisting of four wind plants
connects to the main system with weak links. There is no significant electrical distance between each wind
plant’s POI. Table 2-1 shows the wind plant sizes and SCR values calculated using equation (1).
Panhandle Renewable Energy Zone Study ERCOT Public
© 2014 Electric Reliability Council of Texas, Inc. All rights reserved. 8
Figure 2-1 Four Wind Generation Plants Integrated into the System with Weak Connections
Table 2-1 Wind Capacity and SCR Values Assuming No Interaction
Wind plant
Wind Capacity (MW) Short Circuit Capacity (SCMVA) SCR
A 1,200 6,500 5.42
B 1,000 8,000 8.00
C 800 8,500 10.63
D 2,000 7,000 3.5
The weighted SCR is calculated following equation (2) in below:
46.1)000,2800000,1200,1(
000,7*000,2500,8*800000,8*000,1500,6*200,12
WSCR
The above calculation shows that even though all SCRs at each individual POI are larger than 3, the
WSCR of the equivalent virtual POI to represent the region is only 1.46. This means the actual system
strength is much weaker since the wind plants interact with each other.
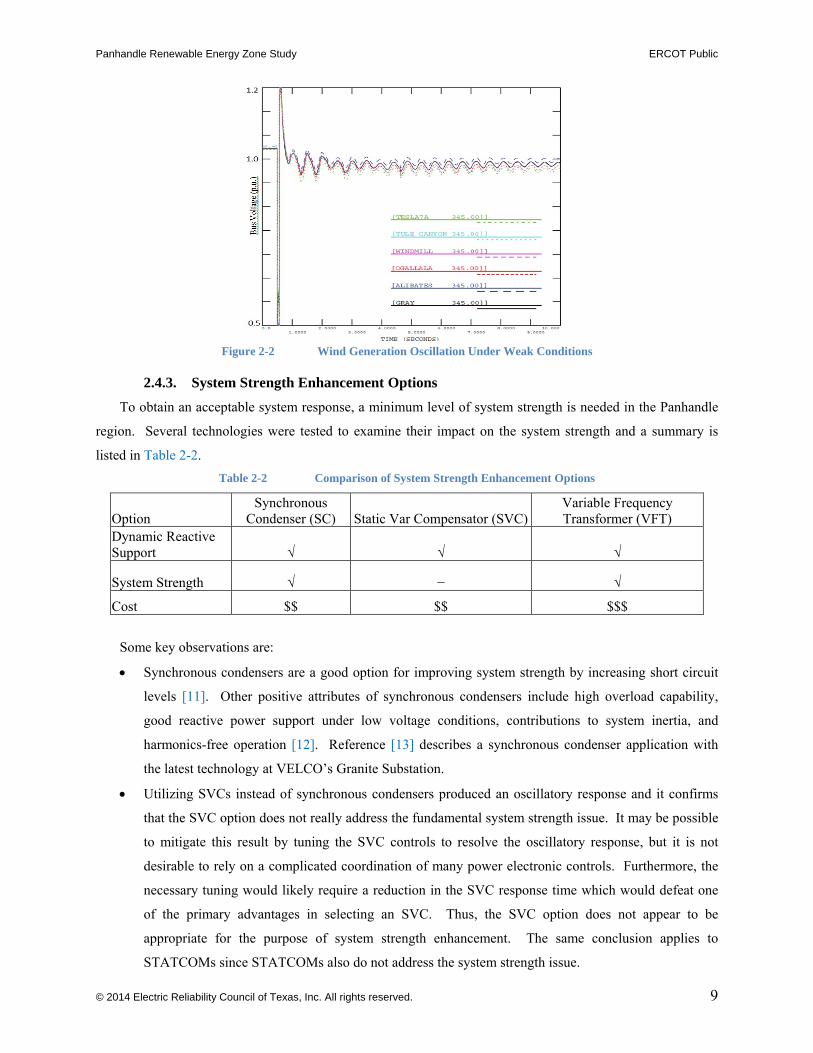
The undesired oscillatory response within wind plants in the Panhandle area was observed in a dynamic
simulation. Figure 2-2 shows one of the simulation results when modeling 6.2 GW wind generation capacity
in Panhandle and the WSCR is close to 1.0. The power output of all wind plants oscillated together in the
same pattern. The fault was a three-phase fault with 4 cycles clearing time applied to a 345 kV bus close to the
Panhandle area. This actually shows the potential of the full interaction between wind plants in a weak system,
and therefore, justifies the assumption of the WSCR calculation and the need for system strength enhancement.
Panhandle Renewable Energy Zone Study ERCOT Public
© 2014 Electric Reliability Council of Texas, Inc. All rights reserved. 9
Figure 2-2 Wind Generation Oscillation Under Weak Conditions
2.4.3. System Strength Enhancement Options
To obtain an acceptable system response, a minimum level of system strength is needed in the Panhandle
region. Several technologies were tested to examine their impact on the system strength and a summary is
listed in Table 2-2.
Table 2-2 Comparison of System Strength Enhancement Options
Option
Synchronous Condenser (SC) Static Var Compensator (SVC)
Variable Frequency Transformer (VFT)
Dynamic Reactive Support √ √ √
System Strength √ − √
Cost $$ $$ $$$
Some key observations are:
Synchronous condensers are a good option for improving system strength by increasing short circuit
levels [11]. Other positive attributes of synchronous condensers include high overload capability,
good reactive power support under low voltage conditions, contributions to system inertia, and
harmonics-free operation [12]. Reference [13] describes a synchronous condenser application with
the latest technology at VELCO’s Granite Substation.
Utilizing SVCs instead of synchronous condensers produced an oscillatory response and it confirms
that the SVC option does not really address the fundamental system strength issue. It may be possible
to mitigate this result by tuning the SVC controls to resolve the oscillatory response, but it is not
desirable to rely on a complicated coordination of many power electronic controls. Furthermore, the
necessary tuning would likely require a reduction in the SVC response time which would defeat one
of the primary advantages in selecting an SVC. Thus, the SVC option does not appear to be
appropriate for the purpose of system strength enhancement. The same conclusion applies to
STATCOMs since STATCOMs also do not address the system strength issue.

Panhandle Renewable Energy Zone Study ERCOT Public
© 2014 Electric Reliability Council of Texas, Inc. All rights reserved. 10
The use of VFTs appears to be a viable alternative to synchronous condensers. However, the
contribution of the VFT is dependent on the strength and appropriate modeling of the adjacent SPP
system and additional analysis is recommended to assess the impact of variations in the SPP
equivalent model.
Based on the results in Table 2-2, synchronous condenser was determined to be the best transmission
upgrade option to provide system strength enhancement in this PREZ study. It should be noted that additional
study may be required to address the potential susceptibility of synchronous condensers to Subsynchronous
Resonance (SSR) issues when the proposed synchronous condenser is close to the series compensated
transmission lines.
2.4.4. Optimal Locations for System Strength Enhancement
The effect of weak system strength on the WPP voltage control performance can be best demonstrated
with a recent event in ERCOT. An existing wind power plant (WPP) connected to a weak system in ERCOT
experienced undesirable poorly damped and un-damped voltage oscillations under weak grid conditions [14].
The WPP is connected to the ERCOT grid through two transmission lines. When one line was taken out of
service, the WPP experienced poorly damped or un-damped voltage oscillations, which were recorded by
Phasor Measurement Units (PMUs). The investigation of the event showed that the key cause for the
oscillatory response was the plant level voltage control of the WPP was not suitable for a weak grid condition.
The calculated SCR at POI after losing one line is less than two. The event was simulated with the WPP
represented with a detailed dynamic model to re-create the oscillatory response; simulation results are
presented in Figure 2-3. The voltage oscillation is effectively damped when modeling system strength
improvements that increase the SCR as shown in the purple color curve. Tuning the voltage controller gains
based on the lower SCR value also improved the oscillatory response as shown in the green color curve.
Figure 2-3 Voltage Response at WPP’s Point of Interconnection
This actual experience demonstrates potential operational challenges and resolutions for a WPP to operate
reliably under low SCR conditions. Considering the Panhandle system characteristics, as stated in section

Panhandle Renewable Energy Zone Study ERCOT Public
© 2014 Electric Reliability Council of Texas, Inc. All rights reserved. 11
2.4.2, the WSCR is a more appropriate quantity to represent the Panhandle system strength. Based on the
operational experience for the past several years and the information received from various wind turbine
manufactures, a WSCR value of 1.5 is proposed to provide a reasonable minimum level of system strength for
reliable WPP operation. A step-by-step procedure, as shown in Figure 2-4, is proposed to determine the
optimal synchronous condenser ratings and locations to meet the WSCR requirements. The process starts with
adding a step size of synchronous condenser at a candidate location and calculating the WSCR. After all
candidate locations are tested, the synchronous condenser installation resulting in the best WSCR is obtained.
The process is repeated until the WSCR meets the requirement.
It must be recognized that the synchronous condenser rating and location obtained with this procedure is
based on the assumption of full interaction between wind plants. It ensures the required minimum system
strength for the worst scenario and provides some stability margin. To determine the synchronous
compensation level and locations that meet dynamic response criteria, dynamic simulation with detailed
dynamic models of all participating devices is recommended.
Figure 2-4 Process to Identify Synchronous Condenser Rating/Location

Panhandle Renewable Energy Zone Study ERCOT Public
© 2014 Electric Reliability Council of Texas, Inc. All rights reserved. 12
3. STUDY RESULTS and KEY FINDINGS
3.1. Steady State Voltage Stability Analysis
Static voltage stability analysis in the Panhandle area was performed on the 2016 high wind low load
(HWLL) base case to identify the weak areas in terms of reactive power deficiency and to identify the critical
contingencies limiting power transfer. The study results identify voltage stability margins and serve as a
starting point for developing possible reactive compensation schemes and transmission upgrades. A Power-
Voltage (PV) analysis was performed for the power transfer between the Panhandle and the rest of the ERCOT
system, as shown in Figure 3-1. At each step, the wind generation in the Panhandle area was increased and
conventional generation outside of the Panhandle area was reduced. Contingencies were independently
applied, followed by a power flow solution. The process was repeated for higher power transfer levels until
the base case voltage collapsed under no contingency, or the Panhandle generation reached its maximum
capacity.
Figure 3-1 PV Analysis Scenario for ERCOT Panhandle Region
The following assumptions were used in the PV analysis:
Oklaunion generator was turned off. Without its reactive support, a conservative result for the transfer
limit is expected;
Switched shunt and SVC adjustments were allowed post-contingency;
The reactive power capability for voltage support of the modeled Panhandle wind generation projects
was assumed to meet the voltage support requirement in ERCOT Protocol Section 3.15.;
NERC category B, C, and D contingencies, as well as contingencies defined in SSWG contingency
list, of 100 kV and above in North and West Texas were tested;

Panhandle Renewable Energy Zone Study ERCOT Public
© 2014 Electric Reliability Council of Texas, Inc. All rights reserved. 13
Voltages of 100 kV and above buses in North and West Texas were monitored;
Power flow of 100 kV and above transmission lines in North and West Texas were monitored with the
threshold of 100% of rate B;
Two scenarios were studied. The Mid-Term scenario had 5,043 MW of wind generation resources
modeled in the Panhandle area. The Long-Term scenario had 7,845 MW of wind generation resources
modeled in the Panhandle area. A summary of wind plants modeled in both the Mid-Term and Long-Term
scenarios, as well as the initial build CREZ case in the CREZ Reactive Power Compensation study, are shown
in Table 3-1.
Table 3-1 Panhandle Wind Projects Modeled in the PV Study
Initial Build CREZ(MW) Mid-Term(MW) Long-Term(MW) Windmill+Ogallala 400 1,800 3,552 Rest of Panhandle 2,000 3,243 4,293
TOTAL 2,400 5,043 7,845
3.1.1. 2016 HWLL Base Case
As shown in Figure 1-2, the reactive equipment necessary to support the export of power from the
Panhandle was implemented for 2,400 MW. A PV study was performed on the 2016 HWLL base case to
identify the critical contingencies without any additional system upgrades in the Panhandle region. The PV
analysis results are reported in Table 3-2. The limiting event is a breaker failure event, which is a NERC
category C contingency. The event trips two transmission lines and causes voltage collapse in the Panhandle
region.
Table 3-2 PV Analysis Result of 2016 HWLL Base Case
Limiting Contingency Contingency Description NERC
Category Violation
1 Breaker Failure Event C Voltage Collapse
2 Single Circuit B Voltage Collapse
3 Double Circuit C Voltage Collapse
4 Double Circuit C Voltage Collapse
5 Double Circuit C Voltage Collapse
6
Breaker Failure Event C
Voltage Collapse
7 Single Circuit B Voltage Collapse

Panhandle Renewable Energy Zone Study ERCOT Public
© 2014 Electric Reliability Council of Texas, Inc. All rights reserved. 14
The PV curves of selected Panhandle 345 kV buses under the most limiting output of 3,620 MW are
shown in Figure 3-2. The most significant observation from Figure 3-2 is that the voltage collapse occurred at
a relatively high voltage level. The commonly accepted normal operating voltage range is from 0.95 to 1.05
p.u., but all bus voltages were higher than 0.96 p.u. at the collapse points of the PV curves. The reason the
voltage collapse occurred at such a high voltage level is that the CREZ system is essentially a weak system that
is highly compensated with switch shunts and SVCs. These reactive compensation devices kept the voltage
high while the power transfer level approached the steady state voltage stability limit.
Since the Panhandle region is remote from synchronous generators, the voltage level at the collapse point
indicates that more transmission lines are required to achieve higher transfer limits (rather than additional
reactive compensation). Continuing to add reactive compensation resources has a minimal effect with respect
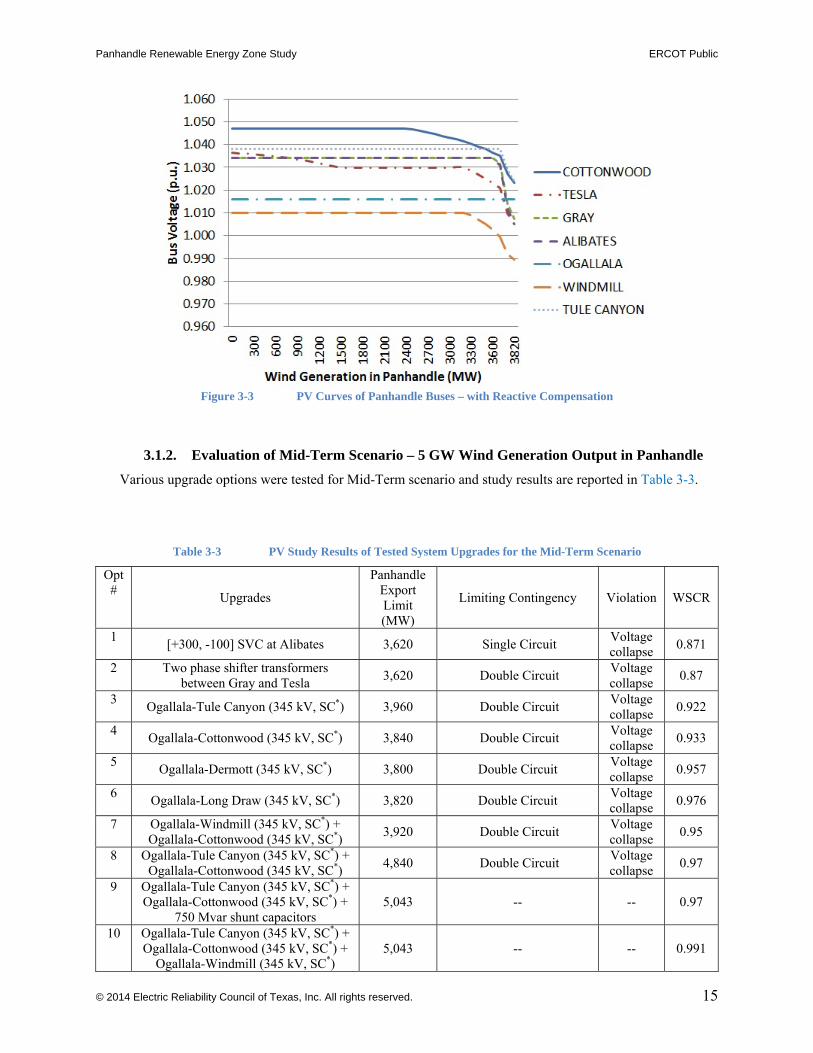
to increasing transfer limits and results in even higher voltage levels at the collapse point. This conclusion was
verified by another PV analysis performed on a case with 600 Mvar of shunt capacitors added in the Panhandle
area. As shown in Figure 3-3, after adding more shunt compensation, the transfer limit was increased only by
200 MW (from 3.6 GW to 3.8 GW), and the voltage level at the collapse point was around 1.0 p.u. Based on
this observation, several system transmission upgrades were proposed for the Mid-Term and Long-Term
scenarios. The test results for these upgrades are shown in the following sections.
Figure 3-2 PV Curves of Panhandle Buses – Base Case
Panhandle Renewable Energy Zone Study ERCOT Public
© 2014 Electric Reliability Council of Texas, Inc. All rights reserved. 15
Figure 3-3 PV Curves of Panhandle Buses – with Reactive Compensation
3.1.2. Evaluation of Mid-Term Scenario – 5 GW Wind Generation Output in Panhandle
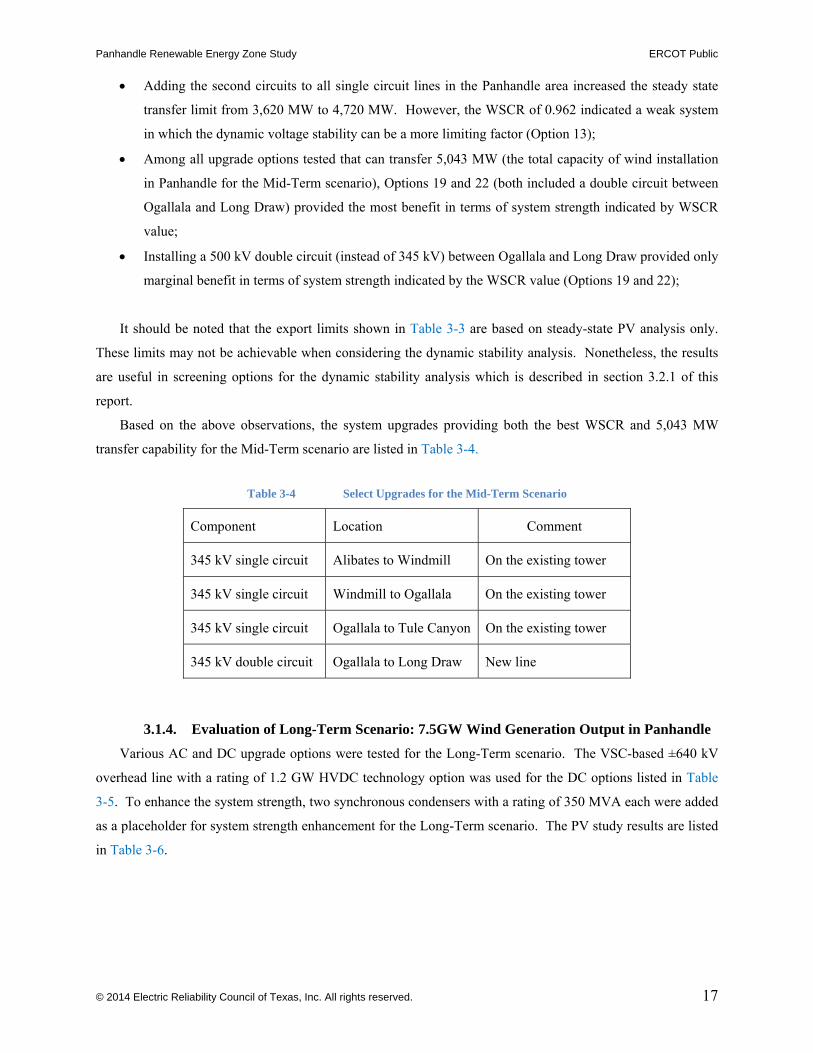
Various upgrade options were tested for Mid-Term scenario and study results are reported in Table 3-3.
Table 3-3 PV Study Results of Tested System Upgrades for the Mid-Term Scenario
Opt #
Upgrades
Panhandle Export Limit (MW)
Limiting Contingency Violation WSCR
1 [+300, -100] SVC at Alibates 3,620 Single Circuit
Voltage collapse
0.871
2 Two phase shifter transformers between Gray and Tesla
3,620 Double Circuit Voltage collapse
0.87
3 Ogallala-Tule Canyon (345 kV, SC*) 3,960 Double Circuit
Voltage collapse
0.922
4 Ogallala-Cottonwood (345 kV, SC*) 3,840 Double Circuit
Voltage collapse
0.933
5 Ogallala-Dermott (345 kV, SC*) 3,800 Double Circuit
Voltage collapse
0.957
6 Ogallala-Long Draw (345 kV, SC*) 3,820 Double Circuit
Voltage collapse
0.976
7 Ogallala-Windmill (345 kV, SC*) + Ogallala-Cottonwood (345 kV, SC*)
3,920 Double Circuit Voltage collapse
0.95
8 Ogallala-Tule Canyon (345 kV, SC*) + Ogallala-Cottonwood (345 kV, SC*)
4,840 Double Circuit Voltage collapse
0.97
9 Ogallala-Tule Canyon (345 kV, SC*) + Ogallala-Cottonwood (345 kV, SC*) +
750 Mvar shunt capacitors 5,043 -- -- 0.97
10 Ogallala-Tule Canyon (345 kV, SC*) + Ogallala-Cottonwood (345 kV, SC*) +
Ogallala-Windmill (345 kV, SC*) 5,043 -- -- 0.991

Panhandle Renewable Energy Zone Study ERCOT Public
© 2014 Electric Reliability Council of Texas, Inc. All rights reserved. 16
11 Ogallala-Tule Canyon (345 kV, SC*) + Ogallala-Cottonwood (345 kV, SC*) +
Ogallala-Dermott (345 kV, SC*) 5,043 -- -- 1.036
12 Ogallala-Tule Canyon (345 kV, SC*) + Ogallala-Cottonwood (345 kV, SC*) +
Ogallala-Long Draw (345 kV, SC*) 5,043 -- -- 1.057
13 Ogallala-Tule Canyon (345 kV, SC*) + Ogallala-Windmill (345 kV, SC*) + Alibates-Windmill (345 kV, SC*)
4,720 Double Circuit Voltage collapse
0.962
14 Ogallala-Tule Canyon (345 kV, SC*) + Ogallala-Windmill (345 kV, SC*) + Alibates-Windmill (345 kV, SC*) + Ogallala-Cottonwood (345 kV, SC*)
5,043 -- -- 1.016
15 Ogallala-Tule Canyon (345 kV, SC*) + Ogallala-Windmill (345 kV, SC*) + Alibates-Windmill (345 kV, SC*) +
Ogallala-Cottonwood (345 kV, DB**)
5,043 -- -- 1.052
16 Ogallala-Tule Canyon (345 kV, SC*) + Ogallala-Windmill (345 kV, SC*) + Alibates-Windmill (345 kV, SC*) +
Ogallala-Dermott (345 kV, SC*)
5,043 -- -- 1.048
17 Ogallala-Tule Canyon (345 kV, SC*) + Ogallala-Windmill (345 kV, SC*) + Alibates-Windmill (345 kV, SC*) + Ogallala-Dermott (345 kV, DB**)
5,043 -- -- 1.115
18 Ogallala-Tule Canyon (345 kV, SC*) + Ogallala-Windmill (345 kV, SC*) + Alibates-Windmill (345 kV, SC*) + Ogallala-Long Draw (345 kV, SC*)
5,043 -- -- 1.07
19 Ogallala-Tule Canyon (345 kV, SC*) + Ogallala-Windmill (345 kV, SC*) + Alibates-Windmill (345 kV, SC*) + Ogallala-Long Draw (345 kV, DB**)
5,043 -- -- 1.145
20 Ogallala-Tule Canyon (345 kV, SC*) + Ogallala-Windmill (345 kV, SC*) + Alibates-Windmill (345 kV, SC*) +
Gray-Riley (345 kV, SC*)
4,820 Single Circuit Overload 1.025
5,043 -- --
21 Ogallala-Tule Canyon (345 kV, SC*) + Ogallala-Windmill (345 kV, SC*) + Alibates-Windmill (345 kV, SC*) +
Gray-Riley (345 kV, DB**)
4,720 Single Circuit Overload 1.075
5,043 -- --
22 Ogallala-Tule Canyon (345 kV, SC*) + Ogallala-Windmill (345 kV, SC*) + Alibates-Windmill (345 kV, SC*) + Ogallala-Long Draw (500 kV, DB**)
5,043 -- -- 1.194
* : SC - single circuit ** : DB - double circuit
3.1.3. Key Findings of Mid-Term Scenario
Some key observations from Table 3-3 are:
Adding more SVCs in the Panhandle area didn’t increase the transfer limit (Option 1);
Adding a phase shifter transformer didn’t increase the transfer limit (Option 2);
Panhandle Renewable Energy Zone Study ERCOT Public
© 2014 Electric Reliability Council of Texas, Inc. All rights reserved. 17
Adding the second circuits to all single circuit lines in the Panhandle area increased the steady state
transfer limit from 3,620 MW to 4,720 MW. However, the WSCR of 0.962 indicated a weak system
in which the dynamic voltage stability can be a more limiting factor (Option 13);
Among all upgrade options tested that can transfer 5,043 MW (the total capacity of wind installation
in Panhandle for the Mid-Term scenario), Options 19 and 22 (both included a double circuit between
Ogallala and Long Draw) provided the most benefit in terms of system strength indicated by WSCR
value;
Installing a 500 kV double circuit (instead of 345 kV) between Ogallala and Long Draw provided only
marginal benefit in terms of system strength indicated by the WSCR value (Options 19 and 22);
It should be noted that the export limits shown in Table 3-3 are based on steady-state PV analysis only.
These limits may not be achievable when considering the dynamic stability analysis. Nonetheless, the results
are useful in screening options for the dynamic stability analysis which is described in section 3.2.1 of this
report.
Based on the above observations, the system upgrades providing both the best WSCR and 5,043 MW
transfer capability for the Mid-Term scenario are listed in Table 3-4.
Table 3-4 Select Upgrades for the Mid-Term Scenario
Component Location Comment
345 kV single circuit Alibates to Windmill On the existing tower
345 kV single circuit Windmill to Ogallala On the existing tower
345 kV single circuit Ogallala to Tule Canyon On the existing tower
345 kV double circuit Ogallala to Long Draw New line
3.1.4. Evaluation of Long-Term Scenario: 7.5GW Wind Generation Output in Panhandle
Various AC and DC upgrade options were tested for the Long-Term scenario. The VSC-based ±640 kV
overhead line with a rating of 1.2 GW HVDC technology option was used for the DC options listed in Table
3-5. To enhance the system strength, two synchronous condensers with a rating of 350 MVA each were added
as a placeholder for system strength enhancement for the Long-Term scenario. The PV study results are listed
in Table 3-6.
Panhandle Renewable Energy Zone Study ERCOT Public
© 2014 Electric Reliability Council of Texas, Inc. All rights reserved. 18
Table 3-5 Tested VSC-Based HVDC Upgrade Options for the Long-Term Scenario
Index VSC-based HVDC upgrades DC1 Windmill – W. Shackelford (single VSC converter pair, single HVDC line) DC2 Windmill – W. Shackelford (double VSC converter pairs, double HVDC lines) DC3 Windmill – Graham (single VSC converter pair, single HVDC line) DC4 Windmill – Graham (double VSC converter pairs, double HVDC lines) DC5 Gray - Graham (single VSC converter pair, single HVDC line) DC6 Gray - Graham (single VSC converter pair, single HVDC line) +
Windmill – W. Shackelford (single VSC converter pair, single HVDC line) DC7 Windmill – Zenith (single VSC converter pair, single HVDC line) DC8 Windmill – WAP (single VSC converter pair, single HVDC line) DC9 Windmill – WAP (double VSC converter pairs, double HVDC lines) DC10 Gray - Graham (single VSC converter pair, single HVDC line) +
Windmill – Zenith (single VSC converter pair, single HVDC line) DC11 Gray - Zenith (single VSC converter pair, single HVDC line) +
Windmill – WAP (single VSC converter pair, single HVDC line)
Table 3-6 PV Study Results of Tested System Upgrades for the Long-Term Scenario
Opt #
Upgrades
Panhandle Export Limit (MW)
Limiting Contingency Violation WSCR
1 Mid-Term Upgrades* + Windmill–Cottonwood(345 kV, DB***)
6,820 (DB) Voltage collapse
0.967
2 Mid-Term Upgrades + Windmill–Cottonwood-W. Shaceklford(345 kV, DB)
7,640 (DB) Voltage collapse
1.008
3 Mid-Term Upgrades +
Windmill–Edith Clarke(345 kV, DB)
5,820 (SC) Overload 0.931
6,820 (DB) Voltage collapse
4 Mid-Term Upgrades + Gray–Riley (345 kV, DB)
6,840 (DB) Voltage collapse
1.009
5 Mid-Term Upgrades + Windmill–Cottonwood(345 kV, DB) +
Gray–Riley (345 kV, DB) 7,540 (DB)
Voltage collapse
1.045
6 Mid-Term Upgrades + Windmill–Edith Clarke-Graham(345
kV, DB) 7,320 (DB)
Voltage collapse
1.001
7 Mid-Term Upgrades + Windmill–Edith Clarke-Graham (345
kV, DB) + Gray-Riley (345 kV, DB)
6,840 (SC) Overload
1.077 7,840 -- --
8 Mid-Term Upgrades + Windmill–Tule Canyon-W. Shackelford
(345 kV, DB) 7,120 (DB)
Voltage collapse
1.037
9 Mid-Term Upgrades + Gray-Riley (345 kV, DB) +
Windmill–Tule Canyon- W. Shackelford (345 kV, DB)
7,800 (DB) Voltage collapse
1.063
10 Mid-Term Upgrades + Gray- Edith Clarke (345 kV, DB) +
Windmill–Tule Canyon- W. Shackelford (345 kV, DB)
7,720 (DB) Voltage collapse
1.089

Panhandle Renewable Energy Zone Study ERCOT Public
© 2014 Electric Reliability Council of Texas, Inc. All rights reserved. 19
11 Mid-Term Upgrades + Gray- Edith Clarke-Graham (345 kV,
DB) + Windmill–Tule Canyon- W. Shackelford
(345 kV, DB)
7,840 -- -- 1.139
12 Mid-Term Upgrades + Windmill–Cottonwood- W. Shackelford
(345 kV, DB) + Gray-Riley (345 kV, DB)
5,840 (SC) Overload
1.093 7,540 (DB) Overload
13 Mid-Term Upgrades +
Windmill– Edith Clarke (345 kV, DB) + Gray-Riley(345 kV, DB)
5,300 (SC) Overload
1.063 6,200 (DB) Overload
7,560 (DB) Voltage collapse
14 Mid-Term Upgrades + Windmill–Cottonwood- W. Shackelford
(345 kV, DB) + Gray- EDITHCLA (345 kV, DB)
6,480 (SC) Overload
1.066 7,840 (DB)
Voltage collapse
15 Mid-Term Upgrades + Windmill–Cottonwood- W. Shackelford
(345 kV, DB) + Gray- Edith Clarke-Graham (345 kV,
DB)
7,840 -- -- 1.107
16 Partial Mid-Term Upgrades **+
Ogallala-Long Draw (500 kV, DB) + Gray-Riley (500 kV, DB)
5,420 (SC) Overload
1.045 6,120 (DB) Overload
7,440 (DB) Voltage collapse
17 Partial Mid-Term Upgrades +
Ogallala-Long Draw (500 kV, DB) + Windmill- Edith Clarke (500 kV, DB)
6,020 (SC) Overload
1.029 6,340 (DB) Overload
7,080 (DB) Voltage collapse
18 Partial Mid-Term Upgrades + Ogallala-Long Draw (500 kV, DB) +
Windmill- Cottonwood- W. Shackelford (500 kV, DB)
7,020 (DB) Overload
1.054 7,740 (DB)
Voltage collapse
19 Partial Mid-Term Upgrades + Ogallala-Long Draw (500 kV, DB) +
Gray-Riley (500 kV, DB) + Windmill- EDITHCLA (500 kV, DB)
5,380 (SC) Overload
1.117 5,880 (DB) Overload
20 Partial Mid-Term Upgrades + Ogallala-Long Draw (500 kV, DB) +
Gray-Riley (500 kV, DB) + Windmill- Cottonwood- W. Shackelford
(500 kV, DB)
6,120 (SC) Overload
1.145 7,120 (DB) Overload
7,320 (DB) Overload
21 Mid-Term Upgrades +
DC1****
6,760 (SC) Overload 0.93
7,060 (SC) Voltage collapse
22 Mid-Term Upgrades +
DC2
6,580 (DB) Voltage collapse
0.93 7,380 (SC) Overload
23 Mid-Term Upgrades +
DC3
5,420 (DB) Overload 0.93
7,020 (SC) Voltage collapse

Panhandle Renewable Energy Zone Study ERCOT Public
© 2014 Electric Reliability Council of Texas, Inc. All rights reserved. 20
24 Mid-Term Upgrades +
DC4
5,460 (DB) Overload 0.93
7,060 (DB) Voltage collapse
25 Mid-Term Upgrades +
DC5
5,440 (DB) Overload 0.93
7,040 (SB) Voltage collapse
26 Mid-Term Upgrades +
DC6
6,280 (DB) Overload 0.93
6,900 (DB) Voltage collapse
27 Mid-Term Upgrades +
DC7
6,860 (SC) Voltage collapse
0.93 7,160 (SC) Overload
28 Mid-Term Upgrades +
DC8
6,860 (SC) Voltage collapse
0.93 7,160 (SC) Overload
29 Mid-Term Upgrades + DC9
6,660 (DB) Voltage collapse
0.93
30 Mid-Term Upgrades +
DC10
6,660 (DB) Overload 0.93
6,860 (DB) Voltage collapse
31 Mid-Term Upgrades +
DC11
6,780 (DB) Voltage collapse
0.93 7,780 (SC) Overload
* All the upgrades included in Table 3-4 ** Without Ogallala-Long Draw 345 kV double circuit in Table 3-4 *** SC: single circuit, DB: double circuit **** DC upgrades are defined in Table 3-5
3.1.5. Key Findings of Long-Term Scenario
Some key observations from Table 3-6 are:
Overload violations outside of the Panhandle may constrain the Panhandle export during high wind
generation output conditions in Panhandle before reaching voltage stability limit;
To achieve a transfer capacity larger than 7.2 GW, at least two new double circuit lines are needed in
addition to the Mid-Term upgrades;
Because of the power flow carried by the HVDC lines (in options with an HVDC line), contingencies
of the HVDC lines become the critical contingency that lead to a potential voltage collapse.
It should be noted that the export limits shown in Table 3-6 are based on steady-state PV analysis only.
These limits may not be achievable when considering the dynamic stability analysis. Nonetheless, the results
are useful in screening options for the dynamic stability analysis which is described in section 3.2.3 of this
report.
Panhandle Renewable Energy Zone Study ERCOT Public
© 2014 Electric Reliability Council of Texas, Inc. All rights reserved. 21
3.2. Dynamic Analysis
3.2.1. Evaluation of Mid-Term Scenario - (5.04 GW Capacity at 95% Output in Panhandle)
Numerous dynamic contingency simulations were run to test options for accommodating Mid-Term wind
output from the Panhandle. Options were initially tested with contingencies in the immediate Panhandle area.
Options that passed this initial test were further investigated with more comprehensive contingency sets that
included breaker failure events and faults throughout the West Texas system. The electrical characteristics of
the upgrade options are listed in the Appendix 6.1. A summary of simulation results for a selected set of tested
upgrade options is provided in Table 3-7.
Table 3-7 Dynamic Simulation Results for the Mid-Term Scenario
Case Upgrade Description Results 1 Ogallala-Tule Canyon 345 kV Circuit
Ogallala-Cottonwood 345 kV Circuit Ogallala-Long Draw 345 kV Circuit
Unacceptable
2 Synchronous Condenser (350 MVA) at Ogallala Synchronous Condenser (350 MVA) at Windmill
Unacceptable
3 Synchronous Condenser (350 MVA) at Alibates Synchronous Condenser (350 MVA) at Tule Canyon
Unacceptable
4 Ogallala-Tule Canyon 345 kV Circuit Ogallala-Cottonwood 345 kV Circuit Synchronous Condenser (350 MVA) at Alibates Synchronous Condenser (350 MVA) at Tule Canyon
Unacceptable
5 Ogallala-Tule Canyon 345 kV Circuit Ogallala-Cottonwood 345 kV Circuit Ogallala-Long Draw 345 kV Circuit Synchronous Condenser (350 MVA) at Alibates Synchronous Condenser (350 MVA) at Tule Canyon
Unacceptable
6 Ogallala-Tule Canyon 345 kV Circuit Ogallala-Cottonwood 345 kV Circuit Synchronous Condenser (350 MVA) at Ogallala Synchronous Condenser (350 MVA) at Windmill
Unacceptable
7 Ogallala-Tule Canyon 345 kV Circuit Ogallala-Cottonwood 345 kV Circuit Ogallala-Long Draw 345 kV Circuit Synchronous Condenser (350 MVA) at Ogallala Synchronous Condenser (350 MVA) at Windmill
Acceptable
8 Alibates-Windmill 345 kV Circuit Windmill-Ogallala 345 kV Circuit Ogallala-Tule Canyon 345 kV Circuit Ogallala-Long Draw 345 kV Double Circuit
Acceptable
9 Alibates-Windmill 345 kV Circuit Windmill-Ogallala 345 kV Circuit Ogallala-Tule Canyon 345 kV Circuit Ogallala-Long Draw 345 kV Double Circuit Synchronous Condenser (350 MVA) at Ogallala Synchronous Condenser (350 MVA) at Windmill
Acceptable

Panhandle Renewable Energy Zone Study ERCOT Public
© 2014 Electric Reliability Council of Texas, Inc. All rights reserved. 22
3.2.2. Key Findings of Mid-Term Scenario Dynamic Stability Analysis
3.2.2.1. Overvoltage Trip
All of the Panhandle wind generation resources modeled in the study case were based on the actual
projects undergoing generation interconnection study, with some projects having less HVRT capability
compared to others. The Panhandle grid is remote from synchronous generators and load centers and is
considered a weak grid when integrating a large amount of wind generation. A byproduct of this weak grid
condition is observed in the simulation results reported in Table 3-7 where wind plants were tripped by
overvoltage protection relays. An excessive amount of such tripping can lead to a potential cascading
overvoltage collapse as shown in Figure 3-4.
Figure 3-4 Cascading High Voltage Collapse in Panhandle
Reasons for such a collapse caused by overvoltage include:
Extremely weak system as indicated by low SCR. Under weak grid conditions, the sensitivity of
dV/dQ is high, which means the same amount of reactive support results in larger voltage deviation;
Aggressive voltage control settings of wind generators. The low short circuit level seen by the voltage
controllers of wind generators results in a faster response compared to a stronger grid with high SCR.
Many wind generation plants retain high reactive output levels upon fault clearance;
Upon fault clearance, most wind generation plants do not immediately restore their MW outputs to
pre-fault levels. The reduced power flows lead to reduced reactive losses and overvoltages due to
excessive line charging;
For the above reasons, the system experiences significant overvoltage upon fault clearance. Wind
generation plants lacking sufficient high voltage ride through capabilities would be taken out of
service by their overvoltage protection relays;
The tripping of wind generation plants due to overvoltage further reduced MW flows on the
transmission lines, which consequently cause even higher overvoltage due to reduced reactive losses
and excessive line charging;
Panhandle Renewable Energy Zone Study ERCOT Public
© 2014 Electric Reliability Council of Texas, Inc. All rights reserved. 23
The wind generation plants continued to trip due to overvoltage until the whole area collapses as the
consequence of overvoltage cascading.
In case 9, all the Panhandle wind projects were modified to meet the proposed HVRT capability and a
lesser amount of wind generation projects (less than 1000 MW) were tripped by overvoltage. Those
overvoltage trips were caused by the weak system conditions. Overvoltage tripping can be minimized through
the combination of system strength enhancement and better HVRT capability of wind generation projects. The
collapse caused by overvoltage cascading presents a significant reliability risk and suggests a need for wind
generation projects to comply with the HVRT requirement shown in Figure 3-5 as proposed in NOGRR 124
[14].
Figure 3-5 Proposed Voltage Ride Through Capability for Wind Generation Resources
3.2.2.2. Upgrade Needs
Based on the results in Table 3-7, Ogallala and Windmill appeared to be better locations for synchronous
condenser installations than Alibates and Tule Canyon. Effective solutions for accommodating Mid-Term
Panhandle wind output required additional transmission lines. Tested options that included only synchronous
condensers were unacceptable.
Case 9 in Table 3-7 is the preferred upgrade option based on the following benefits over other tested cases:
Add a second 345 kV circuit from Alibates to Windmill, from Windmill to Ogallala, and from
Ogallala to Tule Canyon (which are already built to accommodate the installation of a second circuit
and would not require any new right-of-way acquisitions);
Add a new 345 kV double circuit from Ogallala to Long Draw (which is superior to other new line
options based on PV analysis results and the effect on SCR).
Results indicate that the installation of synchronous condensers is not absolutely required in conjunction
with the preferred option based solely on dynamic simulation results. As discussed in section 2.4.2,
synchronous condensers are needed to address system strength issues and achieve specific SCR targets.
Panhandle Renewable Energy Zone Study ERCOT Public
© 2014 Electric Reliability Council of Texas, Inc. All rights reserved. 24
Additionally, the amount of observed wind trips was generally reduced when synchronous condensers were
included in simulations for additional voltage support to reduce the voltage overshoot.
3.2.3. Evaluation of Long-Term Scenario - (7.8 GW Capacity at 95% Output in Panhandle)
Dynamic contingency simulations were run to test options for accommodating Long-Term wind output
from the Panhandle. Based on the findings in the Mid-Term scenario regarding the need for HVRT capability,
it was assumed that Panhandle wind resources complied with the high voltage ride through requirements as
proposed in NOGRR124 in the Long-Term scenario. A summary of simulation results for a selected set of
tested upgrade options is reported in Table 3-8.
Table 3-8 Dynamic Simulation Results for the Long-Term Scenario
Case Upgrade Description Results 0 Base:
Alibates-Windmill 345 kV Circuit Windmill-Ogallala 345 kV Circuit Ogallala-Tule Canyon 345 kV Circuit Ogallala-Long Draw 345 kV Double Circuit Synchronous Condenser (350 MVA) at Ogallala Synchronous Condenser (350 MVA) at Windmill
Unacceptable
1 Base + Gray-Riley 345 kV Double Circuit Windmill-Edith Clarke 345 kV Double Circuit
Acceptable
2 Base + Gray-Riley 345 kV Double Circuit Windmill-Edith Clarke 345 kV Double Circuit Edith Clarke-Graham 345 kV Double Circuit
Acceptable
3 Base + Gray-Riley 345 kV Double Circuit Edith Clarke-Graham 345 kV Double Circuit
Unacceptable
4 Base + Gray-Riley 345 kV Double Circuit Edith Clarke-Graham 345 kV Double Circuit Cottonwood-W. Shackelford 345 kV Double Circuit
Unacceptable
5 Base + Gray-Riley 345 kV Double Circuit Edith Clarke-Graham 345 kV Double Circuit Windmill-Cottonwood 345 kV Double Circuit Cottonwood-W. Shackelford 345 kV Double Circuit
Acceptable
6 Base + Gray-Edith Clarke 345 kV Double Circuit Edith Clarke-Graham 345 kV Double Circuit Windmill-Cottonwood 345 kV Double Circuit Cottonwood-W. Shackelford 345 kV Double Circuit
Unacceptable
7 Base (without synchronous condensers) + Gray-Riley 345 kV Double Circuit Windmill-Edith Clarke 345 kV Double Circuit
Unacceptable
8 Base (without synchronous condensers) + Gray-Riley 345 kV Double Circuit Windmill-Edith Clarke 345 kV Double Circuit Ogallala-Cottonwood 345 kV Double Circuit Cottonwood-W. Shackelford 345 kV Double Circuit
Unacceptable
Panhandle Renewable Energy Zone Study ERCOT Public
© 2014 Electric Reliability Council of Texas, Inc. All rights reserved. 25
3.2.4. Key Findings of Long-Term Scenario
3.2.4.1. Frequency Protection Trip
In the Long-Term scenario, wind resources tripped by frequency protection relays were observed under
various simulations. This is generally considered to be an anomaly due to the simulation software (PSS/e)
methodology for calculating bus frequencies. PSS/e calculates frequency at each bus independently by taking
the instantaneous rate of change of angle and placing it through a filter time constant. On a few rare instances
where the system is very weak, the filter constant may require adjustment to avoid numerical instability. Such
frequency protection tripping was not observed in the scenarios with less Panhandle wind generation output,
such as the Mid-Term scenario. Thus, observation of such frequency trips may indicate a need for system
strength enhancement, especially when such frequency trips can result in an overvoltage cascading event.
3.2.4.2. Upgrade Needs
Based on the results presented in Table 3-8, the installation of two 345 kV double circuits are required in
addition to the assumed base upgrades to achieve acceptable simulation results with Long-Term Panhandle
wind output. Cases 7 and 8 in Table 3-8 indicate that synchronous condenser installations are required to
achieve acceptable simulation results. Upgrade options (in addition to those proposed in Case 1) tested
include:
Adding a 345 kV double circuit from Edith Clarke to Graham (Case 2);
Adding 150 MVA SVCs at Bluff Creek, Sam Switch, and Navarro;
Adding a Riley-Hicks 500 kV circuit;
Adding a Riley-Carrolton 500 kV circuit;
Modeling the proposed Ogallala-Long Draw, Gray-Riley and Windmill-Edith Clarke lines as 500 kV
double circuits.
None of these upgrades appeared to provide a significant improvement with respect to dynamic
performance. It is important to note that system constraints outside the Panhandle region that can potentially
limit the Panhandle export in the Long-Term scenario were observed. Further testing and discussions are
included in section 3.2.4.3. Two preferred upgrade options are identified for the Long-Term scenario.
Option A:
o Add a new 345 kV double circuit from Gray to Riley
o Add a new 345 kV double circuit from Windmill to Edith Clarke
o Additional synchronous condensers and reactors for system strength enhancement and steady state high voltage management
Option B:
o Add a new 345 kV double circuit from Gray to Riley
o Add a new 345 kV double circuit from Windmill to Cottonwood and from Cottonwood to West Shackelford
Panhandle Renewable Energy Zone Study ERCOT Public
© 2014 Electric Reliability Council of Texas, Inc. All rights reserved. 26
o Additional synchronous condensers and reactors for system strength enhancement and steady state high voltage management
3.2.4.3. Constraints in the Rest of ERCOT System
In the Long-Term scenario, additional system adjustments including de-committing conventional units
were made for system power balance. Depending on the location of de-committed conventional units, the
voltage support could become insufficient to maintain adequate voltage support for high power transfer from
the Panhandle to load centers. Such voltage stability challenges do not necessarily affect the Panhandle export
capability, but limits the total power that can be transferred to the load centers. Additional study would be
required to fully resolve issues associated with elements that are remote from the Panhandle.
3.3. Economic Cost Analysis and Roadmap Development
According to the definition of Reliability-Driven and Economic-Driven Projects in the ERCOT Planning
Guide section 3.1.3.1 [16], the upgrade needs identified in the PREZ study to accommodate wind generation
projects are considered Economic-Driven Projects since wind generation plants are expected to be re-
dispatched to meet reliability criteria.
To determine the societal benefit of a proposed project, the revenue requirement of the capital cost of the
project is compared to the expected savings in system production costs resulting from the project over the
expected life of the project. In the PREZ study, ERCOT performed the economic cost analysis using UPLAN
to calculate the ERCOT-wide annual production cost savings for year 2017 and compared it to the first year
annual revenue requirement of the transmission project. If the production cost saving equaled or exceeded the
first year annual revenue requirement for the project, the project was considered economic from a societal
perspective and was recommended. Where congestion was identified in the economic cost analysis, projects
were tested by comparing the simulation results for models with and without the projects. In this study, it was
assumed that the first year annual revenue requirement for the transmission project is approximately one sixth
(1/6) of the total transmission project cost.
The study results in the Mid-Term and Long-Term scenarios provided a reference to develop the roadmap
of upgrade needs in the Panhandle. Sets of transmission upgrade projects were tested in reliability analysis and
using the WSCR criterion to determine the incremental export capability they delivered. The production cost
benefit of the additional export capability was then calculated using UPLAN for various levels of wind
generation capacity in the Panhandle and compared against the estimated capital cost of the project set.
An iterative process was performed to develop the roadmap with trigger points in terms of Panhandle wind
generation capacity. The proposed roadmap includes four stages of Panhandle transmission upgrades to
ultimately accommodate a total of 7.5 GW wind generation output in the Panhandle. The reliability and
economic cost analysis results for each stage are described in the following sections. It should be noted that all
of the upgrades proposed in this report are based on the wind generation projects modeled in the study cases.
As of 2013, there were no projects implemented in the Panhandle, and the upgrades may need to be revised
based on the actual implementation of wind generation projects.
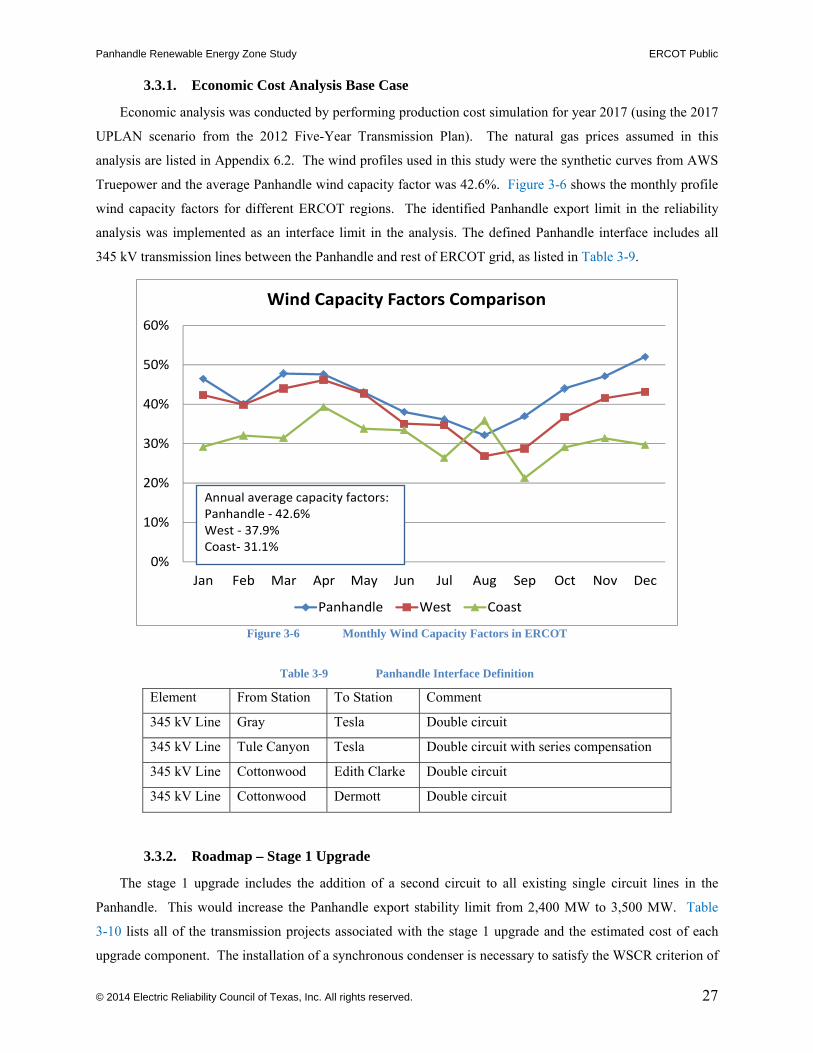
Panhandle Renewable Energy Zone Study ERCOT Public
© 2014 Electric Reliability Council of Texas, Inc. All rights reserved. 27
3.3.1. Economic Cost Analysis Base Case
Economic analysis was conducted by performing production cost simulation for year 2017 (using the 2017
UPLAN scenario from the 2012 Five-Year Transmission Plan). The natural gas prices assumed in this
analysis are listed in Appendix 6.2. The wind profiles used in this study were the synthetic curves from AWS
Truepower and the average Panhandle wind capacity factor was 42.6%. Figure 3-6 shows the monthly profile
wind capacity factors for different ERCOT regions. The identified Panhandle export limit in the reliability
analysis was implemented as an interface limit in the analysis. The defined Panhandle interface includes all
345 kV transmission lines between the Panhandle and rest of ERCOT grid, as listed in Table 3-9.
Figure 3-6 Monthly Wind Capacity Factors in ERCOT
Table 3-9 Panhandle Interface Definition
Element From Station To Station Comment
345 kV Line Gray Tesla Double circuit
345 kV Line Tule Canyon Tesla Double circuit with series compensation
345 kV Line Cottonwood Edith Clarke Double circuit
345 kV Line Cottonwood Dermott Double circuit
3.3.2. Roadmap – Stage 1 Upgrade
The stage 1 upgrade includes the addition of a second circuit to all existing single circuit lines in the
Panhandle. This would increase the Panhandle export stability limit from 2,400 MW to 3,500 MW. Table
3-10 lists all of the transmission projects associated with the stage 1 upgrade and the estimated cost of each
upgrade component. The installation of a synchronous condenser is necessary to satisfy the WSCR criterion of
0%
10%
20%
30%
40%
50%
60%
Jan Feb Mar Apr May Jun Jul Aug Sep Oct Nov Dec
Wind Capacity Factors Comparison
Panhandle West Coast
Annual average capacity factors:Panhandle ‐ 42.6%West ‐ 37.9%Coast‐ 31.1%
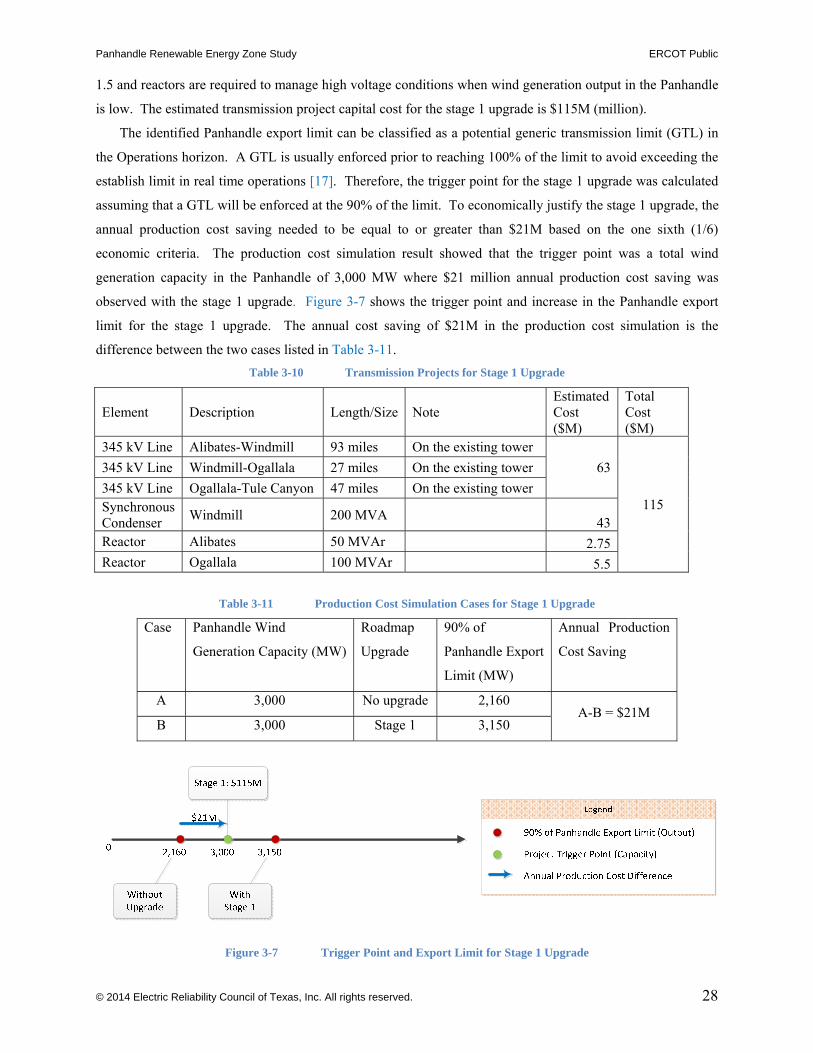
Panhandle Renewable Energy Zone Study ERCOT Public
© 2014 Electric Reliability Council of Texas, Inc. All rights reserved. 28
1.5 and reactors are required to manage high voltage conditions when wind generation output in the Panhandle
is low. The estimated transmission project capital cost for the stage 1 upgrade is $115M (million).
The identified Panhandle export limit can be classified as a potential generic transmission limit (GTL) in
the Operations horizon. A GTL is usually enforced prior to reaching 100% of the limit to avoid exceeding the
establish limit in real time operations [17]. Therefore, the trigger point for the stage 1 upgrade was calculated
assuming that a GTL will be enforced at the 90% of the limit. To economically justify the stage 1 upgrade, the
annual production cost saving needed to be equal to or greater than $21M based on the one sixth (1/6)
economic criteria. The production cost simulation result showed that the trigger point was a total wind
generation capacity in the Panhandle of 3,000 MW where $21 million annual production cost saving was
observed with the stage 1 upgrade. Figure 3-7 shows the trigger point and increase in the Panhandle export
limit for the stage 1 upgrade. The annual cost saving of $21M in the production cost simulation is the
difference between the two cases listed in Table 3-11.
Table 3-10 Transmission Projects for Stage 1 Upgrade
Element Description Length/Size Note Estimated Cost ($M)
Total Cost ($M)
345 kV Line Alibates-Windmill 93 miles On the existing tower
63
115
345 kV Line Windmill-Ogallala 27 miles On the existing tower
345 kV Line Ogallala-Tule Canyon 47 miles On the existing tower Synchronous Condenser
Windmill 200 MVA 43
Reactor Alibates 50 MVAr 2.75 Reactor Ogallala 100 MVAr 5.5
Table 3-11 Production Cost Simulation Cases for Stage 1 Upgrade
Case Panhandle Wind
Generation Capacity (MW)
Roadmap
Upgrade
90% of
Panhandle Export
Limit (MW)
Annual Production
Cost Saving
A 3,000 No upgrade 2,160 A-B = $21M
B 3,000 Stage 1 3,150
Figure 3-7 Trigger Point and Export Limit for Stage 1 Upgrade

Panhandle Renewable Energy Zone Study ERCOT Public
© 2014 Electric Reliability Council of Texas, Inc. All rights reserved. 29
Based on the production cost simulation results, the annual Panhandle wind energy curtailment in case A
was 798 GWh (6.3% of the total Panhandle wind generation in case B). For case B, there is no Panhandle
wind curtailment caused by a Panhandle export limit; with the stage 1 upgrade, all of the 3,000 MW wind
capacity can be exported out of the Panhandle to the load centers.
3.3.2.1. Sensitivity Analysis – Series Compensation
Series compensation reduces the electrical impedance of transmission lines and increases transfer
capability. However, the added series capacitance can potentially result in sub-synchronous resonance for both
conventional and wind generation projects [18]. Based on the current CREZ transmission project
implementation, the design of Rocky Mound series capacitors on the 345 kV double circuits from Clear
Crossing station to Willow Creek station is being reviewed and the implementation date has been postponed.
A sensitivity analysis was performed to evaluate the impact of by-passing the Rocky Mound series capacitors
in the reliability analysis. The study results indicated that it is still acceptable to have a Panhandle export limit
of 3,500 MW with the stage 1 upgrade if the Rocky Mound series capacitors were to be bypassed.
3.3.3. Roadmap – Stage 2 Upgrade
The reliability analysis showed that the stage 2 upgrades would increase the Panhandle export limit from
3,500 MW to 5,200 MW. Table 3-12 lists all the transmission projects associated with the stage 2 upgrade and
the estimated cost of each upgrade component.
Following the process in Figure 2-4, synchronous condensers were specified to meet the WSCR target of
1.5. Reactors were added to manage high voltage conditions when wind generation output in Panhandle is
low. The estimated transmission project capital cost for the stage 2 upgrade is $560M and the Panhandle
export limit is increased to 5,200 MW. Similar to stage 1, the trigger point for the stage 2 upgrade was
calculated assuming that a GTL will be enforced at the 90% of the limit. To economically justify the stage 2
upgrade, the annual production cost saving needs to be equal to or greater than $93.3M based on the one sixth
(1/6) economic criteria. The production cost simulation result showed that the trigger point was a total wind
generation capacity in the Panhandle of 6,500 MW where $94 million annual production cost saving was
observed with the stage 2 upgrade. Figure 3-8 shows the trigger point and increase in the Panhandle export
limit for the stage 2 upgrade. It should be noted that with 6,500 MW of capacity Panhandle exports may still
experience congestion based on the identified export limit after the stage 2 upgrade. The annual cost saving of
$94M in the production cost simulation was the difference between the two cases listed in Table 3-13.
It should be noted that the Houston Import Project (Limestone-Gibbons Creek-Zenith 345 kV double
circuit) was added to both Cases C and D because it was assumed that this project would be completed by the
time any upgrade requiring a new line (on new ROW) could be implemented. Preliminary analysis indicated
that if the Houston Import Projects were not in place, congestion on the Singleton-Zenith 345 kV line could
result in curtailment of Panhandle area wind generation.

Panhandle Renewable Energy Zone Study ERCOT Public
© 2014 Electric Reliability Council of Texas, Inc. All rights reserved. 30
Table 3-12 Transmission Projects for Stage 2 Upgrade
Element Description Length/Size Note Estimated Cost ($M)
Total Cost ($M)
345 kV Line Ogallala-Long Draw 190 miles Double circuit, New line 380
560
Synchronous Condenser Windmill 400 MVA 86
Synchronous Condenser Alibates 200 MVA 43
Synchronous Condenser Gray 150 MVA 32.25
Reactor Windmill 50 MVAr 2.75
Reactor Ogallala 150 MVAr 8.25
Reactor Long Draw 150 MVAr 8.25
Table 3-13 Production Cost Simulation Cases for Stage 2 Upgrade
Case Panhandle Wind
Generation Capacity (MW)
Roadmap
Upgrade
90% of Panhandle
Export Limit
(MW)
Annual Production
Cost Saving
C 6,500 Stage 1 3,150 A-B = $94M
D 6,500 Stage 2 4,680
Figure 3-8 Trigger Point and Export Limit for Stage 2 Upgrade
Based on the production cost simulation results, the congestion was reduced to 21.68% of the hours in
2017 after including the stage 2 upgrade to increase the Panhandle stability limit to 4,680 MW. The annual
Panhandle wind energy curtailment was 6,335 GWh (23.1% of the total Panhandle un-curtailed wind
generation) for case C and was 1,795 GWh (6.5% of the total Panhandle un-curtailed wind generation) for
case D.
3.3.3.1. Sensitivity Analysis – Series Compensation
A sensitivity analysis was performed to evaluate the impact of by-passing the Rocky Mound series
capacitors in the reliability analysis. The results indicate that the Panhandle export limit determined with the
stage 2 upgrade is not valid when the series capacitors were out of service. Under such conditions, a lower
export limit would be required.

Panhandle Renewable Energy Zone Study ERCOT Public
© 2014 Electric Reliability Council of Texas, Inc. All rights reserved. 31
3.3.4. Roadmap – Stage 3 Upgrade
Based on the Long-Term scenario results in section 3.2.4.2, three additional new transmission paths, listed
in Table 3-14, from the Panhandle were identified as feasible options to further increase Panhandle export
capability after the stage 2 upgrade.
Table 3-14 Additional Transmission Path Options after Stage 2 Upgrade
Path option From To Description
1 Gray Riley 345 kV double circuit, New line
2 Windmill Edith Clarke 345 kV double circuit, New line
3 Windmill Cottonwood 345 kV double circuit, New line
Cottonwood West Shackelford 345 kV double circuit, New line
Numerous dynamic contingency simulations and economic cost simulations were run to determine a
stability limit and Panhandle congestion impact for conditions where upgrades included two new transmission
paths from the Panhandle (stage 2 upgrade plus one additional path). Table 3-15 summarizes the results of
these analyses and indicates there is no significant difference between the three options. Since the upgrade
needs may vary based on the locations and sizes of the wind generation projects that actually get built, it is
recommended to consider all three options as feasible at this point. When less speculative information
regarding the wind generation plants is available, further assessment should be performed to identify the
optimal upgrade option and the associated system strength enhancement.
Table 3-15 Study Results Comparison for Three Stage 3 Transmission Options
Path option
Description Panhandle export limit (MW)
Panhandle wind generation curtailment *
Additional need of synchronous condensers (MVA)
1 Gray-Riley 6,175 1 370
2 Windmill-Edith Clarke 6,175 2 450
3 Windmill-Cottonwood
Cottonwood-W. Schackelford 6,175 3 450
*the amount of Panhandle wind curtailment (1- largest, 3-least)
3.3.4.1. Key Findings
In the reliability analysis for stage 3 upgrades, unacceptable responses were observed for some
contingencies outside the Panhandle area. This suggests that higher Panhandle export levels can have an
adverse effect on system reliability outside the Panhandle region. The following items identify the nature of
the observed unacceptable responses and some potential causes:
As discussed in section 3.2.4.1, wind resources tripped by frequency protection relays were observed
when wind generation capacity in Panhandle exceeded 6.2 GW. In many instances, the simulated

Panhandle Renewable Energy Zone Study ERCOT Public
© 2014 Electric Reliability Council of Texas, Inc. All rights reserved. 32
contingency was outside the Panhandle region. The observation of such frequency trips may indicate
a need for improved system strength.
Increasing wind generation in the system required the de-commitment of conventional synchronous
generators, which further reduced the system strength (in terms of SCR) and dynamic voltage support.
When major synchronous generators are de-committed, the weak grid challenges identified in the
Panhandle can potentially occur in other areas of ERCOT.
Synchronous generators are very valuable voltage support resources to maintain reliable high power
transfer and the de-commitment of synchronous generators can cause voltage collapse on either the
receiving end or along the transfer path. For example, voltage collapse was observed under certain
system conditions when large synchronous generators that normally support transfers into the Houston
load center were de-committed. The location and size of the de-committed synchronous generators
has a significant impact on the transfer capability and a follow up assessment is needed to identify the
trend of de-commitment with increasing renewable generation in ERCOT.
3.3.5. Roadmap – Stage 4 Upgrade
Adding one of the three upgrade options in Table 3-15 will increase the Panhandle export stability limit to
6,175 MW. To ultimately accommodate 7.5GW of wind generation in the Panhandle, one additional 345 kV
double circuit from one of three options in Table 3-15 is needed. It should be noted that option 1 in Table 3-15
needs to be included in either stage 3 or stage 4 upgrades. In other words, option 1 needs to be included in the
overall upgrades to obtain acceptable dynamic responses for the tested contingencies and assumed installation
of wind generation projects in the Panhandle. As discussed in section 3.3.4.1, unacceptable responses were
observed for some tested contingencies outside the Panhandle region and further study may be required to
address the potential reliability issues.
The economic trigger points were not calculated for stages 3 and 4 for the following reasons:
Based on the results from the stage 2 analysis it can be assumed that the trigger points for stages 3
and 4 will be well beyond 6,500 MW of installed capacity in the Panhandle. Since there is no
wind generation currently in the Panhandle it may be several years before such a trigger point is
met. At that point more information will be known about the initial Panhandle wind generation
plants which will better inform the analysis; and
As discussed in the previous section more analysis is needed to determine system needs outside of
the Panhandle and west Texas for high penetrations of wind generation.
3.3.6. Roadmap – Summary
Figure 3-9 shows the Panhandle export stability limits after each stage of upgrades and Table 3-16 lists
the upgrade details associated with each stage. It was assumed that Panhandle wind resources complied with
the high voltage ride through requirements as proposed in NOGRR124 for this analysis.

Panhandle Renewable Energy Zone Study ERCOT Public
© 2014 Electric Reliability Council of Texas, Inc. All rights reserved. 33
Figure 3-9 Panhandle Export Stability Limit for Transmission Upgrade Roadmap
Table 3-16 Panhandle Transmission Upgrade Roadmap -- Detailed Project List
Stage
Panhandle Export Stability Limit (MW)
Trigger for Upgrade (Panhandle Wind Capacity) (MW)** Upgrade Element
Estimated Upgrade Cost ($M)
Existing grid 2,400 - - -
1 3,500 3,000 MW
• Add second circuit on the existing Panhandle grid
• 200 MVA synchronous condensers • 150 MVAr reactors 115
2 5,200 6,500 MW
• Add one new 345 kV double circuit -- (Ogallala-Long Draw)
• 750 MVA synchronous condensers • 350 MVAr reactors 560
3 6,175 -
• Add one new 345 kV double circuit -- (Gray-Riley or Windmill-Edith Clarke or Windmill-Cottonwood-W.Shackelford)
• 350 MVA synchronous condensers • 300 MVAr reactors 442
4 7,500* -
• Add one additional new 345 kV double circuit -- (Gray-Riley or Windmill-Edith Clarke or Windmill-Cottonwood-W.Shackelford)
• 350 MVA synchronous condenser • 450 MVAr reactors 500
*may be lower due to constraints outside of the Panhandle **assuming the limit will be enforced at the 90% of the stability limit
Additional sensitivity analyses were performed in the roadmap development process and key observations
are listed in the following:
Replacing the 345 kV transmission upgrades with 500 kV options, including Ogallala-Long Draw and
the additional transmission paths, did not significantly increase the stability limit. Therefore, the extra
costs associated with 500 kV construction do not appear to be justified at this time.
The optimal synchronous condenser configuration and best transmission options are dependent on the
location of wind power plants. Similarly, the best transmission option is somewhat dependent on the
selected synchronous condenser configuration (or other system strength enhancement options) and
vice-versa. It should be noted that all of the upgrades proposed in this report are based on the wind
generation projects modeled in the study cases. As of 2013, there were no projects implemented in
Panhandle, and the upgrades may need to be revised based on the actual implementation of wind
generation projects.

Panhandle Renewable Energy Zone Study ERCOT Public
© 2014 Electric Reliability Council of Texas, Inc. All rights reserved. 34
The need for synchronous condensers (or other system strength enhancements) to provide a WSCR of
a least 1.5 can be based on total wind generation output. In ERCOT Operations, unstable responses
were observed from an existing wind project when connected to a weak grid under a planned
transmission outage condition. In [14], it has been observed by ERCOT and Transmission Service
Providers (TSPs) that reducing wind generation output can improve the damping of voltage
oscillations as shown in Figure 3-10 and Figure 3-11. Additional sensitivity analysis was performed
in the PREZ study to compare the system response under two different system conditions as listed in
Table 3-17, where wind output is the same, but wind capacity differs. Figure 3-12 shows the
Panhandle Windmill 345 kV station voltage responses of the two tested cases after a four cycle 3-
phase fault was applied to a 345 kV line in Panhandle. As shown in Figure 3-12, the voltage
overshoot following the disturbance is higher for the scenario with lower wind capacity, and no
significant difference in dynamic performance was observed that would suggest that the scenario with
higher wind capacity was more susceptible to stability issues. Thus, from a real time operations
perspective, it should be adequate to evaluate system strength-related limitations and constraints based
on actual wind generation output instead of nominal wind generation capacity.
Figure 3-10 Un-Damped Voltage Oscillation under High Wind Output Condition
Figure 3-11 Improved Voltage Oscillation Damping under Low Wind Output Condition
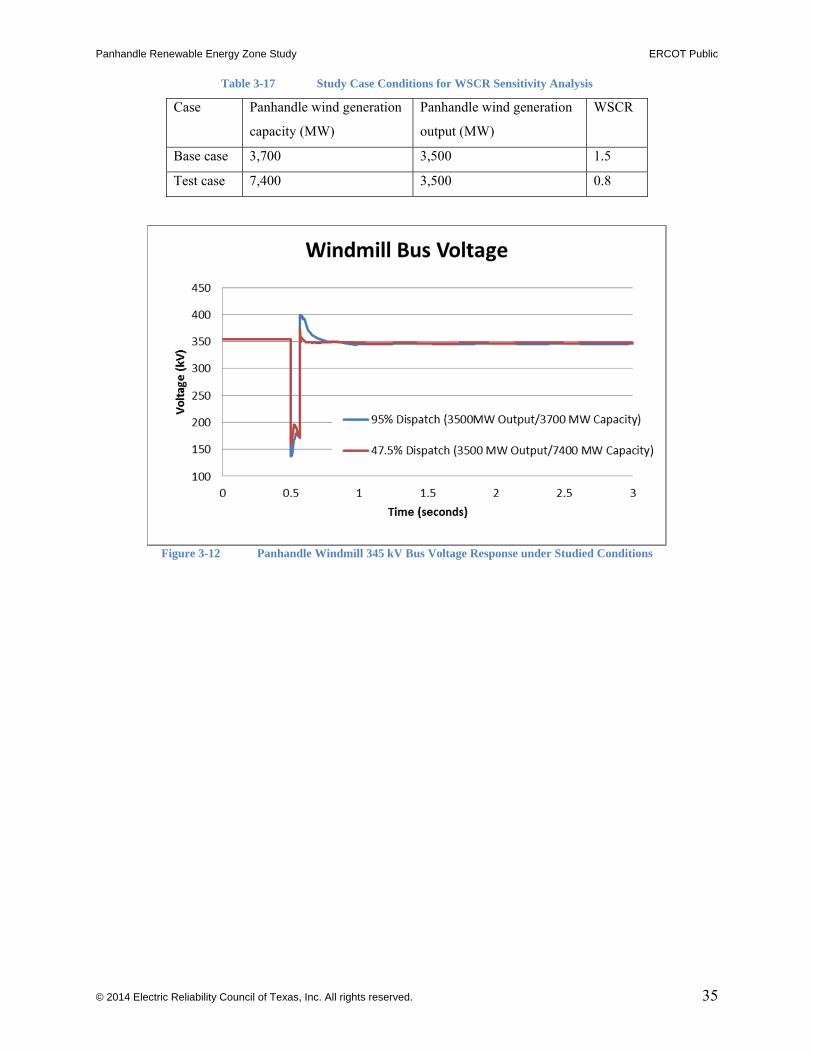
Panhandle Renewable Energy Zone Study ERCOT Public
© 2014 Electric Reliability Council of Texas, Inc. All rights reserved. 35
Table 3-17 Study Case Conditions for WSCR Sensitivity Analysis
Case Panhandle wind generation
capacity (MW)
Panhandle wind generation
output (MW)
WSCR
Base case 3,700 3,500 1.5
Test case 7,400 3,500 0.8
Figure 3-12 Panhandle Windmill 345 kV Bus Voltage Response under Studied Conditions

Panhandle Renewable Energy Zone Study ERCOT Public
© 2014 Electric Reliability Council of Texas, Inc. All rights reserved. 36
4. CONCLUSIONS
This report describes the challenges and constraints associated with connecting large amounts wind
generation in the ERCOT Panhandle region. It also provides an upgrade roadmap for both ERCOT and TSPs
to accommodate Panhandle wind generation in excess of 2,400 MW, the amount consistent with the initial
reactive equipment build-out supported by the CREZ Reactive Power Study. Several transmission
improvements can be implemented at a relatively low cost and in a relatively short time frame to increase the
Panhandle export limit. These include installing shunt reactors, synchronous condensers and adding the
second circuit on existing towers that were constructed to be double-circuit capable with originally just one
circuit in place. Additional improvements to increase export limits will include new transmission lines on new
right of way (ROW). These improvements will require significant wind generation development commitment
in order to be economically justified.
Several key findings and proposals in this study are summarized below.
Panhandle Weak Grid Characteristics
The Panhandle grid is remote from synchronous generators and load centers and is considered a weak grid
when integrating large amount of wind generation. Several system characteristics and challenges that can
occur in a weak grid are:
In a highly compensated weak grid, voltage collapse can occur within the normal operating
voltage range (0.95 to 1.05 pu) masking voltage stability risks in real time operations. Static
capacitor or static var compensators contribute to this effect and have limited effectiveness for
further increasing transfer capability.
A grid with low short circuit ratios and high voltage sensitivity of dV/dQ requires special
coordination of various complex control systems. Typical voltage control settings can result in
aggressive voltage support in a weak system and can lead to un-damped oscillations, overvoltage
cascading or voltage collapse.
Wind projects connected to the Panhandle region are effectively connected to a common point of
interconnection (POI) such that each wind plant may interact with other Panhandle wind plants.
Weighted Short Circuit Ratio (WSCR)
The weighted short circuit ratio (WSCR) was used to take into account the effect of interactions between
wind plants. WSCR gives a conservative estimate of the system strength and is considered as a proper index to
represent the system strength for the Panhandle region.
Voltage Ride Through Capability
Post-disturbance overvoltage is more likely to occur under weak grid conditions. Actuation of wind plant
overvoltage relays was observed in various simulation results and can potentially lead to overvoltage
cascading. The collapse caused by overvoltage cascading presents a significant reliability risk and suggests a
need for wind generation projects to comply with the HVRT requirement as proposed in NOGRR 124.

Panhandle Renewable Energy Zone Study ERCOT Public
© 2014 Electric Reliability Council of Texas, Inc. All rights reserved. 37
System Strength Enhancement
A WSCR of 1.5 was proposed as the minimum system strength need for Panhandle. The PREZ study
results indicate that the need for the system strength enhancement should be determined by wind generation
output instead of wind generation capacity when there is a need to constrain wind plant output in real time
operations.
The Panhandle wind generation resources modeled in the study case were based on each project’s
available generation interconnection information at the time the study was performed. As of 2013, there were
no generation projects in-service in the Panhandle, and the proposed upgrades may need to be revised based on
actual installed wind generation projects. The study results serve as a reference to both ERCOT and TSPs to
identify the challenges, constraints, and upgrade needs in the Panhandle region. These identified projects are
not approved transmission projects and may require additional review prior to implementation.
ERCOT staff will continue to work with TSPs to evaluate alternative upgrade options proposed by TSPs
and/or stakeholders. ERCOT also will monitor the generation interconnection status for actual implementation
of wind projects in Panhandle.
It should be noted that the identified improvements were based on the assumptions used in this study.
Should these assumptions change, the results of this analysis will need to be updated which could yield a
different set of transmission improvements or trigger points. Assumptions that could change the results of this
analysis include the size and location of actual wind generation development in the Panhandle, a change to the
assumed high voltage ride through requirement, connection of a proposed DC-tie in the Panhandle,
transmission upgrade cost estimates, or natural gas price projections.
Although additional synchronous generators in the Panhandle region can improve the system strength and
provide dynamic voltage support, it is unlikely that such synchronous generators will be on-line under high
wind output conditions since synchronous generators typically have a higher marginal cost than wind plants.
Therefore, the addition of new synchronous generators in the Panhandle region is not expected to change the
study results.

Panhandle Renewable Energy Zone Study ERCOT Public
© 2014 Electric Reliability Council of Texas, Inc. All rights reserved. 38
5. REFERENCES
[1] Competitive Renewable Energy Zone Program Oversight, CREZ Progress Report, available at http://www.texascrezprojects.com/default.aspx
[2] ERCOT CREZ Reactive Compensation Study, available at http://www.ercot.com/content/news/presentations/2010/CREZ%20Reactive%20Power%20Compensation%20Study.pdf
[3] Long-Term System Assessment for the ERCOT Region, available at http://www.ercot.com/content/news/presentations/2013/2012%20Long%20Term%20System%20Assessment.pdf
[4] ERCOT Protocol, available at http://www.ercot.com/mktrules/nprotocols/current
[5] Abbey, C., B. Khodabakhchian, F. Zhou, S. Dennetiere, J. Mahseredjian, and G. Joos, “Transient modeling and comparison of wind generator topologies,” Proceedings of International Conference on Power Systems Transients, pp. 131-7. 2005.
[6] Prabha Kundur, “Power System Stability and Control”, McGraw-Hill, 1994.
[7] F. Zhou, G. Joos, and C. Abbey, “Voltage stability in weak connection wind plants,” Proceedings of 2005 IEEE PES General Meeting, June 12-16, 2005.
[8] Piwko, Richard, et al., “Integrating Large Wind plants into Weak Power Grids with Long Transmission Lines,” Proceedings of 2006 Power Electronics and Motion Control Conference, 2006.
[9] Palsson, Magni P., Trond Toftevaag, Kjetil Uhlen, and John Olav Giæver Tande, “Large-scale wind power integration and voltage stability limits in regional networks,” Proceedings of 2005 IEEE PES General Meeting, 2002 IEEE, vol. 2, pp. 762-769.
[10] Kara Clark, Nicholas Miller, and Juan J. Sanchez-Gasca , “Modeling of GE Wind Turbine-Generators for Grid Studies,” Version 4.2, GE Energy, June, 2008.
[11] O. B. Nayak, A. M. Gole, D. G. Chapman, and J. B. Davies, “Dynamic performance of static and synchronous compensators at an HVDC inverter bus in a very weak ac system,” IEEE Trans. Power Syst., vol. 9, no. 3, pp. 1350–1358, August 1994.
[12] Paul E. Marken, Mike Henderson, Dean LaForest, John Skliutas, Jim Roedel, and Todd Campbell , “Selection of Synchronous Condenser Technology for the Granite Substation,” Proceedings of 2010 IEEE T&D Conference, April 19-22, 2010, New Orleans.
[13] John skliutas, Dean LaForest, Robert D’Aquila, Dale Derr, and Erik Kronbeck, “Next-Generation Synchronous Condenser Installation at the VELCO Granite Subtation,” Proceedings of 2009 IEEE PES General Meeting, Calgary, Alberta, Canada, July 2009.
[14] S.-H. Huang, J. Schmall, J. Conto, J. Adams, Y. Zhang, C. Carter, “Voltage Stability Concerns on Weak Grids with High Penetration of Wind Generation: ERCOT Experience,” Proceedings of 2012 IEEE PES General Meeting, July 22-26, 2012, San Diego
[15] Additional VRT Requirement for IRRs, available at http://www.ercot.com/mktrules/issues/nogrr/101-125/124/index
[16] ERCOT Planning Guide, available at http://www.ercot.com/mktrules/guides/planning/current
[17] ERCOT Transmission and Security Operating Procedure, available at http://www.ercot.com/mktrules/guides/procedures/index
[18] ERCOT subsynchronous resonance workshop, http://www.ercot.com/calendar/2013/09/20130909-SSR
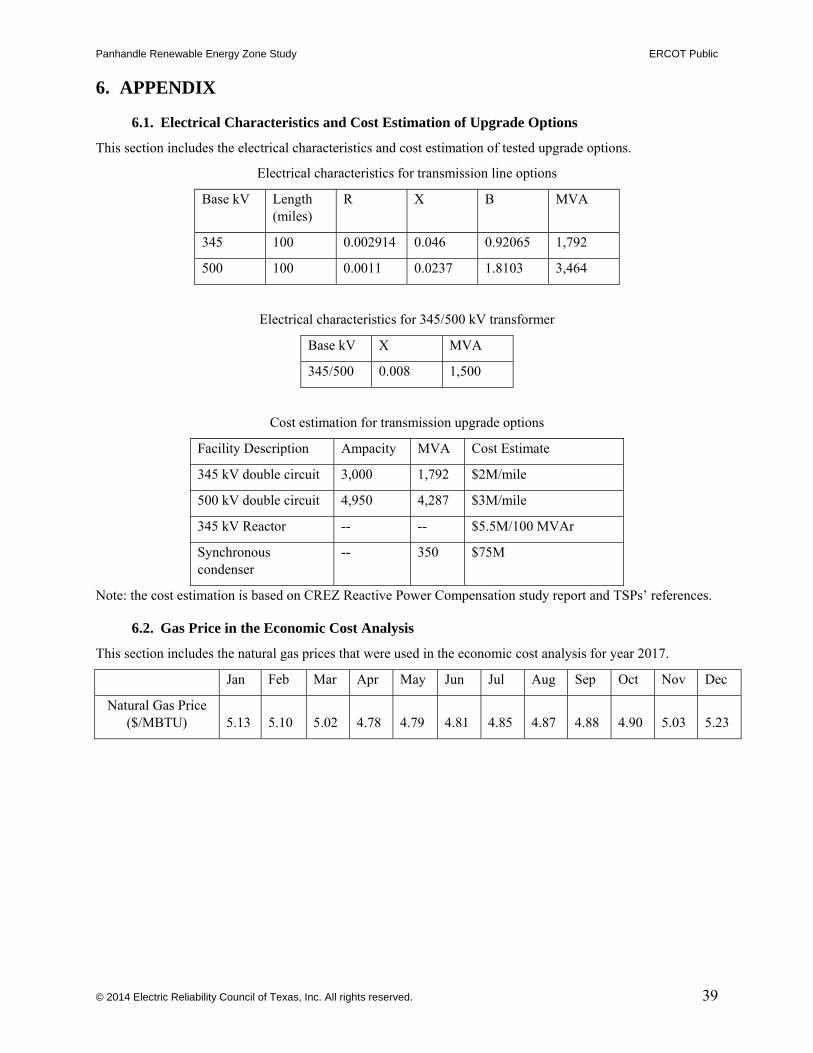
Panhandle Renewable Energy Zone Study ERCOT Public
© 2014 Electric Reliability Council of Texas, Inc. All rights reserved. 39
6. APPENDIX
6.1. Electrical Characteristics and Cost Estimation of Upgrade Options
This section includes the electrical characteristics and cost estimation of tested upgrade options.
Electrical characteristics for transmission line options
Base kV Length (miles)
R X B MVA
345 100 0.002914 0.046 0.92065 1,792
500 100 0.0011 0.0237 1.8103 3,464
Electrical characteristics for 345/500 kV transformer
Base kV X MVA
345/500 0.008 1,500
Cost estimation for transmission upgrade options
Facility Description Ampacity MVA Cost Estimate
345 kV double circuit 3,000 1,792 $2M/mile
500 kV double circuit 4,950 4,287 $3M/mile
345 kV Reactor -- -- $5.5M/100 MVAr
Synchronous condenser
-- 350 $75M
Note: the cost estimation is based on CREZ Reactive Power Compensation study report and TSPs’ references.
6.2. Gas Price in the Economic Cost Analysis
This section includes the natural gas prices that were used in the economic cost analysis for year 2017.
Jan Feb Mar Apr May Jun Jul Aug Sep Oct Nov Dec
Natural Gas Price ($/MBTU) 5.13 5.10 5.02 4.78 4.79 4.81 4.85 4.87 4.88 4.90 5.03 5.23