Embed Size (px)
Citation preview

Panel on Advanced Manufacturing Technology Analysis:
Session 1- Impacts at the Unit Operations & Plant/Facility Levels
Session 2 - Analysis Methodology & Tools
AMO Peer Review MeetingJune 14, 2016
Joe Cresko, DOE-AMOAlberta Carpenter, NREL
William Morrow, LBNLSachin Nimbalkar, ORNL
Diane Graziano, ANL
1

Advanced Manufacturing - Impacts at the Unit Operations & Plant/Facility Levels
- PH accounts for about 70% of all process energy1
- Overall, process heating systems lose more than 2,500 TBtu annually of on-site energy2
1. Manufacturing Energy and Carbon Footprints (2010 MECS), U.S. DOE Office of Energy Efficiency & Renewable Energy2. Sankey diagram of energy flow in U.S. manufacturing, U.S. DOE Office of Energy Efficiency & Renewable Energy, available from:
http://energy.gov/eere/amo/sankey-diagram-energy-flow-us-manufacturing.
- A significant amount of WH is not currently recovered across all temperature ranges
- An expanded need for R&D in two temperature ranges: ultra-low (<250°F) and ultra-high (>1,600°F).
- Rapid developments in recent years and expanded to a broader range of industry applications
- Is the use of AM more sustainable than CM for manufacturing certain consumer parts?

Industrial Process Heating - Goal• Characterize the potential to reduce energy intensity for thermal processing
of materials in manufacturing operations. If able to attain practical minimum through proper design and operation of PH equipment, can 50% improvement be attained?
• What is the opportunity for advanced PH unit operations to provide improved properties, quality, and/or product value at cost parity to conventional techniques?

Example Process Heating Research Questions• How to better assess the improvement potential of the installed process
heating system base, source of energy (i.e. electrical vs. fuel fired), operations (batch vs. continuous) or geographical locations?
• What is the impact (energy, emissions, productivity, quality, etc.) of Smart & Digital Manufacturing Technologies in process heating applications?
• What is the potential of electrotechnologies or hybrid technologies (fuel + electricity) to optimize production value? New vs. conversion? Cost?
• What is needed to scale up alternative heating methods for large scale industrial applications?
• How much can enabling technologies (heat transfer, materials of construction, combustion equipment, material handling systems, sensors, instrumentation and controls etc.) improve thermal efficiency?
• What are the emerging technologies to extend equipment service life while maintaining their functional integrity?
• What are the opportunities for high temperature waste exhaust gas filtering? –(particles, corrosive gases, condensable material vapors, etc.) to enable WHR using presently available systems.

Optimized Process Heating System Options
What is the potential of electrotechnologies or hybrid technologies to optimize production value? New vs. conversion? Cost?
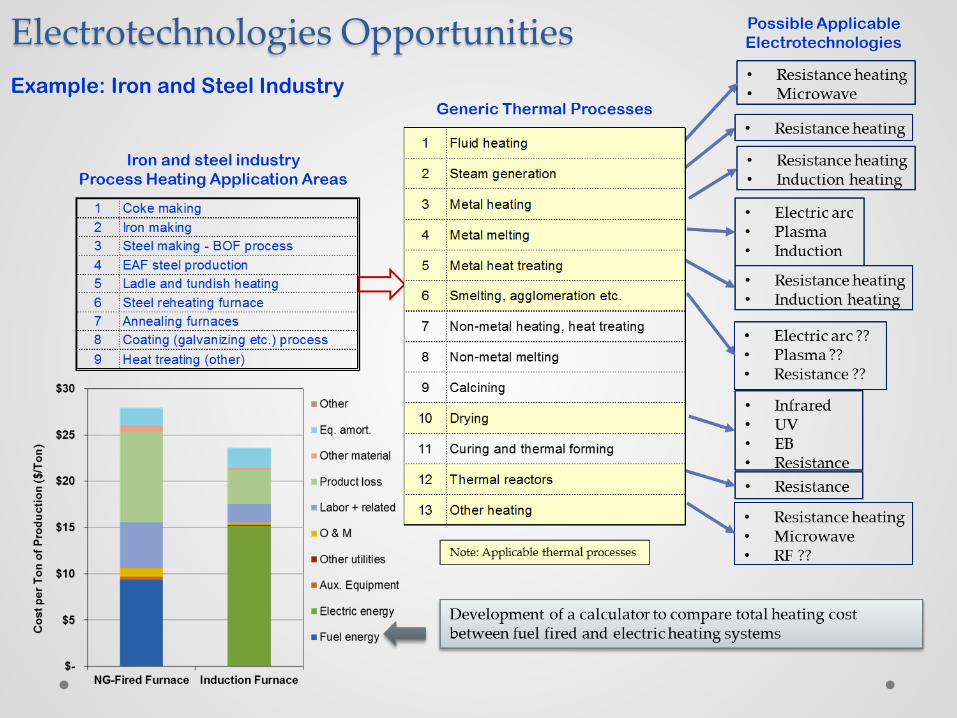
Electrotechnologies Opportunities Example: Iron and Steel Industry

Industrial Waste Heat Recovery - GoalCan an overall reduction of waste heat discharged from heating be minimized to 25% of the current value of waste heat via?• Reducing production or emission of waste heat from heating systems, • Recycling the waste heat within the system itself, and• Recovery of the waste heat.

Example WHR Research Questions
• What’s the potential for industrial WHR in the U.S. (specifically in the high and low temperature regimes)? What methods we could use to estimate the potential? What data already available? What’s the economically feasible potential?
• What are the advanced and emerging technologies available to recover high and low temperature waste heat? What are the R&D needs? What material issues? Design Issues?
• Are there high efficiency (>20%) WHP conversion systems (such as Steam Rankine Cycle) in high temperature (>1400°F) applications for low mass flow waste heat streams from relatively small fired systems (firing rate < 5 to 10 MM Btu/hr.) ?
• What are the innovative technologies for relatively high efficiency (>15%) WHR or WHP systems that can be used for variable mass flow and variable temperature waste heat sources?
• What are the advanced and emerging technologies available to extend equipment service life while maintaining their functional integrity

Waste Heat Recovery Opportunity in Different Temp. Regimes
• High & ultra-high temperature & harsh environment greater than 400 TBTU/year1
• Low/Ultra-low temperature waste heat between 1,084 to 1,637 TBtu/year2
• The largest source of waste heat for most manufacturing industries is exhaust / flue gases or heated air from heating systems.
• This table does not give additional details on composition or other characteristicsof the waste stream.
1. ORNL/TM-2014/622, January 2014.2. Technology Assessment on Low-Temperature Waste Heat Recovery in Industry, Arvind Thekdi, Sachin Nimbalkar, ORNL/TM-2016/xxx
Temperature Code: Ultra high >1600°F, High – 1200 to 1600°F, Medium – 450 to 1200°F, Low – 250 to 450°F, Ultra-low <250°F.

Practices Used by Industry for Managing or Dealing with Exhaust Gases Classified as Harsh Environments:
10
Sr. No.
Practice Examples
1 No heat recovery but treating exhaust gases (scrubbing, cooling by blending with cold air or mist cooling) to meet regulatory requirements
EAF and BOF exhaust gases
2 Partial WHR due to materials limitations, design issues and space considerations
Regenerators used onglass melting furnaces
3 Partial heat recovery due to other limitations such as safety, maintenance, lifetime
Scrap preheaters for EAFs HRSGs on BOF installations
4 Partial or no heat recovery due to high capital cost, limited operating hours, or other operating and economic reasons
Small glass, aluminum melting furnaces, cement and lime kilns
5 Loss of sensible heat and certain condensable organic materials during treatment of exhaust gases, and use of chemical heat after drying the gases as fuels
Blast furnaces and coke ovens

Techno-Economic Analysis of Low Temperature WHP Systems3
Agglomerated Cost-size Data for Different Types of WHP Systems -• At present, ORC offers both the widest
range of electricity outputs and lowest established cost.
• Maximum electrical output has at least as large an effect on the normalized price ($/kW) as does the type of system.
• The hollow triangle represents expected cost decrease of the PCM system in the near future.
3ORNL 2016. Technology Assessment on Low-Temperature Waste Heat Recovery in Industry, Arvind Thekdi, Sachin Nimbalkar, ORNL/TM-2016/xxx4Elson, A., Tidball, R., and Hampson, A. 2015. Waste heat to power market assessment. Prepared by ICF. Prepared for Oak Ridge National Laboratory.5Primen, 2003. Converting Distributed Energy Prospects Into Customers: Primen’s 2003 Distributed Energy Market Study, Boulder, Colorado.
Simple Payback Period model, numbers are in years, and interest denoted by color: green high interest levels, yellow medium, and red none. Assumes 6500 hours of operation per year and $0.015/kWh in operation and maintenance costs. Interest level based on Primen study 4,5
Economic Landscape -• Main factors of economic viability: initial
payment, electricity cost, and O&M costs• Given average US industrial electricity prices,
$0.06-0.08/kWh, and typical system costs, further drop in payback period is needed for widespread industrial use
• Economic viability of WHP projects are also heavily dependent on local factor, such as electricity prices and governmental policies

Making WHP Technologies Economically Viable
12
Spark spread for selected regions of higher electricity costs
Evaporator20% Condenser
3%
Pump4%
Turbine57%
Refrigerant1%
Fan6%
Cooing Tower9%
Component Cost Breakdown of an ORC Heat Recovery System
Notes -• Electricity price varies significantly across the country.• Recognition as a renewable equivalent energy source - recognition can provide
companies incentives ranging from tax breaks to rebates• Potential savings from emissions cost• The single largest cost of these systems is the electricity producing component,
turbine or engine, followed by heat exchanging devices, from heat exchangers to boilers and condensers.

Additive Manufacturing - Goal• Provide a fundamental and comprehensive understanding of additive
manufacturing’s current state, future trends, and potential implications relative to conventional manufacturing.
Source – QTR 2015. http://energy.gov/sites/prod/files/2015/11/f27/QTR2015-6A-Additive%20Manufacturing.pdf

Additive manufacturing – Extensive state-of-the-art review
14
• Objective: assess current performance and potential future trends of AM technologies from review of >400 machines and >600 materials
• Comparing properties of AM and conventionally manufactured parts, we find:
• Metal AM parts – some evidence for higher strength
• Polymeric AM parts –mostly similar properties
• Composite AM parts –mostly lower strength and elasticity
• Other findings:• AM envelope volume
trending higher• AM precision trending to
smaller feature size• AM price per envelope
volume trending down
Reported properties of AM parts overlaid on Ashby materials selection chart
M. F. Ashby, "Chapter 4 - Material Property Charts," in Materials Selection in Mechanical Design (Fourth Edition), ed Oxford: Butterworth-Heinemann, 2011, pp. 57-96.

Analysis Methodology & Tools Development –across the manufacturing systems levels
15
Strategic question: How is energy being used and where are the energy savings opportunities within manufacturing, and across other energy supply and use sectors?

Prospective Life Cycle Sustainability Analysis The strategic analysis team is developing tools to support prospective life cycle sustainability analysis of advanced manufacturing technologies• Prospective = forecasts sustainability benefits from technology adoption into
the future • Life cycle = encompasses entire value chain from materials extraction and
refining, to intermediate and end-use product manufacture, and through use, reuse, and recycling of materials and end-use products
• Sustainability = assesses energy use, emissions, materials flows, water use, and costs

Energy Bandwidth StudiesBandwidth Studies: Recently Completed and In-Progress
Energy bandwidth studies frame the range (or bandwidth) of potential energy savings in manufacturing, and technology opportunities to realize those savings.
Current Typical
State of the Art
Practical Minimum
Theoretical Minimum
Collaborators: Energetics; NREL; LBNL

Energy Bandwidth Example of Results – Iron & Steel

Energy Bandwidth Studies: Example of Results
Energy Intensity Comparison: Lightweight MaterialsLightweight Materials energy bandwidth analyses conducted in 2015-2016:• Advanced High
Strength Steel• Titanium• Aluminum• Magnesium• Carbon Fiber
Composites• Glass Fiber
Composites
Phase II analysis underway in 2016 will enable comparisons across materials on a performance-adjusted basis.
The energy bandwidth methodology is currently being extended to explore energy saving opportunities for lightweight materials manufacturing.

LIfecycle GHgas, Technology and Energy through the Use Phase (LIGHTEn-Up) Tool & Analysis FrameworkObjectives:
• A substantive, transparent, and intuitive scenario framework• Prospective net energy and GHG impacts of technologies utilized in both manufacturing and end-use-
phases across the U.S. economyAbout the Data
• Benchmarked to publically available DOE datasets • Annual Energy Outlook – U.S. economy-wide energy consumption forecast out to 2040 • Includes EIA’s Manufacturing Energy Consumption Survey (MECS) 2010 detailed energy consumption by
end-uses
20For examples of LIGHTEn-UP analysis output, see the Composites and Sustainable Manufacturing Technology Assessments, available at: http://energy.gov/quadrennial-technology-review-2015-omnibus#chap6ta

Materials Flows through Industry (MFI) Tool
21
Strategic need: ability to analytically track the energy and GHG impacts of the supply chain and evaluate changes from adopting next generation technologies. Be able to answer:• Where are the supply chain hotspots for
energy and emissions?• What are the most significant material
inputs?• Which materials are most energy intensive?• Which products or processes offer the
greatest potential energy use reduction?

22
Next generationmaterials
Evaluating next-generation materials

MFI Beta Web App
23

Market Penetration Calculator
1
• Strategic need: systematic method for projecting future market penetration of manufacturing technologies for prospective life cycle analysis
• Calculator captures adoption dependencies on technology readiness and stock turnover
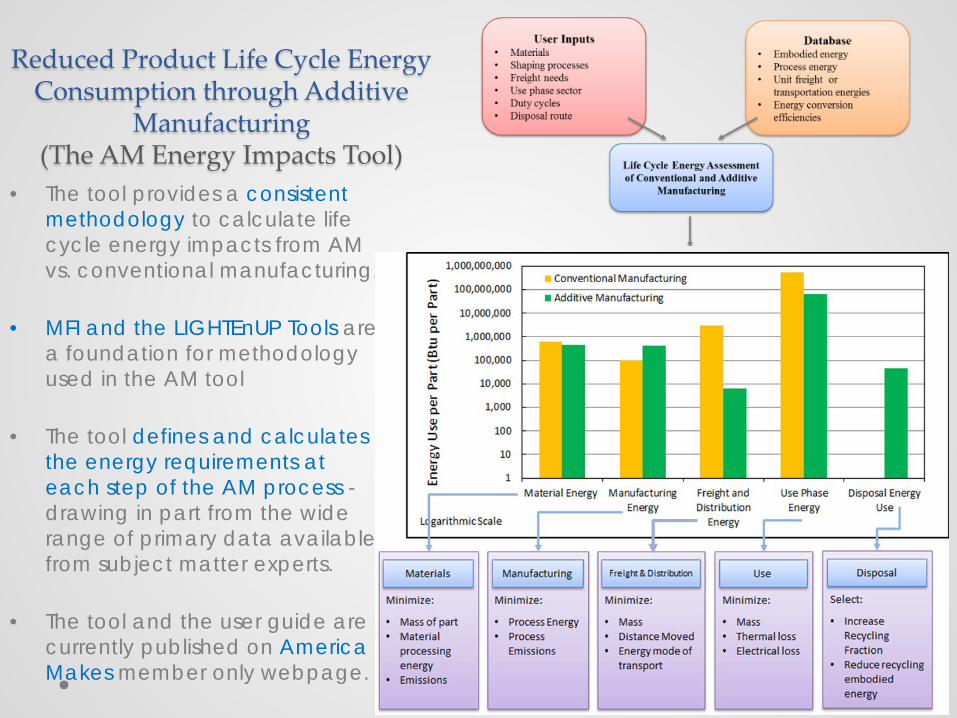
Reduced Product Life Cycle Energy Consumption through Additive
Manufacturing (The AM Energy Impacts Tool)
• The tool provides a consistent methodology to calculate life cycle energy impacts from AM vs. conventional manufacturing.
• MFI and the LIGHTEnUP Tools area foundation for methodology used in the AM tool
• The tool defines and calculates the energy requirements at each step of the AM process -drawing in part from the wide range of primary data available from subject matter experts.
• The tool and the user guide are currently published on America Makes member only webpage.

Example: Topologically Optimized Aerospace Bracket - EBM vs. Conventional Machining
Life Cycle Phases Unit Conventional Manufacturing
Additive Manufacturing
Energy Savings per Part
Raw Material Energy Btu/part 2,021,120 263,900 1,757,221
Manufacturing Energy Btu/part 65,485 65,872 (387)Freight and Distribution Energy Btu/part 40,462 14,161 26,301
Use Phase Energy Btu/part 99,583,158 34,854,105 64,729,052
Disposal Energy Use Btu/part (433,775) (151,821) (281,954)
Total Energy Use per Part Btu/part 101,276,449 35,046,216 66,230,233

Red team reviewsPeer review of Strategic Analysis Team’s Tools: • Material Flows through Industry (MFI)• LIfecycle GHgas, Technology and Energy through
the Use Phase(LIGHTEn-Up) • Additive Manufacturing ToolReview Format:• Selection of reviewer based on their expertise • Introductory webinar review of tools & User’s Guides• Reviewer’s formal (written) comments incorporated
into the tools and Reports
27

IMI Project evaluationsEvaluation of Innovative Manufacturing Initiative (IMI) projects• 18 IMI projects ranging from materials (CFRP, GaN), to
processes (chemicals, additive manufacturing), to smart technologies (milling machine optimization)
• Scenarios developed in the LIGHTEnUP tool - Energy impact forecasts out to 2050
• Scenarios based on: validity of IMI application statements, and Independent engineering principles.
• Magnitude of energy impacts range between manufacturing (smaller) & multisector (larger)
• IMI LIGHTEnUP compendium to be released in 2016
28


