Embed Size (px)
Citation preview

FIRST QUARTER RESULTS 2021
Investor presentation 04 May 2021

AGENDA OF TODAY
2 Pandora Q1 2021 - Investor presentation
Q1 results
1. Update on Q1 results
2. Q1 Q&A
Strategy launch
1. Intro to Phoenix, our new strategy
2. Phoenix Q&A
DISCLAIMER
This presentation contains forward-looking statements, which include estimates of financial
performance and targets. These statements are not guarantees of future performance and
involve certain risks and uncertainties. Therefore, actual future results and trends may differ
materially from what is forecast in this report due to a variety of factors.

AGENDA Q1 RESULTS
3 Pandora Q1 2021 - Investor presentation
1. Executive summary
2. Business update
3. Q1 2021 Financials
4. Financial guidance
5. Appendix

TURNAROUND COMPLETED
4 Pandora Q1 2021 - Investor presentation
Sell-out growth in Q1 2021 ending at –5% vs 2019 despite
30% of stores temporarily closed
Continuation of strong momentum in Q1 2021 – online growing +200%
vs 2019
More than +50% growthin US vs 2019
Today, Pandora is releasing its new strategy, Phoenix- a new chapter of sustainable and profitable growth
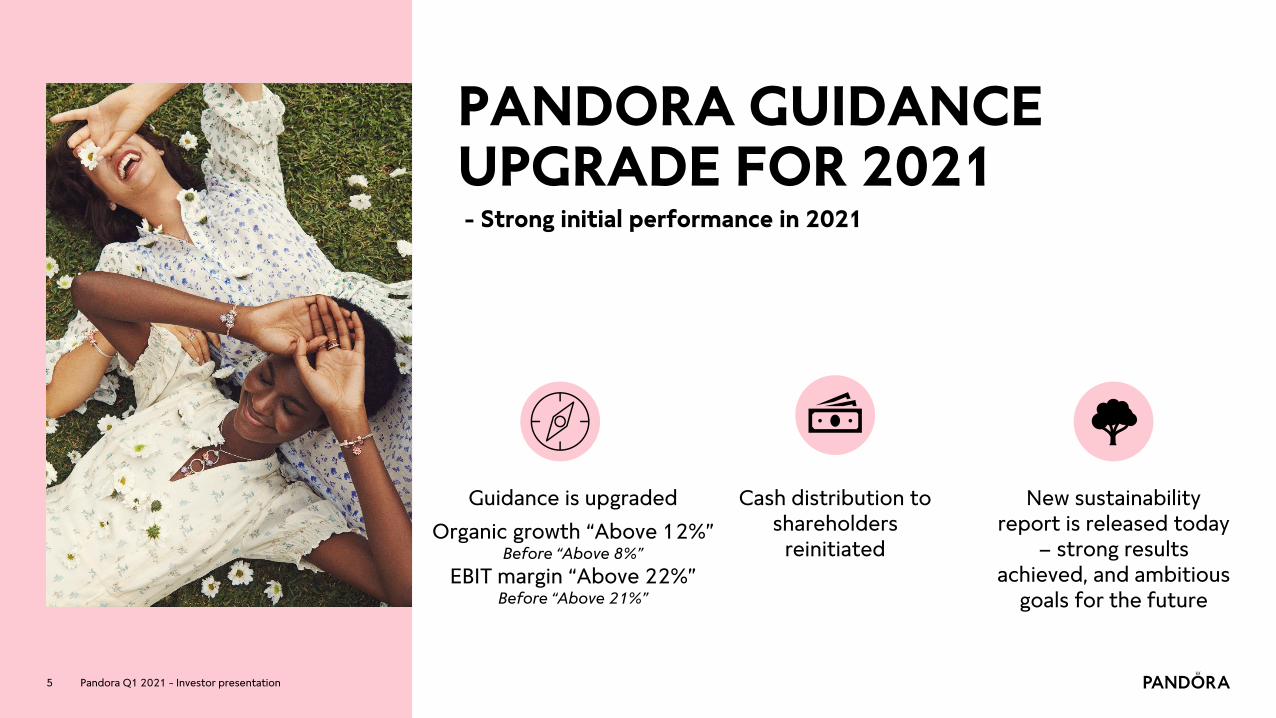
PANDORA GUIDANCE UPGRADE FOR 2021
5
New sustainability report is released today
– strong results achieved, and ambitious
goals for the future
Pandora Q1 2021 - Investor presentation
Guidance is upgraded
Organic growth “Above 12%”Before “Above 8%”
EBIT margin “Above 22%” Before “Above 21%”
Cash distribution to shareholders
reinitiated
- Strong initial performance in 2021

AGENDA Q1 RESULTS
6 Pandora Q1 2021 - Investor presentation
1. Executive summary
2. Business update
3. Q1 2021 Financials
4. Financial guidance
5. Appendix

SOLID PERFORMANCE DESPITE 30% STORES CLOSED
Pandora Q1 2021 - Investor presentation
• Underlying performance is best viewed vs 2019 (no COVID-19 impact)
• Solid performance across key markets despite lockdowns – as an example sell-out growth in UK was only down 16% despite all stores being closed during Q1
• Australia and US, which were almost fully open in Q1, both delivered positive growth vs 2019
• China performance is in line with expectations – first significant steps in the China transformation plan to be taken in H2 2021
Q1 2021 vs
2020vs
2019
Q1 2021 closed stores
due to COVID-19*
Q1 2020 closed stores
due to COVID-19*
US 81% 52% 9% 13%
UK -7% -16% 100% 10%
Italy 5% -11% 40% 25%
France -15% -22% 43% 15%
Germany -16% -22% 83% 50%
China 43% -48% 1% 16%
Australia 29% 5% 7% 0%
Group 21% -5% Around 30% Around 20%1
*Average closures throughout the quarter
1End of March 2020 Pandora had approx. 80% of the network closed
7
Sell-out growth

COVID-19 BLURS THE READING OF THE PERFORMANCE IN Q1 2021- UNDERLYING NUMBERS CONFIRM THAT TOPLINE IS STABILISING
Pandora Q1 2021 - Investor presentation
Illustrative underlying Q1 2021 performance
8
• Sell-out growth vs 2019 ended at -5% and was impacted by two opposing COVID-19 factors:
1. Lockdown of stores dragging down revenue in Q1 2021 –partially offset by revenue picked up online
2. A shift in general consumer demand away from travellingand towards gifting and jewellery + US stimulus packages
• Credit card data from US is indicating that we grew more thanthe rest of the market in Q1 2021
• Our assessment is that the underlying Q1 performanceconfirms that the topline is stabilising
Lost revenue in physical stores
Q1 2021 Sell-out growth vs 2019
US stimulus + Consumer
wallet shifting
Lost revenue recovered online
Underlying performance
-5%
0%
9 Pandora Q1 2021 - Investor presentation
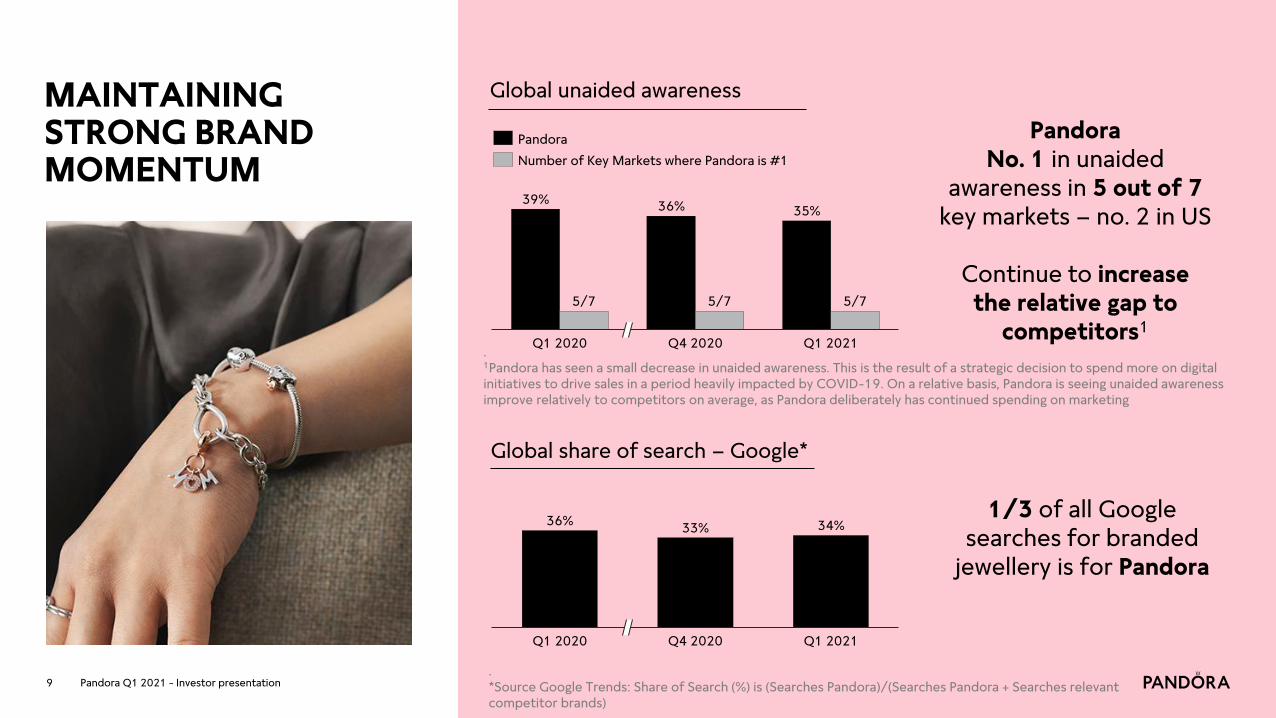
MAINTAINING STRONG BRAND MOMENTUM
36%33% 34%
Q1 2020 Q4 2020 Q1 2021
Global share of search – Google*
Global unaided awareness
. *Source Google Trends: Share of Search (%) is (Searches Pandora)/(Searches Pandora + Searches relevant competitor brands)
1/3 of all Google searches for branded
jewellery is for Pandora
39%36%
Q1 2020 Q1 2021Q4 2020
5/7 5/7
35%
5/7
Pandora No. 1 in unaided
awareness in 5 out of 7 key markets – no. 2 in US
Continue to increase the relative gap to
competitors1
Pandora
Number of Key Markets where Pandora is #1
. 1Pandora has seen a small decrease in unaided awareness. This is the result of a strategic decision to spend more on digital initiatives to drive sales in a period heavily impacted by COVID-19. On a relative basis, Pandora is seeing unaided awareness improve relatively to competitors on average, as Pandora deliberately has continued spending on marketing
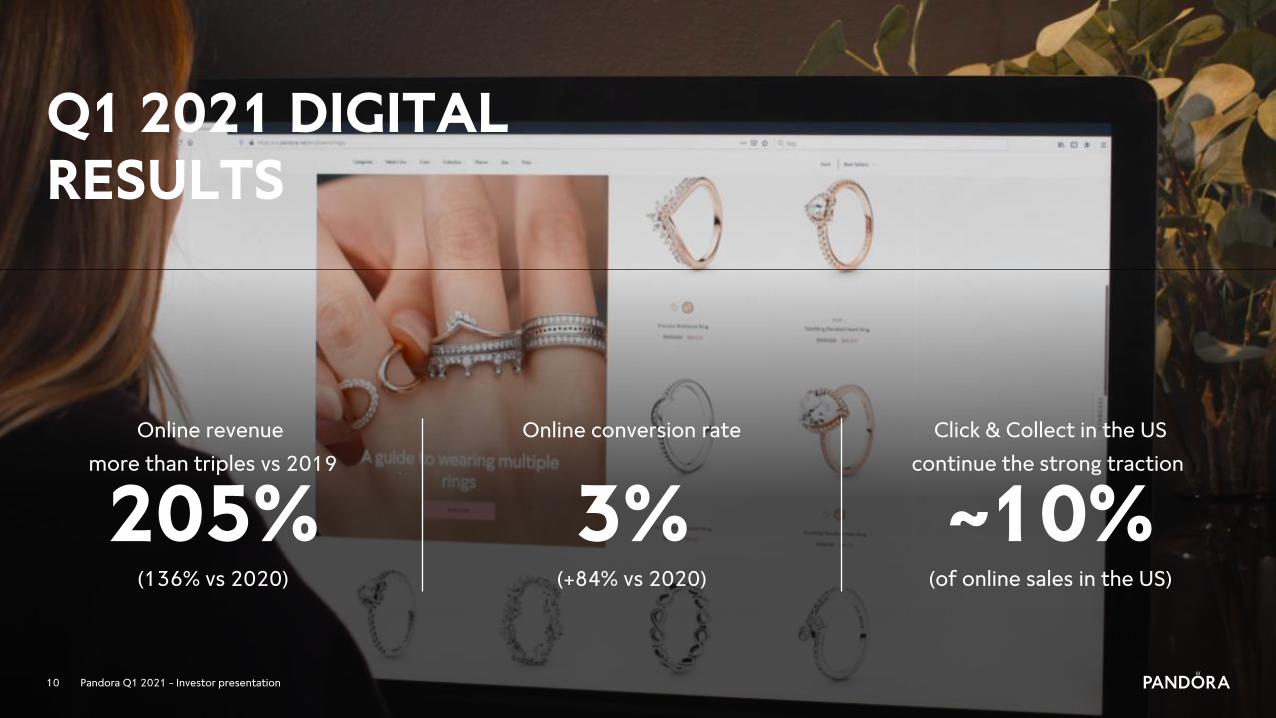
Q1 2021 DIGITAL RESULTS
10 Pandora Q1 2021 - Investor presentation
(of online sales in the US)(+84% vs 2020)(136% vs 2020)
Click & Collect in the US
continue the strong traction
Online conversion rateOnline revenue
more than triples vs 2019
~10%3% 205%

BECOMING LOW-CARBON, CIRUCLAR AND INCLUSIVE
11
LOWERING OURCO2 FOOTPRINT
• Switched to 100% renewable energy in our manufacturing facilities in Thailand in 2020
SUPPORTING A CIRCULAR ECONOMY
• Established roadmap for achieving target of using only recycled silver and gold by 2025
BEING AN INCLUSIVE AND FAIR BRAND
• Completed company-wide Inclusion & Diversity assessment
• Completed global human rights impact assessment
SUSTAINABILITY REPORT 2020 launched May 4, 2021
INCREASING DISCLOSURE IN NEW SUSTAINABILITY REPORT
• Aligns with internationally recognised Global Reporting Initiative (GRI) and Sustainability Accounting Standards Board (SASB) reporting requirements
• Reports Scope 3 greenhouse gas emissions and integrates TCFD reporting section
• Includes human rights section in line with international expectations (UNGPs) and forthcoming regulation (EU mHRDD)
Pandora Q1 2021 - Investor presentation

AGENDA Q1 RESULTS
12 Pandora Q1 2021 - Investor presentation
1. Executive summary
2. Business update
3. Q1 2021 Financials
4. Financial guidance
5. Appendix

EBIT MARGIN UP 5PP- DRIVEN BY OPERATING LEVERAGE
13 Pandora Q1 2021 - Investor presentation
Topline Q1 2021 Q1 2020 Q1 2019
Revenue, DKK million 4,500 4,172 4,804
Organic growth 13% -14% -12%
Organic growth vs 2019 -3% n/a n/a
Sell-out growth 21% -17% -10%
Sell-out growth vs 2019 -5% n/a n/a
Financial ratios
Gross margin 76.3% 77.4% 75.9%
EBIT margin 20.1% 15.3% 22.5%
Cash conversion incl. lease payments, % -65% -134% 43%
Net working capital, % of last 12 months revenue
-0.4% 0.0% 8.3%
NIBD to EBITDA excl. restructuring costs 0.6 1.3 1.6
CAPEX (% of revenue) 2% 3% 4%
Earnings per share, basic, DKK 6.3 -0.3 7.9
Key financial highlights
Commentary
• Performance in Q1 was strong given 30% of the stores were temporarily closed
• EBIT margin ending well above Q1 2020 proving the robust operating leverage in the business
• As previously communicated, cash conversion was impacted by:- a reduction in payables due to
settlement of the final Programme NOW restructuring costs as well as COVID-19 payment plans
- a deliberate increase in inventories
• Net working capital continue to be low and remained in negative territory
• Financial leverage remains low and in the low end of the capital structure policy
• Significant increase in EPS driven by the lapse of restructuring costs and higher EBIT margin

Total revenue growth in DKK,
Q1 2021
Organic growth,
Q1 2021
Network expansion
-5%4,172
Forward integration
Other incl. timing
3%
Channel mix
-6%
Sell-out growth*
Revenue, Q1 2020
Calendar shift
21%
FX
-3%
13% 0% 13%
8%
Total revenue growth in LC,
Q1 2021
-2%
STRONG REVENUE DEVELOPMENT CONSIDERING STORE CLOSURES
Pandora Q1 2021 - Investor presentation
Commentary
• Organic growth vs 2019 was negatively impacted by -1.5pp from the closure of 54 concept stores
• The lockdowns in physical stores has skewed the channel mix towards online. This creates a positive impact on revenue converting wholesale sell-in to online sell-out (“Channel mix”)
• As part of Programme NOW, Pandora initiated a commercial reset in 2019 with the purpose of reducing wholesale inventory (”Normalisation of sell-in & other”)
• A calendar shift between the so-called 4-4-5 retail calendar (used for sell-out) and the Gregorian calendar (used for organic growth) drives a 6% difference vs 2020 (“Calendar shift”)
• The 4-4-5 calendar includes weeks 1-13 2021 (January 4-April 4) and thereby 4 trading days in April comping very limited revenue in 2020
14
*Sell-out growth incl. temporarily closed stores, %
%-p growth (approximately)
Q1 growth composition vs Q1 2020
0% -3%
Network expansion
Revenue, Q1 2019
Total revenue growth in LC,
Q1 2021
-3%
4,804
Organic growth,
Q1 2021
-5%
2%1.5% -3%
-6%
Normalisation of sell-in &
other
Channel mix
Forward integration
Total revenue growth in DKK,
Q1 2021
FXSell-out growth*
-1.5%
Q1 growth composition vs Q1 2019
%-p growth (approximately)

EBIT MARGIN UP 5PP - DRIVEN BY OPERATING LEVERAGE
Pandora Q1 2021 - Investor presentation
EBIT margin at strong level in a difficult environment%-p development (approximately)
Commentary
• Pandora delivered a solid EBIT margin in Q1 2021, proving the strong operating leverage
• The EBIT margin was impacted by headwind from higher silver prices as well as minor impact from foreign exchange
• The Programme NOW cost savings added 2pp margin improvement
• Cost savings re-invested in driving the topline
• The EBIT margin was positively impacted by DKK 82m in COVID-19 government subsidies, supporting the margin by 1.8pp – no government subsidies in Q1 2020
15
5.0%
1.5%2.0%
2.5%1.8%
Leverage from organic growth
Cost savingsEBIT margin, Q1 2020
FX & commodities
Strategic investments
& other
Government subsidies
EBIT margin, Q1 2021
20.1%
15.3%

AGENDA Q1 RESULTS
16 Pandora Q1 2021 - Investor presentation
1. Executive summary
2. Business update
3. Q1 2021 Financials
4. Financial guidance
5. Appendix

17 Pandora Q4 2020 - Investor presentation
Guidance upgraded following strong performance in Q1
ORGANIC REVENUEGROWTH
Above 12%(Above 0% vs 2019)
UPGRADED 2021 GUIDANCE
Including impact from COVID-19
EBIT MARGIN
Above 22%
Pandora Q1 2021 - Investor presentation17
ORGANIC REVENUEGROWTH
Above 8%(Above -3% vs 2019)
PREVIOUS 2021 GUIDANCE
Including impact from COVID-19
EBIT MARGIN
Above 21%

ORGANIC GROWTH GUIDANCE BRIDGE
Pandora Q1 2021 - Investor presentation
2021 vs 2020
GUIDANCE ASSUMPTIONS
• The updated guidance is based on the assumption that 20-25% of the stores will be temporarily closed during the first half of 2021 and 5-10% in the second half. This is expected to impact organic growth negatively by around -6% for the full year
• The -6% impact is a result of closed stores and online pickup and do not include the impact from stimulus packages in US
• China is expected to remain a drag on group performance vs 2019 for the rest of the year
• An organic growth of “Above 12%” vs 2020 correspond to an organic growth of “Above 0%” vs 2019
• The impact from forward integration is expected to be around 1% in 2021. Finally, Pandora expects headwind from foreign exchange rates of approximately -1% taking total revenue growth in DKK to above 12% in 2021
18
4%
6%
Store closures and online pickup
2021 original guidance incl.
COVID-19
Better underlying performance and
US stimulus packages
2021 updated guidance incl.
COVID-19
US stimulus packages + Consumer
wallet shifting
Underlying performance
excl. COVID-19
Above 8%
Above 12%
Illustrative COVID-19 impacts
Guidance

1.5%
0.5%1.0%
2.0%
2021 updated guidance incl.
COVID-19
2021 original guidance incl.
COVID-19
Operating leverage
Higher cost reductions
Investments in China
Store closures and online pickup
US stimulus packages + Consumer
wallet shifting
Above 22%
Underlying performance excl. COVID-
19
Above 21%
EBIT MARGIN GUIDANCE BRIDGE
%-points approximations
19
GUIDANCE ASSUMPTIONS
• Pandora increases the EBIT margin guidance driven higher topline and thereby operating leverage
• In addition, Pandora has identified DKK 100 million further cost reductions – on top of the DKK 350 million already included in the guidance
• In H2 2021, Pandora will take the first significant steps in the China transformation by investing in a repositioning of the brand
OTHER GUIDANCE PARAMETERS
• CAPEX for the year is still expected to be in the range between DKK 1.0-1.2 billion
• No major changes to the overall concept store network are expected
• The effective tax rate is expected to be 22-23%, in line with 2020
Guidance
Illustrative COVID-19 impacts
Pandora Q1 2021 - Investor presentation

PANDORA RESUMES CASH DISTRIBUTION FOLLOWING A STRONG START TO 2021
20 Pandora Q1 2021 - Investor presentation
Commentary
• Pandora resume cash distribution
• At the Annual General Meeting in March 2021, Pandora was granted the authorisation by the shareholders to distribute up to DKK 15 per share as extraordinary dividend in 2021
• The Board of Directors already had the authority to initiate a share buyback at any point in time
• As a pre-cautionary measure due to COVID-19, the cash distribution will follow a “pay-as-you-go” approach, initially paying out DKK 1 billion in Q2 2021
• Assuming that the COVID-19 situation does not worsen, Pandora expects to continue the quarterly distributions in Q3-Q4 2021
• The cash distribution will be split equally between share buybacks and dividends
Strong liquidity & low leverage
0.5 0.5 0.5
0.5 0.5 0.5
Q2 2021 Q3 2021
1.0
Q4 2021
1.01.0
Share buyback
Dividend
Cash distributionQuarterly split, DKK billion
Confirmed Illustrative - Pay-as-you-goAvailable liquidity *
DKK 7 billion
NIBD to EBITDA ratio end of Q1 2021
0.6x(Capital structure policy of 0.5x-1.5x)
*End of Q1 2021, committed facilities was DKK 10 billion. Club loan of DKK 3 billion has been repaid in early Q2 2021

CLOSING REMARKS
21 Pandora Q1 2021 - Investor presentation
Cash distribution resumed
Launching the headlines of the new strategy today
– from turnaround to sustainable growth
Strong performance
in Q1 2021
Upgraded guidance

APPENDIX
22 Pandora Q1 2021 - Investor presentation
23 Pandora Q1 2021 - Investor presentation
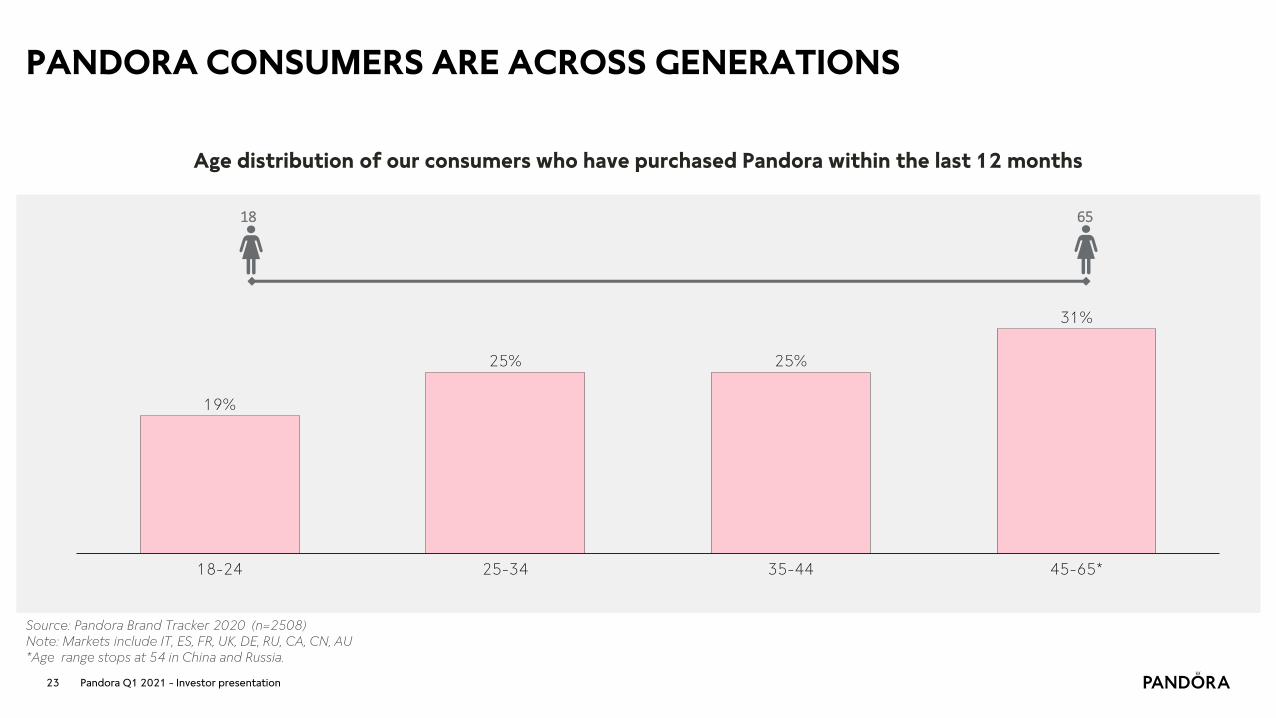
Age distribution of our consumers who have purchased Pandora within the last 12 months
18 65
45-65*
25%
18-24
25%
25-34 35-44
19%
31%
Source: Pandora Brand Tracker 2020 (n=2508)Note: Markets include IT, ES, FR, UK, DE, RU, CA, CN, AU*Age range stops at 54 in China and Russia.
PANDORA CONSUMERS ARE ACROSS GENERATIONS

24
PANDORA’S ONLINE BUSINESS & PRESENCE
Online store development Online platforms
438 447 400 477 543 455621
841
0
5
10
15
20
25
30
35
40
45
50
55
0
200
400
600
800
1,000
1,200
1,400
1,600
1,800
2,000
2,200
2,400
2,600
%
Q1 2018
9%
13%
Q3 2019
9%
31%
21%
Q2 2018
8% 1,019
Q4 2018
10%
Q1 2019 Q1 2020Q3 2018 Q2 2019
10%
16%
1,307
Q3 2020Q4 2019
52%
15%1,487
Q2 2020
32%2,533
Q4 2020 Q1 2021
1,41712%
Online store revenueOnline store % of Group Revenue
136%ORGANIC
GROWTH INQ1 ‘21
31%REVENUE SHARE OF GROUP REVENUE IN
Q1 ‘21
20MARKETS
SINGLEDIGIT RETURN
RATES
STRONG PROFITABILITY
DKK million
Pandora online stores available in 20 markets across all regions, incl. China (own and Tmalldistribution), Australia, Italy, the UK, the US etc.
More than 345 million visits on the Pandora online stores in 2020
18 million Pandora club members worldwide
17.1 million Facebook followers
8.4 million followers on Instagram
Pandora Q1 2021 - Investor presentation

25
REVENUE DEVELOPMENT BY CHANNEL AND BY GLOBAL BUSINESS UNIT
Channel Development
DKK million Q1 2021LC growth
vs Q1 2020Share of revenue
Q1 2021 FY 2020LC growth
vs FY 2019Share of revenue
FY 2020Pandora owned retail 2,956 18% 66% 13,426 -2% 71%- of which concept stores 1,381 -20% 31% 7,321 -29% 39%
- of which online stores 1,417 136% 31% 5,483 103% 29%
- of which other points of sale 158 0% 4% 622 -18% 3%
Wholesale 1,365 8% 30% 4,949 -25% 26%
- of which concept stores 689 -5% 15% 2,714 -28% 14%
- of which other points of sale 676 25% 15% 2,235 -21% 12%
Third-party distribution 179 -14% 4% 634 -33% 3%
Total revenue 4,500 13% 100% 19,009 -11% 100%
Global Business Units
DKK million Q1 2021LC growth
vs Q1 2020Share of revenue
Q1 2021 FY 2020LC growth
vs FY 2019Share of revenue
FY 2020
Moments and Collabs 3,124 15% 69% 13,059 -11% 69%
Style and Upstream Innovation 1,377 7% 31% 5,950 -10% 31%Total revenue 4,500 13% 100% 19,009 -11% 100%
Pandora Q1 2021 - Investor presentation
26
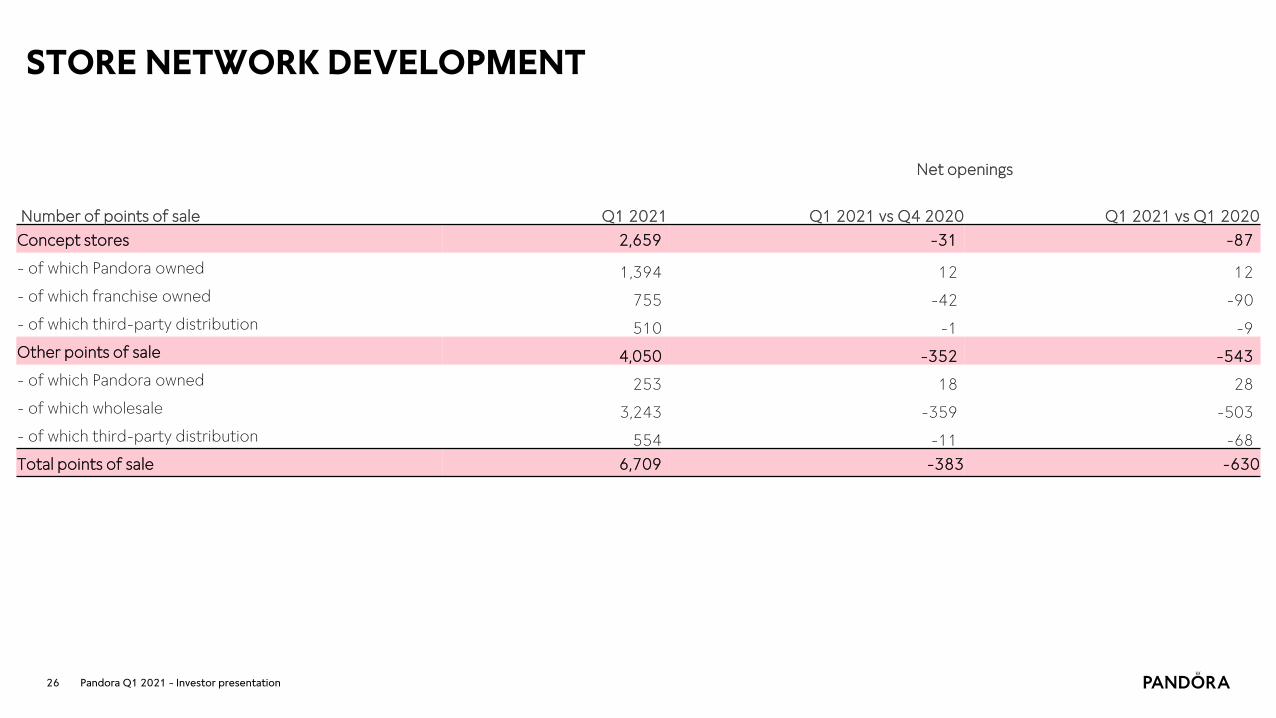
STORE NETWORK DEVELOPMENT
Number of points of sale Q1 2021
Net openings
Q1 2021 vs Q4 2020 Q1 2021 vs Q1 2020
Concept stores 2,659 -31 -87
- of which Pandora owned 1,394 12 12
- of which franchise owned 755 -42 -90
- of which third-party distribution 510 -1 -9
Other points of sale 4,050 -352 -543
- of which Pandora owned 253 18 28
- of which wholesale 3,243 -359 -503
- of which third-party distribution 554 -11 -68
Total points of sale 6,709 -383 -630
Pandora Q1 2021 - Investor presentation

27
KEY MARKETS REVENUE AND SELL-OUT GROWTH OVERVIEW
DKK million Q1 2021
Organic Growth vs
2020Sell-out growth
vs 2020Sell-out growth
vs 2019Share of revenue FY 2020
Organic Growth FY/FY
Sell-out growth vs 2020
Share of revenue,FY 2020
UK587 1% -7% -16% 13% 2,960 5% -2% 16%
Italy440 -2% 5% -11% 10% 2,021 -11% -16% 11%
France194 -19% -15% -22% 4% 1,154 -1% -4% 6%
Germany191 7% -16% -22% 4% 1,014 5% 4% 5%
US1,391 62% 81% 52% 31% 4,505 0% 1% 24%
Australia243 18% 29% 5% 5% 1,120 2% -2% 6%
China281 35% 43% -48% 6% 1,261 -35% -35% 7%
Total top-7 markets3,326 - 31% 5% 74% 14,036 - 74%
Rest of Pandora1,174 - -4% -26% 26% 4,973 - 26%
Group4,500 13% 21% -5% 100% 19,009 -11% -12% 100%
Pandora Q1 2021 - Investor presentation

28
CONCEPT STORES PER MARKET
Number of concept stores Q1 2021
Number of concept stores Q4 2020
Number of concept storesQ1 2020
GrowthQ1 2021
/Q4 2020
Growth Q1 2021
/Q1 2020Number of O&O
Q1 2021Number of O&O
Q4 2020Number of O&O
Q1 2020
Growth O&O storesQ1 2021
/Q4 2020
Growth O&O storesQ1 2021
/Q1 2020
UK 216 217 222 -1 -6 138 139 126 -1 12
Russia 174 174 186 0 -12 0 0 0 0 0
Germany 137 138 141 -1 -4 134 134 135 0 -1
Italy 146 146 146 0 0 107 107 107 0 0
France 120 121 121 -1 -1 76 77 77 -1 -1
Spain 91 92 88 -1 3 69 70 70 -1 -1
Poland 55 55 52 0 3 38 38 37 0 1
South Africa 30 30 30 0 0 28 28 28 0 0
Turkey 27 29 30 -2 -3 27 29 30 -2 -3
Ireland 25 26 29 -1 -4 20 21 24 -1 -4
Netherlands 26 25 26 1 0 26 25 26 1 0
Ukraine 31 31 30 0 1 0 0 0 0 0
Portugal 26 26 26 0 0 0 0 0 0 0
Belgium 21 22 24 -1 -3 14 14 15 0 -1
Romania 24 23 23 1 1 12 12 12 0 0
United Arab Emirates 18 17 18 1 0 18 17 18 1 0
Czech Republic 19 19 19 0 0 10 10 10 0 0
Israel 18 17 18 1 0 0 0 0 0 0
Austria 11 11 14 0 -3 9 9 9 0 0
Greece 11 11 14 0 -3 0 0 0 0 0
Denmark 7 7 8 0 -1 7 7 8 0 -1
Saudi Arabia 13 13 13 0 0 0 0 0 0 0
Sweden 7 7 9 0 -2 7 7 9 0 -2
Nigeria 8 8 8 0 0 0 0 0 0 0
US 391 403 403 -12 -12 179 154 156 25 23
Brazil 78 84 91 -6 -13 49 54 54 -5 -5
Canada 77 77 79 0 -2 31 30 23 1 8
Mexico 77 77 76 0 1 49 49 47 0 2
Caribbean 27 27 27 0 0 0 0 0 0 0
China 228 234 238 -6 -10 216 222 227 -6 -11
Australia 123 122 126 1 -3 39 38 38 1 1
Philippines 34 36 34 -2 0 0 0 0 0 0
Malaysia 26 27 32 -1 -6 0 0 0 0 0
Hong Kong 23 24 29 -1 -6 21 22 27 -1 -6
Thailand 22 21 20 1 2 0 0 0 0 0
New Zealand 18 18 18 0 0 9 9 9 0 0
Singapore 11 11 11 0 0 11 11 11 0 0
Rest of the World 263 264 267 -1 -4 50 49 49 1 1
All markets 2659 2690 2746 -31 -87 1394 1382 1382 12 12
Pandora Q1 2021 - Investor presentation

29
PROFITABILITY DEVELOPMENT
DKK million Q1 2021 Q1 2020 FY 2020 FY 2019
Revenue 4,500 4,172 19,009 21,868
Cost of sales -1,065 -942 -4,475 -4,950
Gross profit excl. restructuring costs 3,436 3,230 14,534 16,919
Restructuring costs - -86 -159 -1,016
Gross profit incl. restructuring costs 3,436 3,144 14,375 15,903
Gross margin (excl. restructuring costs) 76.3% 77.4% 76.5% 77.4%
Sales & Distribution expenses -1,471 -1,594 -6,234 -6,259
Marketing expenses -578 -570 -2,717 -2,696
Administrative expenses -484 -428 -1,702 -2,110
EBIT excl. restructuring 903 638 3,881 5,854
Restructuring costs - -348 -1,038 -2,025
EBIT incl. restructuring 903 204 2,684 3,829
EBIT margin excl. restructuring costs 20.1% 15.3% 20.4% 26.8%
Pandora Q1 2021 - Investor presentation
30
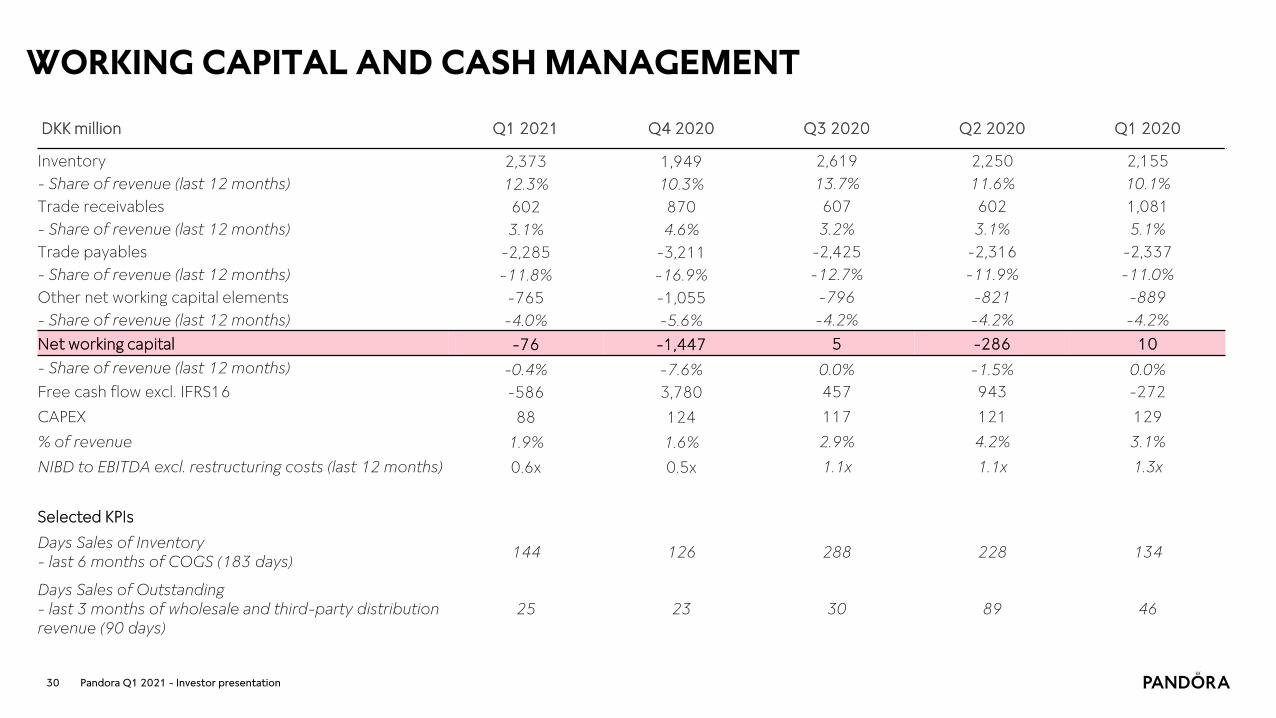
WORKING CAPITAL AND CASH MANAGEMENT
DKK million Q1 2021 Q4 2020 Q3 2020 Q2 2020 Q1 2020
Inventory 2,373 1,949 2,619 2,250 2,155
- Share of revenue (last 12 months) 12.3% 10.3% 13.7% 11.6% 10.1%
Trade receivables 602 870 607 602 1,081
- Share of revenue (last 12 months) 3.1% 4.6% 3.2% 3.1% 5.1%
Trade payables -2,285 -3,211 -2,425 -2,316 -2,337
- Share of revenue (last 12 months) -11.8% -16.9% -12.7% -11.9% -11.0%
Other net working capital elements -765 -1,055 -796 -821 -889
- Share of revenue (last 12 months) -4.0% -5.6% -4.2% -4.2% -4.2%
Net working capital -76 -1,447 5 -286 10
- Share of revenue (last 12 months) -0.4% -7.6% 0.0% -1.5% 0.0%
Free cash flow excl. IFRS16 -586 3,780 457 943 -272
CAPEX 88 124 117 121 129
% of revenue 1.9% 1.6% 2.9% 4.2% 3.1%
NIBD to EBITDA excl. restructuring costs (last 12 months) 0.6x 0.5x 1.1x 1.1x 1.3x
Selected KPIs
Days Sales of Inventory- last 6 months of COGS (183 days)
144 126 288 228 134
Days Sales of Outstanding- last 3 months of wholesale and third-party distribution revenue (90 days)
25 23 30 89 46
Pandora Q1 2021 - Investor presentation

31
HEDGING POLICY AND RAW MATERIALS SHARE OF PRODUCTION COSTS
Commodity hedging policy is to hedgearound 70% of future 12 months use in production
Raw material share of cost of goods sold
27% 24% 24% 25% 24%
10% 9% 8%
12%9% 9% 15%
51% 58% 59% 54%69%
20192016 2017
6%
2018 2020
3% 4%
Other Other raw materials Gold Silver
• Other cost of goods sold consist of labour, cost to third-party set-ups
(i.e. plating) and licence, customs, freight cost, remelt and minor
provisions
• ‘Other raw materials’ decreased in 2020 as plating is done in-house and
expensed mainly through ‘Other’.
For illustrative purposes
70% to 100%
Q1 2021 Q2 2021
70% to 90%
Q4 2021Q3 2021 Q1 2022
100%
50% to 70%
30% to 50%
Hedged Realised
• With an additional 2-4 months time lag from production to sale of the
product and effect on the income statement, the impact of the recent
increase in metal prices will be gradual.
Pandora Q1 2021 - Investor presentation

32
SUSTAINABILITY APPROACH
Pandora supports the UN Sustainable Development Goals Four goals in particular guide our strategy as this is where we can contribute the most.
We believe high-quality jewellery, superior business performance and high ethical standards go hand in hand, and we craft our jewellery with respect for resources, environment and people. We will become carbon neutral in our operations by 2025 and will set a Science Based Target for reducing greenhouse gas emissions across our full value chain by the end of 2021.
We are committed signatories of the United Nations Global Compact and certified member of the Responsible Jewellery Council since 2012.
Frontrunner in ESG Investment PerformanceFor the fifth consecutive year, we received the top rating of AAA in the MSCI ESG Ratings assessment.
Data per Dec. 31, 2020
Our two largest crafting facilities and global office are Leadership in Energy and
Environmental Design (LEED) Certified.
Carbon neutralin own operations
by 2025
100% renewable energyat our crafting facilities
achieved in 2020
Committed to set aScience Based Target
to reduce emissionsacross full value chain
90%of waste was
recycled at our crafting facilities
in 2020.
As the world's largest jewellery maker, we are determined to reduce our climate footprint and help set an example for the wider industry.
Pandora Q1 2021 - Investor presentation
1) LOW-CARBON BUSINESS
Read more in our Sustainability Report released 4 May 2021

33
Data per Dec. 31, 2020
>99%of all stones are
man-made
100% certified silver and gold grain suppliers
From 60%1 recycled in 2020 to 100% in 2025
By 2025, 100% of products will
be made from recycled silver and gold
Responsible Sourcing
ProgrammePandora is committed
to ensuring that our business practices,
including our suppliers, live up to high social and environmental
standards.
Partnering with UNICEF to empower young peoplePandora and UNICEF have partnered to support the most vulnerable children, especially girls, around the world to lead healthier and safer lives and fulfil their potential. Through sale of Jewellery and other initiatives, Pandora will raise funds for UNICEF’s important work. During the first partnership year, Pandora raised USD 3.4 million for UNICEF.
Inclusive and fair workspaceWe work to ensure a positive working environment for our employees across manufacturing, retail, distribution, and in our offices is a top priority and one of our fundamental responsibilities as an employer.
Inclusivity and diversity are essential parts of the Pandora brand, and in 2020 we conducted a company-wide anonymous survey to gauge employees’ views on what is going well and where we collectively need to improve. The survey results will inform a new inclusion and diversity strategy.
+1M USDdonated to COVID-19 relief in
2020.
>200 colleaguesFrom over 40 different countries joined our global office in 2020
3) INCLUSIVE & FAIR CULTURE2) CIRCULAR INNOVATION
Pandora Q1 2021 - Investor presentation
Read more in our Sustainability Report released 4 May 2021
34
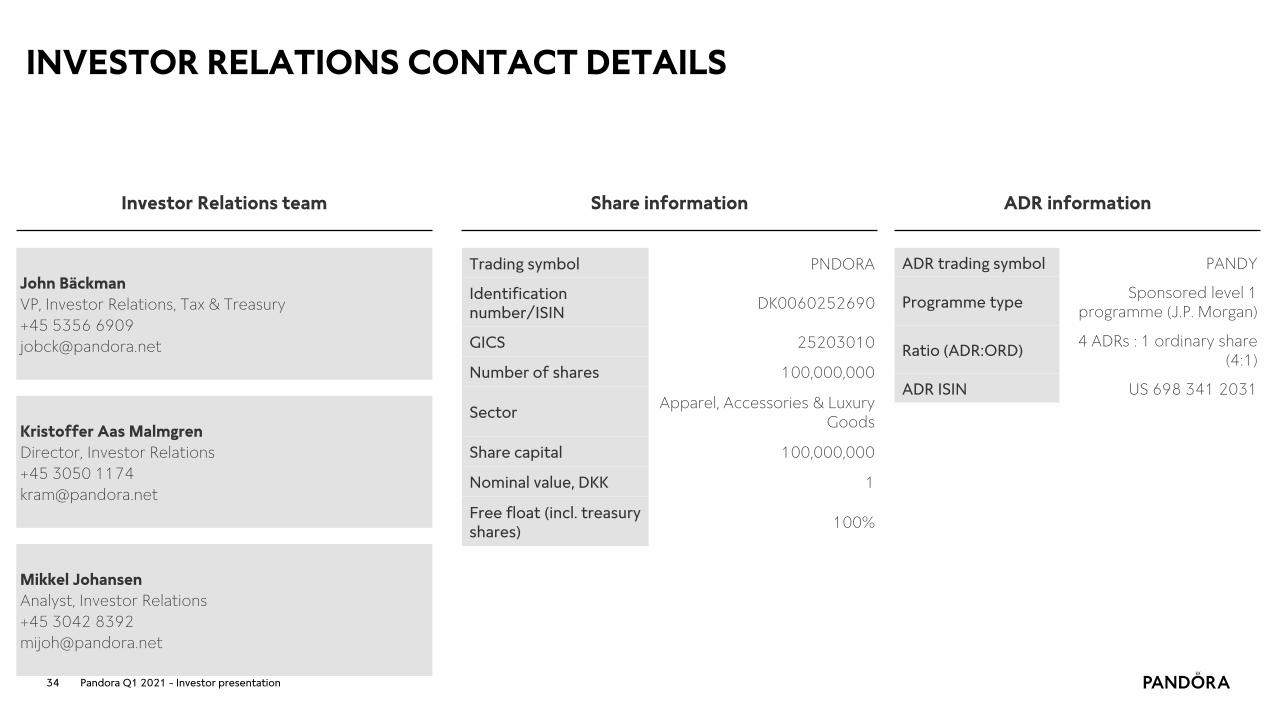
INVESTOR RELATIONS CONTACT DETAILS
Kristoffer Aas Malmgren
Director, Investor Relations
+45 3050 1174
John Bäckman
VP, Investor Relations, Tax & Treasury
+45 5356 6909
Trading symbol PNDORA
Identification number/ISIN
DK0060252690
GICS 25203010
Number of shares 100,000,000
SectorApparel, Accessories & Luxury
Goods
Share capital 100,000,000
Nominal value, DKK 1
Free float (incl. treasury shares)
100%
ADR information
ADR trading symbol PANDY
Programme typeSponsored level 1
programme (J.P. Morgan)
Ratio (ADR:ORD)4 ADRs : 1 ordinary share
(4:1)
ADR ISIN US 698 341 2031
Investor Relations team Share information
Mikkel Johansen
Analyst, Investor Relations
+45 3042 8392
Pandora Q1 2021 - Investor presentation

Pandora Q4 2020 - Investor presentation