Embed Size (px)
Citation preview

Palynological Census Data from Surface Samples in SouthFlorida
Debra A. Willard and Lisa M. Weimer
U.S. Geological Survey926A National Center
Reston, VA 20192
U.S. Geological Survey Open-File Report 97-867
Prepared in cooperation with the South Florida Water Management District
This report is preliminary and has not been reviewed for conformity with U.S. Geological Surveyeditorial standards or with the North American Stratigraphic Code. Any use of trade, product, or
firm names is for descriptive purposes only and does not imply endorsement by the U.S.Government.
1997
Palynological Census Data from Surface Samples in South Florida
by Debra A. Willard and Lisa M. Weimer
INTRODUCTION
Understanding the distribution and abundance of pollen of various plants in modern
sediments and their relationship to source plant distribution and abundance is critical for accurate
interpretation of past vegetational patterns reconstructed from down-core sediments. Such
evidence is particularly important for work supporting restoration efforts, in which palynological
and paleobotanical analyses are used to reconstruct vegetational response to environmental
changes and to guide restoration goals for a sustainable ecosystem. Such work is ongoing in
south Florida, and this report summarizes the preliminary results from the first 28 of 80 surface
samples collected throughout the historic Everglades, from the Water Conservation Areas south
to Florida Bay. These data form a regional database of pollen distribution and abundance in
surface sediments in the major vegetational types over most of the historic Everglades and
supplements earlier work by Riegel (1965), covering an area from the Shark River Slough into
Whitewater Bay. Such data have been used in other studies to identify modern analogs for down-
core assemblages, improving the accuracy of vegetational interpretation from the pollen record
(Overpeck, and others, 1985, 1992). Ultimately, this complete dataset will be used for statistical
comparison with down-core pollen assemblages from the historic Everglades to determine
which, if any, modern samples are close modern analogs to those deposited over the last few
thousand years. This report presents assemblage data generated to date and describes the
relationship between taxonomic abundance in the pollen record and standing vegetation based on
this initial dataset.

ACKNOWLEDGEMENTS
This work would have been impossible without the assistance of the South Florida Water
Management District, which provided logistical support, financial support, and assistance in site
selection. In particular, we thank Steve Davis, Tom Fontaine, Christopher McVoy, Winifred
Park, Peter Rawlik, and Ken Rutchey for their assistance and J.K. Wells for his piloting expertise
on the numerous helicopter trips that provided access to the sample sites. We also thank
Rotenberger and Holey Land Wildlife Management Areas, Loxahatchee National Wildlife
Refuge, Everglades National Park, and Big Cypress National Preserve for their cooperation in
providing access to their lands. Field assistance was provided by Christine Bates (Big Cypress),
Chuck Holmes, Jim Herring, Bill Orem, Terry Lerch, Marci Marot, Bob Halley, Neil Waibel,
Patrick Buchanan, and Keith Ludwig (U.S.Geological Survey), Christopher McVoy and
Winifred Park (South Florida Water Management District), Tim Towles (Florida Game and
Fresh-Water Fish Commission), and Kim Livengood (U.S. Fish and Wildlife Service).
Assistance in laboratory processing and graphics production was provided by Patrick Buchanan,
Tom Sheehan, and Neil Waibel (U.S.G.S.). Thomas Cronin and Scott Ishman provided helpful
comments on the manuscript. This research was supported by the the South Florida Ecosystem
Restoration Initiative at the U.S. Geological Survey.
METHODS OF INVESTIGATION
Two types of surface samples were acquired: samples from short push cores collected
solely for analysis of the surface centimeter of peat and samples from the tops of piston cores
collected as parts of other studies. The sample sites were selected to cover a maximum area and
number of vegetational types ( Figure 1, Table 1). Short peat cores were collected by moving

LAKE
OKEECHOBEE
Alligator Alley
Tamiami Trail
BISCAYNE
BAY
FLORIDA BAY
WCA 2B
WCA 2
WCA 1
WCA 3A
WCA 3B
BIGCYPRESSNATIONALPRESERVE
EVERGLADESAGRICULTURAL
AREA
C-139BASIN
EVERGLADESNATIONAL
PARK 25 30'0
26 30'0
27 00'0
26 00'0
25 00'0
25 30’0
26 30’0
27 00'0
26 00’0
25 00'0
8100
’0
8030
’0
8000
’0
8100
'0
8030
'0
8000
'0
+
+
+++
+
++
+
+
+
+
+
+
+
+++
++
+
+
+
+
+
+++
5
1 2
4
36
7
11
910138 14
12
1516
17
1918
20
232221
2426
28
2725
Figure 1: Location of Surface Sample Sites in Southern Florida.Squares Indicate Sites Analyzed in this Report. NumbersCorrespond to Localities described in Table 1.
0 5 10 MILES

Table 1. Sample localities in southern Florida and vegetation present at each site.Map ID Site Name Site Location Latitude Longitude Vegetation Type Disturbance
7 Site F1 WCA 2A 26°16.892'N 80°18.407'W Cattail marsh, monospecific stand Canal/levee6 USGS Gage 15 North WCA 2A 26°23.23'N 80°22.85'W Cattail marsh near canal, with Eichornia, grasses and sedges Canal/levee
25 Mud Creek Site 1 Mud Creek, ENP 25°13.191'N 80°36.279'W Dwarf mangrove swamp, primarily Rhizophora Isolated27 Taylor Creek Site 1A Taylor Creek, ENP 25°11.863'N 80°38.598'W Dwarf mangrove swamp, primarily Rhizophora Isolated28 Taylor Creek Site 2 Taylor Creek, ENP 25°12.339'N 80°38.641'W Dwarf mangrove swamp, primarily Rhizophora Isolated19 USGS Gage 65 South WCA 3A 25°48.86'N 80°43.20'W Sawgrass Marsh, with open water areas with Nymphaea, Monitoring station
Utricularia, and periphyton15 CA315 (AAS) WCA 3A 25°58.455'N 80°40.129'W Sawgrass marsh, with Nymphaea and Sagittaria Monitoring station12 WCA 3A Site 3-4-4 South WCA 3A 26°02.146'N 80°28.165'W Sawgrass Marsh near tree island, with Nymphaea Isolated9 WCA 3A Site 3-4-3 WCA 3A 26°10.213'N 80°36.525'W Sawgrass Marsh, with Sagittaria and some Typha; Salix and bays nearby. Isolated8 USGS Gage 62 West WCA 3A 26°10.46'N 80°45.09'W Sawgrass Marsh, with Sagittaria, Nymphaea, Typha and Utricularia Monitoring station
13 USGS Gage 63 Northeast WCA 3A 26°11.32'N 80°31.86'W Sawgrass Marsh, with Sagittaria and Nymphaea Monitoring station10 WCA 3A Site 3-4-2 East WCA 3A 26°11.402'N 80°31.386'W Broad Leaf Marsh near tree island with Sagittaria, Utricularia, Cladium, Isolated
Typha, and Salix16 USGS Gage 76 North WCA 3B 25°00.45'N 80°28.96'W Sawgrass Marsh, with Sagittaria and Nymphaea, scattered Monitoring station
Typha. Periphyton present17 USGS Gage 34 East WCA 3B 25°52.15'N 80°29.10'W Sawgrass marsh near Canal, with some Nymphaea and Sagittaria. Monitoring station
Melaleuca island nearby 3 EPA Site 7 Loxahatchee NWR 26°28.873'N 80°24.930'W Sawgrass marsh with Nymphaea Monitoring station
23 Taylor Slough Site 7 Taylor Slough 25°17.231'N 80°38.780'W Sawgrass marsh, with Nymphaea, some Rhizophora, and periphyton Isolated20 Taylor Slough Site 2 North Taylor Slough 25°24.306'N 80°38.598'W Sawgrass Marsh, with Sagittaria and periphyton Isolated24 Loop Road Site 3 Southwest ENP 25°16.718'N 80°47.713'W Sawgrass Marsh, with short sparse Cladium, dwarf Rhizophora, Near road
Myrica, Cocoplum, grasses and sedges. Periphyton abundant.22 Loop Road Site 1 Southwest ENP 25°19.169'N 80°47.713'W Sawgrass Marsh, Taxodium, Sagittaria, and Yucca (rare) Near road5 Rotenberger Site 1 Rotenberger WMA 26°21.800'N 80°50.946'W Sawgrass Marsh (short Cladium), Smilax, Pontederia, Isolated
Potamogeton and Scirpus26 Taylor Slough Site 14 Mid Taylor Slough 25°12.778'N 80°44.184'W Sawgrass Marsh, with Rhizophora, Sagittaria and Typha Isolated14 WCA 3A Site 3-4-1 East WCA 3A 26°10.012'N 80°28.165'W Mixed sawgrass-Cattail marsh near Canal, with Sagittaria and Nymphaea Canal/levee11 Site U3 WCA 2A 26°17.250'N 80°24.680'W Mixed sawgrass-cattail marsh Monitoring station1 Loxahatchee Site 1 Loxahatchee NWR 26°31.008'N 80°20.340'W Water Lily slough. Nymphaea dominant with Panicum and Isolated
Cladium fringe2 Loxahatchee Site 4 Loxahatchee NWR 26°31.365'N 80°20.522'W Water Lily slough near tree island, Nymphaea dominant Isolated
21 Loop Road Site 2 Southwest ENP 25°19.169'N 80°47.911'W Hardwood hammock periphery, with Cladium, Sagittaria, Utricularia, Near roadCypress, Ferns, Chrysobalanus and Myrica
4 Loxahatchee Site 3 Loxahatchee NWR 26°31.365'N 80°20.340'W Tree island periphery, with Bays, Ilex, Salix, Myrica and ferns Isolated18 Big Cypress Site 4-1-1 Big Cypress Preserve 25°46.769'N 81°5.43'W Cypress strand with scrub oaks and bromeliads Near Loop Road

aside as much surface vegetation as possible and beginning the core at the actual peat surface.
The short push cores (< 1 foot long) were collected in 4-inch core barrels, capped and
transported to the laboratory facilities. Sampling was accomplished by extruding the core slowly
to drain off surface water and removing the surface 1 cm of peat as the surface sample. When
substantial periphyton (floating algal mats consisting of green- and blue-green algae and
diatoms) was present, this was sampled separately and labeled as such. For surface samples from
piston cores, the top sample was used, which either was 1 cm or 2 cm thick, depending on the
sampling strategy for the core. At each surface sample site, notes on surrounding vegetation, and
the proximity to disturbance were made, and these are provided along with locality information
in Table 1 for all sites discussed in this report.
Peat samples weighing approximately 0.5 g were used for pollen preparation. Samples
were dried and weighed before being spiked with Lycopodium marker tablets for calculation of
absolute pollen concentrations (Stockmarr, 1971). Samples were treated with dilute HCl to
dissolve the marker tablet, neutralized with deionized water, and rinsed twice with glacial acetic
acid to dry the material for acetolysis. Samples were acetolyzed in a hot water bath for 10
minutes, neutralized, and treated with 10% KOH in a hot water bath for 15 minutes. After
neutralization, the samples were sieved with 149 µm and 10 µm nylon mesh to remove
extraneous plant material and clay-sized particles. Some samples were run through a heavy-
liquid separation with ZnCl2 (S.G. = 2.1) to remove sand and other mineral matter. The pollen
residue was mixed with warm glycerine jelly and mounted on microscope slides for examination.
Absolute pollen concentrations were calculated using the marker-grain method described
by Benninghoff (1962). Marker tablets of Lycopodium spores were the source of the exotic
grains, and the quantity of Lycopodium spores in the marker tablets was determined by the

manufacturer with a Coulter Counter following the procedures of Stockmarr (1973). The
concentration of spores in these tablets is 12,542 +/- 416.
Absolute pollen concentration was calculated using the formula (Maher, 1981):
pollen per gram dry sediment =
((pollen grains counted/marker grains counted) x 12,542)/weight of sediment.
To calculate percent abundance, at least 100 grains were counted per sample. Ideally, 300
grains were counted, but in some samples the high proportion of phytodebris compared to pollen
made acceptance of lower numbers necessary. Percent abundance of each taxon is provided in
Table 2.
ANALYSIS AND DISCUSSION OF SURFACE SAMPLE DATA
The Q-mode cluster analysis using the Pearson correlation coefficient and average
linkage (Fig. 2) resulted in definition of two sample groupings. There are three outliers,
representing single samples from distinct vegetational assemblages; in each, more than half the
assemblage is comprised of a diagnostic taxon. The first outlier represents a bay-holly tree island
from Loxahatchee NWR and includes 64% Ilex (holly) pollen. The second was collected in a
cypress strand in Big Cypress National Preserve and has 52% TCT
(Taxodiaceae/Cupressaceae/Taxaceae) pollen, and the third was collected in a broad-leaf marsh
in WCA 3A and is characterized by 59% Sagittaria (arrowhead) pollen. As further samples from

Table 2. Percent abundance of pollen taxa found in surface samples of peats, southern Florida
SA
MP
LE S
ITE
TRE
ES
AN
D S
HR
UB
S
Ace
r (m
aple)
Aln
us (a
lder)
Ann
onac
eae
(pond
apple
)
Avi
cenn
ia (b
lack m
angro
ve)
Bet
ula
(birch
)
Bum
elia
(buc
kthorn
)
Bur
sera
(gu
mbo l
imbo
)
Car
ya (h
ickory
)
Cas
uarin
a (A
ustra
lian p
ine)
Cel
tis (h
ackb
erry)
Cep
hala
nth
us (b
utton
bush
)
cf. P
lane
ra (p
laner
tree)
Con
ocar
pus
(butto
nwoo
d)
Dio
spyr
os (p
ersim
mon)
Frax
inus
(ash
)
Ilex
(holly
)
Liqu
idam
bar
(swee
tgum)
USGS Gage 15 0.00 0.00 0.00 0.00 0.00 0.00 0.00 0.00 0.00 0.00 0.00 0.00 0.00 0.00 0.00 0.00 0.00USGS Gage 34 0.00 0.00 0.00 0.00 0.00 0.56 0.00 0.56 0.00 0.00 0.00 0.00 0.00 0.00 0.00 0.00 0.00USGS Gage 65 0.00 0.00 0.00 0.00 0.00 0.00 0.00 0.00 0.00 0.00 6.67 0.00 0.00 0.00 0.00 0.00 0.00USGS Gage 63 0.00 0.00 0.00 0.00 0.00 0.00 0.00 0.00 0.00 0.00 0.00 0.00 0.00 0.00 0.00 0.00 0.00USGS Gage 76 0.00 0.00 0.00 0.00 0.00 0.00 0.00 0.00 0.00 0.00 6.19 0.00 0.00 0.00 0.00 0.00 0.00USGS Gage 62 0.00 0.00 0.00 0.00 0.00 0.00 0.00 0.00 0.00 0.00 1.93 0.00 0.00 0.00 0.48 0.00 0.00WCA 3A Site 3-4-1 0.00 0.00 0.00 0.00 0.00 0.00 0.00 0.00 0.89 0.00 0.00 0.00 0.00 0.00 0.00 0.00 0.00WCA 3A Site 3-4-2 0.00 0.00 0.00 0.00 0.00 0.00 0.00 0.00 0.00 0.00 0.00 0.00 0.00 0.00 0.00 0.00 0.00WCA 3A Site 3-4-3 0.00 0.00 0.00 0.00 0.00 0.00 0.00 0.00 0.46 0.00 0.00 0.00 0.00 0.00 0.00 0.00 0.00WCA 3A Site 3-4-4 0.00 0.63 0.00 0.00 0.00 0.31 0.00 2.19 0.63 0.00 0.31 0.31 0.00 0.00 0.00 0.00 0.00Loxahatchee Site 1 0.00 0.38 0.00 0.00 0.00 0.00 0.00 2.30 1.92 0.00 0.00 0.00 0.00 0.00 0.00 6.90 0.00Loop Road Site 2 0.37 0.00 0.00 0.00 0.00 0.00 0.00 0.37 0.00 0.00 3.33 0.00 0.00 1.11 0.00 0.37 0.00Loxahatchee Site 3 0.00 0.67 0.00 0.00 0.00 0.00 0.00 0.34 0.67 0.34 0.00 0.00 0.00 0.00 0.00 63.76 0.00Loxahatchee Site 4 0.00 0.00 0.00 0.00 0.00 0.00 0.00 1.15 0.77 0.38 0.00 0.00 0.00 0.00 0.00 4.62 0.00Loop Road Site 3 0.00 0.00 0.00 0.00 0.00 0.00 0.00 0.00 0.00 0.00 1.18 0.00 0.00 0.00 0.00 3.24 0.00Loop Road Site 1 0.00 0.00 0.00 0.00 0.00 0.00 0.00 0.00 0.00 0.00 0.66 0.00 0.00 0.00 0.00 0.00 0.00Taylor Creek Site 1A 0.00 0.49 0.00 1.46 0.00 0.98 2.93 1.95 0.98 0.00 0.00 0.00 1.95 0.00 0.00 1.46 0.49Taylor Slough Site 2 0.29 0.00 0.86 0.00 0.00 0.00 0.00 0.57 0.00 0.00 2.59 0.00 0.00 0.00 0.00 0.29 0.00Taylor Slough Site 14 0.00 0.74 0.00 0.00 0.00 1.47 0.00 0.00 0.00 0.00 0.37 0.00 0.00 0.00 0.00 0.00 0.00Rotenberger Site 1 0.00 0.00 0.00 0.00 0.00 0.00 0.00 0.33 0.33 0.00 0.00 0.00 0.00 0.00 0.00 0.00 0.00Taylor Slough Site 7 0.00 0.00 0.00 0.00 0.00 0.00 0.00 0.46 0.00 0.00 0.92 0.00 0.00 0.00 0.00 2.29 0.00CA315 (AAS) 0.00 0.00 0.00 0.00 0.00 0.00 0.00 0.60 2.10 0.00 11.68 0.00 0.00 0.00 0.00 0.00 0.00Big Cypress Site 4-1-1 0.00 0.00 0.00 0.00 0.00 0.00 0.00 1.72 0.00 0.00 0.00 0.00 0.00 0.00 0.00 0.00 0.00EPA Site 7 0.00 0.28 0.00 0.00 0.00 0.00 0.28 0.28 0.56 0.00 0.00 0.00 0.00 0.00 0.00 0.28 0.00Mud Creek Site 1 0.00 0.00 0.00 1.37 1.37 0.00 0.00 0.00 5.48 1.37 0.00 0.00 1.37 0.00 0.00 0.00 0.00Site F1 0.00 0.00 0.00 0.00 0.00 0.00 0.00 0.83 0.00 0.00 0.00 0.00 0.00 0.00 0.00 0.00 0.00Site U3 0.00 0.00 0.00 0.00 0.00 0.56 0.00 1.11 0.00 0.00 0.00 0.00 0.00 0.00 0.00 0.00 0.00Taylor Creek Site 2 0.00 1.55 0.00 2.33 0.00 0.00 0.00 6.98 3.88 0.00 0.00 0.00 3.88 0.00 0.00 0.00 0.00

Table 2. Percent abundance of pollen taxa found in surface samples of peats, southern Florida
SA
MP
LE S
ITE
USGS Gage 15USGS Gage 34USGS Gage 65USGS Gage 63USGS Gage 76USGS Gage 62WCA 3A Site 3-4-1WCA 3A Site 3-4-2WCA 3A Site 3-4-3WCA 3A Site 3-4-4Loxahatchee Site 1Loop Road Site 2Loxahatchee Site 3Loxahatchee Site 4Loop Road Site 3Loop Road Site 1Taylor Creek Site 1ATaylor Slough Site 2Taylor Slough Site 14Rotenberger Site 1Taylor Slough Site 7CA315 (AAS)Big Cypress Site 4-1-1EPA Site 7Mud Creek Site 1Site F1Site U3Taylor Creek Site 2
Lirio
dend
ron (
tulip
tree)
Mag
nolia
(mag
nolia
)
Mel
aleu
ca (M
elaleu
ca)
Myr
ica
(wax
myrt
le)
Nys
sa (t
upelo
)
Palm
ae (p
alm fa
mily)
Pin
us (p
ine)
Que
rcus
(oak
)
Rhi
zoph
ora
(red m
angro
ve)
Sal
ix (w
illow)
Sch
inus
(pep
per t
ree)
Taxo
diace
ae/C
upres
sace
ae/Ta
xace
ae(cy
press
, junip
er, ye
w)U
lmus
(elm
)
HE
RB
AC
EO
US
PLA
NTS
Aster
acea
e (Lo
w-sp
ined T
ype)
Aster
acea
e (hig
h-spin
ed ty
pe)
Aster
acea
e ind
et. (a
ster fa
mily)
0.00 0.00 0.00 1.42 0.00 0.00 3.56 1.07 0.00 3.91 0.00 0.00 0.00 1.78 0.36 0.000.00 0.56 0.00 0.56 0.00 0.00 27.53 2.81 0.00 0.00 0.00 0.00 0.00 1.12 0.00 1.120.00 0.00 0.00 5.00 0.00 0.00 55.00 1.67 0.00 1.67 0.00 0.00 0.00 5.00 0.00 0.000.00 0.00 0.00 0.66 0.00 0.00 5.28 0.33 0.00 0.00 0.00 0.00 0.00 1.65 0.66 1.650.00 0.00 0.00 0.88 0.00 0.00 28.32 2.21 0.00 1.33 0.00 0.00 0.00 1.33 0.00 0.440.00 0.00 0.00 3.38 0.00 0.00 21.26 0.48 0.00 0.00 0.00 0.00 0.00 8.21 1.45 4.830.00 0.00 0.00 2.37 0.00 0.00 5.62 1.18 0.00 0.00 0.00 0.00 0.00 1.48 0.59 0.000.00 0.00 0.00 0.00 0.00 0.00 0.82 0.00 0.00 0.00 0.00 0.00 0.00 0.00 0.00 0.000.00 0.00 0.00 2.28 0.00 0.00 4.11 1.83 0.00 0.00 0.00 0.00 1.37 0.91 0.00 0.910.00 0.00 0.00 27.90 0.00 0.00 35.42 4.70 0.00 0.00 0.00 0.00 0.63 2.82 0.31 0.310.38 0.00 0.00 24.14 0.00 0.38 22.22 3.83 0.00 0.77 0.00 0.00 0.00 5.75 0.00 0.000.00 0.00 0.00 35.93 0.00 0.00 8.52 1.11 0.00 0.74 0.00 0.00 0.00 2.59 21.85 12.220.00 0.00 0.00 23.83 0.00 0.00 1.68 1.34 0.00 0.00 0.00 0.00 0.00 1.68 0.00 1.010.00 0.00 0.00 17.31 0.00 0.00 25.00 1.92 0.00 0.00 0.00 0.38 0.00 9.62 0.38 0.380.00 0.00 0.00 34.41 0.29 0.00 39.12 2.06 0.29 0.29 0.00 0.29 0.00 4.12 0.59 0.000.00 0.00 0.00 18.54 0.00 0.00 60.93 3.31 1.99 0.00 0.00 0.00 0.00 5.30 2.65 0.000.00 0.00 0.00 34.63 0.00 0.00 13.17 2.93 7.80 0.00 0.00 0.00 0.00 1.95 4.39 0.000.00 0.00 0.29 6.90 0.00 0.00 18.10 4.60 1.15 0.57 0.00 0.29 0.29 13.22 10.34 0.860.00 0.00 0.00 56.25 0.00 0.00 5.15 3.31 4.04 0.00 0.00 0.00 0.00 3.31 1.10 0.000.00 0.00 0.00 0.66 0.00 0.00 21.05 0.33 0.00 0.00 0.00 0.00 0.00 0.99 1.64 0.330.00 0.00 0.00 11.00 0.00 0.00 50.50 5.96 0.00 0.00 0.00 0.92 0.00 12.39 0.46 0.460.00 0.00 0.00 8.68 0.00 0.00 9.28 3.29 0.00 0.60 0.00 0.00 0.00 5.99 3.29 0.300.00 0.00 0.00 3.45 0.00 0.00 25.86 5.17 0.00 1.72 0.00 #### 0.00 1.72 1.72 5.170.00 0.00 0.00 7.54 0.00 0.00 17.60 1.12 0.00 0.00 0.00 0.00 0.00 8.94 2.51 0.560.00 0.00 0.00 5.48 0.00 0.00 32.88 12.33 5.48 1.37 0.00 0.00 0.00 1.37 0.00 4.110.00 0.00 0.00 0.00 0.00 0.00 0.00 0.83 0.00 0.00 0.00 0.00 0.00 0.28 0.83 0.280.00 0.00 0.00 2.22 0.00 0.00 18.33 6.11 0.00 0.00 0.00 0.00 0.00 15.56 1.67 1.110.00 0.00 0.00 8.53 0.00 0.00 21.71 8.53 11.63 0.00 0.78 0.00 0.00 0.00 0.00 6.20
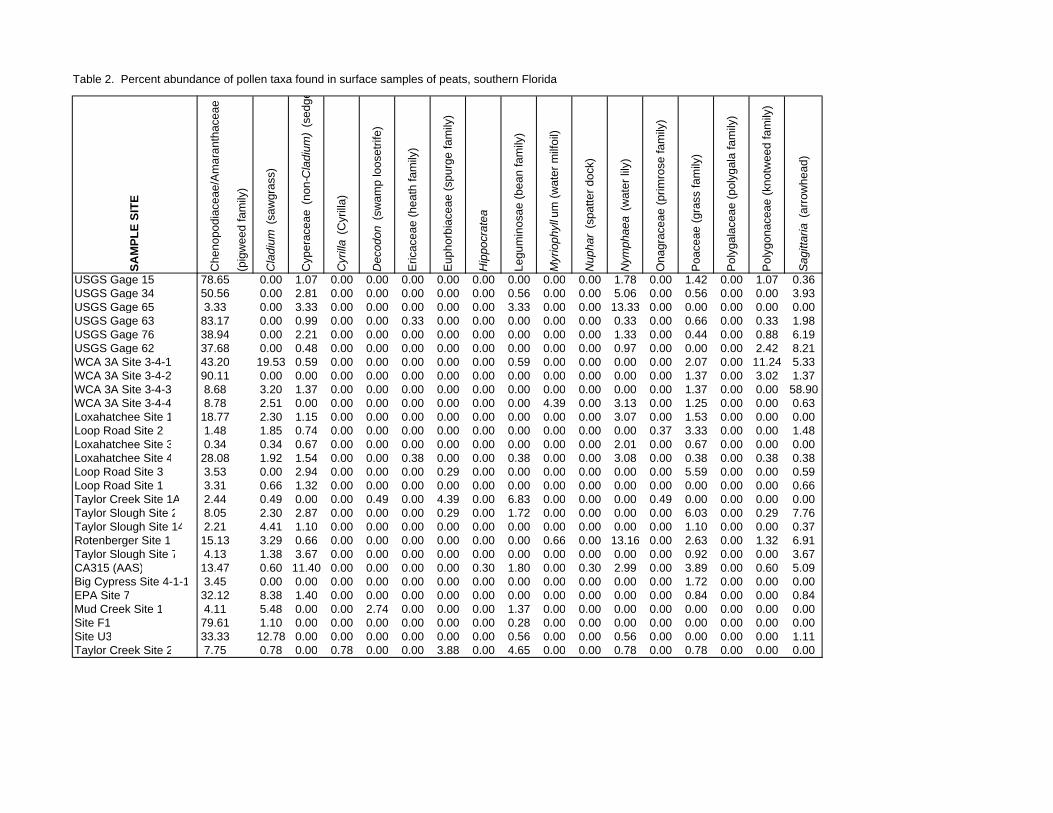
Table 2. Percent abundance of pollen taxa found in surface samples of peats, southern Florida
SA
MP
LE S
ITE
USGS Gage 15USGS Gage 34USGS Gage 65USGS Gage 63USGS Gage 76USGS Gage 62WCA 3A Site 3-4-1WCA 3A Site 3-4-2WCA 3A Site 3-4-3WCA 3A Site 3-4-4Loxahatchee Site 1Loop Road Site 2Loxahatchee Site 3Loxahatchee Site 4Loop Road Site 3Loop Road Site 1Taylor Creek Site 1ATaylor Slough Site 2Taylor Slough Site 14Rotenberger Site 1Taylor Slough Site 7CA315 (AAS)Big Cypress Site 4-1-1EPA Site 7Mud Creek Site 1Site F1Site U3Taylor Creek Site 2
Chen
opod
iacea
e/Ama
rantha
ceae
(pigw
eed f
amily
)
Cla
dium
(saw
grass
)
Cype
racea
e (no
n-Cla
dium
) (se
dge)
Cyr
illa
(Cyri
lla)
Dec
odon
(swa
mp lo
osetr
ife)
Erica
ceae
(hea
th fam
ily)
Euph
orbiac
eae (
spurg
e fam
ily)
Hip
pocr
atea
Legu
mino
sae (
bean
fami
ly)
Myr
ioph
yllu
m (w
ater m
ilfoil)
Nup
har
(spatt
er do
ck)
Nym
phae
a (w
ater li
ly)
Onag
racea
e (pri
mros
e fam
ily)
Poac
eae (
grass
fami
ly)
Polyg
alace
ae (p
olyga
la fam
ily)
Polyg
onac
eae (
knotw
eed f
amily
)
Sag
ittar
ia (a
rrowh
ead)
78.65 0.00 1.07 0.00 0.00 0.00 0.00 0.00 0.00 0.00 0.00 1.78 0.00 1.42 0.00 1.07 0.3650.56 0.00 2.81 0.00 0.00 0.00 0.00 0.00 0.56 0.00 0.00 5.06 0.00 0.56 0.00 0.00 3.933.33 0.00 3.33 0.00 0.00 0.00 0.00 0.00 3.33 0.00 0.00 13.33 0.00 0.00 0.00 0.00 0.0083.17 0.00 0.99 0.00 0.00 0.33 0.00 0.00 0.00 0.00 0.00 0.33 0.00 0.66 0.00 0.33 1.9838.94 0.00 2.21 0.00 0.00 0.00 0.00 0.00 0.00 0.00 0.00 1.33 0.00 0.44 0.00 0.88 6.1937.68 0.00 0.48 0.00 0.00 0.00 0.00 0.00 0.00 0.00 0.00 0.97 0.00 0.00 0.00 2.42 8.2143.20 19.53 0.59 0.00 0.00 0.00 0.00 0.00 0.59 0.00 0.00 0.00 0.00 2.07 0.00 11.24 5.3390.11 0.00 0.00 0.00 0.00 0.00 0.00 0.00 0.00 0.00 0.00 0.00 0.00 1.37 0.00 3.02 1.378.68 3.20 1.37 0.00 0.00 0.00 0.00 0.00 0.00 0.00 0.00 0.00 0.00 1.37 0.00 0.00 58.908.78 2.51 0.00 0.00 0.00 0.00 0.00 0.00 0.00 4.39 0.00 3.13 0.00 1.25 0.00 0.00 0.6318.77 2.30 1.15 0.00 0.00 0.00 0.00 0.00 0.00 0.00 0.00 3.07 0.00 1.53 0.00 0.00 0.001.48 1.85 0.74 0.00 0.00 0.00 0.00 0.00 0.00 0.00 0.00 0.00 0.37 3.33 0.00 0.00 1.480.34 0.34 0.67 0.00 0.00 0.00 0.00 0.00 0.00 0.00 0.00 2.01 0.00 0.67 0.00 0.00 0.0028.08 1.92 1.54 0.00 0.00 0.38 0.00 0.00 0.38 0.00 0.00 3.08 0.00 0.38 0.00 0.38 0.383.53 0.00 2.94 0.00 0.00 0.00 0.29 0.00 0.00 0.00 0.00 0.00 0.00 5.59 0.00 0.00 0.593.31 0.66 1.32 0.00 0.00 0.00 0.00 0.00 0.00 0.00 0.00 0.00 0.00 0.00 0.00 0.00 0.662.44 0.49 0.00 0.00 0.49 0.00 4.39 0.00 6.83 0.00 0.00 0.00 0.49 0.00 0.00 0.00 0.008.05 2.30 2.87 0.00 0.00 0.00 0.29 0.00 1.72 0.00 0.00 0.00 0.00 6.03 0.00 0.29 7.762.21 4.41 1.10 0.00 0.00 0.00 0.00 0.00 0.00 0.00 0.00 0.00 0.00 1.10 0.00 0.00 0.3715.13 3.29 0.66 0.00 0.00 0.00 0.00 0.00 0.00 0.66 0.00 13.16 0.00 2.63 0.00 1.32 6.914.13 1.38 3.67 0.00 0.00 0.00 0.00 0.00 0.00 0.00 0.00 0.00 0.00 0.92 0.00 0.00 3.6713.47 0.60 11.40 0.00 0.00 0.00 0.00 0.30 1.80 0.00 0.30 2.99 0.00 3.89 0.00 0.60 5.093.45 0.00 0.00 0.00 0.00 0.00 0.00 0.00 0.00 0.00 0.00 0.00 0.00 1.72 0.00 0.00 0.0032.12 8.38 1.40 0.00 0.00 0.00 0.00 0.00 0.00 0.00 0.00 0.00 0.00 0.84 0.00 0.00 0.844.11 5.48 0.00 0.00 2.74 0.00 0.00 0.00 1.37 0.00 0.00 0.00 0.00 0.00 0.00 0.00 0.0079.61 1.10 0.00 0.00 0.00 0.00 0.00 0.00 0.28 0.00 0.00 0.00 0.00 0.00 0.00 0.00 0.0033.33 12.78 0.00 0.00 0.00 0.00 0.00 0.00 0.56 0.00 0.00 0.56 0.00 0.00 0.00 0.00 1.117.75 0.78 0.00 0.78 0.00 0.00 3.88 0.00 4.65 0.00 0.00 0.78 0.00 0.78 0.00 0.00 0.00

Table 2. Percent abundance of pollen taxa found in surface samples of peats, southern Florida
SA
MP
LE S
ITE
USGS Gage 15USGS Gage 34USGS Gage 65USGS Gage 63USGS Gage 76USGS Gage 62WCA 3A Site 3-4-1WCA 3A Site 3-4-2WCA 3A Site 3-4-3WCA 3A Site 3-4-4Loxahatchee Site 1Loop Road Site 2Loxahatchee Site 3Loxahatchee Site 4Loop Road Site 3Loop Road Site 1Taylor Creek Site 1ATaylor Slough Site 2Taylor Slough Site 14Rotenberger Site 1Taylor Slough Site 7CA315 (AAS)Big Cypress Site 4-1-1EPA Site 7Mud Creek Site 1Site F1Site U3Taylor Creek Site 2
Typh
a (ca
ttail)
Um
belli
fera
e (p
arsl
ey fa
mily
)
Utri
cula
ria (b
ladde
rwort
)
Total
polle
n cou
nted
Polle
n con
centr
ation
(poll
en/gr
am
dry se
dimen
t)
3.20 0.00 0.00 285 44,6810.00 0.56 0.56 181 113,5050.00 0.00 0.00 61 6,3490.66 0.33 0.00 306 142,1438.85 0.44 0.00 226 77,6578.21 0.00 0.00 207 77,4984.73 0.00 0.30 345 131,1210.27 0.00 0.00 364 #######12.79 0.00 0.91 224 114,2040.94 0.63 0.31 331 399,1730.77 0.00 0.77 269 108,1350.74 0.00 0.00 290 40,4130.00 0.00 0.00 304 433,2690.77 0.00 0.38 278 290,5561.18 0.00 0.00 343 22,1290.66 0.00 0.00 173 3,2410.00 0.00 0.49 221 42,7740.29 1.72 0.57 375 17,68114.34 0.00 0.00 212 12,61929.61 0.00 0.66 314 76,4700.92 0.00 0.00 218 6,0040.30 0.30 0.30 334 119,6670.00 0.00 0.00 ----------- ---------------0.56 0.00 0.00 358 374,1700.00 0.00 0.00 75 11,47114.60 0.00 0.00 365 653,9761.11 0.00 0.00 188 88,9773.10 0.00 0.00 137 11,780

Loxahatchee Site 3Big Cypress Site 4-1-1
Taylor Slough Site 14
Taylor Creek Site 1ALoop Road Site 2
Taylor Slough Site 2Alligator Alley South
Loxahatchee Site 4Loxahatchee Site 1WCA 3A Site 3-4-4
Loop Road Site 3USGS Stream Gage 65
Loop Road Site 1Taylor Slough Site 7
Mud Creek Site 1Taylor Creek Site 2Rotenberger Site 1
Site U3Loxahatchee Site 7
USGS Stream Gage 62USGS Stream Gage 76USGS Stream Gage 34
Site F1
USGS Stream Gage 15USGS Stream Gage 63
WCA Site 3-4-2WCA Site 3-4-1
WCA Site 3-4-3
0.0 0.1 0.2 0.3 0.4 0.5 0.6 0.7 0.8 0.9 1.0
A
B
Figure 2: Cluster diagram from Q-mode cluster analysis of 28 surface samples, southern Florida.
Distances

these vegetation types are analyzed, the robustness of these assemblages will be determined.
The two clusters can be broadly characterized as those from the Water Conservation
Areas north of Alligator Alley, which primarily consist of "disturbed" sites at monitoring stations
and near canals, levees, and airboat trails (Cluster B) and those collected in relatively
undisturbed, "pristine" localities, primarily south of Alligator Alley (Cluster A). Sample sites in
Cluster B represent both sawgrass and cattail marsh vegetation; these samples are characterized
by high percentages (30-90%) of Chenopodiaceae/ Amaranthaceae (pigweed) pollen with
varying proportions of Cladium (sawgrass) and Asteraceae (aster) pollen. Sample sites in Cluster
A include sawgrass marsh, mixed sawgrass marsh/slough, and dwarf mangrove vegetation, and
this cluster is characterized by high percentages (usually 10%) of Myrica (wax myrtle) pollen
and low percentages (<10%) of pigweed pollen. The higher proportion of Myrica in Cluster A is
due to sample proximity to either tree islands (both the bay/holly islands of Loxahatchee NWR
and those found in the southern part of the region), the Buttonwood Embankment along Florida
Bay, or roads, which frequently are lined by wax myrtle.
The R-mode cluster analysis (Fig. 3) shows two broad groupings of taxa. Cluster A
includes relatively mesic taxa that are characteristic of tree islands, mangrove fringe
environments, or wet prairies. Cluster B includes marsh and slough taxa, typical of environments
with moderate to long hydroperiods. Within Cluster A, there are three groupings that correlate
with vegetation type. Group A1 includes Myrica, Bumelia (buckthorn), and Bursera (gumbo
limbo), which are most common in hardwood hammocks and maritime forests (Snyder et al,
1994; Johnson and Barbour, 1994). Group A2 consists of mangrove taxa [Rhizophora (red
mangrove), Avicennia (black mangrove), and Conocarpus (buttonwood)], which are the
dominant vegetation in the saline-influenced mangrove fringe along Florida Bay (Odum and

Ilex
Myrica
Bumelia
Bursera
Rhizophora
Avicennia
Conocarpus
Casuarina
Quercus
AsteraceaePoaceae
non-Cladium CyperaceaeCephalanthus
Pinus
Taxodiaceae/Cupressaceae/TaxaceaeSalix
Nymphaea
Typha
Sagitaria
Cladium
Polygonum
Chenopodiaceae/Amaranthaceae
A
B
0.0 0.2 0.4 0.6 0.8 1.0 1.2Distances
Figure 3: Cluster diagram from R-mode cluster analysis of 22 taxa from 28 samples, southern Florida.
A1
A2
A3
B1
B2

McIvor, 1994). Two other trees common in southernmost Florida, Quercus (oak) and Casuarina
(Australian pine), also are included in this group. Group A3 consists of taxa common in wet
prairies: Asteraceae, non-Cladium Cyperaceae (Eleocharis, Rhyncospora, Scirpus, and Cyperus),
and Cephalanthus (buttonbush). Wet prairies have short hydroperiods with seasonal drying
(Kushlan, 1994). The other taxa present in Cluster A (holly, pine, willow, cypress) are trees that
are not restricted to any one vegetation type in this analysis and therefore do not cluster with any
one of the three groups.
Cluster B consists of taxa common in moderate- to long-hydroperiod environments.
Group B1, which includes Nymphaea (waterlily), Typha (cattail), and Sagittaria (arrowhead),
represents taxa characteristic of water-lily, cattail, and broad-leaf marshes (Kushlan, 1994).
Group B2 includes Cladium (sawgrass) and Polygonum (knotweed), characteristic of moderate
hydroperiod sawgrass marshes, and the pigweeds that tend to be most abundant at disturbed or
marginal sites such as levees or tree-island margins.
Interpretation of Vegetational Type from Pollen Evidence
The clustering of these initial samples into groupings reflecting the source vegetation
types (Q-mode) indicates that the use of the modern analog technique with the complete dataset
should provide statistically sound information for vegetational reconstruction based on pollen
assemblages. On a more empirical level, critical abundance levels of several taxa can be defined
to help differentiate vegetational types, albeit in a somewhat less quantitatively rigorous manner.
Because pollen is nearly always transported some distance from its source plant, interpretation of
pollen records in terms of vegetational composition is not as straightforward as for faunal data,

which represent the environment in which the organisms both lived and died. Vegetational
interpretation based the pollen records must take into account both the abundance of source taxa
and their reproductive strategies (Davis, 1963, 1965; Janssen, 1973; Tauber, 1965). Non-local
wind-pollinated plants, such as pine, wax myrtle, and pigweeds, can easily overwhelm pollen
assemblages if the local vegetation is either insect-pollinated or relies primarily on vegetative
reproduction (as many grasses, sedges, and sawgrass do). Thus, higher percentages of wind-
pollinated plants in pollen assemblages may represent either their greater abundance in the
source vegetation or greater abundances of plants that contribute minimal amounts of pollen to
the pollen rain. In core samples, this problem can be addressed by determining the absolute
pollen concentration of various taxa throughout the core. For example, in a core collected along
Taylor Creek near Florida Bay, pine pollen comprises up to 90% of the assemblage in the lower
part of the core and drops to about 10% in higher levels; its concentration, however is constant
throughout the core, indicating that its abundance did not change but that either low pollen
producers were dominant in the lower part of the core or vegetation at that site was very sparse
(Willard and Holmes, 1997). In practice, for accurate interpretation of vegetation from pollen
assemblages one must consider possible modern analogs, percentage and concentration data, and
abundance of any critical taxa. In the following, assemblages from the main vegetation types
analyzed to date are characterized, with primary emphasis on critical taxa that identify the
vegetation.
Loxahatchee Bay-Holly Tree Island Assemblages
Samples collected on and near bay-holly tree islands are the only sites with 5% Ilex
pollen (Fig. 4). These also have around 20% Myrica pollen, and 3-10% aster pollen. Pollen of
Cladium, other Cyperaceae, and Nymphaea also are present consistently at these sites, reflecting

LAKE
OKEECHOBEE
Alligator Alley
Tamiami Trail
BISCAYNE
BAY
FLORIDA BAY
WCA 2B
WCA 2
WCA 1
WCA 3A
WCA 3B
BIGCYPRESSNATIONAL
PRESERVE
EVERGLADESAGRICULTURAL
AREA
C-139BASIN
EVERGLADESNATIONAL
PARK 2530'o
2630'o
2700'o
2600'o
2500'o
2530'o
2630'o
2700'o
2600'o
2500'o
8100
'o
8030
'o
8000
'o
8100
'o
8030
'o
8000
'o
Cephalanthus
Myrica
Nymphaea
Polygonaceae
Chenopodiaceae /Amaranthaceae
Asteraceae
Typha
Sagittaria
Cyperaceae
Ilex
Pinus
Taxodiaceae
Rhizophora
12
34
56 7
8 9 10
11
12
13
14
15
16
17
18
19
20
2122
23
24
25
26 27
28
++ +
++++++ ++++
+ + +
+ ++
+
+
+
++++
+
+
++
+++
++ +
+ ++ + + +
++ + + ++
+++
+
+
+
+++
++++
+++
++
++
+
+ +++
+ +
+
+++ ++
+++
++
+ ++++++++++
++
++++
+
+
+
+ +
+++++
++ +
+
++
+
++++++++
+
+++
+
++
+
+
+
+
+
+
+
+++
++
+
+
+
+
+
+++
Figure 4: Percent Abundance of Taxa Found in 28Surface Samples Collected in Southern Florida
SURFACE SAMPLES INCLUDED IN THIS REPORTADDITIONAL SURFACE SAMPLES FOR ANALYSIS
0 5 10 MILES

the slough vegetation surrounding the tree islands.
Cypress Strand Assemblages
The only sample examined so far from a cypress strand is dominated by cypress pollen
(TCT). Pinus pollen also is common, reflecting the proximity of pinelands to the site, and aster
pollen also is common.
Mangrove Fringe Assemblages
These assemblages typically have 5% Rhizophora (red mangrove) pollen and 15%
Myrica pollen (Figure 4). Other taxa characteristic of this assemblage include buttonwood, black
mangrove, and Australian pine.
Cattail Marsh Assemblages
Cattail pollen is most abundant (8%) in the northern part of WCA 3A, at Rotenberger Site
1, and in high-nutrient sites and those adjacent to canals in WCA 2A. Analysis of a core from
Site F1 in WCA 2A indicates that cattail percentages as low as 3% may reflect its invasion of an
area (Willard, 1997), and further analysis of surface samples is necessary to clarify these
numbers. Typha pollen also is abundant (14%) at one site in the Taylor Slough Delta (Taylor
Slough Site 14) near Seven Palms Lake, where Typha was noted in the area by field workers.
Sawgrass Marsh Assemblages
Samples yielding as little as 2% sawgrass pollen were from sites in which sawgrass is a
prominent component of the vegetation. Most of the typical sawgrass marsh sites in this study,
characterized by thick stands of tall sawgrass, have been altered, either through canal, levee, or
road construction, establishment and visitation of monitoring stations, or through cattail invasion.

Therefore, samples from a truly representative sawgrass marsh have yet to be analyzed.
Presently, the least disturbed sample from a mixed sawgrass/slough site is WCA 3A Site 3-4-1 in
the eastern part of WCA 3A. Although the assemblage from this site included 43% pigweed
pollen, it also included 20% Cladium, 11% Polygonum, and 5% each of Sagittaria and Typha.
Rotenberger Site 1, collected in a relatively pristine area of sawgrass plain with cattail in the
area, also may be fairly representative of a sawgrass or mixed sawgrass/slough community, if the
30% of Typha pollen is disregarded. This assemblage includes 3% Cladium, 13% Nymphaea,
and 7% Sagittaria. Analysis of a core to be collected in the spring, 1998 should clarify how long
Typha has been a dominant factor in those pollen assemblages.
Most of the samples collected in sawgrass marsh and mixed sawgrass marsh/slough in the
northern part of the study area have high percentages of pigweed pollen. The wind-dispersed
pollen of the pigweed family effectively masks the sawgrass component, which utilizes primarily
vegetative reproduction. The much greater abundance of pigweed pollen in the northern part of
the region, on initial inspection, might be attributed to the higher disturbance levels at the sample
sites. All four sites with 75% pigweed pollen are adjacent to canals and levees, which tend to
have higher proportions of weedy species, and most of the other sites in the cluster represent
monitoring stations that are visited regularly and are not representative of pristine conditions for
the region. However, when the downcore record from several cores in these regions are
examined, samples collected around 2,000 BP in WCA 2A (Willard, 1997) show equally high
percentages (70%) of pigweed pollen, so, clearly, modern disturbance is not the only factor
controlling high abundances of this taxon.

Broad-leaf Marsh and Slough Assemblages
As was the case with sawgrass, relatively small percentages of the broad-leaved plants,
such as arrowhead and waterlily, are indicative of these vegetation types. Assemblages with 2%
Nymphaea pollen typically represent slough vegetation; these are found primarily in
Loxahatchee NWR and in southern WCA 3A. More than 4% Sagittaria pollen reflects the
presence of broad-leaf marshes; in these, the pollen of either Nymphaea (longer hydroperiods) or
Sagittaria (more moderate hydroperiods) is a common component.
Disturbed Site Assemblages
Disturbed site assemblages include a number of vegetation types already discussed, but
this grouping is useful for interpreting the last 150 years of record. Disturbed sites are defined as
those near canals, levees, or roads and as those visited frequently by either airboat traffic or
helicopter (such as monitoring stations). These typically have high percentages of weedy species,
such as pigweeds and asters.

REFERENCES
Benninghoff, W.S., 1962, Calculation of pollen and spore density in sediments by addition
of exotic pollen in known quantities: Pollen et Spores, v. 4, p. 332-333.
Davis, M.G., 1963, On the theory of pollen analysis: American Journal of Science, v. 261,
p. 897-912.
Davis, M.B., 1965, Phytogeography and palynology of northestern United States, in
Wright, H.E.. Jr., and Frey, D.G., eds., The Quaternary of the United States,
Princeton, NJ, Princeton University Press, p. 377-401.
Janssen, C.R., 1973, Local and regional pollen deposition, in Birks, H.J.B., and West,
R.G., eds., Quaternary Plant Ecology, New York, John Wiley & Sons, p. 31-42.
Johnson, A.F., and Barbour, M.G., 1994, Dunes and Maritime Forests, in Myers, R.L.,
and Ewel, J.J., eds., Ecosystems of Florida, Orlando, University of Central Florida
Press, p. 429-480.
Kushlan, J.A., 1994, Freshwater Marshes, in Myers, R.L., and Ewel, J.J., eds.,
Ecosystems of Florida, Orlando, University of Central Florida Press, p. 324-363.
Maher, L.J., Jr., 1981, Statistics for microfossil concentration measurements employing
samples spiked with marker grains: Review of Palaeobotany and Palynology, v. 32,
pp. 153-191.
Odum, W.E., and McIvor, C.C., 1994, Mangroves, in Myers, R.L., and Ewel, J.J., eds.,
Ecosystems of Florida, Orlando, University of Central Florida Press, p. 517-548.

Overpeck, J.T., Webb, T., III, and Prentice, I.C., 1985, Quantitative interpretation of
fossil pollen spectra: dissimilarity coefficients and the method of modern analogs:
Quaternary Research, v. 23, p. 87-108.
Overpeck, J.T., Webb, R.S., and Webb, T., III, 1992, Mapping eastern North American
vegetation change of the past 18 ka: no-analogs and the future: Geology, v. 20, p.
1071-1074.
Riegel, W.L., 1965, Palynology of environments of peat formation in southwestern
Florida: Ph.D. Dissertation, The Pennsylvania State University, 189 pp.
Snyder, J.R., Herndon, A., and Robertson, W.B., Jr., 1994, South Florida Rockland, in
Myers, R.L., and Ewel, J.J., eds., Ecosystems of Florida, Orlando, University of
Central Florida Press, p. 230-278.
Stockmarr, J., 1971, Tablets with spores used in absolute pollen analysis: Pollen et
Spores, v. 8, p. 615-621.
Stockmarr, J., 1973, Determination of spore concentration with an electronic particle
counter: Danmarks Geologiske Undersøgelse, Ärbog 1972, p. 87-89.
Tauber, H., 1965, Differential pollen dispersal and the interpretation of pollen diagrams,
with a contribution to the interpretation of the elm fall: Danmarks geologiske
Undersøgelse. Series, II, v. 89, p. 1-69.
Willard, D.A., 1997, Pollen Census Data from Southern Florida: Sites Along a Nutrient
Gradient in Water Conservation Area 2A: U.S. Geological Survey Open-file Report
97-497, 23 pp.
Willard, D.A., and Holmes, C. W., 1997, Pollen and geochronological data from south
Florida: Taylor Creek Site 2: U.S. Geological Survey Open-file Report 97-35, 28 pp.