Embed Size (px)
Citation preview

Share Data
Bloomberg Symbol PHDC EC
Reuters Symbol PHDC.CA
Market Cap (EGP) 6,331,852,800
Number of Shares 1,048,320,000
Free Float 35.00%
Price-to-Earnings 12.56
Price-to-Book 1.56
Share Performance
Source: Reuters
2.33% 1 Month Return 12.87% 3 Month Return 13.28% 6 Month Return 9.48% 12 Month Return 6.94 – 4.35 52 Week Range
Initiating coverage with a BUY Recommendation and a Fair Value of EGP 7.72 per share based on the channels of analysis below
Targeting a backlog of EGP 15 billion with double that in total sales PHD finished Q3 2010 with a backlog of EGP13 billion that will materialize into revenue during the next 4-5 years of which EGP 2.0 billion and EGP 2.2 billion are expected to be recognized in 2011 and 2012 respectively. The company’s goal is to have a backlog of EGP 15 billion and has set a target to reach total sales of EGP 30 billion in 4-5 years which we feel is a challenging but reachable goal as PHD does have a dominant sales and marketing presence in Egypt and is expanding its sales network to London and Dubai.
Moderate growth accompanied by declining profit marginshhh We expect PHD’s 2010 net income to outgrow its 2009 reported earnings by an estimated 6% to reach EGP 504 million. PHD’s gross margin is expected to slightly decline in 2010 to reach 59% and will continue declining as the company recognizes more revenues and costs associated with BUA. We are estimating revenues of around EGP 1,230 million in 2010, a growth of 7% from PHD’s 2009 reported revenues. However, 2011 may experience a double-digit revenue boost due to high expectations of reservations being converted to contracts.
Diversified land bank with a focus on increasing recurring revenue With 47.8 million sqm scattered across Egypt, Palm Hills owns the second largest and the most diversified land bank among Egyptian real estate developers. The company mainly targets upper and upper-middle income buyers who are seeking high-end units outside the center of the city, but has been reducing unit sizes to appeal to a broader market. It aims to hedge its reliance on the housing market and expand its recurring revenue through partnerships in hospitality, education, and retail.
Performance and Forecasts
Year 2008 2009 2010e 2011f 2012f 2013f
Revenues (EGP millions) 1,235 1,146 1,227 1,652 2,049 1,969
Net Income (EGP millions) 659 475 504 533 641 585
EPS (EGP) 0.99 0.68 0.48 0.51 0.61 0.56
BVPS (EGP) 4.25 4.88 4.15 3.56 4.11 5.03
ROA (%) 10.34 6.20 5.79 5.63 5.92 4.90
ROE (%) 33.28 16.68 13.66 13.41 16.12 12.29
Source: Company Historicals and Blominvest Estimates
Contact Information: Senior Equity Analyst: Issa Frangieh [email protected]
Research Analyst: Nader Ali Khedr [email protected]
Economist: Walid Sayegh [email protected]
Head of Research: Marwan Mikhael [email protected]
6.04 Share Price (EGP): Equity Research – Initiation of Coverage 7.72 Fair Value (EGP):Real Estate Sector: 28% Upside:Egypt Country: BUY Recommendation: December 21, 2010 Date:
Palm Hills Developments Company
High leverage reduces valuation premium We estimate the fair value of Palm Hills shares at EGP 7.72 using a Sum-Of-The-Parts methodology where projects under construction were valued using a DCF model while projects in master-planning or raw land were valued through applying a premium to the acquisition costs. Palm Hills is undervalued when comparing its Price-to-Earnings (P/E) ratio of 12.6 against its Middle Eastern peers at 16.2. We believe this large discount that the stock trades at is partly due to its significantly higher leverage than most other real estate companies as a result of its financing business model.
األوراق المالية بلوم مصر لتداول BLOMINVEST BLOM EGYPT SECURITIES BANK
Subject to Disclaimer on Last Page

2
PALM HILLS DEVELOPMENTS COMPANY
FINANCIALS & VALUATION
Year 2008 2009 2010e 2011f 2012f 2013f
Profit & Loss Summary
Revenue (EGPm) 1,235 1,146 1,227 1,652 2,049 1,969 Revenue Growth (%) 130.8 -7.2 7.1 34.6 24.1 -3.9
Gross Profit (EGPm) 942 691 733 836 1,068 962 Gross Margin (%) 76.3 60.3 59.7 50.6 52.1 48.9
Net Profit (EGPm) 659 475 504 533 641 585 Profit Margin (%) 53.4 41.5 41.0 32.3 31.3 29.7
Net Profit Growth (%) 244.7 -21.3 6.3 5.9 20.1 -8.7
Earnings Per Share (EGP) 0.99 0.68 0.48 0.51 0.61 0.56 Price-to-Earnings (Forward P/E) 6.10 8.88 12.56 11.87 9.88 10.83
Balance Sheet Summary (EGPm)
Cash & Cash Balances 280 135 147 182 205 197 Accounts & Notes Receivables 319 547 921 1,239 1,537 1,477 Inventory of Land & Real Estate 683 967 1,043 1,156 1,270 1,378 Investment Properties 4,940 5,474 6,295 7,239 8,325 9,574 Other Assets 2,923 3,409 3,541 3,579 4,073 4,369 Total Assets 9,145 10,532 11,947 13,395 15,410 16,995
Total Liabilities 6,314 7,121 7,598 9,667 11,107 11,726
Book Value Per Share (EGP) 4.25 4.88 4.15 3.56 4.11 5.03
Profitability
ROA (%) 10.3 6.2 5.8 5.6 5.9 4.9 ROE (%) 33.3 16.7 13.7 13.4 16.1 12.3
Liquidity
Cash / Current Liabilities 0.10 0.04 0.03 0.03 0.03 0.03 Current Assets / Current Liabilities 2.18 1.96 1.92 1.71 1.75 1.82 Net Working Capital / Current Assets 0.54 0.49 0.48 0.42 0.43 0.45
Comparables
Valuation Margin Analysis (%) Profitability (%) P/E P/Rev P/BV Gross Operat. Net ROE ROA
Palm Hills Dev 12.56 4.79 1.56 60.33 51.11 45.39 16.68 5.78 Average of Peers 16.20 6.15 2.25 49.61 46.04 41.74 13.30 5.56
Valuation
EGP Million Projects in Construction 7,722 Projects in Master-Planning or Raw Land 2,014 Investment Property for Recurring Income 483 Financial Assets at Fair Value 118 Cash 147 Net Debt (780) Land Liabilities (1,267) Minority Interest (348)
Fair Value 8,089
Number of Shares (in millions) 1,048
Share Value (EGP) 7.72

3
PALM HILLS DEVELOPMENTS COMPANY
Table of Contents INVESTMENT SUMMARY ............................................................................................................................. 4
ECONOMIC OVERVIEW ................................................................................................................................. 6
COMPANY PROFILE ..................................................................................................................................... 11
Share Ownership ..................................................................................................................................... 11 Management............................................................................................................................................ 11 Subsidiaries and Associates .................................................................................................................. 12
BUSINESS MODEL ....................................................................................................................................... 13
Diversified Land Bank ............................................................................................................................. 13 Revenue Recognition ............................................................................................................................. 13 Vertical Integration .................................................................................................................................. 14 A Financing Model with High Leverage............................................................................................... 14
STRATEGY ...................................................................................................................................................... 15
Expansion in Market Segment and Product Mix ................................................................................ 15 Fast-Track Construction ......................................................................................................................... 15 High Brand Recognition and Extensive Sales Network .................................................................... 16 Recurring Revenue ................................................................................................................................. 16
COMPANY OUTLOOK .................................................................................................................................. 17
Growing Backlog ..................................................................................................................................... 17 Reservation, Contracts and Cancellations .......................................................................................... 17 Legalities with Land Ownership ........................................................................................................... 18 Projects in Construction or near Completion ...................................................................................... 19 Projects to be launched ......................................................................................................................... 20
FINANCIAL ANALYSIS .................................................................................................................................. 21
Revenues .................................................................................................................................................. 21 Gross Margin ........................................................................................................................................... 21 Earnings .................................................................................................................................................... 22 Liquidity .................................................................................................................................................... 22 Leverage ................................................................................................................................................... 23 Profitability ............................................................................................................................................... 23 Dividends .................................................................................................................................................. 23
COMPARABLE ANALYSIS ........................................................................................................................... 25
Profitability Comparison ......................................................................................................................... 25 Relative Valuation .................................................................................................................................... 26 Management Effectiveness ................................................................................................................... 26
VALUATION ................................................................................................................................................... 27
Assumptions in Valuation of Projects in Construction ...................................................................... 27 Revenue and Cost Recognition ............................................................................................................ 28 Valuation of Projects in Construction using DCF ............................................................................... 29 Valuation of Projects in Master-planning or Raw Land ..................................................................... 30
PROJECTED INCOME STATEMENT .......................................................................................................... 31 PROJECTED BALANCE SHEET ................................................................................................................... 32
APPENDIX ...................................................................................................................................................... 33
I – List of Comparable Peers ................................................................................................................. 33 II – Project Inputs for Financial Forecasts and Valuation .................................................................. 34 III – Forecasts of Recognizable Sales ................................................................................................... 36 IV – Project Costs used in Financial Forecasts and Valuation .......................................................... 37

4
PALM HILLS DEVELOPMENTS COMPANY
INVESTMENT SUMMARY
We are initiating with a BUY recommendation on Palm Hills Developments Company (PHD) after
carefully analyzing the following:
Business Model
PHD owns the most diversified and the second largest land bank among the major Egyptian real estate developers. Consisting of 47.8 million sqm, its land bank is scattered across the whole of
Egypt and contains 6 million sqm of raw land in Saudi Arabia. Its operation consists of acquiring
land at sub-market rates, creating value by developing residential communities and resorts, and
selling them to high-end buyers. PHD mainly targets upper and upper-middle income buyers who are seeking high-end units as a primary or secondary home outside the center of the city.
The company is the only Egyptian developer with an in-house construction team that allows it to
guarantee capacity and save on external contractor’s margin through an exclusive agreement
(Joint Venture) with Hassan Allamy Sons, the second largest private sector contractor in Egypt. PHD is focusing to diversify its revenue by creating a recurring revenue stream that would form
20–30% of its earnings by 2015 through partnering with top operators in the hospitality, education
and retail industries.
Profitability
PHD’s 2010 net income is expected to outgrow its 2009 reported earnings by an estimated 6% to
reach EGP 504 million. Profit margin is expected to remain stable around 41% in accordance with
a stable gross margin. Selling, General, and Administrative expenses are likely to rise as PHD
continues expanding its sales force both locally and internationally, complemented with new advertising campaigns and promotions.
PHD’s gross margin is expected to slightly decline in 2010 to reach 59% and will continue
declining as the company recognizes more revenues and costs associated with Built-Up-Area
(BUA). However, Gross margin will not drop below a floor of 50% based on our estimates. Both Return-on-Assets (ROA) and Return-on-Equity (ROE) have experienced a noticeable decline
in 2009 from their 2008 levels reaching 6% and 17% respectively. This is simply due to lower
earnings caused by less revenue recognized in 2009.
Growth
We are expecting revenues of around EGP 1,230 million in 2010, a growth of 7% from PHD’s
2009 reported revenues based on the company’s guidance and performance so far this year.
However, 2011 may experience a double-digit revenue boost due to high expectations for Palm Hills Botanica that will have a considerable amount of reservations convert to contracts, in
addition to more deliveries and revenue from BUA in other projects.
The company has set a target to reach total sales of EGP 30 billion in 4-5 years which we feel is a
challenging but reachable goal with its current backlog of EGP 13 billion. In order to reach such a level, the company needs to do business with 10,000 customers in addition to its current 6,809
customers assuming the average property sold is EGP 1.4 million. PHD does have a dominant
sales and marketing presence in Egypt with the largest direct sales force in Egypt and is
expanding its sales and distribution network to expatriates by opening sales offices in Europe
(London) and the Gulf Region (Dubai).
Financial Position
PHD’s current assets have always been at least 1.5x its current liabilities mostly due to a high
balance in its development properties that constitutes almost 75% of current assets. Development properties are properties that have been acquired, under construction or in the
course for sale. As for the company’s cash balance, it has been experiencing a declining rate
since 2007 reaching EGP 135 million in 2009 from EGP 386 million in 2007. PHD’s cash-to-current

5
PALM HILLS DEVELOPMENTS COMPANY
liabilities ratio will continue to hover around 0.03 as current liability accounts such as “Advances
from Customers” and “Billings in Excess of Costs” simultaneously grow with revenues. PHD has high leverage due to its self-financing model for purchasing land, however its Deb-to-
Equity ratio has significantly improved and is expected to hover around 18% in the near term.
The company’s Interest Coverage Ratio that results from dividing its operating income by its
interest expense is expected to vary between 4 and 5. Ideally, we’d like to see this being greater
than 8.
Valuation
We estimate the fair value of PHD’s share at EGP 7.72 using a Sum-of-The-Parts (SOTP)
methodology. Projects in Construction, where sales have already begun, are valued using a discounted cash flow (DCF) model with a 17% discount rate and amount to 75% of PHD’s
valuation. Projects in Master-planning or Raw Land constitute almost 22% of the value and are
valued by applying a premium (on the acquisition cost) that varies depending on the
attractiveness of the individual project. The remainder is attributed to investment property that will be used for recurring income and is captured at its 2010 expected Book Value.
PHD is undervalued when comparing its Price-to-Earnings (P/E) ratio of 12.6 against both its
Middle Eastern peers at 16.2 and Egyptian peers at 23.7. We believe this large discount that PHD
trades at is partly due to its significantly higher leverage than most other real estate companies as a result of its financing business model. In addition, any turmoil in the Egyptian real estate market
may have a magnified effect on PHD’s value since its land bank is scattered across Egypt and in
areas that are not densely populated.
Dividends PHD management does not expect to distribute dividends to its shareholders in 2011 since the
company is in its early stages of growth and invests most earnings into this growth.
Risks We have three major concerns related to investing in PHD with the most significant being its high
leverage. The company carries the highest land liability among Egyptian developers after
acquiring such a sizable land bank. Liquidity adds more weight to this concern as the company’s
cash balance has considerably decreased during the years. PHD’s high exposure to secondary homes in resort destinations is also worrying as any
turbulence in the real estate market may have a magnified effect on pricing in such properties.
However, PHD is aggressively aiming to diversify its revenue into recurring income and even
reducing its unit sizes to appeal to a broader market segment.
As for the recent confusion surrounding land ownership sold by the Egyptian government through direct order, the state will be passing a bill to deal with all previously violated contracts and all
future land sales by government entities. Palm Hills however belongs to the investment law which
states that no government entity of any kind can confiscate, possess, or harm property owned by
a company protected under this law. Note that in any case, only 7% of PHD’s land has been directly granted by the government. There is also a lawsuit against PHD that is directed towards
930,000 sqm (less than 2% of its land) in New Cairo. We expect this to be settled in a similar
manner to the lawsuit filed against Talaat Moustafa that resulted in a new contract with similar
conditions to the initial one and no damage to the company or its customers.

6
PALM HILLS DEVELOPMENTS COMPANY
ECONOMIC OVERVIEW A Genuine Housing Demand Supported by a Favorable Outlook Egypt’s real estate sector holds a massive potential for expansion, driven by the country’s strong
economic performance, growing population and fast tracked urbanization. Primarily, the Egyptian
economy has been growing at an average annual rate of 6.2% over the past five years, driven by
vigorous domestic activity and a strong support from foreign investment. Domestic demand is a direct result of the privatization and ownership reforms that were initiated in 2004. It strives on the
rise in the purchasing power of Egyptians, boosting their appetite for consumption and
investment.
Source: Institute of International Finance
However, the high inflation rate is eating up the purchasing power of the lower income segment.
The problem is still being managed artificially through food and housing subsidies, which is
gradually widening inequality in the country and crowding out the low income group – still a huge portion of the population – from productive participation in the economy as consumers.
With regards to demographic factors, Egypt’s population of 80 million has been growing at an
average annual rate of 2% over the past 5 years and is set to continue expanding at a comparable
pace in the short and medium term. This expansion has been exerting massive pressure on demand for housing; especially considering the severe undersupply of residential units that has
been rolled over from years prior to structural reforms and privatization.
The predominantly young population and high marriage rate (500 thousand marriages per year) also add considerable demand for new units annually. New families however do not necessarily
change residence seeing that a large percentage of married couples choose to remain at one of
the spouse’s homes due to their inability to afford moving out. However, this trend has been
changing recently due to the following reasons:
The development of the government’s subsidization program and mortgage financing.
The rise in Egypt’s average wages.
The Construction of new self-sustainable urban regions that simultaneously provide new opportunities for work, encouraging emigration.

7
PALM HILLS DEVELOPMENTS COMPANY
Concerning the distribution of demand, surveys show that less than 10% of buyers into Egypt’s
property market are foreign nationals. The remaining 90% are distributed as such: almost 61% of local demand is concentrated in the low income segment, whereas 33% and 6% are
concentrated in the middle and high income segments respectively. However, over the coming
years, we expect higher penetration by foreigners as the economy continues to strengthen,
offering new job opportunities and profitable investment prospects, as well as a bigger demand
ratio by the higher income segment supported by micro speculative investments. Note that foreign nationals benefit from tax preferential regulations in real estate.
Source: CAPMAS
Other Determinants of Demand Include:
New demand by investors seeking gains from the continuing price hikes in Egyptian
properties. A practice that is still limited but will likely expand as Egypt continues to update and ease its financial control.
Replacement Demand of Depreciated Structures: A form of demand that is expected to
become significant as the growth of the economy continues to trickle down to the lower
wage segment. It is currently limited well below 10%. USAID estimates that the average
Egyptian family demands a new residence priced at around USD15,000, according to the country’s median purchasing power. Most newly supplied homes are however currently
priced at around USD60,000.
Source: USAID, Blominvest
8
PALM HILLS DEVELOPMENTS COMPANY
An Underserved Market Presenting High-Return Investments
Prior to the year 2004, Egypt’s real estate market was limited due to its centralized control and obsolete land ownership regulations. Housing supply was characterized by a severe shortage
amid an unregulated market and the dominance of unofficial constructions (Around 80% of total
residential structures). Since then, the Egyptian government has been gradually reforming the
sector by easing bureaucratic procedures for both developers and consumers. This has been
incited by its awareness of the housing shortage, estimated around 200,000 new units per year (excluding the accumulated shortage) and its inability to support all of Egypt’s housing needs.
Housing supply has been therefore transferred to the private sector, which currently operates
75% of the market. The government on the other hand has shifted its focus to aiding the supply
of units to very low income families, in addition to providing housing subsidies through the Guarantee and Subsidy Fund.
On the other hand, housing supply by the private sector has been booming due to investors’
willingness to claim the high profits associated with favorable market dynamics and the continuing spikes in property prices. Egypt’s market conditions have similarly attracted attention
from other Arab developers, such as Dubai’s Emaar and Lebanon’s Solidere, especially following
Dubai’s debt crisis in 2009. However, entry into Egypt’s real estate sector is highly limited due to
barriers imposed by the sector’s structural regulations. For example, projects that benefit from mortgage services are limited to large residential communities. This puts an entire income
segment out of the reach of smaller developers who cannot obtain enough land or embark on
huge planned projects. The supply of high and middle-high end housing is thus limited to the
already established companies. Major Developers Include:
Market Cap.
( in billion USD) Land Bank
(in million sqm) Prominent Projects
Talaat Moustafa Group 3.0 50 Madinaty, Al Rehab
Palm Hills Developments 1.1 48 Sixth of October, North Coast
SODIC 0.6 6 East and West Cairo
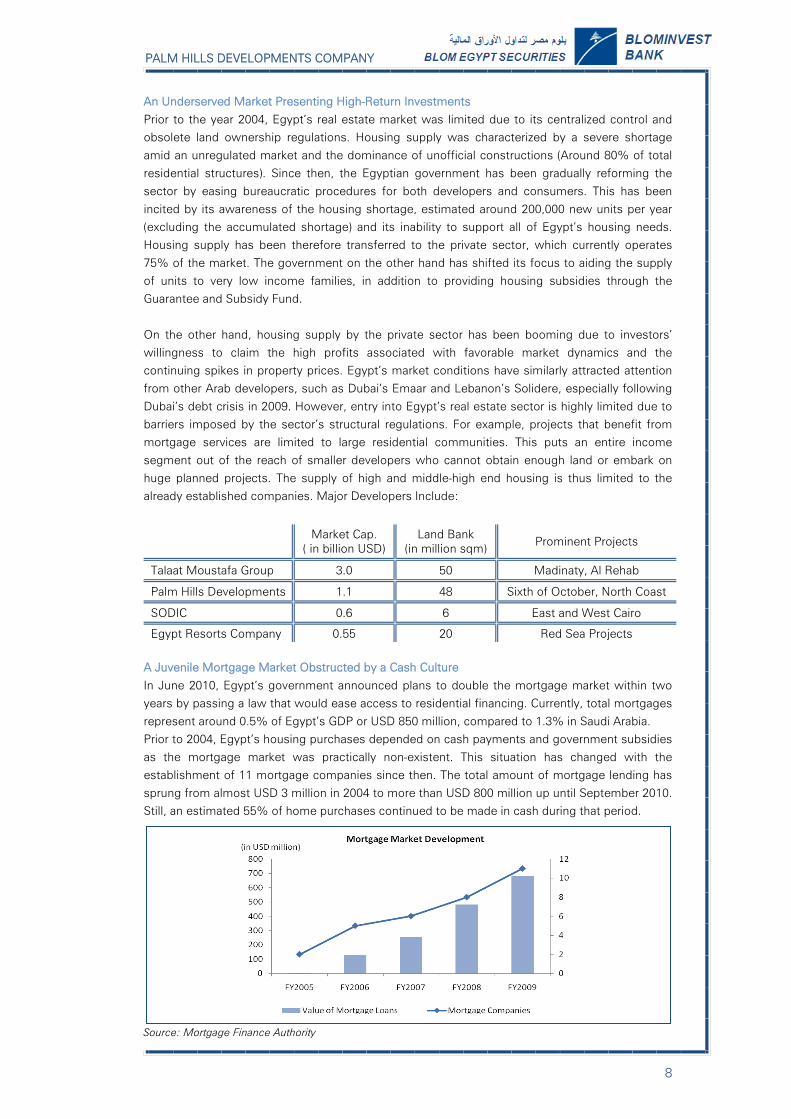
Egypt Resorts Company 0.55 20 Red Sea Projects A Juvenile Mortgage Market Obstructed by a Cash Culture
In June 2010, Egypt’s government announced plans to double the mortgage market within two
years by passing a law that would ease access to residential financing. Currently, total mortgages
represent around 0.5% of Egypt’s GDP or USD 850 million, compared to 1.3% in Saudi Arabia. Prior to 2004, Egypt’s housing purchases depended on cash payments and government subsidies
as the mortgage market was practically non-existent. This situation has changed with the
establishment of 11 mortgage companies since then. The total amount of mortgage lending has
sprung from almost USD 3 million in 2004 to more than USD 800 million up until September 2010. Still, an estimated 55% of home purchases continued to be made in cash during that period.
Source: Mortgage Finance Authority

9
PALM HILLS DEVELOPMENTS COMPANY
With regards to mortgage regulations, bureaucratic procedures required to obtain a mortgage can
take up to six months and are still considered extremely complicated in comparison to international standards. For example, the collateral for obtaining a mortgage is still considerable,
as the down payment for a residential unit is at least 20% of its price. This down payment is
subsidized by the government for families whose income does not exceed USD 450/month.
Families who earn slightly above this figure, but still make well below an income that qualifies for
a comfortable spending budget, are thereby excluded from the program, significantly reducing their capability to obtain housing.
Interest rates on mortgages are still extremely high at around 12.5% compared to 6.5-8.5% in
Dubai and 8-10% in Saudi Arabia.
Source: Guarantee and Subsidy Fund
Soaring Prices Represent Shortage of Supply
Average property prices in Egypt have soared over the past four years as demand has exceeded
supply considerably in new urban projects. In 2010, this trend partially slowed down in the high
and mid-high housing grades due to supply matching demand, whereas prices of lower-end housing conversely picked up. The price of a unit in Haram city, a SODIC residential Project in
Sixth of October targeting the lower income segment, has reportedly spiked 20% to around USD
23,000, a relatively high price for Egypt’s poorer population. However, prices of lower income
segment units do not have much room for comparison with the previous years, as supply of lower grade housing was previously confined to the unofficial market. Middle grade units in the
mentioned regions average around USD 90,000, also significantly higher than three years earlier
when an average unit was sold for 33% less.
According to Cushman and Wakefield, Egypt ranked as the 45th most expensive country in terms
of housing whereas its per capita income ranking stood at 102 worldwide. Saudi Arabia
conversely ranked 57th with regards to property prices and 37th in per capita income.
Source: Global Property Guide

10
PALM HILLS DEVELOPMENTS COMPANY
Spilling Sideways: Cairo’s Legacy and Its Prospects of Being Revived
Cairo is still the most expensive region for real estate in Egypt as prices are mainly defined by extremely high demand considering that it is still the country’s commercial and financial hub.
Cairo is swarming with unregistered and depreciated old projects that constitute more than 75%
of total current housing. This makes larger projects that extend to more than one individual
structure very difficult to undertake, due to the renovations required for accommodating the new
buyer segment. An example of such a project is the venture by Al Ismailia Company to renovate entire areas in Downtown Cairo; a plan that will involve renovating infrastructure networks as
well, and make severance payments to the old owners who will no longer be able to afford the
area.
As Cairo has reached its population density limit, new urban regions around the capital (New
Cairo, Sixth of October, Al-Rehab, etc.) have been attracting a stream of residents to their gated
communities. Egypt’s high and middle class have been moving to those regions with the promise
of finding self-sufficient cities with regards to job opportunities, and the supply of their consumption and leisurely requirements. In addition, such cities allow for a less stressful life from
that of the overcrowded capital. The number of people living to the East and West of Cairo is
forecasted to more than double in the next five years to four million on each side. This has been
adding considerable pressure on prices in both regions, especially in the low and mid grade segments.
Is the Current Upward Trend Sustainable?
With the current situation of soaring prices and inadequate supply, it is easy to see how Egypt’s
real estate market could be perceived as heading into a bubble. However, we believe that this is not the case as Egypt is only making up for years of neglected demand. Excluding the possibility
of external shocks from drastic political changes, growth in housing supply for different income
segments should start to curb the price expansion. However, this growth needs to outweigh the
demand caused by population expansion which does not appear to be happening in the short term.
What’s next?
We expect prices in Egypt to continue rising in the short term for lower end units, however, at a slower pace than before. Residential prices will likely stabilize in the medium term, as the
pressure from demand will be offset by the further development of new areas to support housing
supply.
Unit prices are also expected to decline, however only due to the shrinkage in the average apartment size. This will create a more adequate supply for the middle income segment,
considering the rise in average income and simultaneous decrease in family size.

11
PALM HILLS DEVELOPMENTS COMPANY
COMPANY PROFILE Palm Hills Developments Company (PHD) is a leading real estate developer operating mainly in Egypt with its primary focus on the high-end residential real estate market. It was founded in
2005 by Mansour and Maghraby Investment and Development (MMID) in order to utilize MMID’s
existing experience with Al Ethadia while taking advantage of new favorable tax legislations. PHD
currently possesses the second largest land bank of approximately 47.8 million sqm distributed geographically across Egypt and involves 32 separate projects. Its operation consists of acquiring
land at sub-market rates, creating value by developing residential communities and resorts, and
selling them to high-end buyers.
Share Ownership
PHD made its initial public offering (IPO) on May 6, 2008 issuing almost 700 million shares with a
par value of EGP 2.00. Its ordinary shares are listed on the Egyptian Stock Exchange (EGX) while
shares in the form of Global Depositary Receipts (GDRs) are listed on the London Stock Exchange
(LSE) with a ratio of 1 GDR to 5 ordinary shares. PHD has recently concluded a rights issue in the first quarter of 2010 consisting of EGP 700 million paid-in-capital bringing the total to EGP 2.1
billion or 1,048,320,000 shares.
MMID: Mansour and Maghraby Investment and Development ESOP: Employee Stock Option Plan Management
Mr. Yasseen Mansour Chairman & CEO Mr. Ihab Swellom CFO Mr. Mohamed Ashraf Abu Al Dahab CEO for Construction Mr. Shehab Mazhar CEO for Engineering Mr. Sharif Seif El Nasr Senior Vice President of Sales & Marketing Dr. Khaled Sedky Chief Portfolio Officer Mr. Ahmed Eissa Legal and Compliance Director Ms. Nahla Mofid El Ebiary Vice President Development and Controls Mr. Ali Thabet Vice President Internal Audit Mr. Ashraf El Ghazaly Vice President of Strategic Planning Dr. Azza Galil El Bendary Vice President of Human Resources Mr. Hisham Salah Vice President of Technology Engineer Ahmed Atalla Vice President Development - New Cairo Engineer Mohamed El Garhy Vice President Development – 6th of October Engineer Mohamed Ahmed Sultan Vice President Development - North Coast
Source: PHD
12
PALM HILLS DEVELOPMENTS COMPANY
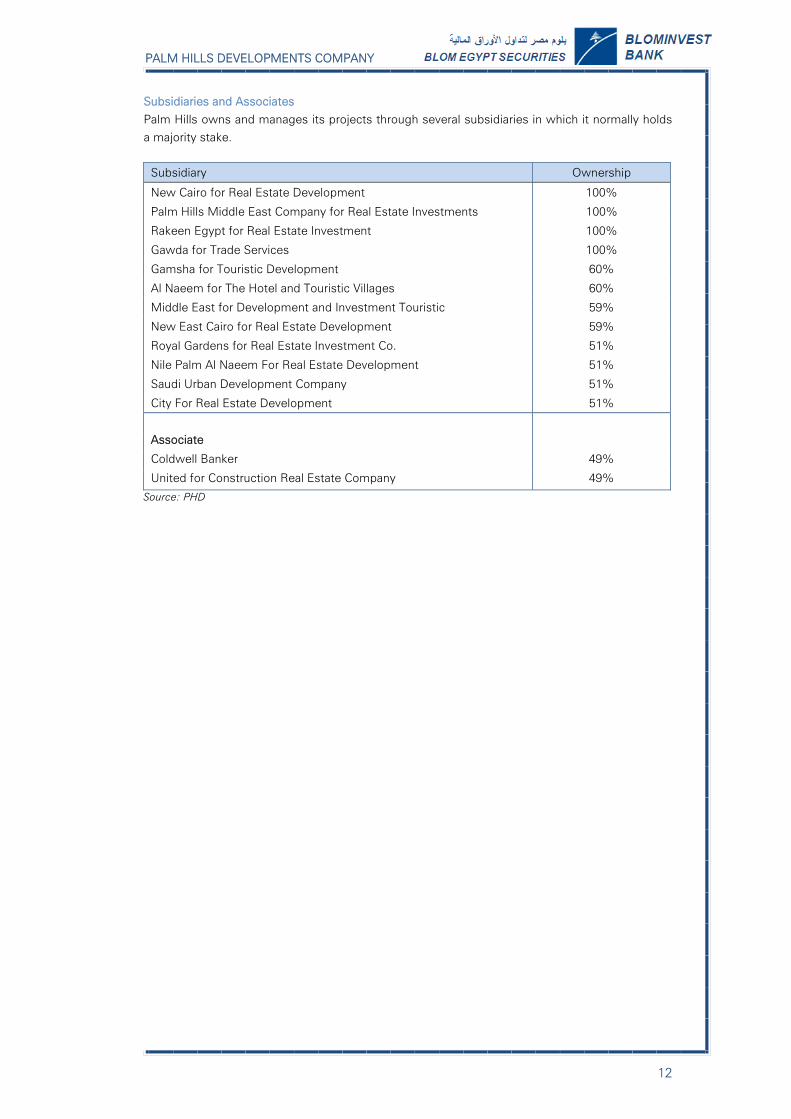
Subsidiaries and Associates
Palm Hills owns and manages its projects through several subsidiaries in which it normally holds a majority stake.
Subsidiary Ownership
New Cairo for Real Estate Development 100%
Palm Hills Middle East Company for Real Estate Investments 100%
Rakeen Egypt for Real Estate Investment 100%
Gawda for Trade Services 100%
Gamsha for Touristic Development 60%
Al Naeem for The Hotel and Touristic Villages 60%
Middle East for Development and Investment Touristic 59%
New East Cairo for Real Estate Development 59%
Royal Gardens for Real Estate Investment Co. 51%
Nile Palm Al Naeem For Real Estate Development 51%
Saudi Urban Development Company 51%
City For Real Estate Development 51%
Associate
Coldwell Banker 49%
United for Construction Real Estate Company 49%
Source: PHD

13
PALM HILLS DEVELOPMENTS COMPANY
BUSINESS MODEL Diversified Land Bank PHD owns the most diversified and the second largest land bank of the major Egyptian real estate
developers. Consisting of 47.8 million sqm, PHD’s land bank is scattered across the whole of
Egypt and includes 6 million sqm of raw land in Saudi Arabia.
Source: PHD, Blominvest
Revenue Recognition Revenue recognized on PHD’s financial statements is normally different from its reported sales
due to its revenue recognition process that depends on the type of unit sold:
For villas, townhouses and twin-houses, revenue from land sold is recognized
immediately upon the signature of the contract whereas BUA sales are recognized on a percentage-of-completion basis with a minimum threshold of 50%.
For apartments, revenue is recognized upon delivery of units.
Source: PHD, Blominvest

14
PALM HILLS DEVELOPMENTS COMPANY
Vertical Integration PHD is the only Egyptian developer with an in-house construction team that allows it to guarantee
capacity and save on external contractor’s margin. It has an exclusive agreement (Joint Venture)
with Hassan Allamy Sons, the second largest private sector contractor in Egypt, which ensures
execution flexibility, high quality and on-time delivery to clients. The terms of the joint venture
allow PHD to build at an attractive cost + 9.5% compared to previously building at cost + 12%. In addition, PHD has recently formed a partnership with Orascom Construction at even more
competitive terms to construct at cost + 8.5%, thus increasing its overall construction capacity.
A Financing Model with High Leverage PHD acquires land through a 10% down-payment with the remaining balance funded through an
interest-bearing loan of 9% from the government paid over 10 years. Once the master plan is
developed, the reservation phase begins where buyers will place a 10% down-payment. After
attaining licenses and government approvals, contracts are signed with buyers and the down-payment increases to 15%. Post-dated checks previously received from buyers are drawn on a
quarterly basis and construction is phased. The remaining full payment is received once units are
delivered.
Source: Blominvest
Source: PHD

15
PALM HILLS DEVELOPMENTS COMPANY
STRATEGY Expansion in Market Segment and Product Mix
PHD mainly targets upper and upper-middle income buyers who are seeking high-end units as a
primary or secondary home outside the center of the city. This is changing due to the current
market climate that is causing PHD to start offering smaller units, hence more affordable housing. The result is that the company’s client base has grown to reach a total of 6,810 customers by the
end of Q3 2010, while the average price of units sold by PHD has dropped by 48% from EGP 2.5
million in 2006 to EGP 1.2 million in 2009.
Source: PHD
Fast-Track Construction
PHD is accelerating construction for high value projects in order to benefit from the current low
building material prices in Egypt. This is due to a plummeting demand for basic construction materials since most real estate developers are scaling down their operation.
Acceleration applies to the following projects: Golf Views and Golf Extension, Palm Hills
Katermaya, Hacienda White 1, Hacienda Bay 1, and Ain Sokhna.
Source: PHD, Blominvest

16
PALM HILLS DEVELOPMENTS COMPANY
High Brand Recognition and Extensive Sales Network PHD has a dominant sales and marketing presence with the largest direct sales force in Egypt
consisting of almost 90 salesmen located across Cairo. The company has an agreement with
Coldwell Banker to promote and exclusively sell PHD’s properties in Egypt as its brand is
associated with luxury living.
PHD is expanding its sales and distribution network to expatriates by opening sales offices in Europe (London) and the Gulf Region (Dubai) to capture a portion of Egyptian expatriates. The
company has a sales agreement with Burooj Properties, the real estate arm of Abu Dhabi Islamic
Bank, that resulted in selling 425 units for EGP 315 million to Egyptian expatriates in the Gulf and
expects to make similar deals in the near future. PHD is attempting to leverage the advantage that expatriates enjoy as they receive mortgage loans with an interest rate of 6-7% compared to those
living in Egypt with loans ranging between 14-16%.
Experimenting with different sales campaigns, PHD has found success with its most recent
“Power of Seven” campaign that extends seven year payment terms instead of the usual five allowing it to leverage the strength of its balance sheet while charging a 12% interest for the
additional two years.
Recurring Revenue PHD is planning to diversify its revenue by creating a recurring revenue stream that would form
almost 20–30% of its earnings by 2015. The obvious benefits of this goal would be to reduce
exposure to the real estate market fluctuations and stabilize its earnings per share. It plans to
accomplish this by partnering with top operators in the hospitality, education and retail industries.
In early 2010, PHD acquired a 60% share in MACOR that has a stake in Novotel hotels in Sixth of October and Sharm El Sheikh. PHD also owns the rights to the luxurious Ritz Carlton hotels in
Egypt. The company signed an Memorandum of Understanding with Laureate Education (USA)
and plans to establish a full-fledged university. As for its retail plans, PHD is in the process of
building its first shopping mall in East Cairo that consists of 25,000 sqm of leasable space and expected for a soft launch in the second half of 2011.

17
PALM HILLS DEVELOPMENTS COMPANY
COMPANY OUTLOOK Growing Backlog PHD finished Q3 2010 with a backlog of EGP13 billion most of which materialize into revenue
during the next 4-5 years with EGP 2.0 billion and EGP 2.2 billion expected to be potentially
recognized in 2011 and 2012 respectively. Backlog has experienced considerable growth during
the past few years due to PHD acquiring new land and quickly marketing its projects to investors and consumers. We expect this backlog to continue growing thus matching the company’s goal
of EGP 15 billion. A key opportunity of growth for PHD would be to continue structuring deals
such as that of Burooj Properties in order to market and sell its properties outside Egypt. The
company has set a target to reach total sales of EGP 30 billion in 4-5 years, which we feel is a challenging goal. In order to reach such a level, the company needs to do business with 10,000
customers in addition to its current 6,809 customers assuming that the average property sale
price is EGP 1.4 million.
Source: PHD
Reservation, Contracts and Cancellations Since backlog is composed of reservation and contracts, it’s important to monitor the rate of new
reservations, contracts and cancellations as an indicator of how healthy PHD’s backlog is. The
rate of cancellation has been continuously declining since Q1 2009 reaching EGP 250 million in
Q3 2010, almost 18% less than the cancellation of EGP 305 million in Q3 2009. On the other hand, reservation and contracts have been rising aggressively with new reservations reaching
EGP 1.78 billion and new contracts increasing to EGP 1.05 billion during Q3 2010, a respective
growth of 52% and 13% over Q3 2009.
Source: PHD, Blominvest

18
PALM HILLS DEVELOPMENTS COMPANY
Of the EGP 13 Billion in backlog, 76% or EGP 9.6 billion are in contracts that hold a low cancellation risk while EGP 3.4 billion are in reservations. Backlog that is in reservation stage is
considered to hold above average risk for cancellation since customers are not yet fully
committed whereas backlog under contracts presents a lower cancellation possibility. A 20%
cancellation rate for outstanding reservations with the current mix implies that almost 4% of total
backlog has high cancellation risk.
Source: Blominvest
Legalities with Land Ownership
During September 2010, a loophole in the laws surrounding land ownership has been exposed
after a lawsuit was filed and appealed against the Madinaty project of Talaat Moustafa. Initially, a specific law issued in 1979 stated that the New Urban Communities Authority (NUCA), a
government entity, has the right to sell land by direct order. However, in 1998, a general law was
issued stating that land owned by government entities has to be sold through a tendering process
and never by direct order. The cabinet and the government understand that specific laws supersede general laws. Nevertheless, this conflict can have an adverse effect on potential
investors in Egyptian real estate and requires a proper solution by the government.
In the case of Talaat Moustafa, the existing contract with the NUCA was legally cancelled
resulting in a new contract with the government that can sell by direct order through a decree, and with the same conditions as before; hence no damage occurred. The effect would have been
adverse on Talaat Moustafa since the Madinaty project constitutes almost 66% of its land bank.
As for PHD, a lawsuit has been also filed against their land in New Cairo consisting of 930,000 sqm (almost 2% of their land bank) granted by the Ministry of Housing. PHD clarified during their
conference call that 80% of its units at this project have been either sold or contracted with most
of the site to be delivered in 2011. They added that the company belongs to the Investment Law
or Law Number 8 stating that no government entity of any kind can confiscate, possess, or harm
property owned by a Law 8 company. It is worth noting that 3.5 million sqm of PHD’s land has been directly granted by government entities which constitutes 7% of its land bank. The lawsuit
however is only directed at the 930,000 sqm in New Cairo.
In conclusion, we see limited risk on Palm Hills due to the existing loophole between the specific
and the general laws. The government will soon be passing a bill to deal with all previously violated contracts and all future sales by government entities.

19
Palm Hills Development Company
Projects in Construction or near Completion
Project Sub-Project Launched Completion
Date % Sold as of
Q2 2010 % in
Contracts Land (sqm) BUA (sqm)
PHD ownership
Taxable Use
Sixth of October Cascade (Stg 6,7,8) 2005 2010 100% 98% 69,153 15,682 100% No Residential Golden Palm (Stg 6,7,8) 2005 2010 100% 99% 252,779 68,316 100% No Residential Bamboo (Stg 6,7,8) 2005 2010 100% 100% 81,389 34,852 100% No Residential Golf Views 2005 2015 83% 74% 2,045,778 453,928 100% No Mixed Bamboo Extention 2008 2011 91% 85% 167,983 63,908 100% No Residential Golf Extention 2008 2015 45% 33% 1,302,572 417,681 100% No Mixed Palm Parks 2007 2013 54% 47% 474,669 287,380 100% Yes Mixed Village Gardens Oct. 2009 2015 98% 0% 238,434 52,867 51% Yes Residential 190 Feddan 2010 2016 0% 0% 798,000 162,763 100% No Mixed Total
5,430,757 1,557,377
Cairo Alexandria Road
Casa 2007 2015 82% 59% 294,000 269,984 51% Yes Residential
Palm Hills Botanica 2009 2015 94% 0% 7,389,900 543,641 100% No Mixed Total
7,683,900 813,625
East Cairo Palm Hills Katameya 2006 2011 77% 76% 928,439 288,546 100% No Residential The Village 2006 2010 91% 88% 105,264 61,082 100% No Mixed The Village Gate 2008 2012 46% 35% 131,082 100,071 51% Yes Mixed Village Gardens Kat. 2009 2014 88% 83% 284,796 244,236 59% Yes Residential Park View 2009 2014 44% 0% 97,661 67,155 51% Yes Residential Total
1,547,242 761,090
North Coast Hacienda Bay 1 2007 2012 64% 46% 2,305,800 344,575 100% Yes Mixed Hacienda White 1 2009 2012 100% 49% 206,892 38,822 88% Yes Mixed Hacienda White 2 2010
22% 0% 449,402 130,912 88% Yes
Total
2,962,094 514,309
Red Sea Palm Sokhna 2008 2014 54% 36% 5,554,248 2,527,141 60% Yes Residential
Land & BUA for Project in Construction
23,178,241 6,173,542
Source: PHD, Blominvest

20
Palm Hills Development Company
Projects to be launched
Source: PHD, Blominvest
Project Location Use Land (sqm) Status Cost (LE 000) Ownership Taxable
Gamsha Gamsha Mixed 5,000,000 Master-Planned 42,012 59% Yes
Alex Building Alexandria Mixed 13,452 Master-Planned 231 51% Yes
Hacienda Bay (Zn 2) North Coast Mixed 1,215,395 Master-Planned 48,451 100% Yes
Hacienda Bay (Zn 3) North Coast Mixed 8,333,187 Master-Planned 820,792 100% Yes
Hacienda Bay (Zn 3 Ext) North Coast Mixed 1,180,200 Master-Planned 73,784 100% Yes
Hacienda Coast ME1 North Coast Mixed 583,820 Master-Planned 53,714 60% Yes
Hacienda Coast ME2 North Coast Mixed 451,732 Master-Planned 43,441 100% Yes
Hacienda Bay Rem. Land North Coast
884,436 Raw Land 40,000 100% Yes
Ellamy New Cairo Mixed 34,917 Master-Planned 3,928 51% Yes
Villa Mora Ain Sokhna
240,240 Raw Land 1,321 51% No
Riyad Saudi Arabia
3,638,063 Raw Land 314,326 51% No
Jeddah Saudi Arabia
3,000,060 Raw Land 864,017 51% No
Land for Projects to be Launched
24,575,502
Land Bank Grand Total 47,753,743

21
Palm Hills Development Company
FINANCIAL ANALYSIS Revenues We are estimating a 7% revenue growth in 2010 amounting to EGP 1,230 million. So far this year,
revenues have been generated as follows:
In Sixth of October area, Golf Views and Golf Extension produced around EGP 130 and 200
million respectively from land while Cascade, Golden, and Bamboo continue to dominate PHD’s BUA revenues.
In the North Coast, Hacienda White and Hacienda White 2 are the main drivers for revenue
of around EGP 55 and 260 million respectively, and are to be complemented with the
anticipated launch of Hacienda Bay in 2011. In East Cairo, Katameya and Village Gardens Katameya have produced around EGP 55 and
35 million so far in 2010, respectively.
On PHD’s recurring revenue, the Club House is estimated to produce around EGP 35 million
this year through memberships and events. As for 2011, there are high expectations for Palm Hills Botanica to have a considerable amount of
reservations convert to contracts along with more deliveries and revenue from BUA in other projects.
Source: Blominvest
Gross Margin PHD’s gross margin is expected to slightly decline in 2010 to reach 59% and will continue declining
as the company recognizes more revenues and costs associated with BUA. Gross margin in the long
run is expected to hover around 50% based on our estimates.
Source: Blominvest

22
Palm Hills Development Company
Earnings
We expect PHD’s 2010 net income to outgrow its 2009 reported earnings by an estimated 6% to reach EGP 504 million. Profit margin is expected to remain stable (around 41%) in accordance with a
stable gross margin. Selling, General, and Administrative expenses are likely to rise as PHD continues
expanding its sales force both locally and internationally complemented with new advertising
campaigns and promotions. Net Income will continue to be positively affected from recognizing
revenues of non-taxable projects in the Sixth of October area and East Cairo reducing income tax significantly.
Source: Blominvest
Liquidity
PHD’s current assets have always been at least 1.5x its current liabilities mostly due to a high
balance in its development properties that constitute almost 75% of current assets. Development properties are properties that have been acquired, under construction or in the course for sale. As for
the company’s cash balance, it has been experiencing a declining rate since 2007 reaching EGP 135
million in 2009 from EGP 386 million in 2007. PHD’s cash-to-current liabilities ratio will continue to
hover around 0.03 as current accounts such as “Advances from Customers” and “Billings in Excess of Costs” simultaneously grow with revenues.
Current Ratio = Current Assets / Current Liabilities Cash Ratio = Cash / Current Liabilities Net Working Capital = (Current Assets – Current Liabilities) / Current Assets
Source: Blominvest

23
Palm Hills Development Company
Leverage
PHD has high leverage due to its self-financing model that consists of acquiring land through a 10% down-payment and of funding the remaining balance with a 10-year interest bearing loan. While the
company remains highly levered, PHD’s debt to equity ratio has significantly improved and is
expected to hover around 18% in the near term. However we learned from management that they
may issue new debt in 2011 as they are not comfortable operating at such a low debt to equity ratio.
Another important indicator we studied is the Interest coverage ratio that shows by how many times PHD’s operating income covers its interest expense. Ideally, we’d like to see this greater than 8 but
we expect it to vary between 4 and 5 in the next few years indicating higher than average risk.
Source: Blominvest
Profitability
Both Return-on-Assets (ROA) and Return-on-Equity (ROE) have experienced a noticeable decline in
2009 from their 2008 levels reaching 6% and 17% respectively. This is due to lower earnings caused
by less revenue recognized in 2009.
Source: Blominvest
Dividends PHD management does not expect to distribute dividends to its shareholders in 2011 since the
company is in its early stages of growth and invests most earnings into its growth.

24
Palm Hills Development Company
Revenue Projections Breakdown by Area The forecasts below are generated from projects under construction only and do not consider potential revenue from projects in master-planning or raw land.
Source: Blominvest

25
Palm Hills Development Company
COMPARABLE ANALYSIS When studying a company, we find it necessary to see how it compares to its peers from three standpoints:
1. Profitability Comparison: Shows how well the company is managing its expenses through
different margin analysis (Gross Margin, Operating Margin, Profit Margin)
2. Relative Valuation: Shows how the market perceives the company (overvalued, undervalued, or fairly valued)
3. Management Effectiveness: Shows how efficient management is at using its assets and
equity to generate earnings.
Comparable Firms
The list we compiled consists of 11 real estate companies that operate in the Middle East including 2
that operate in Egypt: “Talaat Moustafa Group Holding (TMGH)“ and “Nasr City Co. for Housing &
Development (MNHD)”. We compared PHD to the average of these 2 separately and among the 11 Middle Eastern companies since they share common attributes dictated by their country such as
political risks and a young growing population. The largest of the 11 has a market cap of USD 3.4
billion while the smallest has USD 535 million and the average is USD 1.6 billion. On the other hand,
PHD’s market cap is approximately USD 1.1 billion.
The complete list of companies is available in the appendix.
Profitability Comparison
We compared the Gross Margin, Operating Margin, and Profit Margin as a percentage of revenues to
better understand how PHD is managing its expenses in comparison to its peers. All three ratios show that PHD has considerably higher margins than its regional peers and almost double those in
Egypt. We believe this is partially due to PHD’s revenue recognition process where most of its
current revenue is attributable to land that has high margins. Another key contributor to this
occurrence is PHD’s vertical integration strategy that consists of owning its own construction team saving it 2-3% margin points.
We also included a ratio that represents Selling, General, & Administrative (SG&A) as a percentage of
revenue. In this case, PHD has a higher SG&A ratio than both its regional and Egyptian peers. We
attribute this to its expanded sales network, the largest in Egypt, as well as its marketing operation that continuously experiments with new promotions and advertising campaigns.
Source: Reuters, Blominvest

26
Palm Hills Development Company
Relative Valuation
We considered four ratios to get a sense of how PHD is valued by the market against its peers. We compared price against earnings, revenues, book value, and cash flow to mitigate differences that
can result from accounting standards or financial reporting procedures since these companies
operate in different countries.
PHD is undervalued when comparing its Price-to-Earnings (P/E) ratio of 12.6 against both its Middle
Eastern peers at 16.2 and Egyptian peers at 23.7. We believe this large discount that PHD trades at is partly due to its significantly higher leverage than most other real estate companies as a result of its
self-financing business model. In addition, any turmoil in the Egyptian real estate market may have a
magnified effect on PHD’s value since its land bank is scattered across Egypt and in areas that are
not densely populated. Both Price-to-Book Value (P/BV) and Price-to-Cash Flow (P/CF) follow the same logic. As for Price-to-Revenue (P/Rev), both PHD and its Egyptian peers seem undervalued
compared to others in the region. We attribute this to the legal risk in the Egyptian real estate sector
that has recently affected investment sentiment in the sector and the country as a whole. Until an
effective solution is implemented by the government to avoid further lawsuits targeting land allocations by government entities, investor confidence will remain questionable and will be
represented in the valuations of Egyptian equities.
Source: Reuters, Blominvest
Management Effectiveness
PHD’s Return-on-Equity (ROE) and Return-on-Assets (ROA), at 16.7% and 5.8% respectively, are
considerably lower than those of its Egyptian peers but higher than the Middle Eastern peer average. In contrast, its Debt-to-Equity at 17.8% is lower than the Middle Eastern average but higher than its
Egyptian peers shown in the chart below. As for management’s ability to generate revenues from its
assets, the ratio Revenue-to-Assets shows that PHD is on the lower spectrum due to its scattered
land bank that requires additional effort to generate revenues.
Source: Reuters, Blominvest

27
Palm Hills Development Company
VALUATION We estimate the fair value of PHD’s share at EGP 7.72 using a Sum-Of-The-Parts (SOTP)
methodology. Projects in Construction where sales have already begun are valued using a
discounted cash flow (DCF) model while Projects in Master-planning or Raw Land are valued by
applying a premium depending on the attractiveness of the individual project.
Value Component EGP million
Projects in Construction 7,722 Projects in Master-Planning or Raw Land 2,014 Investment Property for recurring income 483 Financial Assets at Fair Value 118 Cash 147 Net Debt (780) Land Liabilities (1,267) Minority Interest (348) Fair Value 8,089
Number of Shares (in thousands) 1,048 Fair Value per Share (in EGP) 7.72
Source: Blominvest
Assumptions in Valuation of Projects in Construction
Discount Rate
We used a WACC of 17% to value Projects in Construction derived as follows:
WACC = (Weight of Equity * Cost of Equity) + (Weight of Debt * Cost of Debt) * (1 – Tax Rate)
WACC = (0.86 * 18.08%) + (0.14 * 12.51%) * (1 – 20%)
WACC = 16.93 rounded to 17%.
PHD Cost of Equity = Risk-Free Rate + (Beta * Market Risk Premium)
= 10.40% + (1.20 * 6.40%)
= 18.08%
We used a Risk-Free Rate of 10.40% represented by the yield on the one year Treasury bill
issued by the Egyptian Government. This captures the additional risk of investing in a
relatively undeveloped country such as Egypt when comparing it to the U.S. Treasury.
PHD’s weekly Beta over the past 4 years is estimated at 1.2. This is a measure of PHD’s share volatility against the EGX-30 Index that represents the 30 largest shares on the
Egyptian Stock Exchange.
A Market Risk Premium of 6.40% is the result of the difference between the average 5 year
return of the EGX-30 estimated at 16.8% and the Risk-Free Rate of 10.40%. This represents the premium investors expect to gain for realizing the additional risk of investing in
securities.
PHD Cost of Debt = Interest Expense for 2010 / Debt for 2010 = EGP 97 million / EGP 769 million = 12.51%

28
Palm Hills Development Company
Forecasts
Sales begin the year a project is launched and extend a few years depending on indicators for market demand. Sale projections are done separately for each project and vary based
on:
o Consumer interest demonstrated though historic demand
o Supply of remaining unsold units
o PHD’s presence and expertise in the project area o PHD management input
Sales forecasts in the form of percentage of contracts signed is available in the Appendix.
The price/sqm of land and BUA is concluded from PHD’s records of recent pricing used in
actual reservations and contracts for the different projects. Due to the challenges in the real
estate market, we assumed no price growth in our forecasts and therefore, sales would
continue to follow the same prices in the next few years. A 20% corporate tax rate is applied. However, PHD enjoys a 10-year tax holiday ending in
2015 for projects constructed on land acquired from the government. The list of projects
previously displayed in the Outlook section shows which projects this applies to.
Revenue and Cost Recognition
Revenues and costs associated with land sold for villas and townhouses are recognized
immediately while revenues and costs from BUA and infrastructure can begin to be
recognized after construction reaches a threshold of 50% completion. In our DCF model, we recognize BUA revenues and costs after 2-3 years following the year of sale. In the case that
units are sold after project construction is completed, BUA sales and costs are recognized
immediately.
Revenues associated with apartments sold are recognized upon delivery of units while costs from BUA and infrastructure can begin to be recognized after construction reaches a
threshold of 50%. In our DCF model, we recognize most units 2-3 years following the unit
sale. In the case that units are sold after the project ends, they are recognized immediately
since the units are already available for delivery.
The full schedule of prices for land and BUA along with costs for land, BUA, and infrastructure used
in the DCF model is available in the Appendix.
29
Palm Hills Development Company
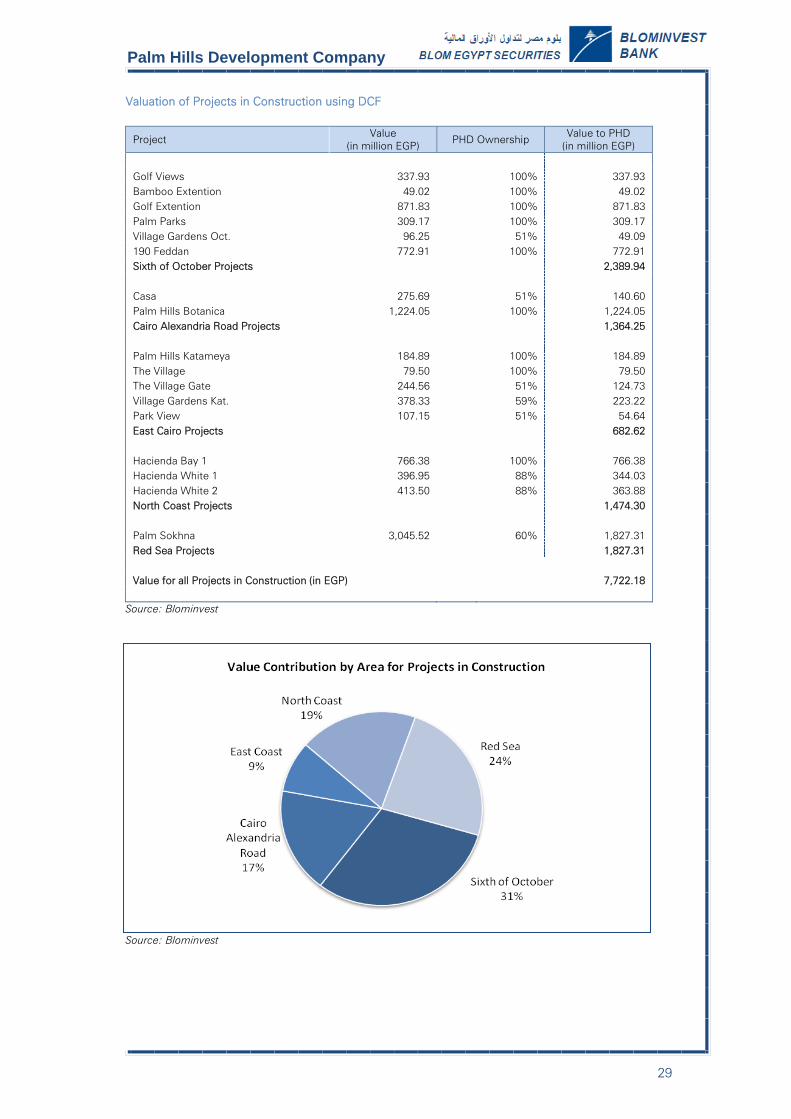
Valuation of Projects in Construction using DCF
Project Value
(in million EGP) PHD Ownership
Value to PHD (in million EGP)
Golf Views 337.93 100% 337.93 Bamboo Extention 49.02 100% 49.02 Golf Extention 871.83 100% 871.83 Palm Parks 309.17 100% 309.17 Village Gardens Oct. 96.25 51% 49.09 190 Feddan 772.91 100% 772.91 Sixth of October Projects 2,389.94
Casa 275.69 51% 140.60 Palm Hills Botanica 1,224.05 100% 1,224.05 Cairo Alexandria Road Projects 1,364.25
Palm Hills Katameya 184.89 100% 184.89 The Village 79.50 100% 79.50 The Village Gate 244.56 51% 124.73 Village Gardens Kat. 378.33 59% 223.22 Park View 107.15 51% 54.64 East Cairo Projects 682.62
Hacienda Bay 1 766.38 100% 766.38 Hacienda White 1 396.95 88% 344.03 Hacienda White 2 413.50 88% 363.88 North Coast Projects 1,474.30
Palm Sokhna 3,045.52 60% 1,827.31 Red Sea Projects 1,827.31
Value for all Projects in Construction (in EGP) 7,722.18
Source: Blominvest
Source: Blominvest
30
Palm Hills Development Company
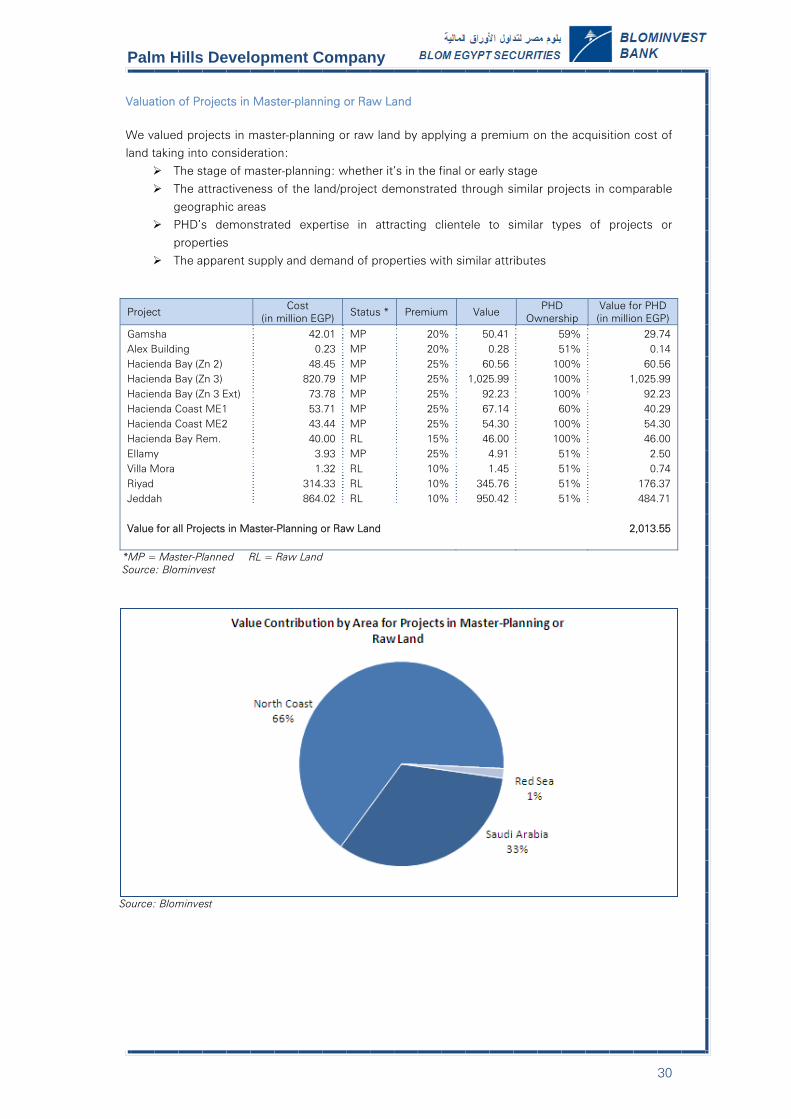
Valuation of Projects in Master-planning or Raw Land
We valued projects in master-planning or raw land by applying a premium on the acquisition cost of land taking into consideration:
The stage of master-planning: whether it’s in the final or early stage
The attractiveness of the land/project demonstrated through similar projects in comparable
geographic areas PHD’s demonstrated expertise in attracting clientele to similar types of projects or
properties
The apparent supply and demand of properties with similar attributes
*MP = Master-Planned RL = Raw Land Source: Blominvest
Source: Blominvest
Project Cost
(in million EGP) Status * Premium Value
PHD Ownership
Value for PHD (in million EGP)
Gamsha 42.01 MP 20% 50.41 59% 29.74 Alex Building 0.23 MP 20% 0.28 51% 0.14 Hacienda Bay (Zn 2) 48.45 MP 25% 60.56 100% 60.56 Hacienda Bay (Zn 3) 820.79 MP 25% 1,025.99 100% 1,025.99 Hacienda Bay (Zn 3 Ext) 73.78 MP 25% 92.23 100% 92.23 Hacienda Coast ME1 53.71 MP 25% 67.14 60% 40.29 Hacienda Coast ME2 43.44 MP 25% 54.30 100% 54.30 Hacienda Bay Rem. 40.00 RL 15% 46.00 100% 46.00 Ellamy 3.93 MP 25% 4.91 51% 2.50 Villa Mora 1.32 RL 10% 1.45 51% 0.74 Riyad 314.33 RL 10% 345.76 51% 176.37 Jeddah 864.02 RL 10% 950.42 51% 484.71
Value for all Projects in Master-Planning or Raw Land 2,013.55

31
Palm Hills Development Company
PROJECTED INCOME STATEMENT
Source: Blominvest
In EGP Million 2007 2008 2009 2010e 2011f 2012f 2013f 1000000
Sale of land attributable to villas & town houses 535 1,235 1,033 1,029 1,233 1,564 1,397 Revenue from construction contracts 113 118 259 285 322 Revenue from investment property 80 160 200 250 Total Revenue 535 1,235 1,146 1,227 1,652 2,049 1,969 Cost of land attributable to villas & town houses 142 293 284 298 364 461 419 Cost of land - infrastr. for villas and town houses 70 73 190 223 238 Cost of construction contracts 101 83 181 197 226 Cost of investment property 40 80 100 125 Total Cost of Revenue 142 293 455 494 815 981 1,007
Gross Profit 393 942 691 733 836 1,068 962
Selling/General/Administrative Expense 111 212 188 209 281 369 335 Operating Income 282 730 503 524 556 699 627
Interest Income 13 73 127 127 155 181 183 Interest Expense 77 109 89 98 128 148 152 Other Income - includes income from hospitality 5 25 20 60 70 80 80
Net Income Before Taxes 223 719 561 614 653 812 739
Adjustments in determining taxable profit 0 (431) (360) (314) (321) (272) (258) Taxable Income 223 288 201 300 332 540 480 Tax Expense 31 58 40 60 66 108 96
Net Income Before Minority Interest 192 661 521 554 586 704 643 Minority Interest (4) 2 46 50 53 63 58 Net Income to Shareholders 196.1 659.1 475.3 503.8 533.4 640.7 584.7

32
Palm Hills Development Company
PROJECTED BALANCE SHEET
Source: Blominvest
In Million EGP 2007 2008 2009 2010e 2011f 2012f 2013f Current Assets
Bank balances and cash 386 280 135 147 182 205 197 Accounts receivable and prepayments 107 319 547 921 1,239 1,537 1,477 Notes receivable 269 683 967 1,043 1,156 1,270 1,378 Development properties 3,780 4,940 5,474 6,295 7,239 8,325 9,574 Financial assets at fair value 0 203 128 118 127 123 98
Total Current Assets 4,543 6,425 7,251 8,524 9,943 11,460 12,724 Non-Current Assets
Investment property 483 483 823 823 1,263 Property and equipment 480 543 90 288 311 327 340 Advance payments for investment acquisitions 108 471 165 160 155 150 145 Invesment in an associate 0 0.25 0.25 0.25 0.25 0.25 0.25 Intangible assets 0 48 42 37 32 27 22 Notes receivable 626 1,658 2,501 2,455 2,130 2,623 2,501
Total Non-Current Assets 1,215 2,720 3,281 3,423 3,452 3,950 4,271 Total Assets 5,757 9,145 10,532 11,947 13,395 15,410 16,995 Current Liabilities
Bank overdrafts 486 111 146 141 208 270 242 Current portion of term loans 183 136 235 204 340 405 389 Current portion of land purchase liabilities 413 299 319 447 557 452 681 Accounts payable and accruals 232 308 253 351 537 688 657 Notes payable 260 261 400 492 756 945 912 Advances from customers 534 532 328 368 462 594 551 Billings in excess of costs 466 1,237 1,970 2,364 2,860 3,118 3,461 Income tax payable 32 58 40 70 80 90 100
Total Current Liabilities 2,606 2,942 3,691 4,437 5,801 6,562 6,993 Non-Current Liabilities
Term loans 3 380 355 436 658 810 778 Land purchase liabilities 1,856 1,653 872 820 770 724 681 Notes payable 115 1,172 1,948 1,546 1,973 2,430 2,549 Other non-current liabilities 34 165 253 354 460 576 719 Deferrred tax liability 1 2 2 5 5 5 5
Total Non-Current Liabilities 2,009 3,372 3,430 3,161 3,866 4,544 4,733 Total Liabilities 4,615 6,314 7,121 7,598 9,667 11,107 11,726 Equity
Share capital 800 932 1,398 2,097 2,097 2,097 2,097 Share premium 891 Statutory reserve 14 14 516 544 573 608 640 Retained earnings 226 851 1,249 1,708 1,058 1,598 2,532
Equity holders of the parent 1,040 2,688 3,163 4,349 3,728 4,303 5,269 Non-controlling interests 104 144 248 348 317 387 501
Total Equity 1,143 2,832 3,411 4,697 4,045 4,691 5,769 Total Liabilities & Equity 5,757 9,145 10,532 11,947 13,395 15,410 16,995
33
Palm Hills Developments Company
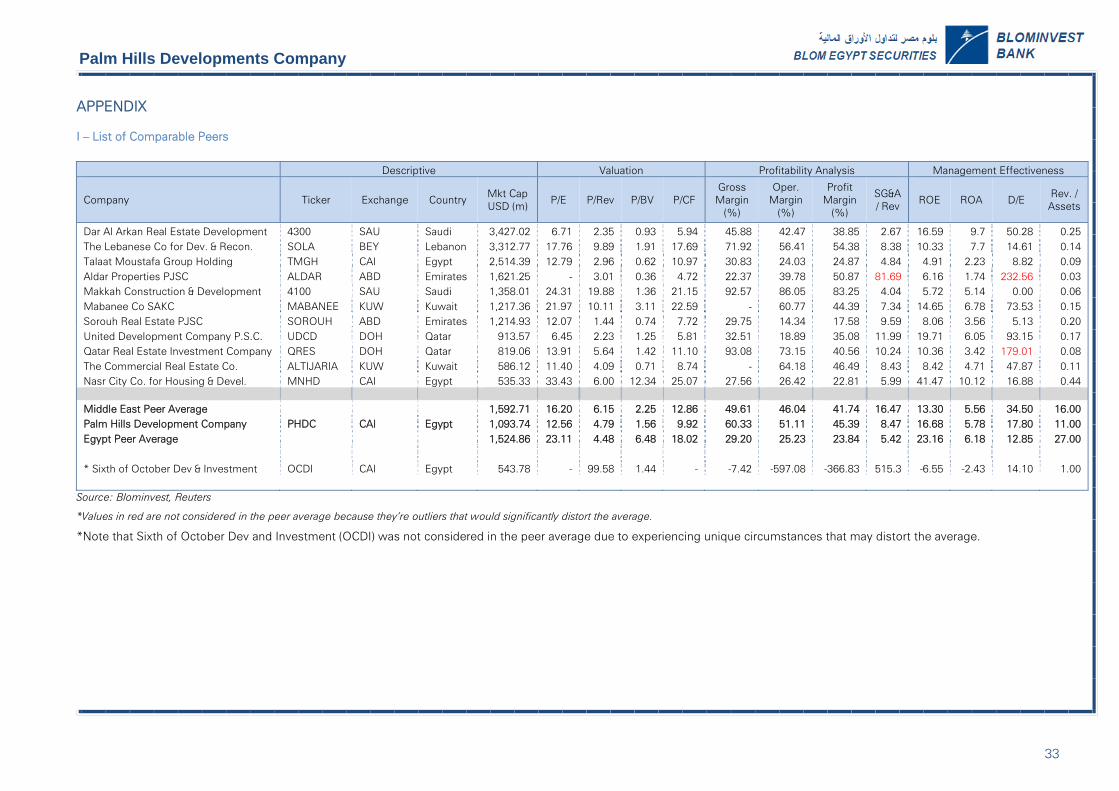
APPENDIX I – List of Comparable Peers
Descriptive Valuation Profitability Analysis Management Effectiveness
Company Ticker Exchange Country Mkt Cap USD (m)
P/E P/Rev P/BV P/CF Gross Margin
(%)
Oper. Margin
(%)
Profit Margin
(%)
SG&A / Rev
ROE ROA D/E Rev. / Assets
Dar Al Arkan Real Estate Development 4300 SAU Saudi 3,427.02 6.71 2.35 0.93 5.94 45.88 42.47 38.85 2.67 16.59 9.7 50.28 0.25 The Lebanese Co for Dev. & Recon. SOLA BEY Lebanon 3,312.77 17.76 9.89 1.91 17.69 71.92 56.41 54.38 8.38 10.33 7.7 14.61 0.14 Talaat Moustafa Group Holding TMGH CAI Egypt 2,514.39 12.79 2.96 0.62 10.97 30.83 24.03 24.87 4.84 4.91 2.23 8.82 0.09 Aldar Properties PJSC ALDAR ABD Emirates 1,621.25 - 3.01 0.36 4.72 22.37 39.78 50.87 81.69 6.16 1.74 232.56 0.03 Makkah Construction & Development 4100 SAU Saudi 1,358.01 24.31 19.88 1.36 21.15 92.57 86.05 83.25 4.04 5.72 5.14 0.00 0.06 Mabanee Co SAKC MABANEE KUW Kuwait 1,217.36 21.97 10.11 3.11 22.59 - 60.77 44.39 7.34 14.65 6.78 73.53 0.15 Sorouh Real Estate PJSC SOROUH ABD Emirates 1,214.93 12.07 1.44 0.74 7.72 29.75 14.34 17.58 9.59 8.06 3.56 5.13 0.20 United Development Company P.S.C. UDCD DOH Qatar 913.57 6.45 2.23 1.25 5.81 32.51 18.89 35.08 11.99 19.71 6.05 93.15 0.17 Qatar Real Estate Investment Company QRES DOH Qatar 819.06 13.91 5.64 1.42 11.10 93.08 73.15 40.56 10.24 10.36 3.42 179.01 0.08 The Commercial Real Estate Co. ALTIJARIA KUW Kuwait 586.12 11.40 4.09 0.71 8.74 - 64.18 46.49 8.43 8.42 4.71 47.87 0.11 Nasr City Co. for Housing & Devel. MNHD CAI Egypt 535.33 33.43 6.00 12.34 25.07 27.56 26.42 22.81 5.99 41.47 10.12 16.88 0.44 Middle East Peer Average 1,592.71 16.20 6.15 2.25 12.86 49.61 46.04 41.74 16.47 13.30 5.56 34.50 16.00 Palm Hills Development Company PHDC CAI Egypt 1,093.74 12.56 4.79 1.56 9.92 60.33 51.11 45.39 8.47 16.68 5.78 17.80 11.00 Egypt Peer Average 1,524.86 23.11 4.48 6.48 18.02 29.20 25.23 23.84 5.42 23.16 6.18 12.85 27.00
* Sixth of October Dev & Investment OCDI CAI Egypt 543.78 - 99.58 1.44 - -7.42 -597.08 -366.83 515.3 -6.55 -2.43 14.10 1.00
Source: Blominvest, Reuters
*Values in red are not considered in the peer average because they’re outliers that would significantly distort the average.
*Note that Sixth of October Dev and Investment (OCDI) was not considered in the peer average due to experiencing unique circumstances that may distort the average.
34
Palm Hills Developments Company
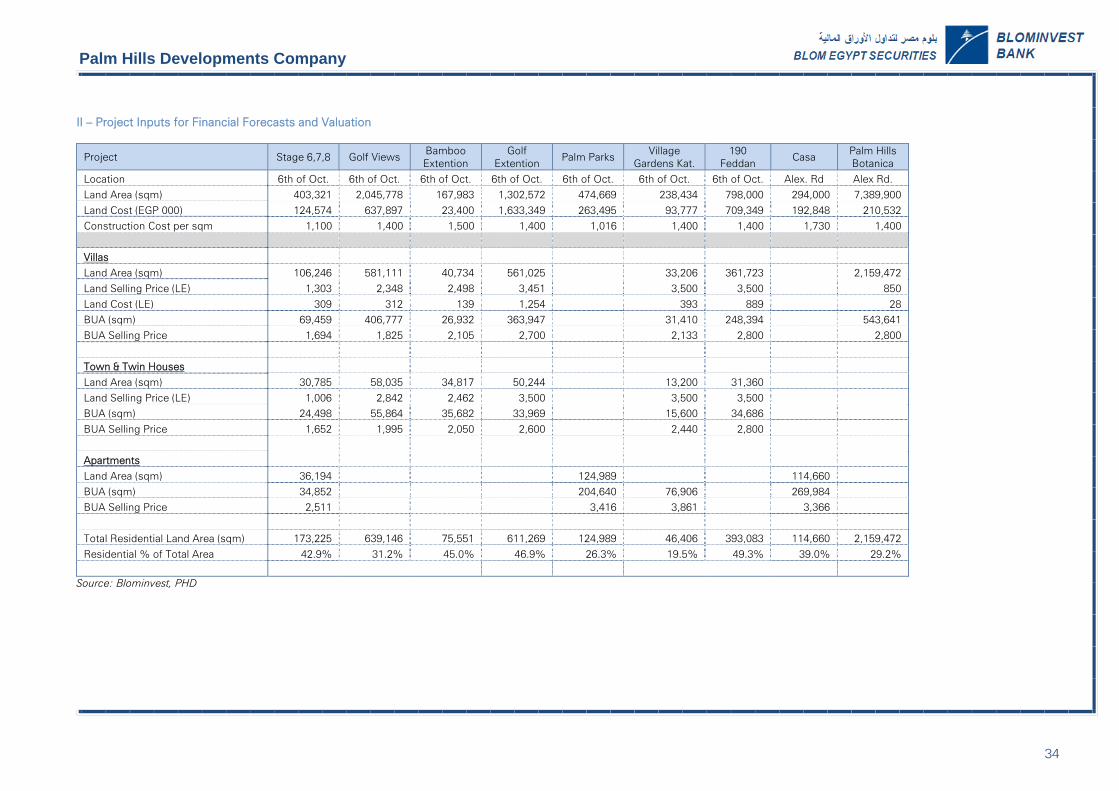
II – Project Inputs for Financial Forecasts and Valuation
Project Stage 6,7,8 Golf Views Bamboo Extention
Golf Extention
Palm Parks Village
Gardens Kat. 190
Feddan Casa
Palm Hills Botanica
Location 6th of Oct. 6th of Oct. 6th of Oct. 6th of Oct. 6th of Oct. 6th of Oct. 6th of Oct. Alex. Rd Alex Rd. Land Area (sqm) 403,321 2,045,778 167,983 1,302,572 474,669 238,434 798,000 294,000 7,389,900 Land Cost (EGP 000) 124,574 637,897 23,400 1,633,349 263,495 93,777 709,349 192,848 210,532 Construction Cost per sqm 1,100 1,400 1,500 1,400 1,016 1,400 1,400 1,730 1,400
Villas Land Area (sqm) 106,246 581,111 40,734 561,025 33,206 361,723 2,159,472 Land Selling Price (LE) 1,303 2,348 2,498 3,451 3,500 3,500 850 Land Cost (LE) 309 312 139 1,254 393 889 28 BUA (sqm) 69,459 406,777 26,932 363,947 31,410 248,394 543,641 BUA Selling Price 1,694 1,825 2,105 2,700 2,133 2,800 2,800
Town & Twin Houses Land Area (sqm) 30,785 58,035 34,817 50,244 13,200 31,360 Land Selling Price (LE) 1,006 2,842 2,462 3,500 3,500 3,500 BUA (sqm) 24,498 55,864 35,682 33,969 15,600 34,686 BUA Selling Price 1,652 1,995 2,050 2,600 2,440 2,800
Apartments Land Area (sqm) 36,194 124,989 114,660 BUA (sqm) 34,852 204,640 76,906 269,984 BUA Selling Price 2,511 3,416 3,861 3,366
Total Residential Land Area (sqm) 173,225 639,146 75,551 611,269 124,989 46,406 393,083 114,660 2,159,472 Residential % of Total Area 42.9% 31.2% 45.0% 46.9% 26.3% 19.5% 49.3% 39.0% 29.2%
Source: Blominvest, PHD

35
Palm Hills Developments Company
Continued - Project Inputs for Financial Forecasts
Project Palm Hills Katameya
The Village The Village
Gate Village
Gardens Kat. Park View
Hacienda Bay 1
Hacienda White 1
Hacienda White 2
Palm Sokhna
Location East Cairo East Cairo East Cairo East Cairo East Cairo North Coast North Coast North Coast Red Sea Land Area (sqm) 928,439 105,264 131,082 284,796 143,627 2,305,800 206,892 449,402 5,554,248 Land Cost (LE 000) 279,822 54,872 14,745 3,928 189,903 141,967 11,233 95,723 48,505 Construction Cost per sqm 1,400 1,096 1,720 1,450 679 1,743 2,120 2,120 2,200
Villas Land Area (sqm) 341,366 27,427 384,340 69,975 104,050 216,735 Land Selling Price (LE) 2,100 3,500 3,300 5,000 5,000 2,800 Land Cost (LE) 301 14 62 54 213 9 BUA (sqm) 219,280 24,847 139,657 28,060 68,448 266,281 BUA Selling Price 2,000 2,100 2,300 2,800 2,800 2,700
Town & Twin Houses Land Area (sqm) 84,332 8,400 31,792 14,240 57,270 Land Selling Price (LE) 2,150 3,500 3,300 2,645 3,000 BUA (sqm) 69,266 10,100 33,280 11,712 31,540 BUA Selling Price 1,970 2,100 2,300 2,800 2,665
Apartments Land Area (sqm) 63,156 46,849 227,193 32,859 119,560 521,576 BUA (sqm) 61,082 100,071 244,345 68,005 171,967 21,787 50,752 1,133,739 BUA Selling Price 3,683 5,023 3,200 4,102 5,200 8,000 8,000 5,900
Total Residential Land Area (sqm) 425,698 63,156 46,849 35,827 68,005 643,325 102,834 237,850 795,581 Residential % of Total Area 45.9% 60.0% 35.7% 12.6% 69.6% 27.9% 49.7% 52.9% 14.3%
Source: Blominvest, PHD

36
Palm Hills Developments Company
III – Forecasts of Recognizable Sales Cells highlighted in Blue indicate the duration of project construction - Percentages indicate proportion of expected contracts signed.
Project 2005 2006 2007 2008 2009 2010 2011 2012 2013 2014 2015 2016 2017 2018
Stage 6,7,8 20% 40% 60% 79% 98% 100%
Golf Views 20% 40% 50% 60% 66% 72% 78% 84% 90% 95% 100%
Bamboo Extention 45% 85% 93% 97% 100%
Golf Extention 20% 37% 50% 60% 70% 80% 90% 100%
Palm Parks 15% 30% 43% 53% 63% 73% 83% 93% 100%
Village Gardens Oct. 0% 5% 25% 45% 65% 85% 100%
190 Feddan 10% 25% 40 55% 70% 85% 100%
Casa 18% 36% 54% 63% 75% 87% 100%
Palm Hills Botanica 0% 20% 40% 60% 80% 100%
Palm Hills Katameya 20% 40% 50% 60% 74% 84% 94% 100%
The Village 20% 40% 60% 80% 88% 94% 100%
The Village Gate 30% 46% 56% 66% 76% 86% 100%
Village Gardens Kat. 53% 88% 92% 96% 100%
Park View 0% 10% 20% 30% 45% 60% 70% 80% 90% 100%
Hacienda Bay 1 10% 20% 30% 40% 50% 60% 70% 80% 90% 100%
Hacienda White 1 0% 40% 70% 100%
Hacienda White 2 0% 20% 40% 60% 80% 100%
Palm Sokhna 10% 20% 35% 50% 65% 80% 90% 100%
Source: Blominvest

37
Palm Hills Developments Company
IV – Project Costs used in Financial Forecasts and Valuation
Project Land Cost Liability Project
Leverage Land
Cost / sqm Constr.
Cost / sqm Infrastructure.
Cost / sqm
Sixth of October Cascade, Bamboo, Golden (6,7,8) 124,574 37,909 30.4% 309 1,100 100 Golf Views 637,897 353,388 55.4% 312 1,400 73 Bamboo Extention 23,400 0 0.0% 139 1,500 170 Golf Extention 1,633,349 1,485,322 90.9% 1,254 1,400 140 Palm Parks 263,495 146,535 55.6% 555 1,016 115 Village Gardens Oct. 93,777 0 0.0% 393 1,400 164 190 Feddan 709,349 586,751 82.7% 889 1,400 196 Cairo Alexandria Road Casa 192,848 74,691 38.7% 656 1,730 162 Palm Hills Botanica 210,532 0 0.0% 28 1,400 125 Sixth of October Totals 3,889,221 2,684,596 69.0%
East Cairo Palm Hills Katameya 279,822 230,690 82.4% 301 1,400 161 The Village 54,872 25,047 45.6% 521 1,096 125 The Village Gate 14,745 0 0.0% 112 1,720 169 Ellamy 3,928 0 0.0% 112 1,730 223 Park View 189,903 174,248 91.8% 1,945 679 77 City - Plot # 13 268,513 247,877 92.3% 500 Kapci (1) - Plot #3 242,818 223,812 92.2% 500 1,450 136 Kapci (2) - Plot #5 233,420 213,842 91.6% 500 1,450 136 New Cairo Totals 1,288,021 1,115,516 86.6%
North Coast & Alexandria Hacienda Bay 1 141,967 54,808 38.6% 62 1,743 146 Hacienda Bay (Zn 2) 48,451 20,323 41.9% 40 1,743 96 Hacienda Bay (Zn 3) 820,792 493,053 60.1% 98 1,743 138 Hacienda Bay (Zn 3 Ext) 73,784 38,114 51.7% 63 1,743 98 Hacienda Coast ME1 53,714 10,716 20.0% 92 2,000 169 Hacienda Coast ME2 43,441 38,239 88.0% 96 2,000 183 Hacienda White 1 11,233 0 0.0% 54 2,120 193 Hacienda White 2 95,723 28,544 29.8% 213 2,120 371 Alexandria 230,710 110,645 48.0% 17 6,000 371 North Coast & Alex Total 1,519,815 794,442 52.3%
Other Projects Palm Sokhna 48,505 35,568 73.3% 9 2,200 206 Villa Mora 1,321 367 27.8% 5 Gamsha 42,012 34,295 81.6% 8 2,400 250 Other Project Total 91,838 70,230 76.5%
All Projects 6,788,895 4,664,784 68.7%
Source: PHD

38
Palm Hills Developments Company
BLOMINVEST BANK s.a.l. Research Department Verdun, Rashid Karameh Str. POBOX 11-1540 Riad El Soloh Beirut 1107 2080 Lebanon Tel: +961 1 747 802 Fax: +961 1 737 414 [email protected] For your Queries: Marwan Mikhael, Head of Research [email protected] +961 1 747 802 Ext: 1421 Issa Frangieh, Senior Equity Analyst [email protected] +961 1 747 802 Ext: 1419 Nader Ali Khedr, Research Analyst [email protected] +202 3761 7682 Walid Sayegh, Economist walid.sayegh @blominvestbank.com +961 1 747 802 Ext: 1409
IMPORTANT DISCLAIMER
This research is based on current public information that we consider reliable, but we do not represent it is accurate or complete, and it should not be relied on as such. Blom Bank SAL or Blom Invest SAL can have investment banking and other business relationships with the companies covered by our research. We may seek investment banking or other business from the covered companies referred to in this research. Our salespeople, traders, and other professionals may provide oral or written market commentary or trading strategies to our clients and our proprietary trading desks that reflect opinions that are contrary to the opinions expressed in this research. Our asset management area, our trading desks and investing businesses may make investment decisions that are inconsistent with the recommendations or views expressed in this research. We and our affiliates, officers, directors, and employees, excluding equity analysts, will from time to time have long or short positions in, act as principal in, and buy or sell, the securities or derivatives (including options and warrants) thereof of covered companies referred to in this research. This research is not an offer to sell or the solicitation of an offer to buy any security in any jurisdiction where such an offer or solicitation would be illegal. It does not constitute a personal recommendation or take into account the particular investment objectives, financial situations, or needs of individual clients. Clients should consider whether any advice or recommendation in this research is suitable for their particular circumstances and, if appropriate, seek professional advice. The price and value of the investments referred to in this research and the income from them may fluctuate. Past performance is not a guide to future performance, future returns are not guaranteed, and a loss of original capital may occur. Certain transactions, including those involving futures, options, and other derivatives, give rise to substantial risk and are not suitable for all investors. Fluctuations in exchange rates could have adverse effects on the value or price of, or income derived from, certain investments. Copyright 2010 Blom Invest SAL. No part of this material may be copied, photocopied or duplicated in any form by any means or redistributed without the prior written consent of Blom Invest SAL.
Equity Rating Key Buy: A recommendation with a potential return
greater than 10% based on our current 12-month
view of total shareholder return*.
Hold: A recommendation with a potential return between -10% and 10% based on our current 12-
month view of total shareholder return.
Sell: A recommendation with a potential return of less than -10% based on our current 12-month view
of total shareholder return.
* Total Shareholder Return is calculated by the potential price growth over a 12-month period along
with the expected dividend yield.


![象印マホービン · C130-6B B394-6B CD-KD07-J BE243033L-OO 615784-00 617824-00 [bcm] m 0.09— 0.54 0.09— 0.54 0.36 0.18æ 0.36 0.09— 0.51 0.09— 0.54 0.09— 0.18](https://img.dokumen.tips/doc/110x75/6006ea97b39b06447208955a/efffff-c130-6b-b394-6b-cd-kd07-j-be243033l-oo-615784-00-617824-00.jpg)