Embed Size (px)
Citation preview
Palliative care services in Australia 2014
Palliative care services in Australia 2014 is the third in a planned series of annual reports providing a detailed picture of the national response to the palliative care needs of Australians. Information from a range of data sources from 2012–13 and, where indicated 2011–12, are presented, as are changes over time. There were more than 57,600 palliative care-related separations reported in public and private hospitals in 2011–12. Almost $4.7 million in Medicare Benefits Schedule payments was paid for palliative medicine specialist services in 2012–13.
Palliative care services in Australia 2014A
IHW

Australian Institute of Health and Welfare Canberra
Cat. no. HWI 128
Palliative care services in Australia 2014
The Australian Institute of Health and Welfare is a major national agency which provides reliable, regular and relevant information and statistics
on Australia’s health and welfare. The Institute’s mission is authoritative information and statistics to promote better health and wellbeing.
© Australian Institute of Health and Welfare 2014
This product, excluding the AIHW logo, Commonwealth Coat of Arms and any material owned by a third party or protected by a trademark, has been released under a Creative Commons BY 3.0 (CC-BY 3.0) licence. Excluded material owned by third parties may include, for example, design and layout, images obtained under licence from third parties and signatures. We have made all reasonable efforts to identify and label material owned by third parties.
You may distribute, remix and build upon this work. However, you must attribute the AIHW as the copyright holder of the work in compliance with our attribution policy available at <www.aihw.gov.au/copyright/>. The full terms and conditions of this licence are available at <http://creativecommons.org/licenses/by/3.0/au/>.
Enquiries relating to copyright should be addressed to the Head of the Digital and Media Communications Unit, Australian Institute of Health and Welfare, GPO Box 570, Canberra ACT 2601.
A complete list of the Institute’s publications is available from the Institute’s website <www.aihw.gov.au>.
ISBN 978-1-74249-634-4
Suggested citation Australian Institute of Health and Welfare 2014. Palliative care services in Australia 2014. Cat. no. HWI 128. Canberra: AIHW.
Australian Institute of Health and Welfare Board Chair Dr Mukesh Haikerwal AO
Director David Kalisch
Any enquiries about or comments on this publication should be directed to: Digital and Media Communications Unit Australian Institute of Health and Welfare GPO Box 570 Canberra ACT 2601 Tel: (02) 6244 1032 Email: [email protected]
Published by the Australian Institute of Health and Welfare This publication is printed in accordance with ISO 14001 (Environmental Management Systems) and ISO 9001 (Quality Management Systems). The paper is sourced from sustainably managed certified forests.
Please note that there is the potential for minor revisions of data in this report. Please check the online version at <www.aihw.gov.au> for any amendments.
iii
Contents Acknowledgments............................................................................................................................. vii
Abbreviations ................................................................................................................................... viii
Symbols ................................................................................................................................................ ix
Summary ................................................................................................................................................ x
1 Introduction .................................................................................................................................... 1
1.1 Defining palliative care .......................................................................................................... 1
1.2 Palliative care in Australia ..................................................................................................... 2
How is palliative care delivered in Australia? .................................................................... 2
1.3 National policies for palliative care ...................................................................................... 3
National Palliative Care Strategy .......................................................................................... 3
1.4 Report structure ...................................................................................................................... 4
2 Admitted patient palliative care ................................................................................................. 6
2.1 Introduction ............................................................................................................................. 6
2.2 Admitted patient palliative care in 2011–12 ........................................................................ 8
2.3 Profile of palliative care-related separations in 2011–12 ................................................... 9
Where was palliative care provided? ................................................................................... 9
How long did patients stay? ................................................................................................ 10
Who paid for the care? ......................................................................................................... 11
How was the care completed?............................................................................................. 12
2.4 Characteristics of admitted palliative care patients ......................................................... 16
Indigenous status .................................................................................................................. 16
Remoteness of patient’s usual residence ........................................................................... 17
Socioeconomic status ............................................................................................................ 18
2.5 Diagnosis-related information ............................................................................................ 19
Diseases based on diagnosis ................................................................................................ 19
2.6 Change over time in the amount of activity ...................................................................... 21
Change over time by sector ................................................................................................. 22
Change over time by jurisdiction ........................................................................................ 23
Change over time in length of stay ..................................................................................... 25
2.7 Palliative care and deaths in hospital ................................................................................. 26
Place of death ......................................................................................................................... 27
Palliative care patients and death ....................................................................................... 27
iv
3 Palliative care in general practice ............................................................................................. 30
3.1 Introduction ........................................................................................................................... 30
3.2 BEACH survey data .............................................................................................................. 30
3.3 Palliative care-related encounters ....................................................................................... 31
Patient demographics ........................................................................................................... 32
4 Services provided by palliative medicine specialists .......................................................... 34
4.1 Introduction ........................................................................................................................... 34
4.2 Characteristics of patients receiving palliative medicine specialist services ................ 35
4.3 Types of MBS-subsidised palliative medicine specialist services .................................. 36
MBS-subsidised palliative medicine specialist services by state and territory and remoteness ..................................................................................................................... 37
MBS-subsidised palliative medicine specialist services over time ................................ 39
Australian Government expenditure on MBS-subsidised palliative medicine specialist services ................................................................................................................. 40
5 Palliative care in residential aged care .................................................................................... 43
5.1 Data source ............................................................................................................................. 43
5.2 Characteristics of residential aged care residents receiving palliative care.................. 44
Geographical distribution of palliative care in residential aged care ............................ 45
Diagnoses ............................................................................................................................... 46
Separation mode ................................................................................................................... 47
5.3 Length of stay ........................................................................................................................ 47
Hospital leave ........................................................................................................................ 48
6 Palliative care-related medications .......................................................................................... 49
6.1 Introduction ........................................................................................................................... 49
6.2 Characteristics of patients receiving palliative care-related prescriptions ................... 50
6.3 Types of palliative care-related prescriptions and prescribing clinicians ..................... 52
Palliative care-related prescriptions by state and territory ............................................. 54
Palliative care-related prescriptions over time ................................................................. 56
Palliative care schedule items for pain relief ..................................................................... 57
All medications prescribed by palliative medicine specialists ....................................... 58
Australian Government expenditure on PBS/RPBS subsidised palliative care-related medications ..................................................................................................... 58
7 Workforce ..................................................................................................................................... 62
7.1 Introduction ........................................................................................................................... 62
7.2 Specialist palliative medicine physicians .......................................................................... 63
v
Characteristics of specialist palliative medicine physicians ........................................... 63
8 Palliative care outcomes ............................................................................................................. 67
8.1 Introduction ........................................................................................................................... 67
8.2 Palliative Care Outcomes data set ...................................................................................... 67
What data are reported? ....................................................................................................... 67
8.3 Patient characteristics ........................................................................................................... 68
Age and sex ............................................................................................................................ 68
Language spoken and country of birth .............................................................................. 69
Diagnosis ................................................................................................................................ 70
Socioeconomic status ............................................................................................................ 71
8.4 Episode length ....................................................................................................................... 72
8.5 Palliative care phases ............................................................................................................ 74
8.6 Palliative care outcome measures and benchmarks ........................................................ 75
9 Palliative care facilities and services ....................................................................................... 79
9.1 Hospice units in public hospitals ........................................................................................ 79
9.2 Private acute and psychiatric hospitals ............................................................................. 81
9.3 Veteran’s Community Nursing Program .......................................................................... 82
9.4 Palliative care Standards ...................................................................................................... 83
Supplementary tables ........................................................................................................................ 85
Appendix A: Identifying palliative care separations ................................................................ 103
Appendix B: Data sources ............................................................................................................... 106
Bettering the Evaluation and Care of Health survey ............................................................ 106
National Health Workforce Data Sets ..................................................................................... 106
National Hospital Morbidity Database ................................................................................... 107
Episode-based data ............................................................................................................. 107
Coverage ............................................................................................................................... 107
Standard admitted patient care data exclusions ............................................................. 108
Further information ............................................................................................................ 108
National Public Hospital Establishments Database .............................................................. 108
Data on geographical location ........................................................................................... 109
National Standards Assessment Program .............................................................................. 109
Palliative Care Outcomes Collaboration ................................................................................. 110
Population data .......................................................................................................................... 110
Mortality data ............................................................................................................................. 110
vi
Medicare Benefits Schedule data ............................................................................................. 111
Appendix C: Technical notes ......................................................................................................... 113
Population rates .......................................................................................................................... 113
Age-specific rates ....................................................................................................................... 113
Age-standardised rates .............................................................................................................. 113
Average annual rates of change ............................................................................................... 114
Descriptive analyses .................................................................................................................. 114
Disease-related information ...................................................................................................... 114
Information relating to cancer .................................................................................................. 115
Information relating to other specific diseases ............................................................... 117
A principal diagnosis of Palliative care ............................................................................. 117
Patient day statistics ................................................................................................................... 117
Quality of Indigenous status data ............................................................................................ 118
Appendix D: Classifications ........................................................................................................... 119
Australian Statistical Geographical Standard for Remoteness Areas ................................. 119
Index of Relative Socio-economic Advantage and Disadvantage, and the Index of Relative Socio-economic Disadvantage .................................................................. 119
International Statistical Classification of Diseases and Related Health Problems ............ 119
ICD-10-AM ................................................................................................................................. 120
Appendix E: PCOC benchmark revisions.................................................................................... 121
Glossary .............................................................................................................................................. 123
References .......................................................................................................................................... 127
List of tables ...................................................................................................................................... 131
List of figures .................................................................................................................................... 135
List of boxes ....................................................................................................................................... 136
Related publications ........................................................................................................................ 137

vii
Acknowledgments The authors of this report were Ms Amelia Armstrong, Ms Maddeline Mooney, Ms Felicity Summers, Mr Jason Thomson and Ms Agnes Tzimos of the Mental Health and Palliative Care Unit of the Australian Institute of Health and Welfare (AIHW). Other units of the AIHW that contributed data and feedback for this report were the Ageing and Aged Care Unit, the Expenditure and Workforce Unit, the Hospitals Data Unit and the Population Health and Primary Care Unit. The authors would like to acknowledge the support and contribution of Mr Gary Hanson, Head of the Mental Health and Palliative Care Unit.
Thanks go to the Palliative Care Section of the Australian Government Department of Health for support and feedback during the preparation of this report. Other areas of the department that contributed data and feedback were the PBS Information Management Section, the Pharmaceutical Policy Branch and the MBS Analytics Section in the Medicare Financing and Listing Branch.
Thanks also go to Professor Kathy Eagar and staff at the Palliative Care Outcomes Collaboration at the University of Wollongong for providing data for, and assistance with, drafting Chapter 8 of this report. In addition, the AIHW wishes to thank Dr Yvonne Luxford and staff at Palliative Care Australia for reviewing this report and for contributing information relating to its Palliative Care Standards, National Standards Assessment Program.

viii
Abbreviations ABS Australian Bureau of Statistics
ACFI Aged Care Funding Instrument
ACT Australian Capital Territory
AHPRA Australian Health Practitioners Regulation Agency
AIHW Australian Institute of Health and Welfare
ALoS average length of stay
ASGC Australian Standard Geographical Classification
ATC Anatomical Therapeutic Chemical
BEACH survey Bettering the Evaluation and Care of Health survey
DVA Australian Government Department of Veterans’ Affairs
ERP estimated resident population
FTE full-time-equivalent
GP general practitioner
HITH hospital-in-the-home
ICD International Statistical Classification of Diseases and Related Health Problems
ICD-10-AM International Statistical Classification of Diseases and Related Health Problems, 10th revision, Australian Modification
ICPC International Classification of Primary Care
IRSAD Index of Relative Socio-Economic Advantage and Disadvantage
IRSD Index of Relative Socio-Economic Disadvantage
MBS Medicare Benefits Schedule
METeOR Metadata Online Registry
NHMD National Hospital Morbidity Database
NHWDS National Health Workforce Data Set
NMDS National Minimum Data Set
NPHED National Public Hospital Establishments Database
ix
NRAS National Registration and Accreditation Scheme
NSAP National Standards Assessment Program
NSW New South Wales
NT Northern Territory
PBS Pharmaceutical Benefits Scheme
PCA Palliative Care Australia
PCOC Palliative Care Outcomes Collaboration
PCPSS Palliative Care Problem Severity Score
Qld Queensland
RPBS Repatriation Pharmaceutical Benefits Scheme
RUG—ADL Resource Utilisation Groups—Activities of Daily Living
SA South Australia
SAS Symptom Assessment Scale
SEIFA Socio-Economic Indexes for Areas
SLA statistical local area
Tas Tasmania
Vic Victoria
WA Western Australia
WHO World Health Organization
Symbols — nil or rounded to zero
. . not applicable
n.a. not available
n.o.s. not otherwise specified
n.p. not publishable because of small numbers, confidentiality or other concerns about the quality of the data
x
Summary This report on Australian palliative care services is the third in this series. It provides detailed information on the national response to the palliative care needs of Australians, using a range of Australian Institute of Health and Welfare and other data sources.
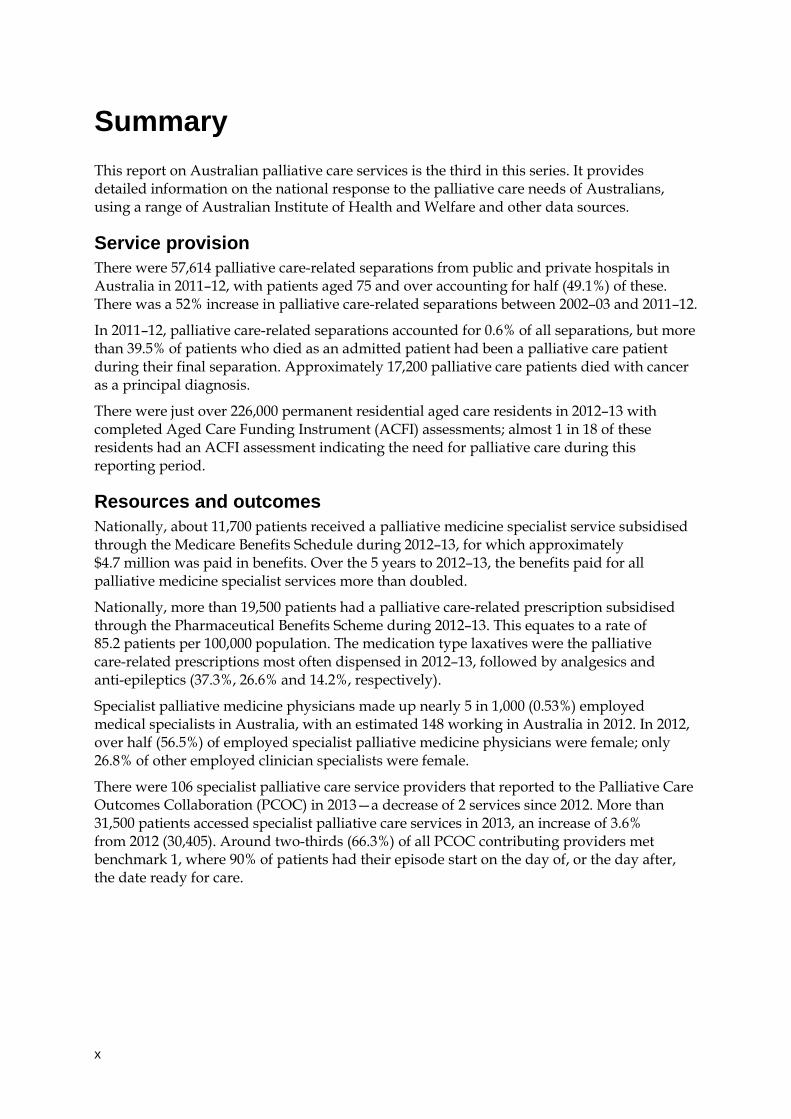
Service provision There were 57,614 palliative care-related separations from public and private hospitals in Australia in 2011–12, with patients aged 75 and over accounting for half (49.1%) of these. There was a 52% increase in palliative care-related separations between 2002–03 and 2011–12.
In 2011–12, palliative care-related separations accounted for 0.6% of all separations, but more than 39.5% of patients who died as an admitted patient had been a palliative care patient during their final separation. Approximately 17,200 palliative care patients died with cancer as a principal diagnosis.
There were just over 226,000 permanent residential aged care residents in 2012–13 with completed Aged Care Funding Instrument (ACFI) assessments; almost 1 in 18 of these residents had an ACFI assessment indicating the need for palliative care during this reporting period.
Resources and outcomes Nationally, about 11,700 patients received a palliative medicine specialist service subsidised through the Medicare Benefits Schedule during 2012–13, for which approximately $4.7 million was paid in benefits. Over the 5 years to 2012–13, the benefits paid for all palliative medicine specialist services more than doubled.
Nationally, more than 19,500 patients had a palliative care-related prescription subsidised through the Pharmaceutical Benefits Scheme during 2012–13. This equates to a rate of 85.2 patients per 100,000 population. The medication type laxatives were the palliative care-related prescriptions most often dispensed in 2012–13, followed by analgesics and anti-epileptics (37.3%, 26.6% and 14.2%, respectively).
Specialist palliative medicine physicians made up nearly 5 in 1,000 (0.53%) employed medical specialists in Australia, with an estimated 148 working in Australia in 2012. In 2012, over half (56.5%) of employed specialist palliative medicine physicians were female; only 26.8% of other employed clinician specialists were female.
There were 106 specialist palliative care service providers that reported to the Palliative Care Outcomes Collaboration (PCOC) in 2013—a decrease of 2 services since 2012. More than 31,500 patients accessed specialist palliative care services in 2013, an increase of 3.6% from 2012 (30,405). Around two-thirds (66.3%) of all PCOC contributing providers met benchmark 1, where 90% of patients had their episode start on the day of, or the day after, the date ready for care.

Palliative care services in Australia 2014 1
1 Introduction Palliative care services in Australia 2014 is the latest in the Australian Institute of Health and Welfare’s (AIHW’s) annual palliative care reports. It describes the activity and characteristics of Australia’s palliative care services, providing centralised and accessible information on a range of these services.
The latest year reported for most information in this report is 2012–13, except for chapters 2 and 9 which include 2011–12 data. Where appropriate and possible, time series data are also reported.
1.1 Defining palliative care It is important to note that there are a number of different definitions of palliative care and related terminologies that have been used both within Australia and internationally. For example, ‘hospice’, ‘end-of-life care’ and ‘specialist palliative care’ have all been used interchangeably with ‘palliative care’. Hence, definitions may vary between states and territories as well as within the sector.
The World Health Organization’s (WHO’s) definition of palliative care has been adopted by national palliative care data committees and peak representative bodies as the national definition for Australia (see Box 1.1).
Box 1.1: World Health Organization’s definition of palliative care Palliative care is an approach that improves the quality of life of patients and their families facing the problems associated with life-threatening illness, through the prevention and relief of suffering by means of early identification and impeccable assessment and treatment of pain and other problems, physical, psychosocial and spiritual. Palliative care: • provides relief from pain and other distressing symptoms • affirms life and regards dying as a normal process • intends neither to hasten or postpone death • integrates the psychological and spiritual aspects of patient care • offers a support system to help patients live as actively as possible until death • offers a support system to help the family cope during the patient’s illness and in their
own bereavement • uses a team approach to address the needs of patients and their families, including
bereavement counselling, if indicated • will enhance quality of life, and may also positively influence the course of illness • is applicable early in the course of illness, in conjunction with other therapies that are
intended to prolong life, such as chemotherapy or radiation therapy, and includes those investigations needed to better understand and manage distressing clinical complications.
Source: WHO 2002.
2 Palliative care services in Australia 2014
1.2 Palliative care in Australia Palliative care has been recognised in Australia as a distinct academic discipline since the 1980s (Tieman et al. 2005). That decade saw the start of a community-led call to recognise the needs of people who were dying and their families, and to provide services to meet those needs (DoHA 2005). Today, there is an increasing focus on the amount and quality of palliative care services.
In Australia and many other parts of the world, the demand for palliative care services is increasing due to the ageing of the population and the increases in the prevalence of cancer and other chronic diseases that accompany ageing (WHO 2014). In January 2014, the WHO and the Worldwide Palliative Care Alliance released the Global Atlas of Palliative Care at the End of Life—a tool to advocate for including palliative care in the global, regional and national health agendas (WHO 2014). The focus of this tool is to support countries in developing palliative care policies and services to ensure that palliative care is integrated into health systems. The WHO identified that, globally, palliative care needs are very high, with an estimated 20 million people needing end-of-life care each year. The WHO emphasised the need for increased access to palliative care across the globe, while reinforcing palliative care as a human rights issue. In May 2014, the World Health Assembly unanimously passed a resolution to strengthen palliative care as a component of comprehensive care throughout the life course.
Research that analysed the Western Australian linked health system data estimated that between 0.28% and 0.50% of people in the population in any one year could potentially benefit from access to palliative care services (Rosenwax et al. 2005). This same research estimated that around 50% to 90% of all people who died in Western Australia could have benefited from access to palliative care services. These findings are supported by recently published research from the United Kingdom which estimated that between 69% and 82% of people who died in England could have required palliative care (Murtagh et al. 2014).
If the Western Australian estimates are extrapolated nationally, this would suggest that between 60,000 and 107,600 of the 21,507,717 people enumerated in the 2011 Census (ABS 2013a) could potentially have benefited from access to palliative care services. Applying these same assumptions, between 73,500 and 132,300 of the people recorded as having died in 2011 could potentially also have similarly benefited.
How is palliative care delivered in Australia? Palliative care is provided in almost all settings where health care is provided, including neonatal units, paediatric services, acute hospitals, general practices, residential and community aged care services, and generalist community services. Specialist palliative care services operate from a variety of settings, including specialist inpatient consulting services, specialist inpatient settings, hospices and community-based specialist services (DoHA 2010).
The exact model of care provision differs across Australia (DoHA 2005). Each state and territory has specified an approach to palliative care in its jurisdiction (Senate Community Affairs References Committee 2012). The states and territories have different approaches to planning and delivering publicly funded services, different local service delivery practices and differently structured health-care systems. They also have varying demographics and remoteness profiles, and varying demands for particular types of services. In recent years, there has been a focus on expanding the practice of specialist palliative care teams to support
Palliative care services in Australia 2014 3
primary palliative care providers, often through consultative or consortium arrangements (AIHW 2010d).
In addition, a range of health professionals, other workers, carers and volunteers provide palliative care services. These include:
• nurses, including registered and non-registered nurses with and without specialised palliative care qualifications
• medical practitioners, including specialist palliative care physicians, hospital-based specialist palliative care trainees, hospital-based non-specialists and general practitioners (GPs)
• health professionals, including psychologists, physiotherapists, occupational therapists, social workers and pharmacists
• other occupations, including personal care assistants, chaplains, pastoral carers, massage therapists and music therapists
• volunteers • carers (formal and informal). While palliative care can be provided to patients in a variety of settings, a distinction is commonly made between care provided in hospitals (includes hospices or dedicated palliative care wards) and care provided in the community (such as in the patient’s home or in residential aged care facilities).
1.3 National policies for palliative care
National Palliative Care Strategy State and territory governments and the Australian Government have committed to improving the palliative care needs of Australians through the National Palliative Care Strategy 2010: supporting Australians to live well at the end of life (the Strategy). The Strategy was endorsed by Australian Health Ministers in 2010 to promote a coordinated and consistent approach to the delivery of high-quality palliative care across Australia. The Strategy acknowledges that responsibility for providing palliative care services ultimately rests with the states and territories, and that each state and territory has specified an approach to palliative care in its jurisdiction (Senate Community Affairs References Committee 2012). The Strategy aims to enhance and build on the work occurring within jurisdictions.
The Strategy outlines a number of priority ‘goal areas’ and ‘measures of success’ which aim to meet the identified demand for high-quality palliative care services across Australia. These ‘goal areas’ encompass building and enhancing the capacity of all relevant sectors to provide quality, appropriate and effective palliative care to all Australians who need it. In addition to the Strategy, each state and territory has a range of initiatives in place to improve the delivery of palliative care services.
In October 2012, the Senate Community Affairs References Committee released its report into palliative care in Australia (Senate Community Affairs References Committee 2012). The committee made 38 recommendations about palliative care, including the need for improved access to information on services. Noting the lack of comprehensive palliative care data, the committee highlighted in its report the need for consistent data collection practices to
4 Palliative care services in Australia 2014
become fixed in the clinical environment and for systems to be set up to enable palliative care data to be accurately measured.
The collection, analysis and reporting of palliative care data will assist policy makers, palliative care providers, researchers and the general public to better understand the amount and nature of palliative care activity in the Australian health-care sector. Reliable, accurate and comprehensive data about health-care services can improve the quality of care and lead to better health outcomes through:
• highlighting areas in need of more or different types of services • highlighting inequalities and inequities in access to and outcomes of care • helping to assess the uptake of guidelines and evidence-based practices and to evaluate
the effects these practices have on patient outcomes, as well as other consequences • helping to detect barriers to and facilitators of the uptake of best-practice patterns of care • helping to recognise changes in practice and consequent changes in outcomes • informing evidence-based policy and strategy decisions • providing practitioners with information and the ability to make appropriate decisions
and to provide high-quality care (AIHW 2008).
1.4 Report structure This 2014 report follows a similar structure to that of the 2013 report. There are nine chapters in this report:
• This introductory chapter (Chapter 1) defines palliative care, presents background information on palliative care services in Australia and outlines the major features of the current policy framework and government initiatives in providing palliative care services.
• Chapter 2 presents information on palliative care services provided in hospital, using the Admitted Patient Care National Minimum Data Set (NMDS) held by the AIHW. This is the most developed data collection currently available for reporting on palliative care activity.
• Chapter 3 presents patient demographics, diagnoses and referral information for palliative care-related general practice encounters from the Bettering the Evaluation and Care of Health (BEACH) survey, a national survey of GP activity.
• Attendances by palliative medicine specialists are discussed in Chapter 4. The data source for this chapter is the Medicare Benefits Schedule (MBS), administered by the Australian Government Department of Human Services. These data provide information on medical (including diagnostic) services and present an overview of the number and types of services provided by palliative medicine specialists under the MBS, as well as the characteristics of people who received these services.
• Palliative care delivered in residential aged care services is discussed in Chapter 5. The primary data collection used for this chapter is the Aged Care Funding Instrument (ACFI) data, held by the Australian Government Department of Social Services.
• Chapter 6 presents information on Pharmaceutical Benefits Scheme (PBS) subsidised prescriptions that are specific to palliative care. The data source for this is the PBS, administered by the Australian Government Department of Human Services.

Palliative care services in Australia 2014 5
• Chapter 7 provides information on the palliative care workforce derived from the National Health Workforce Data Set (NHWDS), which provides information for specialist palliative medicine physicians.
• Palliative care outcome measures are discussed in Chapter 8. This chapter was developed in conjunction with the Palliative Care Outcomes Collaboration (PCOC) and presents an overview of information on outcomes experienced by patients receiving palliative care.
• Chapter 9 includes information on various palliative care facilities and programs, including hospice care units in public hospitals from the National Public Hospital Establishments Database (NPHED), as well as Community Nursing services for clients of the Australian Government Department of Veterans’ Affairs (DVA).
• Supplementary tables provide additional data to the information presented in some chapters.
• The appendixes provide specific codes used to define ‘palliative care-related’ encounters and separations in particular chapters of this report (Appendix A), information on the data sources used (Appendix B), technical notes on data presentation and calculation of rates (Appendix C), information on the classifications used (Appendix D) and PCOC benchmark revisions (Appendix E).
The aim of this report is to provide a comprehensive view of the broad range of palliative care-related services provided in Australia. It should be noted, however, that achieving this aim is dictated to a large extent by the availability of good-quality comparable national data. Consequently, there are some overlaps and gaps in the information on services provided in this report.
6 Palliative care services in Australia 2014
2 Admitted patient palliative care
2.1 Introduction This chapter presents information on episodes of admitted patient palliative care occurring in hospitals, using data on palliative care-related separations from the National Hospital Morbidity Database (NHMD) for 2011–12 (see ‘Key concepts’ box below for an explanation of bold terms in this chapter).
It should be noted that while NHMD data for the 2012–13 year have been available from May 2014, the time taken in the routine processes to receive data clearance from all jurisdictions within the required time frame precluded use of these data in this report.
The information from the NHMD indicates the number of separations for which palliation was a substantial component of the care provided, and does not allow for reporting on the number of people who received such care. Data are not available on the number of separations accrued by any individual(s), so all tabulations in this chapter are in terms of separation events, not patients. Time series data for the period from 2002–03 to 2011–12 have been presented to show the changes in separations for palliative care over this period. Wherever possible, corresponding data on all separations have been provided for comparison purposes.
The admitted patient setting is often where palliative care is provided and can include a hospice, a dedicated palliative care ward or other wards within a hospital (Willard & Luker 2006). A range of complex factors contribute to this, such as patient and carer preference, rapid and sometimes unexpected deterioration, availability of carers and other health-care services, or the inability to manage at home when there is no access to admitted patient care (Glare et al. 2003). In addition, some terminal conditions may require a level of palliative care that hospitals are best equipped to provide. Consequently, a substantial proportion of palliative care in Australia is provided within the admitted patient setting (PCOC 2010).
This chapter discusses the following five key topics, using 2011–12 data:
• the number of admitted patient palliative care-related separations • the demographic and clinical characteristics of patients who received palliative care • the nature of the palliative care service, including what care was provided and the main
funding source • change over time in the number of admitted patient palliative care-related separations
and the average length of stay in hospital • the proportion of people who died while in admitted patient care who were palliative
care patients. In this chapter, a palliative care-related separation is defined as an episode of admitted patient care for which the principal clinical intent was palliation during all or part of that episode. Two NHMD data items—’Care type’ (see ‘Key concepts’ box) and ‘Diagnosis’—are used to capture information on palliative care: if either (or both) has a code of ‘palliative care’, that separation is included as being in scope (see Appendix A for further information). It is important to note that this means that, although there may also be other separations within the NHMD that include palliative care services, these separations are not counted, as palliative care is not recorded as the main care type and/or diagnosis during that separation.
Palliative care services in Australia 2014 7
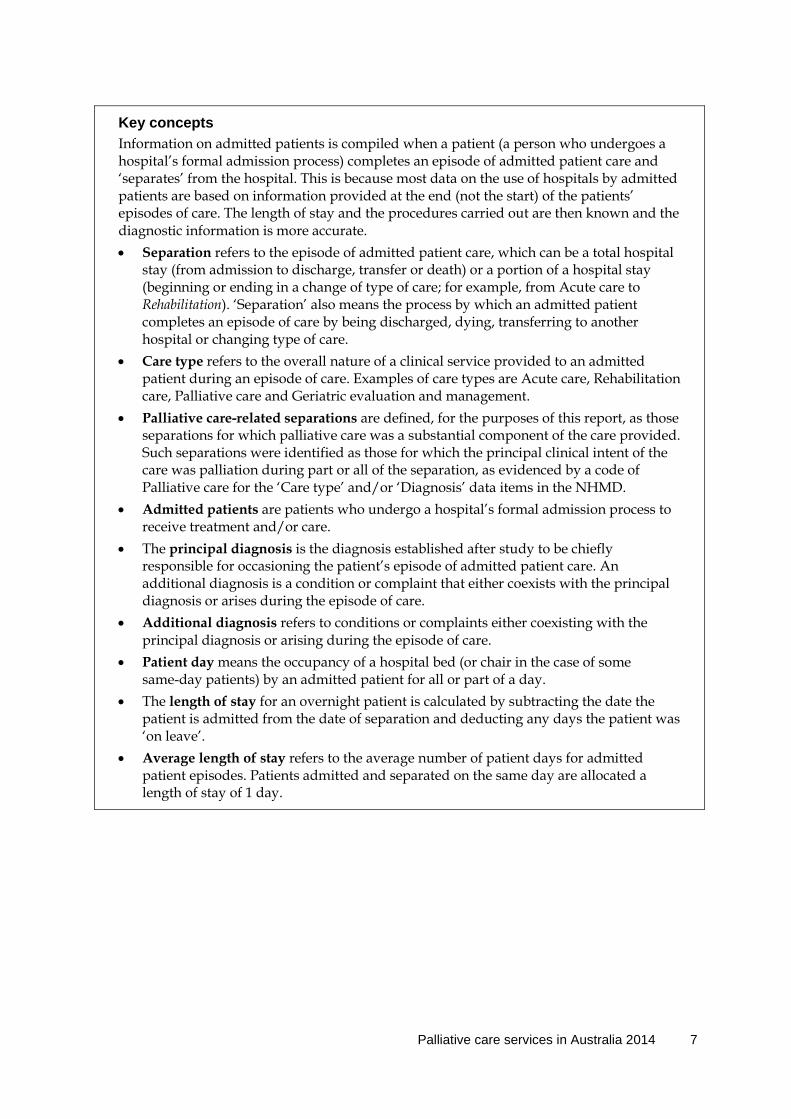
Key concepts Information on admitted patients is compiled when a patient (a person who undergoes a hospital’s formal admission process) completes an episode of admitted patient care and ‘separates’ from the hospital. This is because most data on the use of hospitals by admitted patients are based on information provided at the end (not the start) of the patients’ episodes of care. The length of stay and the procedures carried out are then known and the diagnostic information is more accurate. • Separation refers to the episode of admitted patient care, which can be a total hospital
stay (from admission to discharge, transfer or death) or a portion of a hospital stay (beginning or ending in a change of type of care; for example, from Acute care to Rehabilitation). ‘Separation’ also means the process by which an admitted patient completes an episode of care by being discharged, dying, transferring to another hospital or changing type of care.
• Care type refers to the overall nature of a clinical service provided to an admitted patient during an episode of care. Examples of care types are Acute care, Rehabilitation care, Palliative care and Geriatric evaluation and management.
• Palliative care-related separations are defined, for the purposes of this report, as those separations for which palliative care was a substantial component of the care provided. Such separations were identified as those for which the principal clinical intent of the care was palliation during part or all of the separation, as evidenced by a code of Palliative care for the ‘Care type’ and/or ‘Diagnosis’ data items in the NHMD.
• Admitted patients are patients who undergo a hospital’s formal admission process to receive treatment and/or care.
• The principal diagnosis is the diagnosis established after study to be chiefly responsible for occasioning the patient’s episode of admitted patient care. An additional diagnosis is a condition or complaint that either coexists with the principal diagnosis or arises during the episode of care.
• Additional diagnosis refers to conditions or complaints either coexisting with the principal diagnosis or arising during the episode of care.
• Patient day means the occupancy of a hospital bed (or chair in the case of some same-day patients) by an admitted patient for all or part of a day.
• The length of stay for an overnight patient is calculated by subtracting the date the patient is admitted from the date of separation and deducting any days the patient was ‘on leave’.
• Average length of stay refers to the average number of patient days for admitted patient episodes. Patients admitted and separated on the same day are allocated a length of stay of 1 day.
8 Palliative care services in Australia 2014
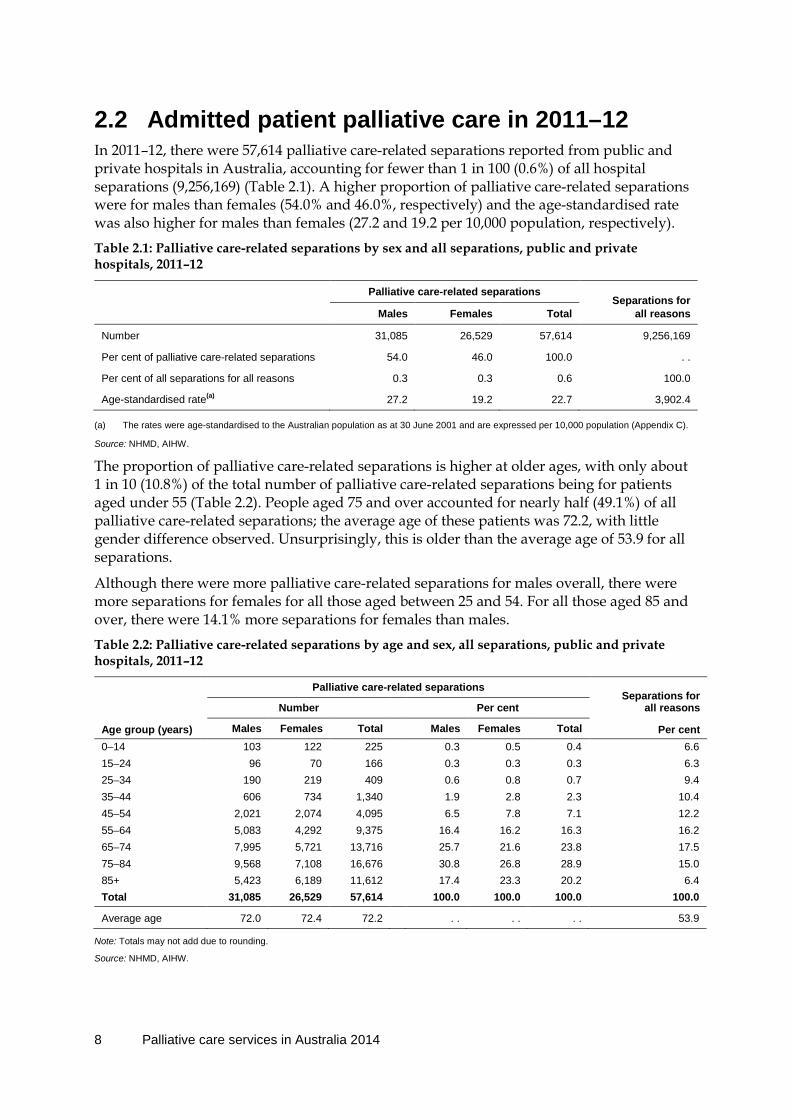
2.2 Admitted patient palliative care in 2011–12 In 2011–12, there were 57,614 palliative care-related separations reported from public and private hospitals in Australia, accounting for fewer than 1 in 100 (0.6%) of all hospital separations (9,256,169) (Table 2.1). A higher proportion of palliative care-related separations were for males than females (54.0% and 46.0%, respectively) and the age-standardised rate was also higher for males than females (27.2 and 19.2 per 10,000 population, respectively).
Table 2.1: Palliative care-related separations by sex and all separations, public and private hospitals, 2011–12
Palliative care-related separations Separations for
all reasons Males Females Total
Number 31,085 26,529 57,614 9,256,169
Per cent of palliative care-related separations 54.0 46.0 100.0 . .
Per cent of all separations for all reasons 0.3 0.3 0.6 100.0
Age-standardised rate(a) 27.2 19.2 22.7 3,902.4
(a) The rates were age-standardised to the Australian population as at 30 June 2001 and are expressed per 10,000 population (Appendix C).
Source: NHMD, AIHW.
The proportion of palliative care-related separations is higher at older ages, with only about 1 in 10 (10.8%) of the total number of palliative care-related separations being for patients aged under 55 (Table 2.2). People aged 75 and over accounted for nearly half (49.1%) of all palliative care-related separations; the average age of these patients was 72.2, with little gender difference observed. Unsurprisingly, this is older than the average age of 53.9 for all separations.
Although there were more palliative care-related separations for males overall, there were more separations for females for all those aged between 25 and 54. For all those aged 85 and over, there were 14.1% more separations for females than males.
Table 2.2: Palliative care-related separations by age and sex, all separations, public and private hospitals, 2011–12
Palliative care-related separations Separations for
all reasons
Age group (years)
Number Per cent
Males Females Total Males Females Total Per cent 0–14 103 122 225 0.3 0.5 0.4 6.6 15–24 96 70 166 0.3 0.3 0.3 6.3 25–34 190 219 409 0.6 0.8 0.7 9.4 35–44 606 734 1,340 1.9 2.8 2.3 10.4 45–54 2,021 2,074 4,095 6.5 7.8 7.1 12.2 55–64 5,083 4,292 9,375 16.4 16.2 16.3 16.2 65–74 7,995 5,721 13,716 25.7 21.6 23.8 17.5 75–84 9,568 7,108 16,676 30.8 26.8 28.9 15.0 85+ 5,423 6,189 11,612 17.4 23.3 20.2 6.4 Total 31,085 26,529 57,614 100.0 100.0 100.0 100.0
Average age 72.0 72.4 72.2 . . . . . . 53.9
Note: Totals may not add due to rounding.
Source: NHMD, AIHW.
Palliative care services in Australia 2014 9
2.3 Profile of palliative care-related separations in 2011–12
Where was palliative care provided?
Public versus private hospitals
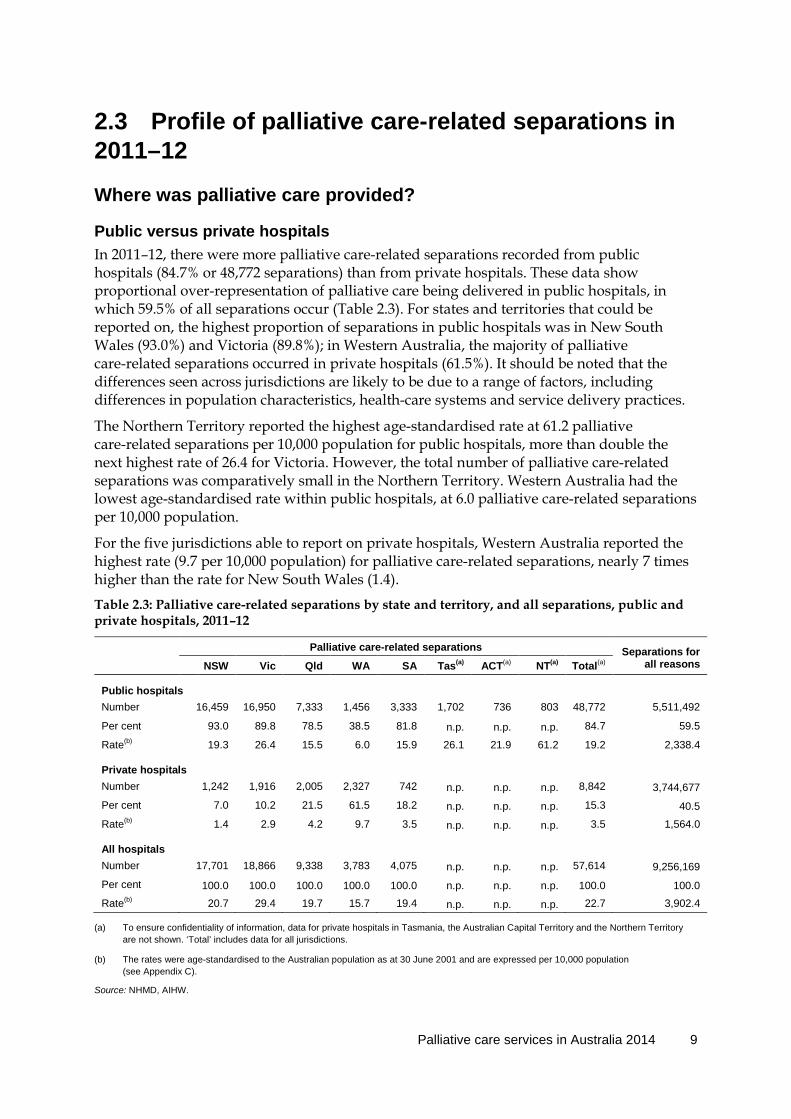
In 2011–12, there were more palliative care-related separations recorded from public hospitals (84.7% or 48,772 separations) than from private hospitals. These data show proportional over-representation of palliative care being delivered in public hospitals, in which 59.5% of all separations occur (Table 2.3). For states and territories that could be reported on, the highest proportion of separations in public hospitals was in New South Wales (93.0%) and Victoria (89.8%); in Western Australia, the majority of palliative care-related separations occurred in private hospitals (61.5%). It should be noted that the differences seen across jurisdictions are likely to be due to a range of factors, including differences in population characteristics, health-care systems and service delivery practices.
The Northern Territory reported the highest age-standardised rate at 61.2 palliative care-related separations per 10,000 population for public hospitals, more than double the next highest rate of 26.4 for Victoria. However, the total number of palliative care-related separations was comparatively small in the Northern Territory. Western Australia had the lowest age-standardised rate within public hospitals, at 6.0 palliative care-related separations per 10,000 population.
For the five jurisdictions able to report on private hospitals, Western Australia reported the highest rate (9.7 per 10,000 population) for palliative care-related separations, nearly 7 times higher than the rate for New South Wales (1.4).
Table 2.3: Palliative care-related separations by state and territory, and all separations, public and private hospitals, 2011–12
Palliative care-related separations Separations for all reasons NSW Vic Qld WA SA Tas(a) ACT(a) NT(a) Total(a)
Public hospitals
Number 16,459 16,950 7,333 1,456 3,333 1,702 736 803 48,772 5,511,492 Per cent 93.0 89.8 78.5 38.5 81.8 n.p. n.p. n.p. 84.7 59.5 Rate(b) 19.3 26.4 15.5 6.0 15.9 26.1 21.9 61.2 19.2 2,338.4
Private hospitals
Number 1,242 1,916 2,005 2,327 742 n.p. n.p. n.p. 8,842 3,744,677 Per cent 7.0 10.2 21.5 61.5 18.2 n.p. n.p. n.p. 15.3 40.5 Rate(b) 1.4 2.9 4.2 9.7 3.5 n.p. n.p. n.p. 3.5 1,564.0
All hospitals
Number 17,701 18,866 9,338 3,783 4,075 n.p. n.p. n.p. 57,614 9,256,169 Per cent 100.0 100.0 100.0 100.0 100.0 n.p. n.p. n.p. 100.0 100.0
Rate(b) 20.7 29.4 19.7 15.7 19.4 n.p. n.p. n.p. 22.7 3,902.4
(a) To ensure confidentiality of information, data for private hospitals in Tasmania, the Australian Capital Territory and the Northern Territory are not shown. ‘Total’ includes data for all jurisdictions.
(b) The rates were age-standardised to the Australian population as at 30 June 2001 and are expressed per 10,000 population (see Appendix C).
Source: NHMD, AIHW.
10 Palliative care services in Australia 2014
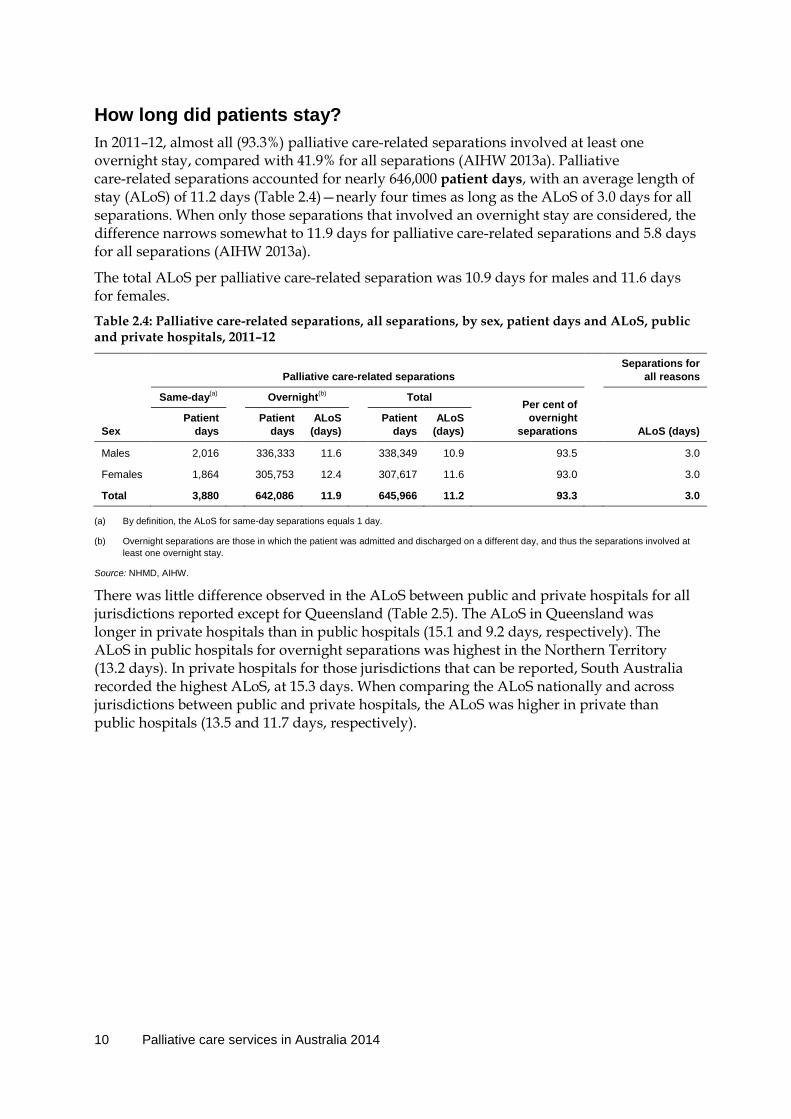
How long did patients stay? In 2011–12, almost all (93.3%) palliative care-related separations involved at least one overnight stay, compared with 41.9% for all separations (AIHW 2013a). Palliative care-related separations accounted for nearly 646,000 patient days, with an average length of stay (ALoS) of 11.2 days (Table 2.4)—nearly four times as long as the ALoS of 3.0 days for all separations. When only those separations that involved an overnight stay are considered, the difference narrows somewhat to 11.9 days for palliative care-related separations and 5.8 days for all separations (AIHW 2013a).
The total ALoS per palliative care-related separation was 10.9 days for males and 11.6 days for females.
Table 2.4: Palliative care-related separations, all separations, by sex, patient days and ALoS, public and private hospitals, 2011–12
Palliative care-related separations
Separations for all reasons
Same-day(a) Overnight(b) Total Per cent of overnight
separations
ALoS (days) Sex Patient
days Patient
days ALoS
(days) Patient
days ALoS
(days)
Males 2,016 336,333 11.6 338,349 10.9 93.5 3.0
Females 1,864 305,753 12.4 307,617 11.6 93.0 3.0
Total 3,880 642,086 11.9 645,966 11.2 93.3 3.0
(a) By definition, the ALoS for same-day separations equals 1 day.
(b) Overnight separations are those in which the patient was admitted and discharged on a different day, and thus the separations involved at least one overnight stay.
Source: NHMD, AIHW.
There was little difference observed in the ALoS between public and private hospitals for all jurisdictions reported except for Queensland (Table 2.5). The ALoS in Queensland was longer in private hospitals than in public hospitals (15.1 and 9.2 days, respectively). The ALoS in public hospitals for overnight separations was highest in the Northern Territory (13.2 days). In private hospitals for those jurisdictions that can be reported, South Australia recorded the highest ALoS, at 15.3 days. When comparing the ALoS nationally and across jurisdictions between public and private hospitals, the ALoS was higher in private than public hospitals (13.5 and 11.7 days, respectively).

Palliative care services in Australia 2014 11
Table 2.5: Palliative care-related separations, by state and territory, ALoS, public and private hospitals, 2011–12
ALoS (days)
NSW Vic Qld WA SA Tas(a) ACT(a) NT(a) Total(a)
Public hospitals
Overnight separations 12.3 12.1 9.2 10.0 12.2 11.4 12.0 13.2 11.7
Total separations(b) 11.1 11.7 8.6 9.4 11.9 11.0 11.6 12.4 10.9
Private hospitals
Overnight separations 13.6 12.4 15.1 11.9 15.3 n.p. n.p. n.p. 13.5
Total separations(b) 13.5 12.2 14.3 10.2 14.9 n.p. n.p. n.p. 12.7
All hospitals
Overnight separations 12.4 12.1 10.5 11.1 12.8 n.p. n.p. n.p. 11.9
Total separations(b) 11.3 11.7 9.8 9.9 12.5 n.p. n.p. n.p. 11.2
(a) To ensure confidentiality of information, data for private hospitals in Tasmania, the Australian Capital Territory and the Northern Territory are not shown. ‘Total separations’ includes data for all jurisdictions.
(b) ‘Total separations’ include same-day and overnight separations. By definition, the ALoS for same-day separations equals 1 day.
Source: NHMD, AIHW.
Who paid for the care?
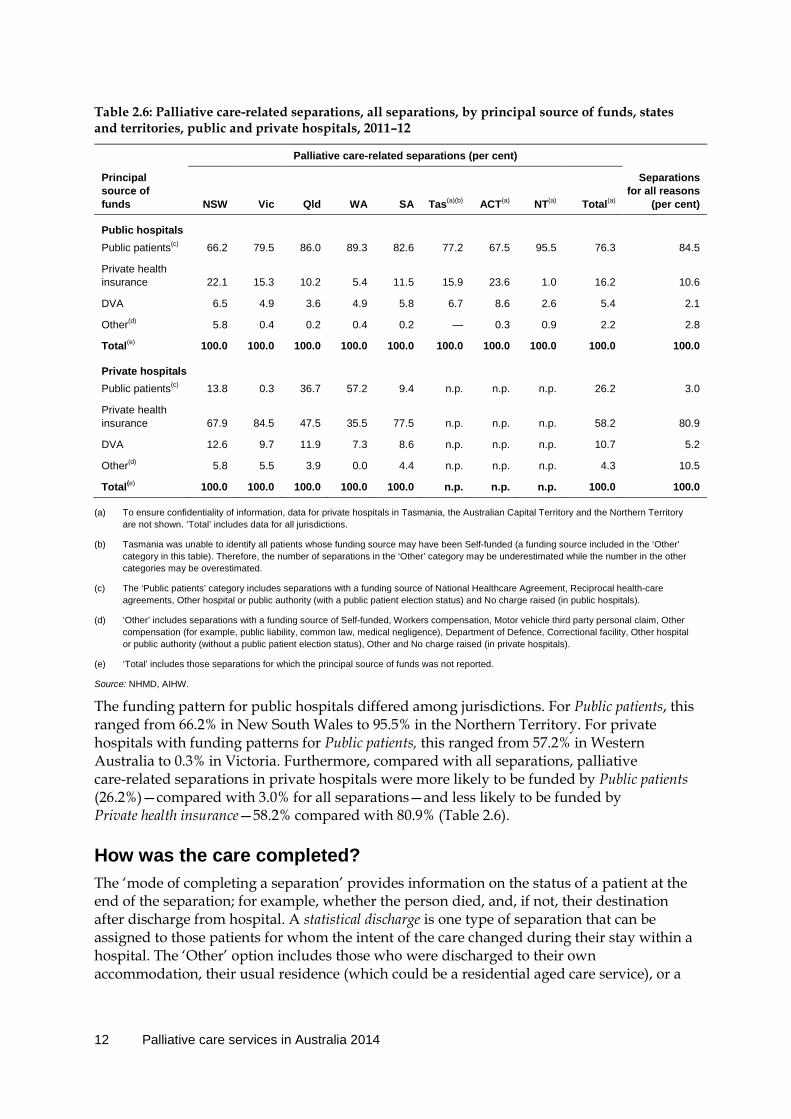
Data on the principal source of funding for a separation are also recorded in the NHMD. In 2011–12, the highest proportion of funding attributed to public hospitals for all palliative care-related separations was for Public patients at 76.3%; the next most often recorded funding source was Private health insurance (16.2%). In comparison, for all separations in public hospitals, the proportion of funding attributed to Public patients was higher at 84.5%, with Private health insurance and the Australian Government Department of Veterans’ Affairs contributing 10.6% and 2.1%, respectively. In private hospitals, Private health insurance was the main funding source for all palliative care-related separations (58.2%), compared with 80.9% for all separations (Table 2.6).
12 Palliative care services in Australia 2014
Table 2.6: Palliative care-related separations, all separations, by principal source of funds, states and territories, public and private hospitals, 2011–12
Palliative care-related separations (per cent)
Separations for all reasons
(per cent)
Principal source of funds NSW Vic Qld WA SA Tas(a)(b) ACT(a) NT(a) Total(a)
Public hospitals
Public patients(c) 66.2 79.5 86.0 89.3 82.6 77.2 67.5 95.5 76.3 84.5
Private health insurance 22.1 15.3 10.2 5.4 11.5 15.9 23.6 1.0 16.2 10.6
DVA 6.5 4.9 3.6 4.9 5.8 6.7 8.6 2.6 5.4 2.1
Other(d) 5.8 0.4 0.2 0.4 0.2 — 0.3 0.9 2.2 2.8
Total(e) 100.0 100.0 100.0 100.0 100.0 100.0 100.0 100.0 100.0 100.0
Private hospitals
Public patients(c) 13.8 0.3 36.7 57.2 9.4 n.p. n.p. n.p. 26.2 3.0
Private health insurance 67.9 84.5 47.5 35.5 77.5 n.p. n.p. n.p. 58.2 80.9
DVA 12.6 9.7 11.9 7.3 8.6 n.p. n.p. n.p. 10.7 5.2
Other(d) 5.8 5.5 3.9 0.0 4.4 n.p. n.p. n.p. 4.3 10.5
Total(e) 100.0 100.0 100.0 100.0 100.0 n.p. n.p. n.p. 100.0 100.0
(a) To ensure confidentiality of information, data for private hospitals in Tasmania, the Australian Capital Territory and the Northern Territory are not shown. ‘Total’ includes data for all jurisdictions.
(b) Tasmania was unable to identify all patients whose funding source may have been Self-funded (a funding source included in the ‘Other’ category in this table). Therefore, the number of separations in the ‘Other’ category may be underestimated while the number in the other categories may be overestimated.
(c) The ‘Public patients’ category includes separations with a funding source of National Healthcare Agreement, Reciprocal health-care agreements, Other hospital or public authority (with a public patient election status) and No charge raised (in public hospitals).
(d) ‘Other’ includes separations with a funding source of Self-funded, Workers compensation, Motor vehicle third party personal claim, Other compensation (for example, public liability, common law, medical negligence), Department of Defence, Correctional facility, Other hospital or public authority (without a public patient election status), Other and No charge raised (in private hospitals).
(e) ‘Total’ includes those separations for which the principal source of funds was not reported.
Source: NHMD, AIHW.
The funding pattern for public hospitals differed among jurisdictions. For Public patients, this ranged from 66.2% in New South Wales to 95.5% in the Northern Territory. For private hospitals with funding patterns for Public patients, this ranged from 57.2% in Western Australia to 0.3% in Victoria. Furthermore, compared with all separations, palliative care-related separations in private hospitals were more likely to be funded by Public patients (26.2%)—compared with 3.0% for all separations—and less likely to be funded by Private health insurance—58.2% compared with 80.9% (Table 2.6).
How was the care completed?
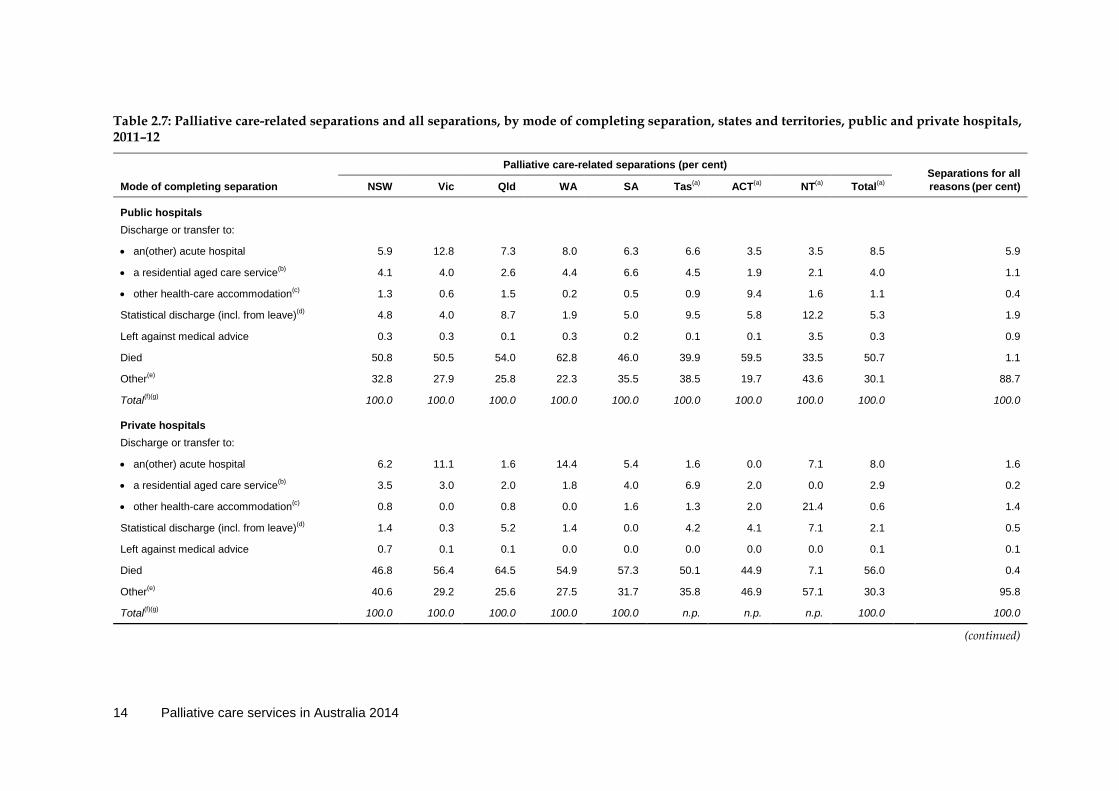
The ‘mode of completing a separation’ provides information on the status of a patient at the end of the separation; for example, whether the person died, and, if not, their destination after discharge from hospital. A statistical discharge is one type of separation that can be assigned to those patients for whom the intent of the care changed during their stay within a hospital. The ‘Other’ option includes those who were discharged to their own accommodation, their usual residence (which could be a residential aged care service), or a

Palliative care services in Australia 2014 13
welfare institution (such as a prison, hostel or group home providing primarily welfare services).
More than half of all palliative care-related separations ended with the patient’s death (51.5%) compared with about 1 in 100 (0.8%) for all separations. Palliative care-related separations ended in a similar way across both public and private hospitals. However, jurisdictional differences were evident within and across sectors. For states or territories that could be reported on, the proportion of palliative care-related separations ending with the patient’s death was lowest in public hospitals in the Northern Territory (33.5%) and highest in Western Australia (62.8%) and the Australian Capital Territory (59.5%). For private hospitals, Queensland reported the highest percentage of separations ending with the patient’s death (64.5%), which was higher than the national average for the sector (56.0%). Private palliative care patients were more likely to be transferred to another hospital in Western Australia compared with other jurisdictions (Table 2.7).
14 Palliative care services in Australia 2014
Table 2.7: Palliative care-related separations and all separations, by mode of completing separation, states and territories, public and private hospitals, 2011–12
Palliative care-related separations (per cent) Separations for all reasons (per cent) Mode of completing separation NSW Vic Qld WA SA Tas(a) ACT(a) NT(a) Total(a)
Public hospitals
Discharge or transfer to:
• an(other) acute hospital 5.9 12.8 7.3 8.0 6.3 6.6 3.5 3.5 8.5 5.9
• a residential aged care service(b) 4.1 4.0 2.6 4.4 6.6 4.5 1.9 2.1 4.0 1.1
• other health-care accommodation(c) 1.3 0.6 1.5 0.2 0.5 0.9 9.4 1.6 1.1 0.4
Statistical discharge (incl. from leave)(d) 4.8 4.0 8.7 1.9 5.0 9.5 5.8 12.2 5.3 1.9
Left against medical advice 0.3 0.3 0.1 0.3 0.2 0.1 0.1 3.5 0.3 0.9
Died 50.8 50.5 54.0 62.8 46.0 39.9 59.5 33.5 50.7 1.1
Other(e) 32.8 27.9 25.8 22.3 35.5 38.5 19.7 43.6 30.1 88.7
Total(f)(g) 100.0 100.0 100.0 100.0 100.0 100.0 100.0 100.0 100.0 100.0
Private hospitals
Discharge or transfer to:
• an(other) acute hospital 6.2 11.1 1.6 14.4 5.4 1.6 0.0 7.1 8.0 1.6
• a residential aged care service(b) 3.5 3.0 2.0 1.8 4.0 6.9 2.0 0.0 2.9 0.2
• other health-care accommodation(c) 0.8 0.0 0.8 0.0 1.6 1.3 2.0 21.4 0.6 1.4
Statistical discharge (incl. from leave)(d) 1.4 0.3 5.2 1.4 0.0 4.2 4.1 7.1 2.1 0.5
Left against medical advice 0.7 0.1 0.1 0.0 0.0 0.0 0.0 0.0 0.1 0.1
Died 46.8 56.4 64.5 54.9 57.3 50.1 44.9 7.1 56.0 0.4
Other(e) 40.6 29.2 25.6 27.5 31.7 35.8 46.9 57.1 30.3 95.8
Total(f)(g) 100.0 100.0 100.0 100.0 100.0 n.p. n.p. n.p. 100.0 100.0
(continued)

Palliative care services in Australia 2014 15
Table 2.7 (continued): Palliative care-related separations and all separations, by mode of completing separation, states and territories, public and private hospitals, 2011–12
Palliative care separations (per cent) Separations for all reasons (per cent) Mode of completing separation NSW Vic Qld WA SA Tas(a) ACT(a) NT(a) Total(a)
All hospitals
Discharge or transfer to:
• an(other) acute hospital 6.0 12.6 6.1 11.9 6.1 5.4 3.3 3.5 8.5 4.2
• a residential aged care service(b) 4.1 3.9 2.5 2.8 6.2 5.1 1.9 2.1 3.8 0.8
• other health-care accommodation(c) 1.2 0.5 1.4 0.1 0.7 1.0 8.9 2.0 1.0 0.8
Statistical discharge (incl. from leave)(d) 4.5 3.6 7.9 1.6 4.1 8.2 5.7 12.1 4.8 1.3
Left against medical advice 0.3 0.2 0.1 0.1 0.1 0.0 0.1 3.4 0.3 0.5
Died 50.5 51.1 56.2 57.9 48.0 42.4 58.6 33.0 51.5 0.8
Other(e) 33.3 28.1 25.8 25.5 34.8 37.9 21.4 43.8 30.1 91.6
Total(f)(g) 100.0 100.0 100.0 100.0 100.0 n.p. n.p. n.p. 100.0 100.0
(a) To ensure confidentiality of information, data for private hospitals in Tasmania, the Australian Capital Territory and the Northern Territory are not shown. ‘Total’ includes data for all jurisdictions.
(b) Excluding those for whom a residential aged care service was the usual place of residence.
(c) Includes psychiatric hospitals and mothercraft hospitals.
(d) A statistical discharge refers to an administrative process that completes an admitted patient episode of care when there is a change in the clinical intent of treatment (for example, from acute care to palliative care). For each statistical discharge, there should be a corresponding statistical admission—that is, a new episode of care with a different care type created.
(e) Includes discharge to own accommodation, usual residence or a welfare institution (such as a prison, hostel or group home providing primarily welfare services).
(f) Includes those separations for which the mode of completing the separation was not reported.
(g) Totals may not add due to rounding.
Source: NHMD, AIHW.

16 Palliative care services in Australia 2014
2.4 Characteristics of admitted palliative care patients This section presents information on the number and proportion of palliative care-related separations for various demographic groups. Age-standardised rates are reported to adjust for relative population sizes and age structures.
Indigenous status Aboriginal and Torres Strait Islander people are disadvantaged relative to other Australians across a range of health-related and socioeconomic indicators (AIHW 2011c). This may affect their use of, and access to, admitted patient palliative care.
A total of 988 palliative care-related separations for Indigenous Australians were reported in 2011–12, with the majority (96.0%) occurring in public hospitals. There were more separations for Indigenous males than females, similar to what is seen for ‘Other Australians’. The number of palliative care-related separations in public hospitals per 10,000 population is twice as high for Indigenous Australians as for ‘Other Australians’ (34.6 and 19.5, respectively) (Table 2.8). This pattern is also seen for all public hospital separations.
Table 2.8: Palliative care-related separations, by Indigenous status, selected states and territories, public and private hospitals, 2011–12
Palliative care-related separations Separations for all reasons
Number
Rate(b)
Male Female Total Per cent Per cent Rate(a)
Public hospitals
Indigenous Australians 511 477 988 1.7 34.6 3.6 7,496.5
Other Australians(b) 25,989 21,795 47,784 82.9 19.5 55.9 2,217.4
Private hospitals
Indigenous Australians 19 22 41 0.1 1.4 0.3 825.3
Other Australians(b) 4,566 4,235 8,801 15.3 3.6 40.1 1,570.4
Total 31,085 26,529 57,614 100.0 23.3 100.0 3,866.2
(a) The rates were age-standardised to the Australian population as at 30 June 2001 and are expressed per 10,000 population (see Appendix C).
(b) ‘Other Australians’ includes separations for non-Indigenous Australians and those for whom Indigenous status was not reported.
Source: NHMD, AIHW.

Palliative care services in Australia 2014 17
Remoteness of patient’s usual residence Most palliative care-related separations in 2011–12 across both public and private hospital sectors were for patients whose usual residence was in Major cities (64.8%). Of all palliative care episodes, the more remote the patients’ usual residence, the lower the proportion of palliative care-related separations reported. However, the age-standardised rate for Major cities public hospital separations was 18.9 per 10,000 population, which was lower than the rate for Remote or very remote (28.2) (Table 2.9).
A similar pattern emerged for all separations in private hospitals, where the rate per 10,000 population was highest for Major cities (1,753.6) and lowest for Remote or very remote areas (854.5) (Table 2.9).
Males accounted for a greater proportion of the palliative care-related separations than females in all remoteness categories (Table 2.9).
Table 2.9: Palliative care-related separations, by remoteness area of patient’s usual residence, public and private hospitals, 2011–12
Palliative care-related separations Separations for all reasons
Number
Remoteness area(a) Male Female Total Per cent Rate(b) Per cent Rate(b)
Public hospitals
Major cities 16,658 14,706 31,364 54.4 18.9 37.1 2,161.8
Inner regional 5,816 4,703 10,519 18.3 19.0 13.1 2,794.0
Outer regional 3,334 2,309 5,643 9.8 23.5 6.8 3,104.4
Remote or very remote 630 511 1,141 2.0 28.2 2.2 3,973.4
Not reported 62 43 105 0.2 . . 0.3 . .
Sub-total 26,500 22,272 48,772 84.7 . . 59.5 . .
Private hospitals
Major cities 3,103 2,868 5,971 10.4 3.6 30.3 1,753.6
Inner regional 1,216 1,132 2,348 4.1 4.2 7.1 1,332.1
Outer regional 239 237 476 0.8 2.0 2.4 1,015.0
Remote or very remote 22 18 40 0.1 1.1 0.4 854.5
Not reported 5 2 7 0.0 . . 0.1 . .
Sub-total 4,585 4,257 8,842 15.3 . . 40.5 . .
Total(c) 31,085 26,529 57,614 100.0 23.0 100.0 3,946.3
(a) Remoteness area was measured using the Australian Bureau of Statistics (ABS) Australian Standard Geographical Classification (ASGC) Remoteness Areas (see Appendix D).
(b) The rates were age-standardised to the Australian population as at 30 June 2001 and are expressed per 10,000 population (see Appendix C).
(c) Totals may not add due to rounding.
Source: NHMD, AIHW.
18 Palliative care services in Australia 2014
Socioeconomic status Socioeconomic status is generally associated with access to material resources, educational opportunities and health status (AIHW 2010b). In this report, the Index of Relative Socio-Economic Disadvantage (IRSD) was used to indicate socioeconomic status (see Box 2.1 for further information).
Box 2.1: Index of Relative Socio-Economic Disadvantage The IRSD is one of four Socio-Economic Indexes for Areas (SEIFA) developed by the ABS (ABS 2008). It is based on factors such as average household income, education levels, unemployment rates, occupation and housing characteristics. Note that the IRSD, like the other SEIFA indexes, is an area-based measure of socioeconomic status—not a person-based measure—in which small areas of Australia are classified on a continuum from most disadvantaged to most advantaged. This information is used as a proxy for the socioeconomic status of people living in those areas and may not be correct for each person living in that area. In this report, the first socioeconomic status group (labelled ‘1’) corresponds to geographical areas containing the 20% of the population with the lowest socioeconomic status according to the IRSD, and the fifth group (labelled ‘5’) corresponds to the 20% of the population with the highest socioeconomic status (see Appendix D for more information).
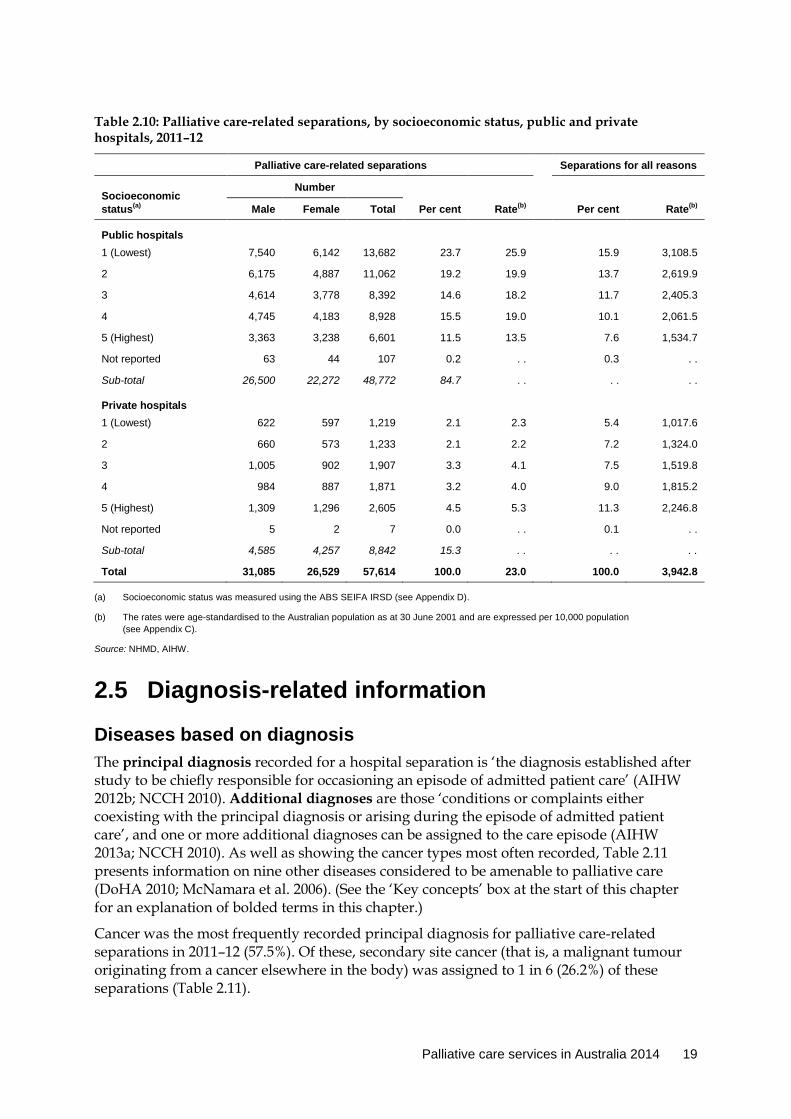
In 2011–12, people living in areas classified as having the lowest socioeconomic status (group ‘1’) accounted for a relatively higher proportion of palliative care-related separations (23.7%) in public hospitals than those living in other areas. The rate of palliative care-related separations was also highest for those living in these areas (25.9 per 10,000 population). Conversely, the rate of palliative care-related separations was lowest for those living in the highest socioeconomic status areas (group ‘5’) (13.5), with this pattern being seen for all separations (Table 2.10).
A different pattern was seen for palliative care-related separations in private hospitals, where the rate was highest for those living in the highest socioeconomic status (group ‘5’) (5.3 per 10,000 population). This pattern was also seen for all separations for this SEIFA group (2,246.8 per 10,000 population) (Table 2.10).
There were more separations for males than females in nearly all socioeconomic status areas, with those in the higher socioeconomic status areas showing the least difference between the sexes in the total number of separations.
Palliative care services in Australia 2014 19
Table 2.10: Palliative care-related separations, by socioeconomic status, public and private hospitals, 2011–12
Palliative care-related separations Separations for all reasons
Socioeconomic status(a)
Number
Male Female Total Per cent Rate(b) Per cent Rate(b)
Public hospitals
1 (Lowest) 7,540 6,142 13,682 23.7 25.9 15.9 3,108.5
2 6,175 4,887 11,062 19.2 19.9 13.7 2,619.9
3 4,614 3,778 8,392 14.6 18.2 11.7 2,405.3
4 4,745 4,183 8,928 15.5 19.0 10.1 2,061.5
5 (Highest) 3,363 3,238 6,601 11.5 13.5 7.6 1,534.7
Not reported 63 44 107 0.2 . . 0.3 . .
Sub-total 26,500 22,272 48,772 84.7 . . . . . .
Private hospitals
1 (Lowest) 622 597 1,219 2.1 2.3 5.4 1,017.6
2 660 573 1,233 2.1 2.2 7.2 1,324.0
3 1,005 902 1,907 3.3 4.1 7.5 1,519.8
4 984 887 1,871 3.2 4.0 9.0 1,815.2
5 (Highest) 1,309 1,296 2,605 4.5 5.3 11.3 2,246.8
Not reported 5 2 7 0.0 . . 0.1 . .
Sub-total 4,585 4,257 8,842 15.3 . . . . . .
Total 31,085 26,529 57,614 100.0 23.0 100.0 3,942.8
(a) Socioeconomic status was measured using the ABS SEIFA IRSD (see Appendix D).
(b) The rates were age-standardised to the Australian population as at 30 June 2001 and are expressed per 10,000 population (see Appendix C).
Source: NHMD, AIHW.
2.5 Diagnosis-related information
Diseases based on diagnosis The principal diagnosis recorded for a hospital separation is ‘the diagnosis established after study to be chiefly responsible for occasioning an episode of admitted patient care’ (AIHW 2012b; NCCH 2010). Additional diagnoses are those ‘conditions or complaints either coexisting with the principal diagnosis or arising during the episode of admitted patient care’, and one or more additional diagnoses can be assigned to the care episode (AIHW 2013a; NCCH 2010). As well as showing the cancer types most often recorded, Table 2.11 presents information on nine other diseases considered to be amenable to palliative care (DoHA 2010; McNamara et al. 2006). (See the ‘Key concepts’ box at the start of this chapter for an explanation of bolded terms in this chapter.)
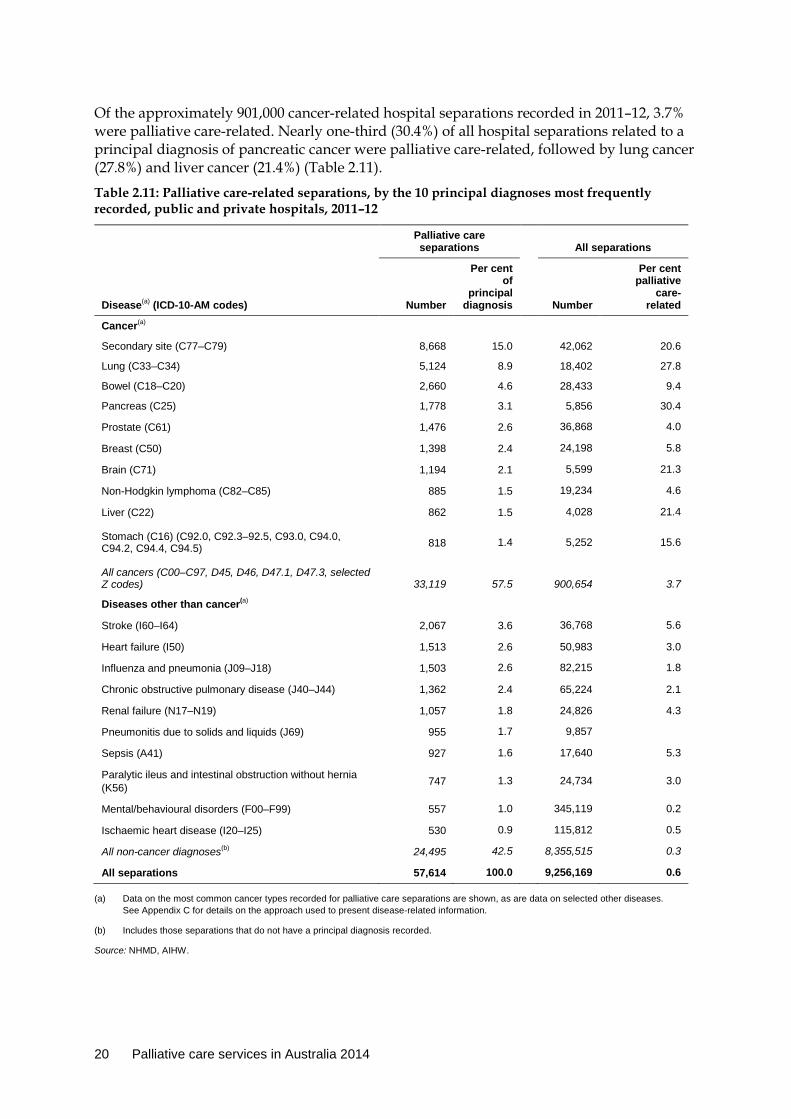
Cancer was the most frequently recorded principal diagnosis for palliative care-related separations in 2011–12 (57.5%). Of these, secondary site cancer (that is, a malignant tumour originating from a cancer elsewhere in the body) was assigned to 1 in 6 (26.2%) of these separations (Table 2.11).
20 Palliative care services in Australia 2014
Of the approximately 901,000 cancer-related hospital separations recorded in 2011–12, 3.7% were palliative care-related. Nearly one-third (30.4%) of all hospital separations related to a principal diagnosis of pancreatic cancer were palliative care-related, followed by lung cancer (27.8%) and liver cancer (21.4%) (Table 2.11).
Table 2.11: Palliative care-related separations, by the 10 principal diagnoses most frequently recorded, public and private hospitals, 2011–12
Palliative care separations
All separations
Disease(a) (ICD-10-AM codes) Number
Per cent of
principal diagnosis
Number
Per cent palliative
care-related
Cancer(a)
Secondary site (C77–C79) 8,668 15.0 42,062 20.6
Lung (C33–C34) 5,124 8.9 18,402 27.8
Bowel (C18–C20) 2,660 4.6 28,433 9.4
Pancreas (C25) 1,778 3.1 5,856 30.4
Prostate (C61) 1,476 2.6 36,868 4.0
Breast (C50) 1,398 2.4 24,198 5.8
Brain (C71) 1,194 2.1 5,599 21.3
Non-Hodgkin lymphoma (C82–C85) 885 1.5 19,234 4.6
Liver (C22) 862 1.5 4,028 21.4
Stomach (C16) (C92.0, C92.3–92.5, C93.0, C94.0, C94.2, C94.4, C94.5) 818 1.4
5,252 15.6
All cancers (C00–C97, D45, D46, D47.1, D47.3, selected Z codes) 33,119 57.5 900,654 3.7
Diseases other than cancer(a)
Stroke (I60–I64) 2,067 3.6 36,768 5.6
Heart failure (I50) 1,513 2.6 50,983 3.0
Influenza and pneumonia (J09–J18) 1,503 2.6 82,215 1.8
Chronic obstructive pulmonary disease (J40–J44) 1,362 2.4 65,224 2.1
Renal failure (N17–N19) 1,057 1.8 24,826 4.3
Pneumonitis due to solids and liquids (J69) 955 1.7 9,857
Sepsis (A41) 927 1.6 17,640 5.3
Paralytic ileus and intestinal obstruction without hernia (K56) 747 1.3
24,734 3.0
Mental/behavioural disorders (F00–F99) 557 1.0 345,119 0.2
Ischaemic heart disease (I20–I25) 530 0.9 115,812 0.5
All non-cancer diagnoses(b) 24,495 42.5 8,355,515 0.3
All separations 57,614 100.0 9,256,169 0.6
(a) Data on the most common cancer types recorded for palliative care separations are shown, as are data on selected other diseases. See Appendix C for details on the approach used to present disease-related information.
(b) Includes those separations that do not have a principal diagnosis recorded.
Source: NHMD, AIHW.

Palliative care services in Australia 2014 21
For diseases other than cancer, the next two principal diagnoses reported most often were stroke and heart failure (3.6% and 2.6% of palliative care separations, respectively) (Table 2.11).
Compared with the most frequently recorded cancer diagnoses, a smaller proportion of the most frequently recorded non-cancer diagnoses were palliative care-related. For a principal diagnosis of stroke or sepsis, about 1 in 20 separations were palliative care-related (5.6% and 5.3%, respectively) (Table 2.11).
2.6 Change over time in the amount of activity In 2002–03, there were almost 38,000 palliative care-related separations; by 2011–12, this number increased by 52% to more than 57,600. In comparison, the number of all separations increased by 39% over the same period. Between 2002–03 and 2011–12, the number of palliative care-related separations steadily increased though, in 2010–11, there was a 2.7% decrease in the number from the previous year. This reduction was largely due to an administrative change by New South Wales to the coding of health data relating to palliative care-related hospital separations (see Palliative care services in Australia 2013 [AIHW 2013c] for a more detailed explanation of this decrease).
Table 2.12: Palliative care separations and all separations, public and private hospitals, 2002–03 to 2011–12
Palliative care separations Separations for all reasons
Year Number of
separations
Per cent change from
previous year Rate(a)
Per cent of all
separations
Number of
separations
Per cent change from
previous year
2002–03 37,996 3.6 18.9 0.57 6,644,984 3.9
2003–04 40,435 6.4 19.7 0.59 6,841,225 3.0
2004–05 42,622 5.4 20.2 0.61 7,018,850 2.6
2005–06 45,134 5.9 20.8 0.62 7,311,983 4.2
2006–07 47,472 5.2 21.4 0.62 7,602,917 4.0
2007–08 48,631 2.4 21.2 0.62 7,873,945 3.6
2008–09 52,347 7.6 22.2 0.64 8,148,448 3.5
2009–10 55,983 6.9 23.2 0.66 8,531,003 4.7
2010–11 54,466 –2.7 22.1 0.62 8,852,550 3.8
2011–12 57,614 5.8 22.7 0.62 9,256,169 4.6
(a) The rates were age-standardised to the Australian population as at 30 June 2001 and are expressed per 10,000 population (see Appendix C).
Source: NHMD, AIHW.
Even though there was a decrease in the number of palliative care separations from 2009–10 to 2010–11, the age-standardised rate of palliative care separations increased from 18.9 to 22.7 per 10,000 population over the 10-year period to 2011–12 (Table 2.12). This indicates a net increase in the number of admitted patient palliative care separations that cannot be explained only by population growth and an ageing population.

22 Palliative care services in Australia 2014
Change over time by sector In considering palliative care activities by sector over time, it should be noted that reporting arrangements have changed in some jurisdictions—for example, as to whether a hospital was classified as private or public during the period considered. The following data should therefore be interpreted in light of such variations (see Appendix B of Australian hospital statistics 2010–11 [AIHW 2013a] for further information).
While the number of admitted patient palliative care-related separations between 2002–03 and 2011–12 (for both public and private hospitals) increased overall, much of this increase occurred in public hospitals, with the number of separations increasing by 62% (Table 2.13).
Figures for palliative care-related separations in private hospitals fluctuated, resulting in a net increase of 12% over the same 10-year period. This contrasts with the consistent yearly increase in all private hospital separations, which showed a 46% growth between 2002–03 and 2011–12 (Table 2.13).
Table 2.13: Palliative care-related separations and all separations, public and private hospitals, 2002–03 to 2011–12 Palliative care-related separations Separations for all reasons
Year Number of
separations
Per cent change from
previous year Rate(a) Per cent of all
separations
Number of
separations
Per cent change from
previous year
Public hospitals
2002–03 30,093 4.0 15.0 0.74 4,090,969 3.2
2003–04 32,542 8.1 15.8 0.77 4,200,517 2.7
2004–05 35,522 9.2 16.9 0.83 4,276,425 1.8
2005–06 36,623 3.1 16.9 0.82 4,466,076 4.4
2006–07 38,355 4.7 17.3 0.82 4,661,280 4.4
2007–08 40,096 4.5 17.5 0.85 4,744,060 1.8
2008–09 44,405 10.7 18.9 0.91 4,891,023 3.1
2009–10 47,345 6.6 19.6 0.93 5,069,288 3.6
2010–11 45,713(b) –3.4 18.6 0.87 5,279,132 4.1
2011–12 48,772 6.7 19.2 0.88 5,511,492 4.4
Private hospitals
2002–03 7,903 2.4 3.9 0.31 2,554,015 5.0
2003–04 7,893 –0.1 3.8 0.30 2,640,708 3.4
2004–05 7,100 –10.0 3.4 0.26 2,742,425 3.9
2005–06 8,511 19.9 3.9 0.30 2,845,907 3.8
2006–07 9,117 7.1 4.1 0.31 2,941,637 3.4
2007–08 8,535 –6.4 3.7 0.27 3,129,885 6.4
2008–09 7,942 –6.9 3.4 0.24 3,257,425 4.1
2009–10 8,638 8.8 3.5 0.25 3,461,715 6.3
2010–11 8,753 1.3 3.5 0.24 3,573,418 3.2
2011–12 8,842 1.0 3.5 0.24 3,744,677 4.8
(a) The rates were age-standardised to the Australian population as at 30 June 2001 and are expressed per 10,000 population (see Appendix C).
(b) The decrease in the number of separations between 2009–10 and 2010–11 is likely to be largely attributable to changes in coding of health data relating to palliative care-related hospital separations in New South Wales.
Source: NHMD, AIHW.
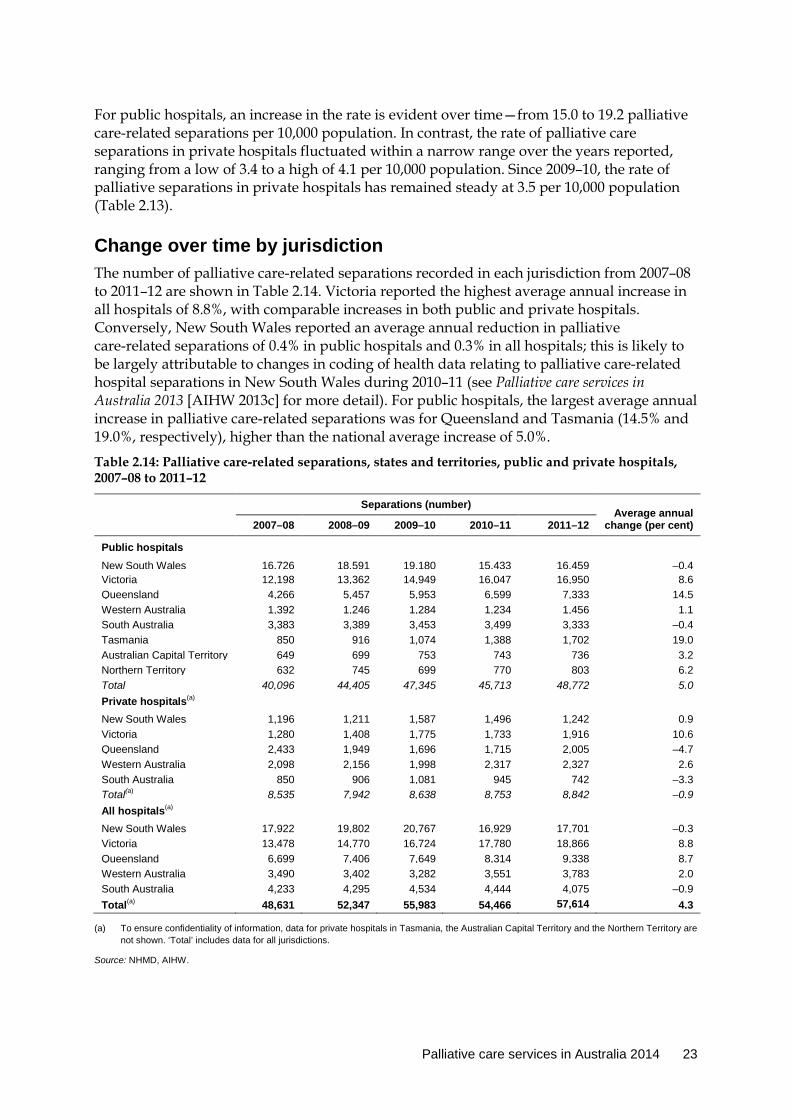
Palliative care services in Australia 2014 23
For public hospitals, an increase in the rate is evident over time—from 15.0 to 19.2 palliative care-related separations per 10,000 population. In contrast, the rate of palliative care separations in private hospitals fluctuated within a narrow range over the years reported, ranging from a low of 3.4 to a high of 4.1 per 10,000 population. Since 2009–10, the rate of palliative separations in private hospitals has remained steady at 3.5 per 10,000 population (Table 2.13).
Change over time by jurisdiction The number of palliative care-related separations recorded in each jurisdiction from 2007–08 to 2011–12 are shown in Table 2.14. Victoria reported the highest average annual increase in all hospitals of 8.8%, with comparable increases in both public and private hospitals. Conversely, New South Wales reported an average annual reduction in palliative care-related separations of 0.4% in public hospitals and 0.3% in all hospitals; this is likely to be largely attributable to changes in coding of health data relating to palliative care-related hospital separations in New South Wales during 2010–11 (see Palliative care services in Australia 2013 [AIHW 2013c] for more detail). For public hospitals, the largest average annual increase in palliative care-related separations was for Queensland and Tasmania (14.5% and 19.0%, respectively), higher than the national average increase of 5.0%.
Table 2.14: Palliative care-related separations, states and territories, public and private hospitals, 2007–08 to 2011–12
Separations (number) Average annual
change (per cent) 2007–08 2008–09 2009–10 2010–11 2011–12
Public hospitals New South Wales 16,726 18,591 19,180 15,433 16,459
–0.4
Victoria 12,198 13,362 14,949 16,047 16,950
8.6 Queensland 4,266 5,457 5,953 6,599 7,333
14.5
Western Australia 1,392 1,246 1,284 1,234 1,456
1.1 South Australia 3,383 3,389 3,453 3,499 3,333
–0.4
Tasmania 850 916 1,074 1,388 1,702
19.0 Australian Capital Territory 649 699 753 743 736
3.2
Northern Territory 632 745 699 770 803
6.2 Total 40,096 44,405 47,345 45,713 48,772
5.0
Private hospitals(a) New South Wales 1,196 1,211 1,587 1,496 1,242
0.9
Victoria 1,280 1,408 1,775 1,733 1,916
10.6 Queensland 2,433 1,949 1,696 1,715 2,005
–4.7
Western Australia 2,098 2,156 1,998 2,317 2,327
2.6 South Australia 850 906 1,081 945 742
–3.3
Total(a) 8,535 7,942 8,638 8,753 8,842
–0.9 All hospitals(a) New South Wales 17,922 19,802 20,767 16,929 17,701
–0.3
Victoria 13,478 14,770 16,724 17,780 18,866
8.8 Queensland 6,699 7,406 7,649 8,314 9,338
8.7
Western Australia 3,490 3,402 3,282 3,551 3,783
2.0 South Australia 4,233 4,295 4,534 4,444 4,075
–0.9
Total(a) 48,631 52,347 55,983 54,466 57,614
4.3
(a) To ensure confidentiality of information, data for private hospitals in Tasmania, the Australian Capital Territory and the Northern Territory are not shown. ‘Total’ includes data for all jurisdictions.
Source: NHMD, AIHW.

24 Palliative care services in Australia 2014
Among private hospitals, there have been both increases and decreases in the number of palliative care-related separations over the period, culminating in a 0.9% average annual decrease over the 5 years to 2011–12. Private hospitals in Queensland and South Australia reported an average negative growth over the same period (–4.7% and –3.3%, respectively), while Victoria, Western Australia and New South Wales reported an increase in the number of palliative care-related separations (10.6%, 2.6% and 0.9%, respectively) (Table 2.14).
Fluctuations were also noted in the number of palliative care-related separations per 10,000 population over the 5 years to 2011–12. The national data indicate a slight increase in the rates for 2011–12 from 2010–11; however, data for South Australia do not reflect this pattern (Table 2.15).
Table 2.15: Palliative care-related separations, states and territories, age-standardised rates, public and private hospitals, 2007–08 to 2011–12
Age-standardised rates(a)
2007–08 2008–09 2009–10 2010–11 2011–12
Public hospitals
New South Wales 21.6 23.4 23.6 18.6 19.3
Victoria 21.1 22.4 24.4 25.7 26.4
Queensland 10.0 12.4 13.1 14.4 15.5
Western Australia 6.6 5.7 5.7 5.4 6.0
South Australia 17.5 17.1 17.2 17.1 15.9
Tasmania 14.6 15.3 17.8 22.0 26.1
Australian Capital Territory 22.2 23.1 24.0 23.2 21.9
Northern Territory 57.6 64.7 57.7 58.5 61.2
Total 17.5 18.9 19.6 18.6 19.2
Private hospitals(b)
New South Wales 1.5 1.5 1.9 1.8 1.4
Victoria 2.2 2.3 2.8 2.7 2.9
Queensland 5.6 4.4 3.7 3.7 4.2
Western Australia 9.9 9.9 8.9 10.0 9.7
South Australia 4.3 4.5 5.2 4.5 3.5
Total(b) 3.7 3.4 3.5 3.5 3.5
All hospitals(b)
New South Wales 23.2 24.9 25.6 20.4 20.7
Victoria 23.2 24.7 27.3 28.4 29.4
Queensland 15.6 16.7 16.8 18.1 19.7
Western Australia 16.5 15.6 14.6 15.4 15.7
South Australia 21.8 21.5 22.4 21.6 19.4
Total(b) 21.2 22.2 23.2 22.1 22.7
(a) The rates were age-standardised to the Australian population as at 30 June 2001 and are expressed per 10,000 population (see Appendix C).
(b) To ensure confidentiality of information, data for private hospitals in Tasmania, the Australian Capital Territory and the Northern Territory are not shown. ‘Total’ includes data for all jurisdictions.
Source: NHMD, AIHW.

Palliative care services in Australia 2014 25
For private hospitals, the national age-standardised rate of palliative care-related separations in 2011–12 was lower than the rate in 2007–08 (3.5 and 3.7, respectively). Similar patterns were observed in New South Wales, Western Australia and South Australia where the age-standardised rates fluctuated, culminating in lower rates in 2011–12 (Table 2.15).
Change over time in length of stay The number of patient days for palliative care-related separations in admitted patient settings increased between 2002–03 and 2011–12 by 31%, to a total of 646,000 patient days (Table 2.16). The ALoS for palliative care-related separations trended downwards over the 10 years to 2011–12 (Figure 2.1). There was a slight decrease in the number of patient days for palliative care over the last two years than the previous years (see Table 2.16).
Note: Data for this figure are shown in Table 2.16.
Source: NHMD, AIHW.
Figure 2.1: Palliative care-related separations, patient days and ALoS, public and private hospitals, 2002–03 to 2011–12
0
2
4
6
8
10
12
14
0
100,000
200,000
300,000
400,000
500,000
600,000
700,000
2002–03 2003–04 2004–05 2005–06 2006–07 2007–08 2008–09 2009–10 2010–11 2011–12
ALoS days Patient days (number)
Year
Average length of stay
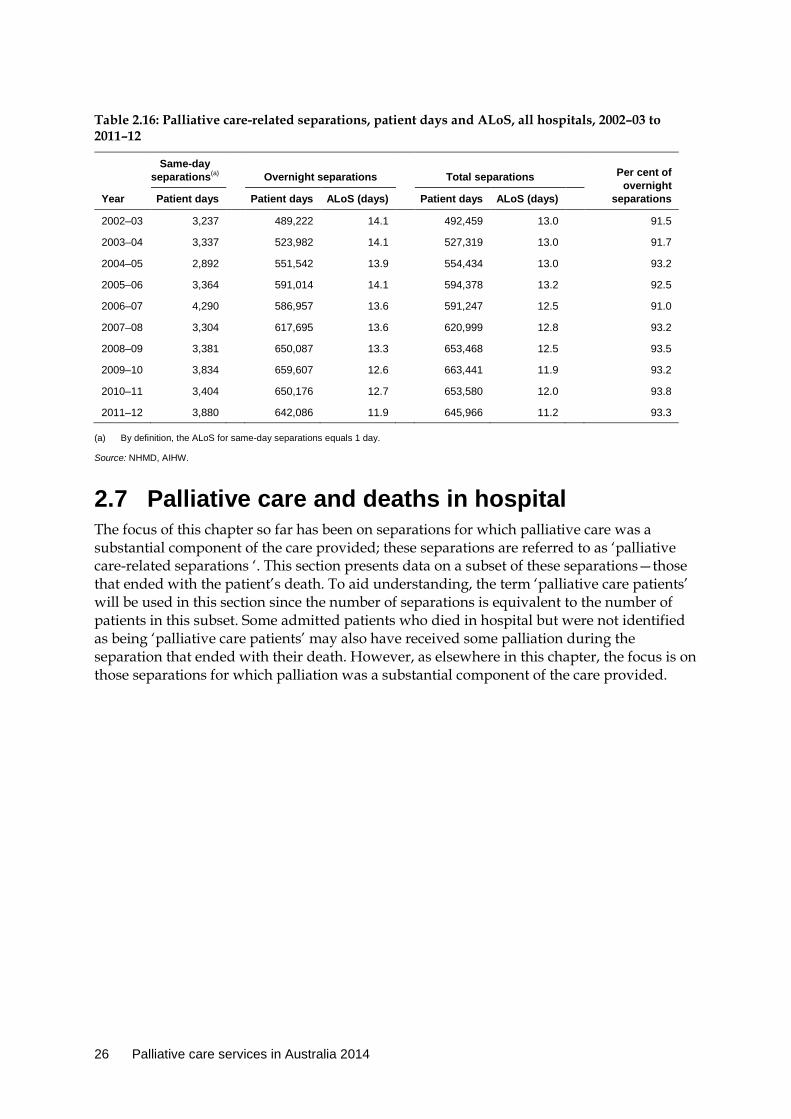
26 Palliative care services in Australia 2014
Table 2.16: Palliative care-related separations, patient days and ALoS, all hospitals, 2002–03 to 2011–12
Year
Same-day separations(a)
Overnight separations
Total separations
Per cent of
overnight separations Patient days Patient days ALoS (days) Patient days ALoS (days)
2002–03 3,237 489,222 14.1 492,459 13.0 91.5
2003–04 3,337 523,982 14.1 527,319 13.0 91.7
2004–05 2,892 551,542 13.9 554,434 13.0 93.2
2005–06 3,364 591,014 14.1 594,378 13.2 92.5
2006–07 4,290 586,957 13.6 591,247 12.5 91.0
2007–08 3,304 617,695 13.6 620,999 12.8 93.2
2008–09 3,381 650,087 13.3 653,468 12.5 93.5
2009–10 3,834 659,607 12.6 663,441 11.9 93.2
2010–11 3,404 650,176 12.7 653,580 12.0 93.8
2011–12 3,880 642,086 11.9 645,966 11.2 93.3
(a) By definition, the ALoS for same-day separations equals 1 day.
Source: NHMD, AIHW.
2.7 Palliative care and deaths in hospital The focus of this chapter so far has been on separations for which palliative care was a substantial component of the care provided; these separations are referred to as ‘palliative care-related separations ‘. This section presents data on a subset of these separations—those that ended with the patient’s death. To aid understanding, the term ‘palliative care patients’ will be used in this section since the number of separations is equivalent to the number of patients in this subset. Some admitted patients who died in hospital but were not identified as being ‘palliative care patients’ may also have received some palliation during the separation that ended with their death. However, as elsewhere in this chapter, the focus is on those separations for which palliation was a substantial component of the care provided.
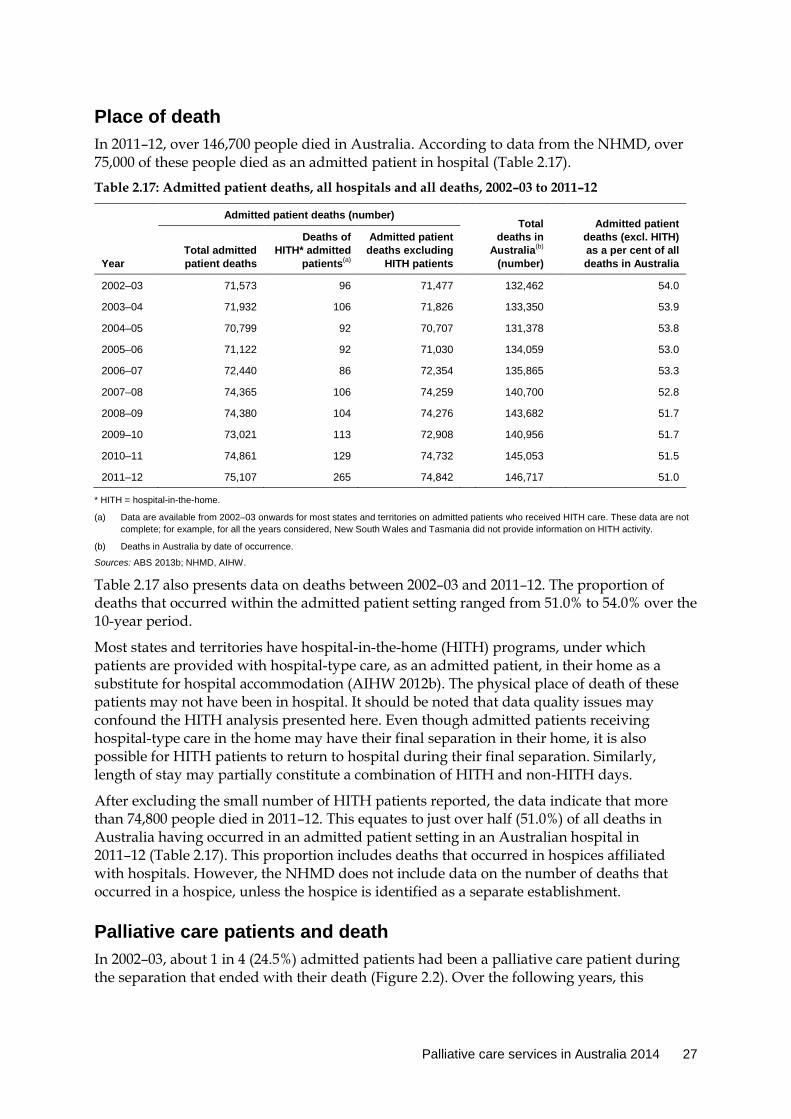
Palliative care services in Australia 2014 27
Place of death In 2011–12, over 146,700 people died in Australia. According to data from the NHMD, over 75,000 of these people died as an admitted patient in hospital (Table 2.17).
Table 2.17: Admitted patient deaths, all hospitals and all deaths, 2002–03 to 2011–12
Admitted patient deaths (number) Total
deaths in Australia(b)
(number)
Admitted patient
deaths (excl. HITH) as a per cent of all deaths in Australia Year
Total admitted patient deaths
Deaths of HITH* admitted
patients(a)
Admitted patient deaths excluding
HITH patients
2002–03 71,573 96 71,477 132,462 54.0
2003–04 71,932 106 71,826 133,350 53.9
2004–05 70,799 92 70,707 131,378 53.8
2005–06 71,122 92 71,030 134,059 53.0
2006–07 72,440 86 72,354 135,865 53.3
2007–08 74,365 106 74,259 140,700 52.8
2008–09 74,380 104 74,276 143,682 51.7
2009–10 73,021 113 72,908 140,956 51.7
2010–11 74,861 129 74,732 145,053 51.5
2011–12 75,107 265 74,842 146,717 51.0
* HITH = hospital-in-the-home.
(a) Data are available from 2002–03 onwards for most states and territories on admitted patients who received HITH care. These data are not complete; for example, for all the years considered, New South Wales and Tasmania did not provide information on HITH activity.
(b) Deaths in Australia by date of occurrence.
Sources: ABS 2013b; NHMD, AIHW.
Table 2.17 also presents data on deaths between 2002–03 and 2011–12. The proportion of deaths that occurred within the admitted patient setting ranged from 51.0% to 54.0% over the 10-year period.
Most states and territories have hospital-in-the-home (HITH) programs, under which patients are provided with hospital-type care, as an admitted patient, in their home as a substitute for hospital accommodation (AIHW 2012b). The physical place of death of these patients may not have been in hospital. It should be noted that data quality issues may confound the HITH analysis presented here. Even though admitted patients receiving hospital-type care in the home may have their final separation in their home, it is also possible for HITH patients to return to hospital during their final separation. Similarly, length of stay may partially constitute a combination of HITH and non-HITH days.
After excluding the small number of HITH patients reported, the data indicate that more than 74,800 people died in 2011–12. This equates to just over half (51.0%) of all deaths in Australia having occurred in an admitted patient setting in an Australian hospital in 2011–12 (Table 2.17). This proportion includes deaths that occurred in hospices affiliated with hospitals. However, the NHMD does not include data on the number of deaths that occurred in a hospice, unless the hospice is identified as a separate establishment.
Palliative care patients and death In 2002–03, about 1 in 4 (24.5%) admitted patients had been a palliative care patient during the separation that ended with their death (Figure 2.2). Over the following years, this
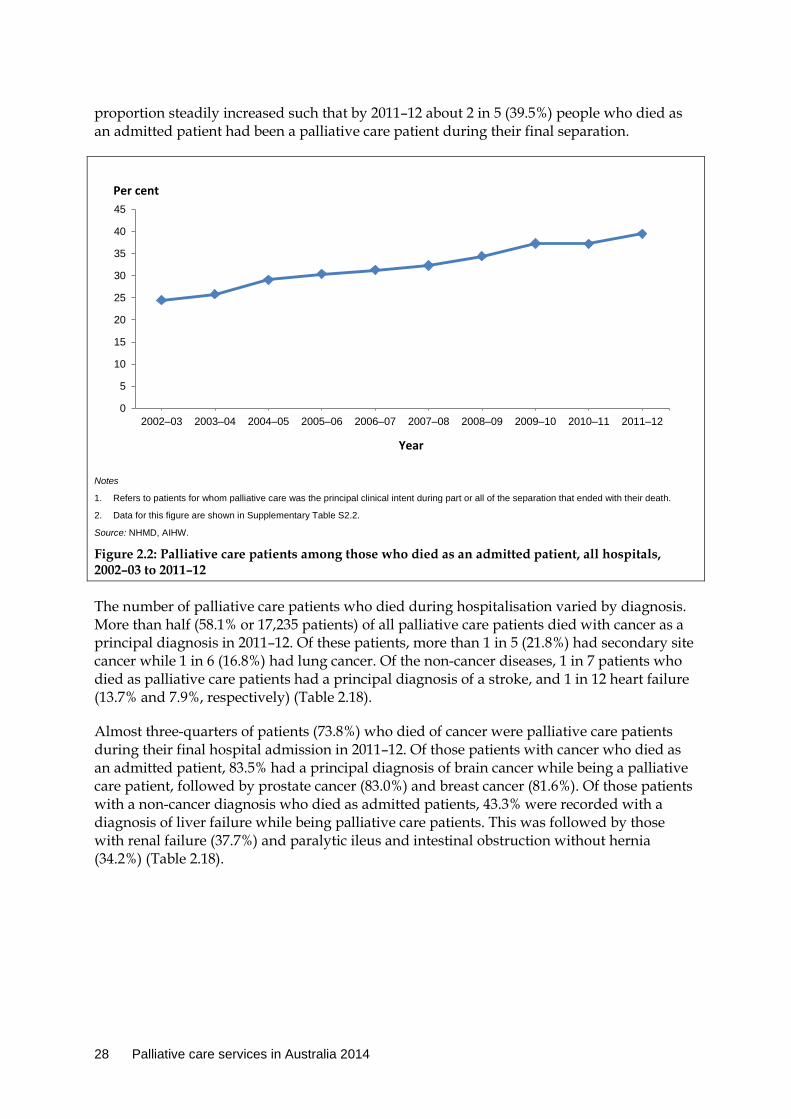
28 Palliative care services in Australia 2014
proportion steadily increased such that by 2011–12 about 2 in 5 (39.5%) people who died as an admitted patient had been a palliative care patient during their final separation.
Notes
1. Refers to patients for whom palliative care was the principal clinical intent during part or all of the separation that ended with their death.
2. Data for this figure are shown in Supplementary Table S2.2.
Source: NHMD, AIHW.
Figure 2.2: Palliative care patients among those who died as an admitted patient, all hospitals, 2002–03 to 2011–12
The number of palliative care patients who died during hospitalisation varied by diagnosis. More than half (58.1% or 17,235 patients) of all palliative care patients died with cancer as a principal diagnosis in 2011–12. Of these patients, more than 1 in 5 (21.8%) had secondary site cancer while 1 in 6 (16.8%) had lung cancer. Of the non-cancer diseases, 1 in 7 patients who died as palliative care patients had a principal diagnosis of a stroke, and 1 in 12 heart failure (13.7% and 7.9%, respectively) (Table 2.18).
Almost three-quarters of patients (73.8%) who died of cancer were palliative care patients during their final hospital admission in 2011–12. Of those patients with cancer who died as an admitted patient, 83.5% had a principal diagnosis of brain cancer while being a palliative care patient, followed by prostate cancer (83.0%) and breast cancer (81.6%). Of those patients with a non-cancer diagnosis who died as admitted patients, 43.3% were recorded with a diagnosis of liver failure while being palliative care patients. This was followed by those with renal failure (37.7%) and paralytic ileus and intestinal obstruction without hernia (34.2%) (Table 2.18).
0
5
10
15
20
25
30
35
40
45
2002–03 2003–04 2004–05 2005–06 2006–07 2007–08 2008–09 2009–10 2010–11 2011–12
Per cent
Year

Palliative care services in Australia 2014 29
Table 2.18: Palliative care patients among those who died as an admitted patient, by the 10 principal diagnoses most often recorded, public and private hospitals, 2011–12
Palliative care separations All separations
Disease(a) (ICD-10-AM codes)
Number of patients who
died(b)
Per cent of principal
diagnosis
Number of patients who
died
Per cent palliative
care-related
Cancer site(a)
Secondary site (C77–C79) 3,763 21.8 5,514 68.2
Lung (C33–C34) 2,888 16.8 3,799 76.0
Bowel (C18–C20) 1,615 9.4 2,118 76.3
Pancreas (C25) 1,046 6.1 1,319 79.3
Prostate (C61) 764 4.4 920 83.0
Breast (C50) 725 4.2 889 81.6
Brain (C71) 586 3.4 702 83.5
Liver (C22) 485 2.8 672 72.2
Stomach (C16) 483 2.8 602 80.2
Non-Hodgkin Lymphoma (C82–C85) 459 2.7
757 60.6
All cancers (C00–C97, D45, D46, D47.1, D47.3, selected Z codes)
17,235 100.0 23,359 73.8
Diseases other than cancer(a)
Stroke (I60–I64) 1,697 13.7 5,091 33.3
Heart failure (I50) 977 7.9 3,568 27.4
Influenza and pneumonia (J09–J18) 896 7.2 4,239 21.1
Renal failure (N17–N19) 708 5.7 1,878 37.7
Pneumonitis due to solids and liquids (J69) 655 5.3 2,329 28.1
Chronic obstructive pulmonary disease (J40–J44)
622 5.0
2,413 25.8
Sepsis (A41) 595 4.8 2,737 21.7
Ischaemic heart disease (I20–I25) 336 2.7 2,721 12.3
Paralytic ileus and intestinal obstruction without hernia (K56)
336 2.7
982 34.2
Liver failure (K70.4, K71.1, K72) 295 2.4 682 43.3
All non-cancer diagnoses 12,430 100.0 51,748 24.0
(a) See Appendix C for details on the approach used to present disease-related information.
(b) Refers to patients for whom palliative care was the principal clinical intent during part or all of the separation that ended with their death.
Source: NHMD, AIHW.
30 Palliative care services in Australia 2014
3 Palliative care in general practice
3.1 Introduction As previously noted, there is a lack of data relating to palliative care services and patient outcomes (see AIHW 2013c for more information). One of the main limitations in reporting on general practice activity for palliative care is the lack of a Medicare item specific to palliative care-related treatment provided by general practitioners (see ‘Key concepts’ box below for explanations of bolded terms in this chapter).
The MBS includes specific items for palliative medicine specialist services (delivered by palliative medicine specialists) for which it will reimburse a proportion of the MBS fee (see Chapter 4); however, there are no equivalent palliative care-specific items that can be used by GPs. This means that GPs are likely to be using other MBS items, such as those for chronic disease management, when providing patients with palliative care support. Consequently, the extent of palliative care-related services delivered by GPs cannot be established from existing Medicare data.
Despite the critical importance of the GPs’ role in the health-care system broadly, and in palliative care specifically, there is currently no nationally consistent primary health-care data collection that can support reporting on the provision of care by GPs.
3.2 BEACH survey data This chapter presents information on palliative care-related encounters provided by GPs using data from the BEACH survey of general practice activity—currently the only available data source that can support this reporting. Given that the BEACH survey is a paper-based survey of a sample of GPs and their encounters with patients, it is subject to the inherent limitations of a survey methodology, including how representative it is of the target population. The following results should therefore be used very cautiously in light of these known limitations.
The data described in this chapter relate to 97,800 GP encounters from a sample of 978 GPs over the period from April 2012 to March 2013; this is the most recent reporting period available (Britt et al. 2013). This is described as BEACH 2012–13 in this chapter.
The GP encounters covered by the survey represent about 0.1% of all GP encounters over that time. After post-stratification weighting (to ensure that national general practice activity patterns are reflected), the data include 98,564 (weighted) encounters (Britt et al. 2013). The survey provides information on the reasons patients visited the GP, the problems managed and the types of management provided for each problem.
More information about this survey and the data is at Appendix B.
Palliative care services in Australia 2014 31
Key concepts General practitioners are those medical practitioners who are vocationally registered under Section 3F of the Health Insurance Act 1973 (Cwlth), or are Fellows of the Royal Australian College of General Practitioners or trainees for vocational registration. Encounter refers to any professional interchange between a patient and a GP; it includes both face-to-face encounters and indirect encounters where there is no face-to-face meeting but where a service is provided (for example, a prescription or referral) (Britt et al. 2013). International Classification of Primary Care (ICPC-2) PLUS refers to the terminology used in the BEACH survey to secondarily code patient reasons for an encounter, problems managed and non-pharmacological management actions recorded in free tests by participating GPs. The PLUS terminology is classified according to the ICPC-2. It is also used by health professionals to record these aspects of electronic health records during delivery of primary care or general practice (Family Medicine Research Centre 2013). Palliative care-related encounters are identified in the BEACH survey using the BEACH coding system’s four ICPC-2 PLUS palliative care-related codes (see Box 3.1).
3.3 Palliative care-related encounters Noting the above limitations to the BEACH survey, in 2012–13, about 1 in 1,000 of all GP encounters reported for the BEACH data were estimated to be palliative care-related encounters (Box 3.1; Table 3.1). This corresponds to approximately 6 encounters per 1,000 population in 2012–13 (with a confidence interval of between 4 and 6 per 1,000 population).
It should be noted that palliative care-related encounters are difficult to define. Palliative care is not a medical diagnosis in its own right; rather, it is a process related to a stage in managing an illness. That is, typically, GPs record the problems they manage as part of the palliative care process (for example, cancer)—not the palliative care process itself. In cases where the patient’s health is gradually deteriorating and there is no specific problem being dealt with, palliative care would be recorded as the problem managed. As such, the number of encounters presented in this chapter is likely to be an underestimate of the total number of palliative care-related encounters by GPs.
Palliative care-related encounters in this chapter have been identified using the four International Classification of Primary Care (ICPC-2 PLUS) palliative care-related codes that are recorded against three discrete BEACH survey data elements (Reason for encounter, Diagnosis and Referral) (see Box 3.1).

32 Palliative care services in Australia 2014
Box 3.1: Defining a palliative care-related encounter Palliative care-related GP encounters were identified via the four ICPC-2 PLUS palliative care-related codes that were recorded against three BEACH survey data elements (Reason for encounter, Problems managed and Referral). The following data elements in the BEACH survey are classified according to the ICPC-2 PLUS: • Patient reasons for encounter • Problems managed • Referral. The following four ICPC-2 PLUS palliative care-related codes have been used by GPs to identify palliative care-related GP encounters: A28011 Limited function/Disability NOS (Not Otherwise Specified) palliative care
A46020 Palliative care consultation
A67015 Referral; hospice
A68004 Referral; palliative care.
Table 3.1: Estimated number of palliative care-related encounters, BEACH survey, 2012–13
Total GP encounters that are palliative care-related (per cent) 0.1%
Estimated number of palliative care-related encounters(a) Lower 95% confidence limit Upper 95% confidence limit
140,200 98,200
182,300
Estimated number of palliative care-related encounters per 1,000 population(a)
Lower 95% confidence limit Upper 95% confidence limit
6.1 4.3 8.0
(a) The estimated number of encounters is based on the proportion of encounters in the BEACH survey of general practice activity that are palliative care related, multiplied by the total number of Medicare services item numbers for Non-referred (GP) Attendances (excluding practice nurse items) as reported by the Australian Government Department of Health (Medicare 2013).
Source: Family Medicine Research Centre 2013, University of Sydney analysis of BEACH Survey 2012–13 data.
Patient demographics Table 3.2 presents information on palliative care-related encounters according to patient characteristics. The table shows the proportion of palliative care-related encounters for each demographic characteristic, and the estimated number of palliative care-related encounters per 1,000 total encounters (that is, both palliative care-related and non-palliative care-related encounters). In 2012–13, more than 8 in 10 palliative care encounters were with people aged 65 and over, and 10.4% with those aged under 55. Females accounted for a greater proportion of GP palliative care-related encounters (55.6%) than males (44.4%), but there was no difference between the sexes in the likelihood of palliative care encounters (about 1% of encounters with both males and females). In 2012-13, 100.0% of palliative care-related encounters were recorded as being with non-Indigenous Australians (Table 3.2).
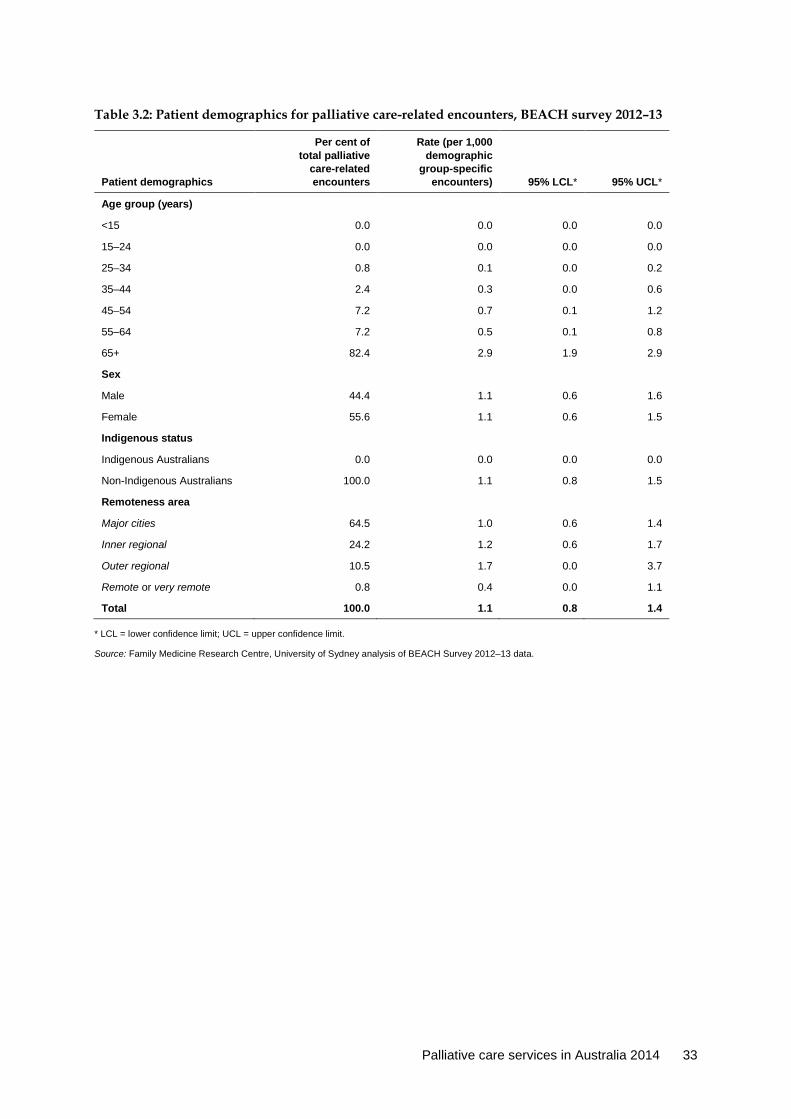
Palliative care services in Australia 2014 33
Table 3.2: Patient demographics for palliative care-related encounters, BEACH survey 2012–13
Patient demographics
Per cent of total palliative
care-related encounters
Rate (per 1,000 demographic
group-specific encounters) 95% LCL* 95% UCL*
Age group (years)
<15 0.0 0.0 0.0 0.0
15–24 0.0 0.0 0.0 0.0
25–34 0.8 0.1 0.0 0.2
35–44 2.4 0.3 0.0 0.6
45–54 7.2 0.7 0.1 1.2
55–64 7.2 0.5 0.1 0.8
65+ 82.4 2.9 1.9 2.9
Sex
Male 44.4 1.1 0.6 1.6
Female 55.6 1.1 0.6 1.5
Indigenous status
Indigenous Australians 0.0 0.0 0.0 0.0
Non-Indigenous Australians 100.0 1.1 0.8 1.5
Remoteness area
Major cities 64.5 1.0 0.6 1.4
Inner regional 24.2 1.2 0.6 1.7
Outer regional 10.5 1.7 0.0 3.7
Remote or very remote 0.8 0.4 0.0 1.1
Total 100.0 1.1 0.8 1.4
* LCL = lower confidence limit; UCL = upper confidence limit.
Source: Family Medicine Research Centre, University of Sydney analysis of BEACH Survey 2012–13 data.
34 Palliative care services in Australia 2014
4 Services provided by palliative medicine specialists
4.1 Introduction This chapter provides information on the number and types of Medicare Benefits Schedule (MBS)-subsidised palliative care-related services provided by palliative medicine specialists (see the ‘Key concepts’ box below for definitions of bold terms in this chapter) under the MBS; and the characteristics of patients who received these services. A palliative medicine specialist is a medical specialist who is a Fellow of the Royal Australasian College of Physicians and has completed the College’s training program in palliative medicine, or a Fellow of the Australasian Chapter of Palliative Medicine, or a Fellow of both professional bodies (ANZSPM 2008).
The Australian and New Zealand Society of Palliative Medicine describes palliative medicine specialists as the ‘general physicians of end of life care, able to coordinate a wide array of palliative treatment options (including chemotherapy, radiotherapy, surgical options, pharmacological options) and psychosocial care, based on a knowledge of the disease, burden versus benefits of palliative therapeutics and the wishes of patient and family’ (ANZSPM 2009:162).
In order to be eligible to claim subsidies under the MBS, patients must have referrals to palliative medicine specialist services from doctors, including GPs and community or hospital-based doctors (including specialists).
Patients who are referred to palliative medicine specialists usually have high-level and complex needs (physical, social, psychological, emotional), including:
• an exacerbation of a previously stable symptom, and/or • Identified needs (physical, social, emotional or spiritual) that exceed the capacity
(knowledge, resources, facilities) of the primary care providers (PCA 2005a). More information on the specific MBS items and item groups for palliative medicine specialist can be found in the Medicare Benefits Schedule Book (DoHA 2012). Two things should be noted when considering the information in this chapter: firstly, that a patient may access more than one type of MBS-subsidised palliative medicine specialist service during the reporting period presented and, secondly, that each service presented in this chapter is counted separately. In addition, the data relate only to when palliative care services provided by a palliative medicine specialist are being claimed under the MBS. In other words, the reported number of patients who receive palliative medicine services are likely to be an underestimate of total palliative care activity. This is due to the fact that other medical specialists (such as geriatricians and oncologists) may also often attend to terminally ill patients and provide palliative care, without the service being eligible to be claimed as a palliative care-related service in the MBS (Parker et al. 2008).

Palliative care services in Australia 2014 35
Key concepts Palliative medicine specialist is a medical practitioner who, in order to be eligible for payment of MBS subsidies for palliative care services, must be a Fellow of the Royal Australasian College of Physicians who has completed the College training program in palliative medicine, or a Fellow of the Australasian Chapter of Palliative Medicine, or a Fellow of both (ANZSPM 2008). MBS-subsidised palliative medicine specialist services are services provided by a palliative medicine specialist on a fee-for-service basis that are partly or fully funded under the Australian Government’s Medicare program. These services cover patient attendances (or consultations) provided in different settings, as well as services such as case conferencing. These item groups, along with the relevant MBS item numbers, are listed in Appendix Table B1.
The information presented in this chapter relates to MBS-subsidised palliative medicine specialist services processed by Medicare Australia in the financial year 2012–13. To provide information on changes over time, data are also presented for the reporting periods from 2008–09 to 2012–13. More detailed information on the scope and coverage of the data presented in this chapter is provided at Appendix B.
4.2 Characteristics of patients receiving palliative medicine specialist services
Nationally, about 11,600 patients received an MBS-subsidised palliative medicine specialist service during 2012–13 (Table 4.1), which equates to a rate of 50.9 patients per 100,000 population. During this time period, about 63,700 MBS-subsidised palliative medicine specialist services were provided, equating to an average of 5.5 services per patient (Table 4.2).
Table 4.1: MBS-subsidised palliative medicine specialist services: numbers of patients and services, 2012–13
Patients Services
Number 11,653 63,735
Rate per 100,000 population(a) 50.9 278.2
(a) Crude rates are based on the preliminary Australian estimated resident population as at 31 December 2012 (see Appendix C).
Source: Australian Government Department of Health analysis of MBS data, unpublished.
Of the 11,653 patients receiving an MBS-subsidised palliative medicine specialist service, more than two-thirds (69.4%) were aged 65 and older, with almost 9 in 10 (87.3%) aged 55 or older. For the 65 and older group, the population rate for 2012–13 was more than three times the rate seen for the 55–64 age group (246.6 and 80.0 per 100,000 population, respectively). Less than 1 in 50 (0.8%) patients receiving MBS-subsidised palliative medicine specialist services were aged 24 or under in 2012–13 (Table 4.2).
There was almost an equal gender split in those receiving MBS-subsidised palliative medicine specialist services (47.8% for females and 52.2% for males) (Table 4.2).
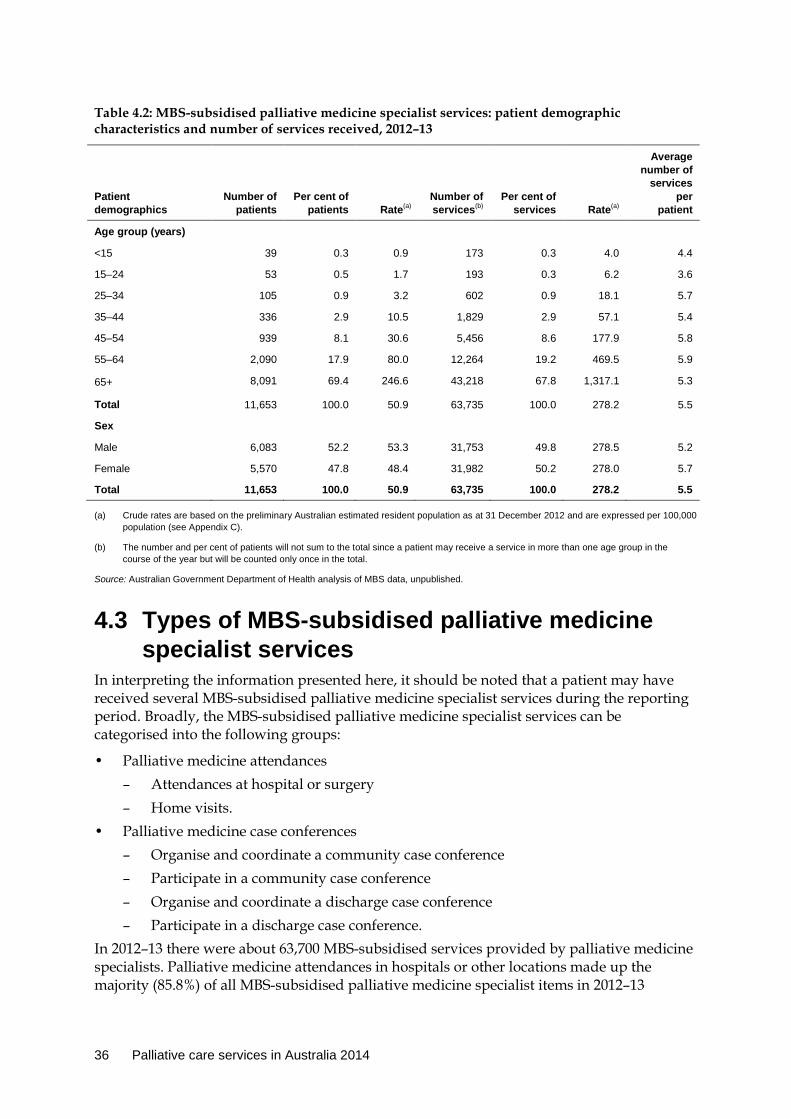
36 Palliative care services in Australia 2014
Table 4.2: MBS-subsidised palliative medicine specialist services: patient demographic characteristics and number of services received, 2012–13
Patient demographics
Number of patients
Per cent of patients Rate(a)
Number of services(b)
Per cent of services Rate(a)
Average number of
services per
patient
Age group (years)
<15 39 0.3 0.9 173 0.3 4.0 4.4
15–24 53 0.5 1.7 193 0.3 6.2 3.6
25–34 105 0.9 3.2 602 0.9 18.1 5.7
35–44 336 2.9 10.5 1,829 2.9 57.1 5.4
45–54 939 8.1 30.6 5,456 8.6 177.9 5.8
55–64 2,090 17.9 80.0 12,264 19.2 469.5 5.9
65+ 8,091 69.4 246.6 43,218 67.8 1,317.1 5.3
Total 11,653 100.0 50.9 63,735 100.0 278.2 5.5
Sex
Male 6,083 52.2 53.3 31,753 49.8 278.5 5.2
Female 5,570 47.8 48.4 31,982 50.2 278.0 5.7
Total 11,653 100.0 50.9 63,735 100.0 278.2 5.5
(a) Crude rates are based on the preliminary Australian estimated resident population as at 31 December 2012 and are expressed per 100,000 population (see Appendix C).
(b) The number and per cent of patients will not sum to the total since a patient may receive a service in more than one age group in the course of the year but will be counted only once in the total.
Source: Australian Government Department of Health analysis of MBS data, unpublished.
4.3 Types of MBS-subsidised palliative medicine specialist services
In interpreting the information presented here, it should be noted that a patient may have received several MBS-subsidised palliative medicine specialist services during the reporting period. Broadly, the MBS-subsidised palliative medicine specialist services can be categorised into the following groups:
• Palliative medicine attendances – Attendances at hospital or surgery – Home visits.
• Palliative medicine case conferences – Organise and coordinate a community case conference – Participate in a community case conference – Organise and coordinate a discharge case conference – Participate in a discharge case conference.
In 2012–13 there were about 63,700 MBS-subsidised services provided by palliative medicine specialists. Palliative medicine attendances in hospitals or other locations made up the majority (85.8%) of all MBS-subsidised palliative medicine specialist items in 2012–13

Palliative care services in Australia 2014 37
(Table 4.3). Indeed, nearly all of the MBS items claimed by palliative medicine specialists were for attendances at a hospital, surgery or the patient’s home (92.1%). Palliative medicine specialists were more likely to organise and coordinate case conferences for patients than to participate at such conferences initiated by other care providers. Table 4.3: MBS-subsidised palliative medicine specialist services: MBS item groups, 2012–13
MBS item groups Total (number) Per cent by
group Per cent of total
items
Palliative medicine attendances
Attendance in a hospital or surgery 54,669 93.1 85.8
Home visit 4,027 6.9 6.3
Total 58,696 100.0 92.1
Palliative medicine case conferences
Organise and coordinate a community case conference 2,512 49.9 3.9
Participate in a community case conference 1,376 27.3 2.2
Organise and coordinate/or participate in a discharge case conference
n.p. n.p. n.p.
Total 5,039 100.0 7.9
Total 63,735 . . 100.0
Source: Australian Government Department of Health analysis of MBS data, unpublished.
MBS-subsidised palliative medicine specialist services by state and territory and remoteness There was some variability between states and territories in the rate of subsidised palliative medicine specialist services in 2012–13. A number of states and territories could not be reported. In order to comply with the data cell suppression policies of the Australian Government Department of Health, most cells have been suppressed across Tasmania, the Australian Capital Territory and the Northern Territory. Cell suppression is applied to ensure that any data release takes into account privacy and legal requirements.
The rate of subsidised palliative medicine specialist services in 2012–13 varied among states and territories. Western Australia recorded the highest rate (586.3 per 100,000 population), more than double the national average rate (278.2) (Table 4.4).
Palliative medicine case conferences were predominantly recorded for New South Wales in 2012–13 (3,487), followed by Western Australia and Victoria. For the remaining jurisdictions, the number of case conferences recorded was negligible (Table 4.4).
In 2012–13, the highest rate of patients receiving MBS-subsidised palliative medicine specialist services was recorded in Inner regional areas, followed by Major cities (320.2 and 294.5 per 100,000 population, respectively) (Table 4.5).
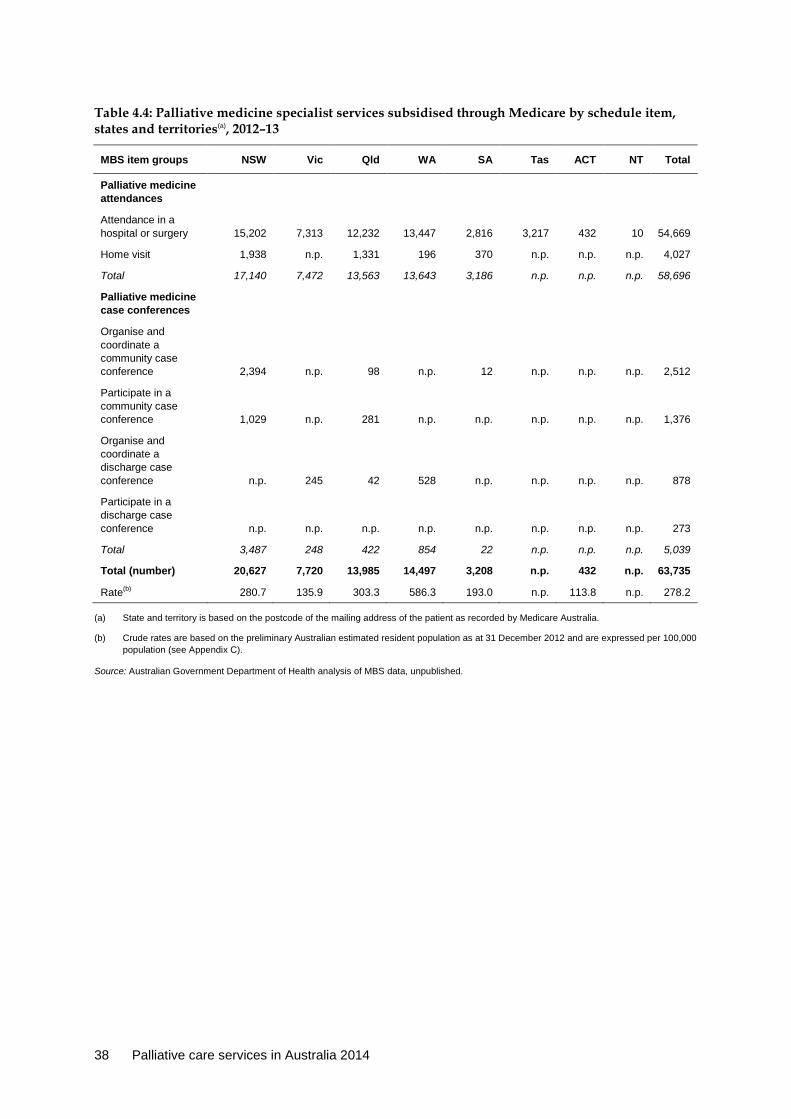
38 Palliative care services in Australia 2014
Table 4.4: Palliative medicine specialist services subsidised through Medicare by schedule item, states and territories(a), 2012–13
MBS item groups NSW Vic Qld WA SA Tas ACT NT Total
Palliative medicine attendances Attendance in a hospital or surgery 15,202 7,313 12,232 13,447 2,816 3,217 432 10 54,669
Home visit 1,938 n.p. 1,331 196 370 n.p. n.p. n.p. 4,027
Total 17,140 7,472 13,563 13,643 3,186 n.p. n.p. n.p. 58,696
Palliative medicine case conferences
Organise and coordinate a community case conference 2,394 n.p. 98 n.p. 12 n.p. n.p. n.p. 2,512
Participate in a community case conference 1,029 n.p. 281 n.p. n.p. n.p. n.p. n.p. 1,376
Organise and coordinate a discharge case conference n.p. 245 42 528 n.p. n.p. n.p. n.p. 878
Participate in a discharge case conference n.p. n.p. n.p. n.p. n.p. n.p. n.p. n.p. 273
Total 3,487 248 422 854 22 n.p. n.p. n.p. 5,039
Total (number) 20,627 7,720 13,985 14,497 3,208 n.p. 432 n.p. 63,735
Rate(b) 280.7 135.9 303.3 586.3 193.0 n.p. 113.8 n.p. 278.2
(a) State and territory is based on the postcode of the mailing address of the patient as recorded by Medicare Australia.
(b) Crude rates are based on the preliminary Australian estimated resident population as at 31 December 2012 and are expressed per 100,000 population (see Appendix C).
Source: Australian Government Department of Health analysis of MBS data, unpublished.

Palliative care services in Australia 2014 39
Table 4.5: MBS-subsidised palliative medicine specialist services: services by remoteness area, 2012–13
MBS item groups Major cities Inner regional Outer regional Remote Very remote Total
Palliative medicine attendances
Attendance in hospital or surgery 39,746 11,761 2,638 325 141 54,669
Home visit 2,654 1,270 97 n.p. n.p. 4,027
Total 42,399 13,031 2,735 n.p. n.p. 58,696
Palliative medicine case conferences
Organise and coordinate a community case conference 2,312 170 24 n.p. n.p. 2,512
Participate in a community case conference 1,310 51 12 n.p. n.p. 1,376
Organise and coordinate a discharge case conference 793 52 20 n.p. n.p. n.p.
Participate in a discharge case conference 238 21 7 n.p. n.p. n.p.
Total 4,652 294 63 n.p. n.p. 5,039
Total items (number)(a) 47,052 13,325 2,797 348 150 63,735
Rate(b) 294.5 320.2 136.6 109.1 72.8 278.2
(a) Numbers may not sum to totals due to unknown or missing data.
(b) Crude rates are based on the preliminary Australian estimated resident population as at 31 December 2012 and are expressed per 100,000 population (see Appendix C).
Source: Australian Government Department of Health analysis of MBS data, unpublished.
MBS-subsidised palliative medicine specialist services over time Over the 5 years to 2012–13, the total number of MBS-subsidised palliative medicine specialist services almost doubled (from 33,066 services in 2008–09 to 63,735), equating to an average annual increase of 17.8%. As a population rate, this represents an 82.1% increase between 2008–09 and 2012–13, from 152.8 per 100,000 to 278.2 (Table 4.6).
During this same period, the number of palliative medicine attendances increased at an average annual rate of 16.5%, whereas palliative medicine case conferences increased by 42.3% (Table 4.6).
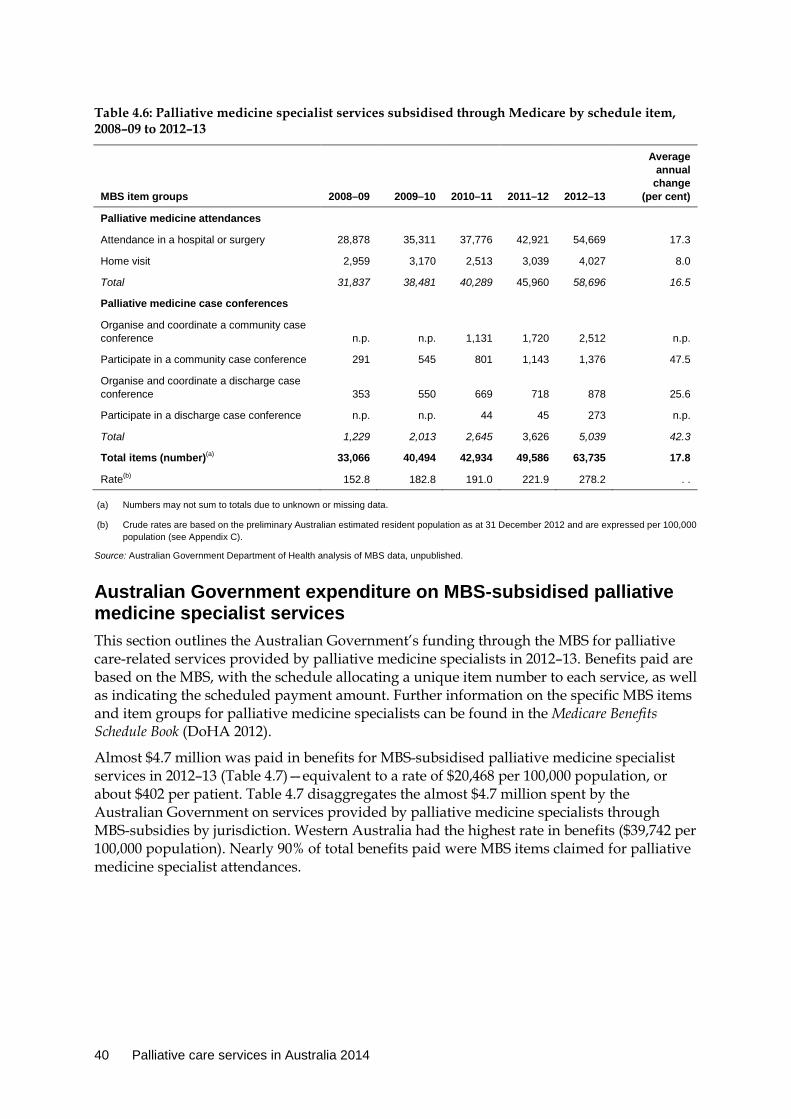
40 Palliative care services in Australia 2014
Table 4.6: Palliative medicine specialist services subsidised through Medicare by schedule item, 2008–09 to 2012–13
MBS item groups 2008–09 2009–10 2010–11 2011–12 2012–13
Average annual
change (per cent)
Palliative medicine attendances
Attendance in a hospital or surgery 28,878 35,311 37,776 42,921 54,669 17.3
Home visit 2,959 3,170 2,513 3,039 4,027 8.0
Total 31,837 38,481 40,289 45,960 58,696 16.5
Palliative medicine case conferences
Organise and coordinate a community case conference n.p. n.p. 1,131 1,720 2,512 n.p.
Participate in a community case conference 291 545 801 1,143 1,376 47.5
Organise and coordinate a discharge case conference 353 550 669 718 878 25.6
Participate in a discharge case conference n.p. n.p. 44 45 273 n.p.
Total 1,229 2,013 2,645 3,626 5,039 42.3
Total items (number)(a) 33,066 40,494 42,934 49,586 63,735 17.8
Rate(b) 152.8 182.8 191.0 221.9 278.2 . .
(a) Numbers may not sum to totals due to unknown or missing data.
(b) Crude rates are based on the preliminary Australian estimated resident population as at 31 December 2012 and are expressed per 100,000 population (see Appendix C).
Source: Australian Government Department of Health analysis of MBS data, unpublished.
Australian Government expenditure on MBS-subsidised palliative medicine specialist services This section outlines the Australian Government’s funding through the MBS for palliative care-related services provided by palliative medicine specialists in 2012–13. Benefits paid are based on the MBS, with the schedule allocating a unique item number to each service, as well as indicating the scheduled payment amount. Further information on the specific MBS items and item groups for palliative medicine specialists can be found in the Medicare Benefits Schedule Book (DoHA 2012).
Almost $4.7 million was paid in benefits for MBS-subsidised palliative medicine specialist services in 2012–13 (Table 4.7)—equivalent to a rate of $20,468 per 100,000 population, or about $402 per patient. Table 4.7 disaggregates the almost $4.7 million spent by the Australian Government on services provided by palliative medicine specialists through MBS-subsidies by jurisdiction. Western Australia had the highest rate in benefits ($39,742 per 100,000 population). Nearly 90% of total benefits paid were MBS items claimed for palliative medicine specialist attendances.
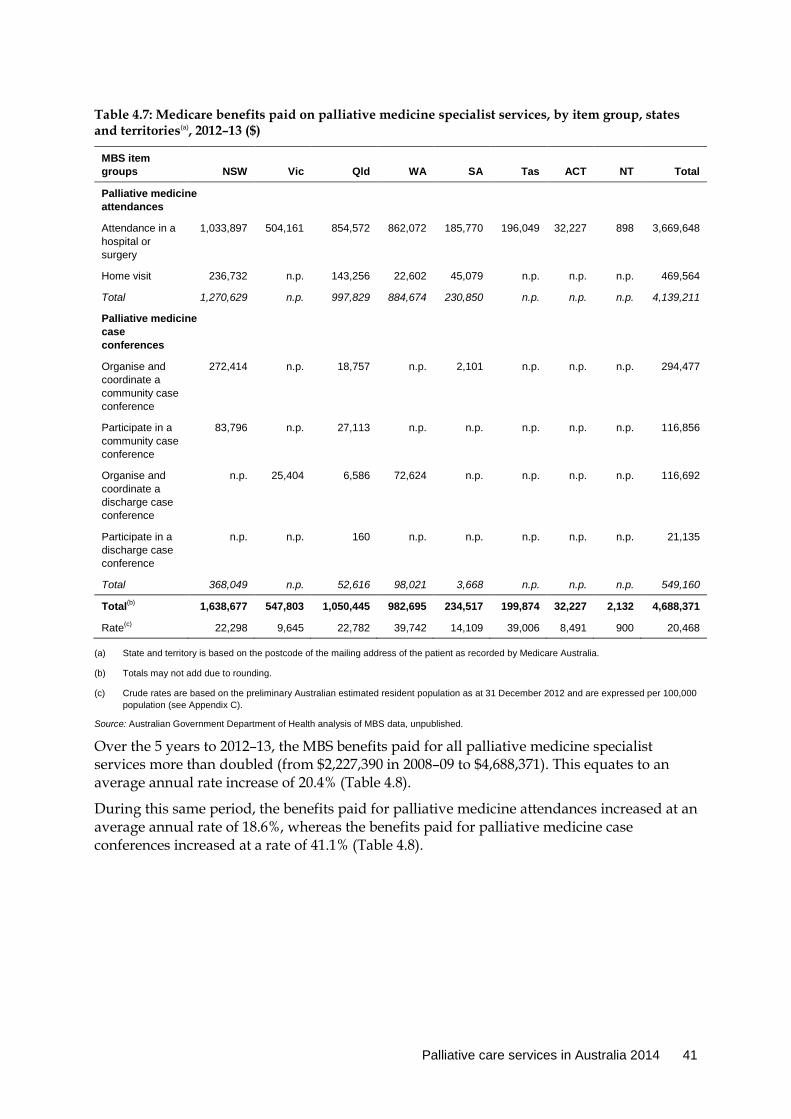
Palliative care services in Australia 2014 41
Table 4.7: Medicare benefits paid on palliative medicine specialist services, by item group, states and territories(a), 2012–13 ($)
MBS item groups NSW Vic Qld WA SA Tas ACT NT Total
Palliative medicine attendances
Attendance in a hospital or surgery
1,033,897 504,161 854,572 862,072 185,770 196,049 32,227 898 3,669,648
Home visit 236,732 n.p. 143,256 22,602 45,079 n.p. n.p. n.p. 469,564
Total 1,270,629 n.p. 997,829 884,674 230,850 n.p. n.p. n.p. 4,139,211
Palliative medicine case conferences
Organise and coordinate a community case conference
272,414 n.p. 18,757 n.p. 2,101 n.p. n.p. n.p. 294,477
Participate in a community case conference
83,796 n.p. 27,113 n.p. n.p. n.p. n.p. n.p. 116,856
Organise and coordinate a discharge case conference
n.p. 25,404 6,586 72,624 n.p. n.p. n.p. n.p. 116,692
Participate in a discharge case conference
n.p. n.p. 160 n.p. n.p. n.p. n.p. n.p. 21,135
Total 368,049 n.p. 52,616 98,021 3,668 n.p. n.p. n.p. 549,160
Total(b) 1,638,677 547,803 1,050,445 982,695 234,517 199,874 32,227 2,132 4,688,371
Rate(c) 22,298 9,645 22,782 39,742 14,109 39,006 8,491 900 20,468
(a) State and territory is based on the postcode of the mailing address of the patient as recorded by Medicare Australia.
(b) Totals may not add due to rounding.
(c) Crude rates are based on the preliminary Australian estimated resident population as at 31 December 2012 and are expressed per 100,000 population (see Appendix C).
Source: Australian Government Department of Health analysis of MBS data, unpublished.
Over the 5 years to 2012–13, the MBS benefits paid for all palliative medicine specialist services more than doubled (from $2,227,390 in 2008–09 to $4,688,371). This equates to an average annual rate increase of 20.4% (Table 4.8).
During this same period, the benefits paid for palliative medicine attendances increased at an average annual rate of 18.6%, whereas the benefits paid for palliative medicine case conferences increased at a rate of 41.1% (Table 4.8).

42 Palliative care services in Australia 2014
Table 4.8: Medicare benefits paid on palliative medicine specialist services, Australia, 2008–09 to 2012–13 ($)
MBS item 2008–09 2009–10 2010–11 2011–12 2012–13
Average annual
change (per cent)
Palliative medicine attendances
Attendance in a hospital or surgery 1,775,859 2,198,438 2,413,876 2,840,124 3,669,648 19.9
Home visit 312,898 354,138 289,464 355,900 469,564 10.7
Total 2,088,758 2,552,576 2,703,340 3,196,024 4,139,211 18.6
Palliative medicine case conferences
Organise and coordinate a community case conference n.p. n.p. 123,532 190,731 294,477 n.p.
Participate in a community case conference 21,308 41,161 63,544 92,972 116,856 53.0
Organise and coordinate a discharge case conference 56,505 78,329 87,581 91,751 116,692 19.9
Participate in a discharge case conference n.p. n.p. 3,949 5,532 21,135 n.p.
Total 138,632 217,566 278,605 380,986 549,160 41.1
Total items(a) 2,227,390 2,770,142 2,981,945 3,577,010 4,688,371 20.4
(a) Totals may not add due to rounding.
Source: Australian Government Department of Health analysis of MBS data, unpublished.

Palliative care services in Australia 2014 43
5 Palliative care in residential aged care The Australian Government funds residential aged care services for older Australians whose care needs are such that they can no longer remain in their own homes (AIHW 2011d). Residential aged care services provide accommodation and services to people requiring ongoing health and nursing care due to chronic impairments and a reduced degree of independence in activities of daily living. They provide nursing, supervision or other types of personal care required by the residents (PC 2011).
Research indicates that, over the last 20 years, the proportion of people dying who are aged care residents is increasing (Giles et al. 2003). Further, the Productivity Commission report Caring for older Australians stated that palliative care is ‘core business’ for any aged care system (PC 2011).
Residential aged care services face unique difficulties in administering palliative care, with residents often having dementia and/or communication difficulties and comorbidities (NHMRC 2006). Patients in hospices are more likely than residents in aged care services to have a cancer diagnosis; conversely, residents in aged care services are more likely than hospice patients to have a diagnosis of a chronic degenerative disease(s) (Gribich et al. 2005).
This chapter presents information on aged care residents who have been appraised as requiring palliative care.
5.1 Data source The data on palliative care in residential aged care (see ‘Key concepts’ box below for an explanation of bold terms in this chapter) presented in this section have been derived from data held in the AIHW’s National Aged Care Data Clearinghouse. This Clearinghouse contains information gathered via a number of data collection instruments. Data collected from the ACFI have been used for the analyses presented in this section (DoHA 2009).
An ACFI appraisal is completed by residential aged care services in order to determine a resident’s care needs. The results of the assessment are used to allocate funding, based on a resident’s need for care across three care domains:
• Activities of Daily Living • Cognition and Behaviour • Complex Health Care (AIHW 2011d; DoHA 2009). ACFI appraisals include information on:
• up to 3 mental or behavioural diagnoses • up to 3 other medical diagnoses • 5 questions about the need for assistance with activities of daily living: nutrition,
mobility, personal hygiene, toileting, and continence • 5 questions on the need for assistance with a resident’s cognition and behaviour:
cognitive skills, wandering, verbal behaviour, physical behaviour, and depression • 2 questions on the need for assistance with the use of medication and complex
health-care procedures (AIHW 2011d).

44 Palliative care services in Australia 2014
Key concepts Palliative care in residential aged care is care provided to residential aged care residents identified in the complex health-care domain of the ACFI as requiring palliative care. This appraisal process identifies residents requiring a palliative care program where ongoing care will involve very intensive clinical nursing and/or complex pain management in the residential care setting. Permanent resident is a resident who is admitted to residential aged care for permanent care (long-term care). Permanent admission is an admission to residential aged care for expected long-term care during the reporting period.
5.2 Characteristics of residential aged care residents receiving palliative care
There were almost 226,500 permanent residential aged care residents in Australia in 2012–13 with completed ACFI appraisals and around 1 in 18 of these residents (12,689) had an ACFI appraisal indicating the need for palliative care (Table 5.1).
Table 5.1: Admissions to permanent residential aged care and permanent residents appraised as requiring palliative care or other care types, 2012–13
Palliative care Other care Total
Permanent admissions (in 2012–13) 5,277 61,725 67,002
Permanent residents 12,689 213,722 226,411
Note: For clients who had more than one admission in the year, this table reports the last admission.
Sources: Supplementary tables S5.1 and S5.2.
The age profile of permanent residents who required palliative care and of residents with other care requirements during 2012–13 was very similar (Supplementary Table S5.1).
For residents who entered permanent care during 2012–13, there was a smaller proportion in the 85 and older age group who were appraised as requiring palliative care compared with other care types (47.4% and 52.4%, respectively) (Supplementary Table S5.2). The percentage for those appraised as requiring palliative care was higher for permanent residents than for permanent admissions in the remaining age groups (Figure 5.1).
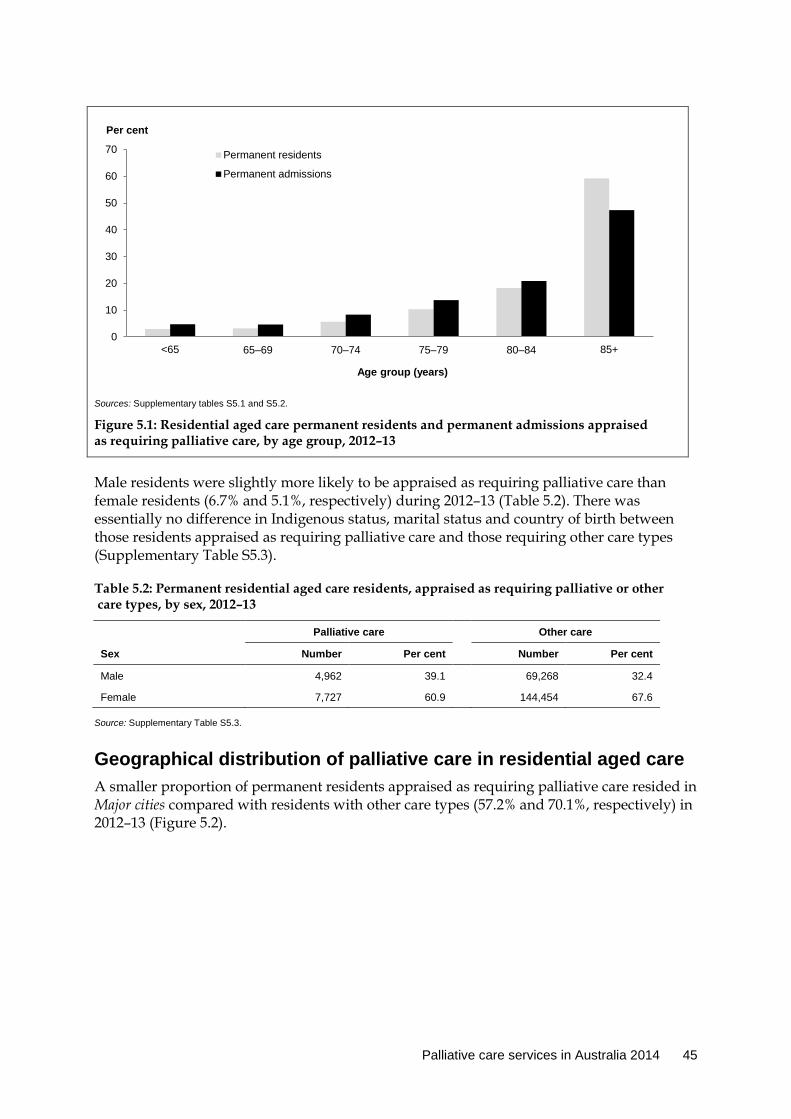
Palliative care services in Australia 2014 45
Sources: Supplementary tables S5.1 and S5.2.
Figure 5.1: Residential aged care permanent residents and permanent admissions appraised as requiring palliative care, by age group, 2012–13
Male residents were slightly more likely to be appraised as requiring palliative care than female residents (6.7% and 5.1%, respectively) during 2012–13 (Table 5.2). There was essentially no difference in Indigenous status, marital status and country of birth between those residents appraised as requiring palliative care and those requiring other care types (Supplementary Table S5.3).
Table 5.2: Permanent residential aged care residents, appraised as requiring palliative or other care types, by sex, 2012–13
Palliative care Other care
Sex Number Per cent Number Per cent
Male 4,962 39.1 69,268 32.4
Female 7,727 60.9 144,454 67.6
Source: Supplementary Table S5.3.
Geographical distribution of palliative care in residential aged care A smaller proportion of permanent residents appraised as requiring palliative care resided in Major cities compared with residents with other care types (57.2% and 70.1%, respectively) in 2012–13 (Figure 5.2).
0
10
20
30
40
50
60
70
<65 65–69 70–74 75–79 80–84 85+
Per cent
Age group (years)
Permanent residents
Permanent admissions
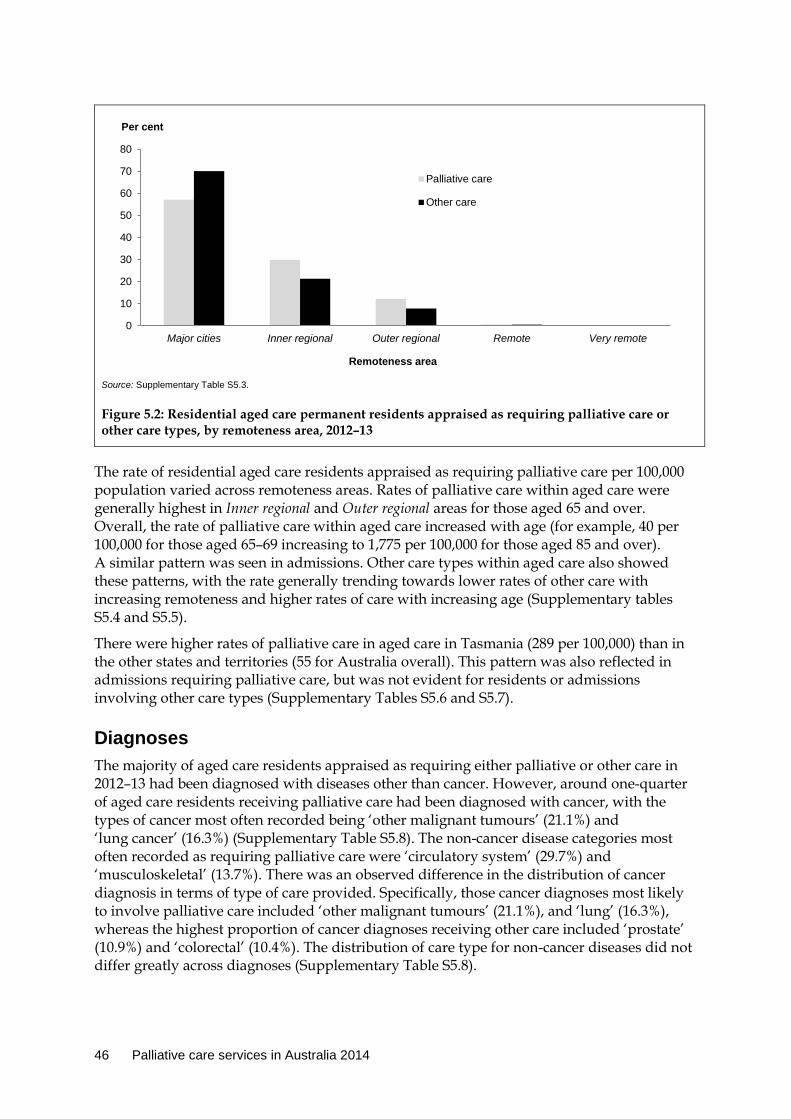
46 Palliative care services in Australia 2014
Source: Supplementary Table S5.3.
Figure 5.2: Residential aged care permanent residents appraised as requiring palliative care or other care types, by remoteness area, 2012–13
The rate of residential aged care residents appraised as requiring palliative care per 100,000 population varied across remoteness areas. Rates of palliative care within aged care were generally highest in Inner regional and Outer regional areas for those aged 65 and over. Overall, the rate of palliative care within aged care increased with age (for example, 40 per 100,000 for those aged 65–69 increasing to 1,775 per 100,000 for those aged 85 and over). A similar pattern was seen in admissions. Other care types within aged care also showed these patterns, with the rate generally trending towards lower rates of other care with increasing remoteness and higher rates of care with increasing age (Supplementary tables S5.4 and S5.5).
There were higher rates of palliative care in aged care in Tasmania (289 per 100,000) than in the other states and territories (55 for Australia overall). This pattern was also reflected in admissions requiring palliative care, but was not evident for residents or admissions involving other care types (Supplementary Tables S5.6 and S5.7).
Diagnoses The majority of aged care residents appraised as requiring either palliative or other care in 2012–13 had been diagnosed with diseases other than cancer. However, around one-quarter of aged care residents receiving palliative care had been diagnosed with cancer, with the types of cancer most often recorded being ‘other malignant tumours’ (21.1%) and ‘lung cancer’ (16.3%) (Supplementary Table S5.8). The non-cancer disease categories most often recorded as requiring palliative care were ‘circulatory system’ (29.7%) and ‘musculoskeletal’ (13.7%). There was an observed difference in the distribution of cancer diagnosis in terms of type of care provided. Specifically, those cancer diagnoses most likely to involve palliative care included ‘other malignant tumours’ (21.1%), and ‘lung’ (16.3%), whereas the highest proportion of cancer diagnoses receiving other care included ‘prostate’ (10.9%) and ‘colorectal’ (10.4%). The distribution of care type for non-cancer diseases did not differ greatly across diagnoses (Supplementary Table S5.8).
0
10
20
30
40
50
60
70
80
Major cities Inner regional Outer regional Remote Very remote
Per cent
Palliative care
Other care
Remoteness area

Palliative care services in Australia 2014 47
Table 5.3: Diagnosed diseases in ACFI-appraised permanent residential aged care residents, 2012–13
Palliative care Other care
Disease Number Per cent Number Per cent
Cancer 3,307 26.1 11,772 5.5
Other diseases 9,382 73.9 201,950 94.5
Source: Supplementary Table S5.8.
Separation mode A separation from residential aged care occurs when a resident ceases to receive residential aged care from a service within 2 days. The reasons for separation (called the separation mode) indicate the destination of a resident at separation and are categorised as: • death • admission to hospital (note that a separation is not counted where the resident is
granted ‘hospital leave’) • return to community (such as to family or home) • move to another aged care service • other. Unsurprisingly, the majority of residents, whether or not they received palliative care, had death as the mode of separation (Table 5.4). Those residents receiving palliative care were less likely to have a mode of separation of going to hospital, returning to the community, or moving to another aged care service than those residents with other care needs.
Table 5.4: Separations of permanent residential aged care residents appraised as requiring palliative care or other care types, by mode of separation, 2012–13
Separation reason
Palliative care Other care
Number Per cent(a) Number Per cent(a)
Death 8,428 95.5 45,498 79.7
Admission to hospital 83 0.9 1,053 1.8
Return to community 196 2.2 6,871 12.0
Move to another aged care service 66 0.7 2,005 3.5
Other 54 0.6 1,631 2.9
All separations 8,827 100.0 57,058 100.0
(a) Percentages may not add to 100% due to rounding.
Source: AIHW analysis of 2012–13 ACFI data.
5.3 Length of stay For permanent residents separating from a residential aged care facility during the 2012–13 reporting period, those appraised as requiring palliative care were more likely to have a shorter length of stay than other care types (Figure 5.3). For residents with a length of stay of less than 8 weeks, the proportion requiring palliative care during 2012–13 was more than three times that for residents receiving other care types (32.2% and 10.0%, respectively) (Figure 5.3). For a length of stay of less than 4 weeks, the corresponding difference was
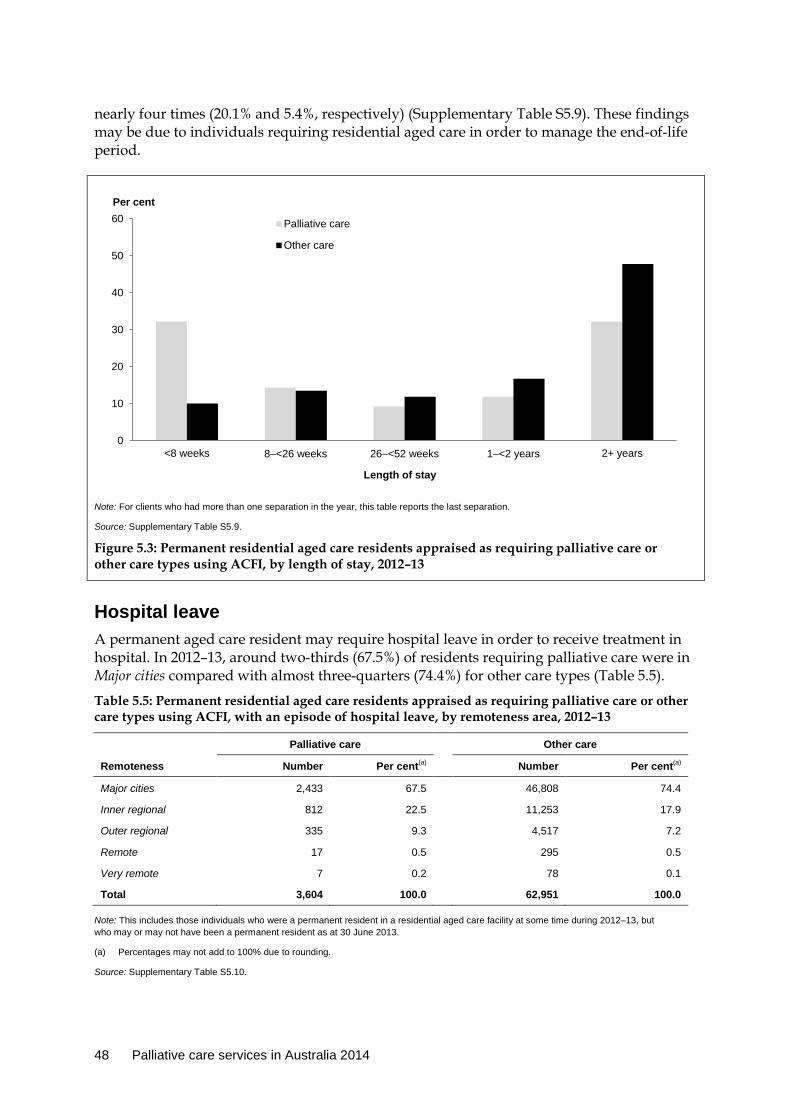
48 Palliative care services in Australia 2014
nearly four times (20.1% and 5.4%, respectively) (Supplementary Table S5.9). These findings may be due to individuals requiring residential aged care in order to manage the end-of-life period.
Note: For clients who had more than one separation in the year, this table reports the last separation.
Source: Supplementary Table S5.9.
Figure 5.3: Permanent residential aged care residents appraised as requiring palliative care or other care types using ACFI, by length of stay, 2012–13
Hospital leave A permanent aged care resident may require hospital leave in order to receive treatment in hospital. In 2012–13, around two-thirds (67.5%) of residents requiring palliative care were in Major cities compared with almost three-quarters (74.4%) for other care types (Table 5.5).
Table 5.5: Permanent residential aged care residents appraised as requiring palliative care or other care types using ACFI, with an episode of hospital leave, by remoteness area, 2012–13
Palliative care Other care
Remoteness Number Per cent(a) Number Per cent(a)
Major cities 2,433 67.5 46,808 74.4
Inner regional 812 22.5 11,253 17.9
Outer regional 335 9.3 4,517 7.2
Remote 17 0.5 295 0.5
Very remote 7 0.2 78 0.1
Total 3,604 100.0 62,951 100.0
Note: This includes those individuals who were a permanent resident in a residential aged care facility at some time during 2012–13, but who may or may not have been a permanent resident as at 30 June 2013.
(a) Percentages may not add to 100% due to rounding.
Source: Supplementary Table S5.10.
0
10
20
30
40
50
60
<8 weeks 8–<26 weeks 26–<52 weeks 1–<2 years 2+ years
Per cent
Length of stay
Palliative care
Other care

Palliative care services in Australia 2014 49
6 Palliative care-related medications
6.1 Introduction Prescription medications are an important component of care for palliative patients. One of the attributes of palliative care is to ‘provide relief from pain and other distressing symptoms’ (WHO 2014). In the majority of cases, this involves prescription medications being prescribed by the treating clinician.
This chapter presents information on prescription medications prescribed for palliative care patients. This information is sourced through the Pharmaceutical Benefits Scheme (PBS) and the Repatriation Pharmaceutical Benefits Scheme (RPBS). Through both of these schemes, Medicare Australia makes payments to subsidise pharmaceutical products listed in the Schedule of Pharmaceutical Benefits (Australian Government Department of Health 2014b). In previous years, data on non-subsidised palliative care-related medications have not been available. However, from 1 April 2012, changes to the National Health Act require pharmacies to supply data for prescriptions that are priced below the patient co-payment level to the Department of Human Services (DHS 2013). One impact of these changes is that, for the first time, data are now available on non-subsidised palliative care-related prescriptions. These data have been included in this chapter and are reported alongside PBS/RPBS subsidised medication data.
In order to improve access to essential and affordable medications for patients receiving palliative care, the Australian Government introduced, in 2004, the Pharmaceutical Benefits for Palliative Care Schedule, as a subsection of the PBS Schedule. The palliative care schedule is a list of medications recommended for subsidy by the Pharmaceutical Benefits Advisory Committee. These medications may be prescribed for patients with ‘active, progressive and far-advanced diseases for whom the prognosis is limited and the focus of care is quality of life’ (Australian Government Department of Health 2014a). In practice, this means that any patient with a life-limiting disease can access these medications, regardless of the type of disease.
As well as those medications listed on the palliative care schedule, patients receiving palliative care can also access medications in the general listings of the PBS/RPBS schedule. However, only those medications in the palliative care listings and medications prescribed by palliative medicine specialists are discussed in this chapter; these will be referred to as palliative care-related prescriptions (see ‘Key concepts’ box below for explanations of bold terms in this chapter).

50 Palliative care services in Australia 2014
Key concepts Palliative care-related prescriptions are defined in this chapter as: • medications listed in the Pharmaceutical Benefits for Palliative Care Schedule and/or • all other medications prescribed by palliative medicine specialists. The information on prescription medicines in this chapter has been sourced from the PBS/RPBS and refers to medications prescribed by clinicians and subsequently dispensed in community pharmacies (or, for Section 100 drugs, by hospital pharmacies). Consequently, it is a count of medications dispensed rather than a count of prescriptions written by clinicians. Under co-payment prescriptions are prescriptions where the medication is on the PBS/RPBS schedule but the patient co-payment covers the total costs of the prescribed medication so the effective subsidy is zero. Private medications, where the medication is not on the PBS/RPBS schedule, are not included in this tabulation.
The definition of a ‘palliative care-related prescription’ captures, as far as possible, those medications dispensed for palliative care-related reasons. However, it is likely that some medications prescribed for non-palliative care-related reasons are included; that is, some medications prescribed by palliative medicine specialists may not relate directly to the patient’s palliative care. Similarly, other medications related to palliative care might have been excluded; for example, medications not listed in the palliative care schedule, but which were prescribed by GPs or non-palliative medicine specialists as part of palliative care.
The data used to create this chapter relate to the number of prescriptions recorded on the PBS/RPBS. When interpreting the information presented in this chapter, it is useful to note that individual prescriptions will vary in the number of doses, the strength of each individual dose and the type of preparation (such as tablets or injections). This level of detail is not presented in this chapter.
6.2 Characteristics of patients receiving palliative care-related prescriptions
Nationally, there were more than 43,200 palliative care-related prescriptions provided to over 22,200 patients in 2012–13 (Table 6.1). PBS/RPBS subsidised prescriptions accounted for 89.6% of all palliative care-related prescriptions, which equates to a rate of 169.2 subsidised prescriptions per 100,000 population. The majority of patients (87.6%) received a PBS/RPBS subsidised prescription, which equates to a rate of 85.2 patients per 100,000 population (Table 6.1). On average, there were about 2 palliative care-related prescriptions for each patient during 2012–13.

Palliative care services in Australia 2014 51
Table 6.1: Palliative care schedule items: numbers of patients and prescriptions, 2012–13
PBS and RPBS subsidised prescriptions
All prescriptions (subsidised and under co-payment(a))
Patients Prescriptions
Patients Prescriptions
Number 19,518 38,760
22,287 43,265
Rate(b) 85.2 169.2 97.3 188.9
(a) Under co-payment prescriptions are where the medication is on the PBS/RPBS schedule but the patient co-payment covers the total costs of the prescribed medication so the effective subsidy is zero. Private medications, where the medication is not on the PBS/RPBS schedule, are not included in this tabulation.
(b) Crude rate is based on the preliminary Australian estimated resident population as at 31 December 2012 and is expressed per 100,000 populations (see Appendix C).
Source: Australian Government Department of Health analysis of PBS/RPBS data, unpublished.
There was little difference observed in patient characteristics between all palliative care-related prescriptions (both subsidised and under co-payment) and those that were subsidised only (Supplementary Table S6.1). This is most likely due to the fact that the majority of patients were included in the subsidised prescription category.
One (1) in 5 (19.9%) patients who were prescribed palliative care-related prescriptions during 2012–13 were aged 85 or older, with two-thirds (65.0%) aged 65 or older (Figure 6.1). For the 85 and older group, the population rate for 2012–13 was 1,019.7 per 100,000 population, which was almost twice as high as the rate for the 75–84 age group (512.0 per 100,000). Very few palliative care-related prescriptions were for people aged under 25 (2.8%).
Source: Supplementary Table S6.1.
Figure 6.1: Palliative care schedule items (subsidised and under co-payment), prescriptions and patients, by age group, 2012–13
The gender profile of patients who received palliative care-related prescriptions was essentially balanced in 2012–13 (52.5% female and 47.4% male) (Supplementary Table S6.1). Males and females both averaged 2.0 palliative care-related prescriptions for each patient during 2012–13.
0
5
10
15
20
25
30
< 15 15–24 25–34 35–44 45–54 55–64 65–74 75–84 85+
Per cent
Age group (years)
PatientsPrescriptions
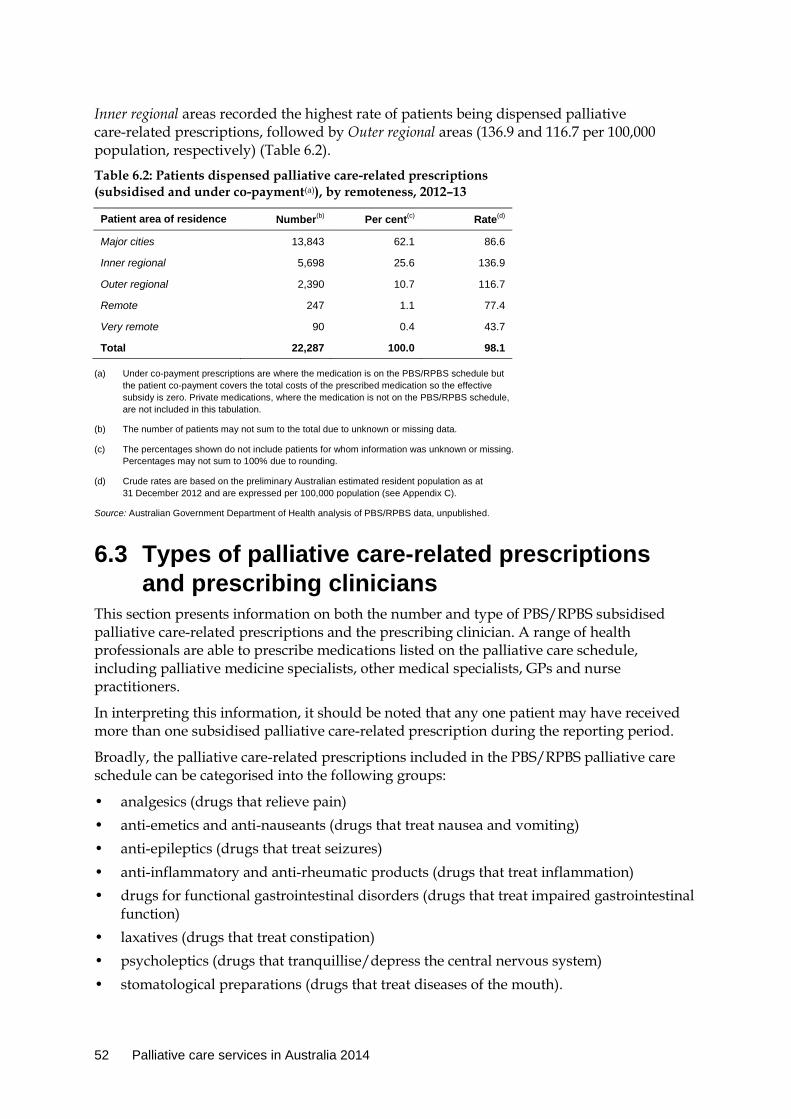
52 Palliative care services in Australia 2014
Inner regional areas recorded the highest rate of patients being dispensed palliative care-related prescriptions, followed by Outer regional areas (136.9 and 116.7 per 100,000 population, respectively) (Table 6.2).
Table 6.2: Patients dispensed palliative care-related prescriptions (subsidised and under co-payment(a)), by remoteness, 2012–13
Patient area of residence Number(b) Per cent(c) Rate(d)
Major cities 13,843 62.1 86.6
Inner regional 5,698 25.6 136.9
Outer regional 2,390 10.7 116.7
Remote 247 1.1 77.4
Very remote 90 0.4 43.7
Total 22,287 100.0 98.1
(a) Under co-payment prescriptions are where the medication is on the PBS/RPBS schedule but the patient co-payment covers the total costs of the prescribed medication so the effective subsidy is zero. Private medications, where the medication is not on the PBS/RPBS schedule, are not included in this tabulation.
(b) The number of patients may not sum to the total due to unknown or missing data.
(c) The percentages shown do not include patients for whom information was unknown or missing. Percentages may not sum to 100% due to rounding.
(d) Crude rates are based on the preliminary Australian estimated resident population as at 31 December 2012 and are expressed per 100,000 population (see Appendix C).
Source: Australian Government Department of Health analysis of PBS/RPBS data, unpublished.
6.3 Types of palliative care-related prescriptions and prescribing clinicians
This section presents information on both the number and type of PBS/RPBS subsidised palliative care-related prescriptions and the prescribing clinician. A range of health professionals are able to prescribe medications listed on the palliative care schedule, including palliative medicine specialists, other medical specialists, GPs and nurse practitioners.
In interpreting this information, it should be noted that any one patient may have received more than one subsidised palliative care-related prescription during the reporting period.
Broadly, the palliative care-related prescriptions included in the PBS/RPBS palliative care schedule can be categorised into the following groups:
• analgesics (drugs that relieve pain) • anti-emetics and anti-nauseants (drugs that treat nausea and vomiting) • anti-epileptics (drugs that treat seizures) • anti-inflammatory and anti-rheumatic products (drugs that treat inflammation) • drugs for functional gastrointestinal disorders (drugs that treat impaired gastrointestinal
function) • laxatives (drugs that treat constipation) • psycholeptics (drugs that tranquillise/depress the central nervous system) • stomatological preparations (drugs that treat diseases of the mouth).

Palliative care services in Australia 2014 53
There were over 43,200 palliative care-related prescriptions dispensed in 2012–13, with the majority (89.6%) of these being subsidised prescriptions (Table 6.3).
Laxatives were the palliative care-related prescription most often dispensed in 2012–13, accounting for 37.3% of all subsidised prescriptions, followed by analgesics and anti-epileptics (26.6% and 14.2%, respectively). (Table 6.3)
GPs prescribed the majority (82.2%) of subsidised palliative care-related prescriptions. The next most frequently recorded type of clinician was Other clinicians, followed by Palliative medicine specialists (14.8% and 2.9%, respectively) (Table 6.3).
The pattern of the types of medications dispensed varied according to the type of clinician. The 2 subsidised medications most often dispensed by GPs were laxatives and analgesics (38.9% and 24.3%, respectively). Analgesics were the most frequently dispensed subsidised medications by Palliative medicine specialists followed by drugs for gastrointestinal disorders (45.1% and 19.2%, respectively). For Other clinicians, the most frequently dispensed subsidised medications were analgesics and laxatives (35.3% and 32.4%, respectively) (Table 6.3).

54 Palliative care services in Australia 2014
Table 6.3: Palliative care-related prescriptions, by medication type prescribed and prescribing clinician, 2012–13
Prescribing clinician (per cent)
Medication type GPs
Palliative medicine
specialists Other
clinicians All clinicians
(per cent) Total
(number)
Subsidised prescriptions
Analgesics 24.3 45.1 35.3 26.6 10,295
Anti-emetics and anti-nauseants 0.1 0.0 0.0 0.0 19
Anti-epileptics 15.0 8.3 10.9 14.2 5,510
Anti-inflammatory and anti-rheumatic products 2.6 1.6 2.4 2.6 990 Drugs for functional gastrointestinal disorders 3.5 19.2 6.8 4.4 1,724 Laxatives 38.9 18.1 32.4 37.3 14,449
Psycholeptics 13.5 7.4 10.1 12.8 4,961
Stomatological preparations 2.1 0.3 2.2 2.1 812
Total (per cent) 100.0 100.0 100.0 100.0 . .
Total (number) 31,865 1,143 5,752 . . 38,760
Per cent (row) 82.2 2.9 14.8 100.0 . .
Total prescriptions (subsidised and under co-payment(a))
Analgesics 22.9 43.5 31.3 24.8 10,740
Anti-emetics and anti-nauseants 0.1 0.0 0.0 0.0 19
Anti-epileptics 17.1 10.2 15.7 16.7 7,211
Anti-inflammatory and anti-rheumatic products 4.6 1.5 4.1 4.4 1,899 Drugs for functional gastrointestinal disorders 3.2 18.1 5.9 4.0 1,747 Laxatives 36.6 18.1 30.6 35.1 15,186
Psycholeptics 13.7 8.0 10.3 13.0 5,617
Stomatological preparations 2.0 0.6 2.1 2.0 846
Total (per cent)(b) 100.0 100.0 100.0 100.0 . .
Total (number) 35,237 1,226 6,802 . . 43,265
Per cent (row) 81.4 2.8 15.7 100.0 . .
(a) Under co-payment prescriptions are where the medication is on the PBS/RPBS schedule but the patient co-payment covers the total costs of the prescribed medication so the effective subsidy is zero. Private medications, where the medication is not on the PBS/RPBS schedule, are not included in this tabulation.
(b) Percentages may not add to 100% due to rounding.
Note: ‘Other clinicians’ includes medical specialists from other disciplines and nurse practitioners.
Sources: Supplementary tables S6.2 and S6.3.
Palliative care-related prescriptions by state and territory The number of subsidised palliative care-related prescriptions dispensed nationally in 2012–13 was 169.2 per 100,000 population. Rates ranged from 98.4 per 100,000 population in the Northern Territory to 230.5 per 100,000 population in Tasmania (Table 6.4).
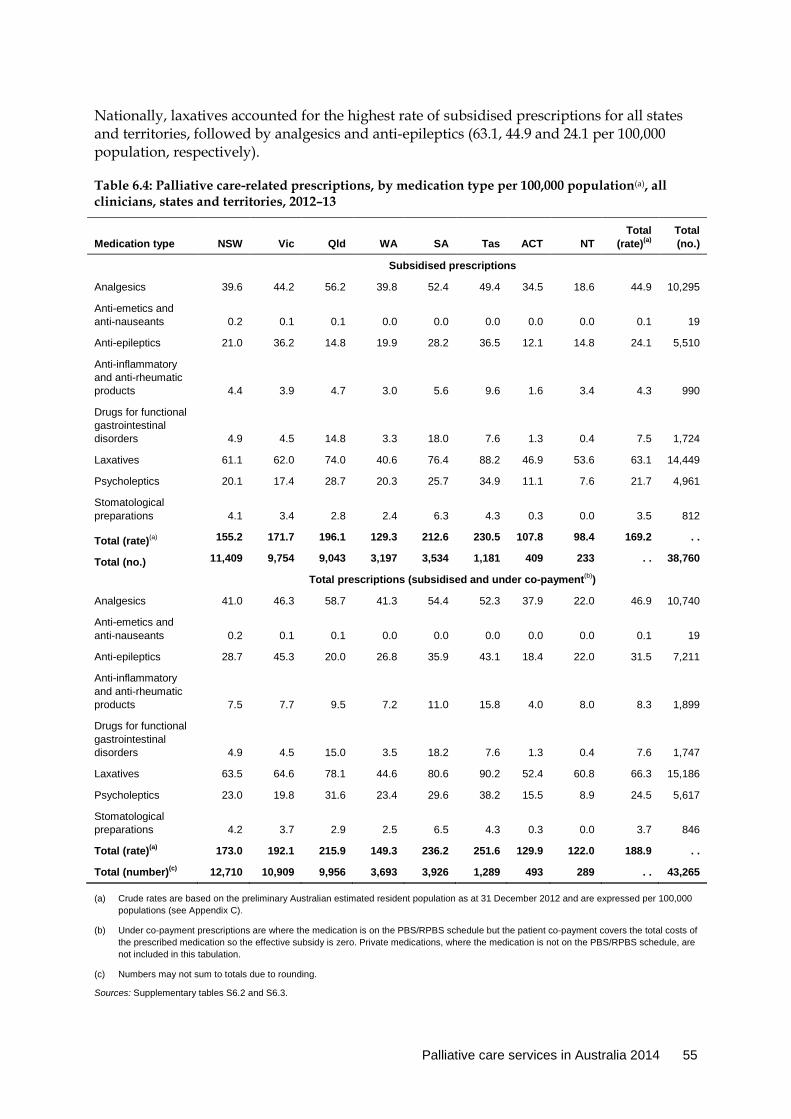
Palliative care services in Australia 2014 55
Nationally, laxatives accounted for the highest rate of subsidised prescriptions for all states and territories, followed by analgesics and anti-epileptics (63.1, 44.9 and 24.1 per 100,000 population, respectively).
Table 6.4: Palliative care-related prescriptions, by medication type per 100,000 population(a), all clinicians, states and territories, 2012–13
Medication type NSW Vic Qld WA SA Tas ACT NT Total
(rate)(a) Total (no.)
Subsidised prescriptions
Analgesics 39.6 44.2 56.2 39.8 52.4 49.4 34.5 18.6 44.9 10,295
Anti-emetics and anti-nauseants 0.2 0.1 0.1 0.0 0.0 0.0 0.0 0.0 0.1 19
Anti-epileptics 21.0 36.2 14.8 19.9 28.2 36.5 12.1 14.8 24.1 5,510
Anti-inflammatory and anti-rheumatic products 4.4 3.9 4.7 3.0 5.6 9.6 1.6 3.4 4.3 990
Drugs for functional gastrointestinal disorders 4.9 4.5 14.8 3.3 18.0 7.6 1.3 0.4 7.5 1,724
Laxatives 61.1 62.0 74.0 40.6 76.4 88.2 46.9 53.6 63.1 14,449
Psycholeptics 20.1 17.4 28.7 20.3 25.7 34.9 11.1 7.6 21.7 4,961
Stomatological preparations 4.1 3.4 2.8 2.4 6.3 4.3 0.3 0.0 3.5 812
Total (rate)(a) 155.2 171.7 196.1 129.3 212.6 230.5 107.8 98.4 169.2 . .
Total (no.) 11,409 9,754 9,043 3,197 3,534 1,181 409 233 . . 38,760
Total prescriptions (subsidised and under co-payment(b))
Analgesics 41.0 46.3 58.7 41.3 54.4 52.3 37.9 22.0 46.9 10,740
Anti-emetics and anti-nauseants 0.2 0.1 0.1 0.0 0.0 0.0 0.0 0.0 0.1 19
Anti-epileptics 28.7 45.3 20.0 26.8 35.9 43.1 18.4 22.0 31.5 7,211
Anti-inflammatory and anti-rheumatic products 7.5 7.7 9.5 7.2 11.0 15.8 4.0 8.0 8.3 1,899
Drugs for functional gastrointestinal disorders 4.9 4.5 15.0 3.5 18.2 7.6 1.3 0.4 7.6 1,747
Laxatives 63.5 64.6 78.1 44.6 80.6 90.2 52.4 60.8 66.3 15,186
Psycholeptics 23.0 19.8 31.6 23.4 29.6 38.2 15.5 8.9 24.5 5,617
Stomatological preparations 4.2 3.7 2.9 2.5 6.5 4.3 0.3 0.0 3.7 846
Total (rate)(a) 173.0 192.1 215.9 149.3 236.2 251.6 129.9 122.0 188.9 . .
Total (number)(c) 12,710 10,909 9,956 3,693 3,926 1,289 493 289 . . 43,265
(a) Crude rates are based on the preliminary Australian estimated resident population as at 31 December 2012 and are expressed per 100,000 populations (see Appendix C).
(b) Under co-payment prescriptions are where the medication is on the PBS/RPBS schedule but the patient co-payment covers the total costs of the prescribed medication so the effective subsidy is zero. Private medications, where the medication is not on the PBS/RPBS schedule, are not included in this tabulation.
(c) Numbers may not sum to totals due to rounding.
Sources: Supplementary tables S6.2 and S6.3.
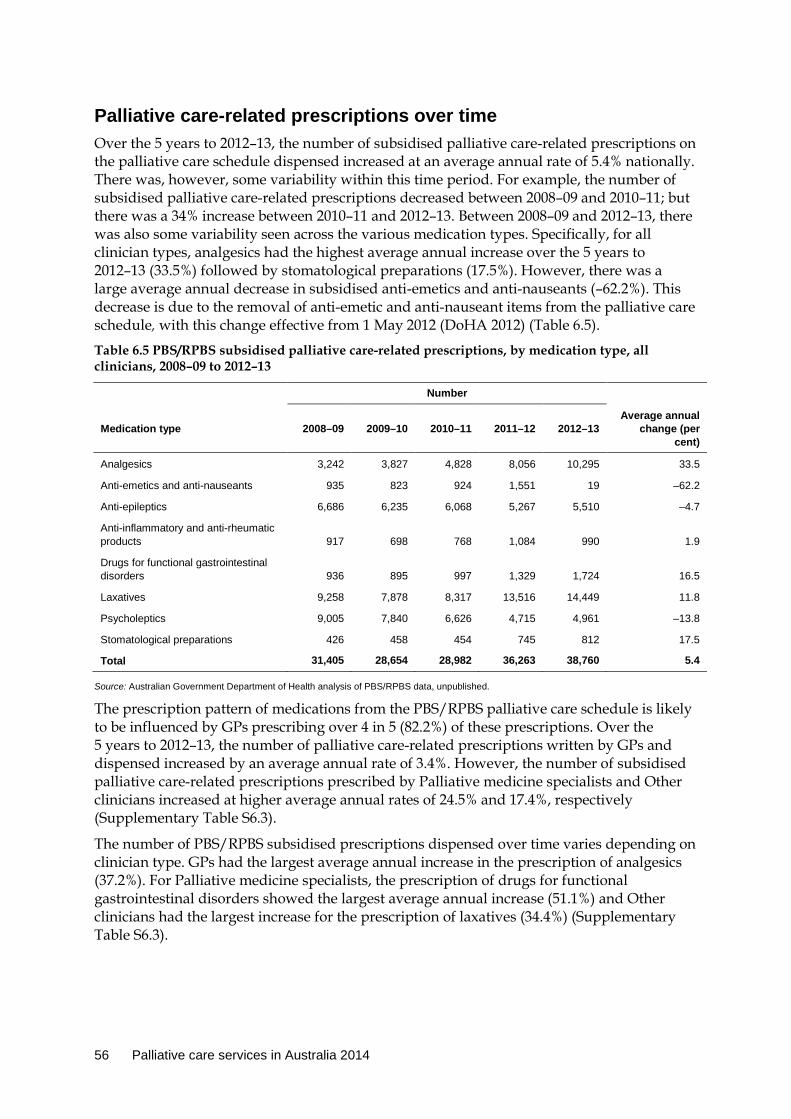
56 Palliative care services in Australia 2014
Palliative care-related prescriptions over time Over the 5 years to 2012–13, the number of subsidised palliative care-related prescriptions on the palliative care schedule dispensed increased at an average annual rate of 5.4% nationally. There was, however, some variability within this time period. For example, the number of subsidised palliative care-related prescriptions decreased between 2008–09 and 2010–11; but there was a 34% increase between 2010–11 and 2012–13. Between 2008–09 and 2012–13, there was also some variability seen across the various medication types. Specifically, for all clinician types, analgesics had the highest average annual increase over the 5 years to 2012–13 (33.5%) followed by stomatological preparations (17.5%). However, there was a large average annual decrease in subsidised anti-emetics and anti-nauseants (–62.2%). This decrease is due to the removal of anti-emetic and anti-nauseant items from the palliative care schedule, with this change effective from 1 May 2012 (DoHA 2012) (Table 6.5).
Table 6.5 PBS/RPBS subsidised palliative care-related prescriptions, by medication type, all clinicians, 2008–09 to 2012–13
Number
Medication type 2008–09 2009–10 2010–11 2011–12 2012–13 Average annual
change (per cent)
Analgesics 3,242 3,827 4,828 8,056 10,295 33.5
Anti-emetics and anti-nauseants 935 823 924 1,551 19 –62.2
Anti-epileptics 6,686 6,235 6,068 5,267 5,510 –4.7
Anti-inflammatory and anti-rheumatic products 917 698 768 1,084 990 1.9
Drugs for functional gastrointestinal disorders 936 895 997 1,329 1,724 16.5
Laxatives 9,258 7,878 8,317 13,516 14,449 11.8
Psycholeptics 9,005 7,840 6,626 4,715 4,961 –13.8
Stomatological preparations 426 458 454 745 812 17.5
Total 31,405 28,654 28,982 36,263 38,760 5.4
Source: Australian Government Department of Health analysis of PBS/RPBS data, unpublished.
The prescription pattern of medications from the PBS/RPBS palliative care schedule is likely to be influenced by GPs prescribing over 4 in 5 (82.2%) of these prescriptions. Over the 5 years to 2012–13, the number of palliative care-related prescriptions written by GPs and dispensed increased by an average annual rate of 3.4%. However, the number of subsidised palliative care-related prescriptions prescribed by Palliative medicine specialists and Other clinicians increased at higher average annual rates of 24.5% and 17.4%, respectively (Supplementary Table S6.3).
The number of PBS/RPBS subsidised prescriptions dispensed over time varies depending on clinician type. GPs had the largest average annual increase in the prescription of analgesics (37.2%). For Palliative medicine specialists, the prescription of drugs for functional gastrointestinal disorders showed the largest average annual increase (51.1%) and Other clinicians had the largest increase for the prescription of laxatives (34.4%) (Supplementary Table S6.3).

Palliative care services in Australia 2014 57
Palliative care schedule items for pain relief In 2012–13, almost all (95.9%) palliative care-related prescriptions for pain relief medications were PBS/RPBS subsidised (Supplementary Tables S6.2 and S6.3). An analysis of these prescriptions indicates that about 3 in 5 (60.6%) medications in this group were paracetamol, with the remainder being opioids (Table 6.6). Fewer than 1 in 10 subsidised prescriptions for opioids was a repeat script in 2012–13, compared with almost 2 in 5 for paracetamol (7.6% and 39.2%, respectively) (Table 6.6). Nationally, 44.9 per 100,000 population PBS/RPBS subsidised prescriptions for pain relief medications were included on the palliative care schedule in 2012–13, with opioids dispensed at a rate of 17.7 per 100,000 population and paracetamol at 27.3 per 100,000 population (Supplementary Table S6.5).
Table 6.6: PBS/RPBS subsidised palliative care-related prescriptions for pain relief, initial and repeat prescriptions, by medication group, 2012–13
Medication group Initial scripts Repeat scripts Total Per cent
Number
Opioids 3,746 307 4,053 39.4
Paracetamol 3,795 2,447 6,242 60.6
Total 7,541 2,754 10,295 100.0
Per cent
Opioids 92.4 7.6 100.0 . .
Paracetamol 60.8 39.2 100.0 . .
Total 73.2 26.8 100.0 . .
Source: Supplementary Table S6.4.
For subsidised palliative care schedule opioid prescriptions, rates ranged from 2.5 per 100,000 population for the Northern Territory to 25.8 for Western Australia. For paracetamol, the rates ranged from 14.1 per 100,000 population for Western Australia to 32.4 for Tasmania (Figure 6.2). Western Australia was the only state that had more opioids dispensed per 100,000 population than paracetamol.
Source: Supplementary Table S6.5.
Figure 6.2: PBS/RPBS subsidised palliative care-related prescriptions for pain relief per 100,000 population, states and territories, 2012–13
0
5
10
15
20
25
30
35
NSW Vic Qld WA SA Tas ACT NT
State or territory
Opioids Paracetamol
Rate (per 100,000 population)
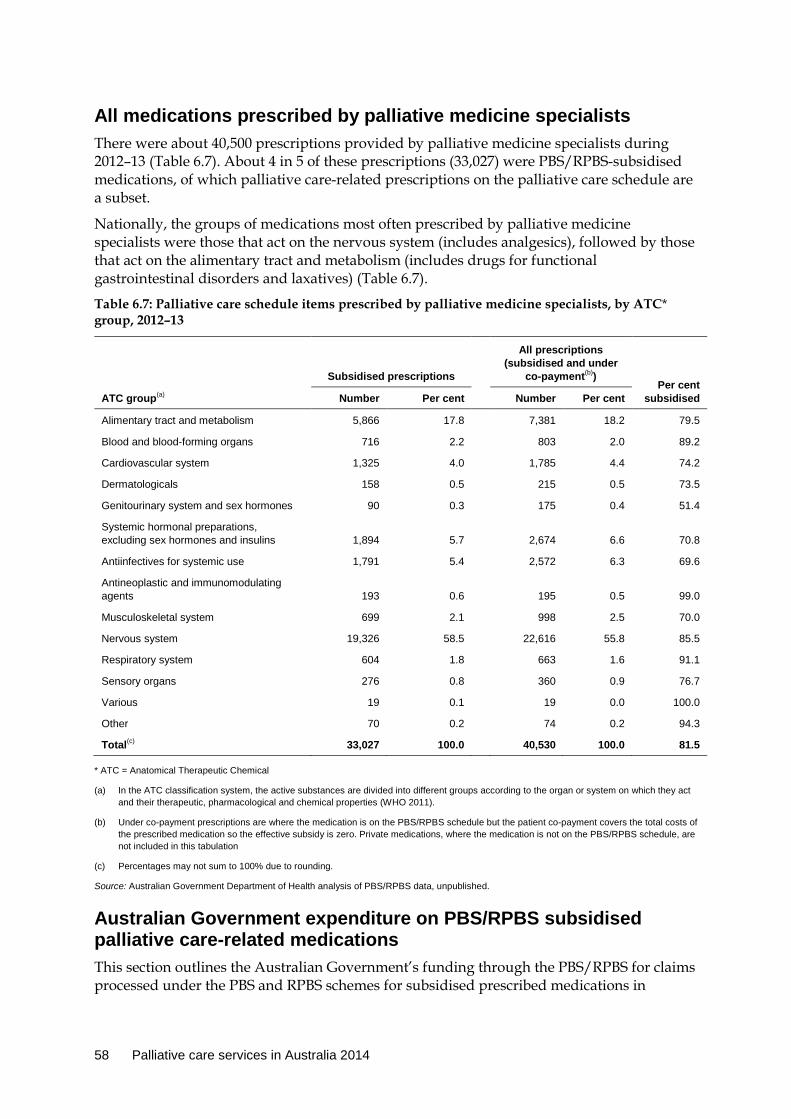
58 Palliative care services in Australia 2014
All medications prescribed by palliative medicine specialists There were about 40,500 prescriptions provided by palliative medicine specialists during 2012–13 (Table 6.7). About 4 in 5 of these prescriptions (33,027) were PBS/RPBS-subsidised medications, of which palliative care-related prescriptions on the palliative care schedule are a subset.
Nationally, the groups of medications most often prescribed by palliative medicine specialists were those that act on the nervous system (includes analgesics), followed by those that act on the alimentary tract and metabolism (includes drugs for functional gastrointestinal disorders and laxatives) (Table 6.7).
Table 6.7: Palliative care schedule items prescribed by palliative medicine specialists, by ATC* group, 2012–13
Subsidised prescriptions
All prescriptions (subsidised and under
co-payment(b)) Per cent
subsidised ATC group(a) Number Per cent Number Per cent
Alimentary tract and metabolism 5,866 17.8
7,381 18.2 79.5
Blood and blood-forming organs 716 2.2
803 2.0 89.2
Cardiovascular system 1,325 4.0
1,785 4.4 74.2
Dermatologicals 158 0.5
215 0.5 73.5
Genitourinary system and sex hormones 90 0.3
175 0.4 51.4
Systemic hormonal preparations, excluding sex hormones and insulins 1,894 5.7
2,674 6.6 70.8
Antiinfectives for systemic use 1,791 5.4
2,572 6.3 69.6
Antineoplastic and immunomodulating agents 193 0.6
195 0.5 99.0
Musculoskeletal system 699 2.1
998 2.5 70.0
Nervous system 19,326 58.5
22,616 55.8 85.5
Respiratory system 604 1.8
663 1.6 91.1
Sensory organs 276 0.8
360 0.9 76.7
Various 19 0.1
19 0.0 100.0
Other 70 0.2
74 0.2 94.3
Total(c) 33,027 100.0 40,530 100.0 81.5
* ATC = Anatomical Therapeutic Chemical
(a) In the ATC classification system, the active substances are divided into different groups according to the organ or system on which they act and their therapeutic, pharmacological and chemical properties (WHO 2011).
(b) Under co-payment prescriptions are where the medication is on the PBS/RPBS schedule but the patient co-payment covers the total costs of the prescribed medication so the effective subsidy is zero. Private medications, where the medication is not on the PBS/RPBS schedule, are not included in this tabulation
(c) Percentages may not sum to 100% due to rounding.
Source: Australian Government Department of Health analysis of PBS/RPBS data, unpublished.
Australian Government expenditure on PBS/RPBS subsidised palliative care-related medications This section outlines the Australian Government’s funding through the PBS/RPBS for claims processed under the PBS and RPBS schemes for subsidised prescribed medications in
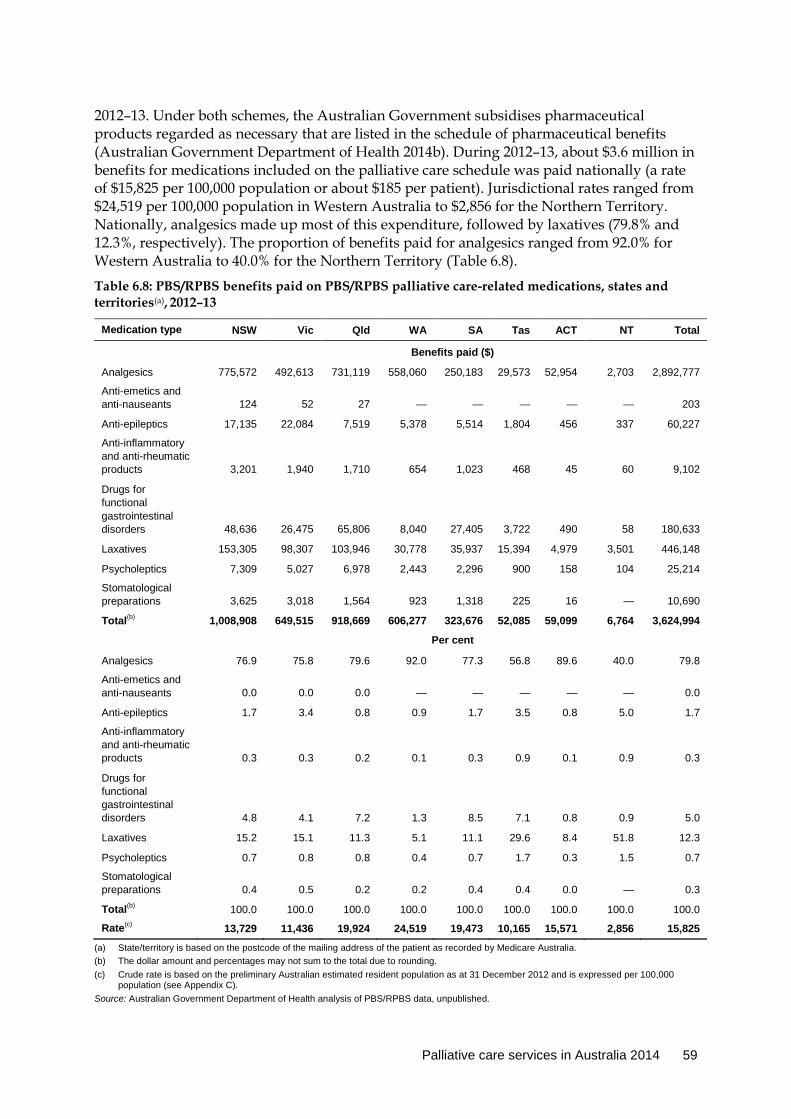
Palliative care services in Australia 2014 59
2012–13. Under both schemes, the Australian Government subsidises pharmaceutical products regarded as necessary that are listed in the schedule of pharmaceutical benefits (Australian Government Department of Health 2014b). During 2012–13, about $3.6 million in benefits for medications included on the palliative care schedule was paid nationally (a rate of $15,825 per 100,000 population or about $185 per patient). Jurisdictional rates ranged from $24,519 per 100,000 population in Western Australia to $2,856 for the Northern Territory. Nationally, analgesics made up most of this expenditure, followed by laxatives (79.8% and 12.3%, respectively). The proportion of benefits paid for analgesics ranged from 92.0% for Western Australia to 40.0% for the Northern Territory (Table 6.8).
Table 6.8: PBS/RPBS benefits paid on PBS/RPBS palliative care-related medications, states and territories(a), 2012–13
Medication type NSW Vic Qld WA SA Tas ACT NT Total
Benefits paid ($)
Analgesics 775,572 492,613 731,119 558,060 250,183 29,573 52,954 2,703 2,892,777
Anti-emetics and anti-nauseants 124 52 27 — — — — — 203
Anti-epileptics 17,135 22,084 7,519 5,378 5,514 1,804 456 337 60,227
Anti-inflammatory and anti-rheumatic products 3,201 1,940 1,710 654 1,023 468 45 60 9,102
Drugs for functional gastrointestinal disorders 48,636 26,475 65,806 8,040 27,405 3,722 490 58 180,633
Laxatives 153,305 98,307 103,946 30,778 35,937 15,394 4,979 3,501 446,148
Psycholeptics 7,309 5,027 6,978 2,443 2,296 900 158 104 25,214
Stomatological preparations 3,625 3,018 1,564 923 1,318 225 16 — 10,690
Total(b) 1,008,908 649,515 918,669 606,277 323,676 52,085 59,099 6,764 3,624,994
Per cent
Analgesics 76.9 75.8 79.6 92.0 77.3 56.8 89.6 40.0 79.8
Anti-emetics and anti-nauseants 0.0 0.0 0.0 — — — — — 0.0
Anti-epileptics 1.7 3.4 0.8 0.9 1.7 3.5 0.8 5.0 1.7
Anti-inflammatory and anti-rheumatic products 0.3 0.3 0.2 0.1 0.3 0.9 0.1 0.9 0.3
Drugs for functional gastrointestinal disorders 4.8 4.1 7.2 1.3 8.5 7.1 0.8 0.9 5.0
Laxatives 15.2 15.1 11.3 5.1 11.1 29.6 8.4 51.8 12.3
Psycholeptics 0.7 0.8 0.8 0.4 0.7 1.7 0.3 1.5 0.7
Stomatological preparations 0.4 0.5 0.2 0.2 0.4 0.4 0.0 — 0.3
Total(b) 100.0 100.0 100.0 100.0 100.0 100.0 100.0 100.0 100.0
Rate(c) 13,729 11,436 19,924 24,519 19,473 10,165 15,571 2,856 15,825
(a) State/territory is based on the postcode of the mailing address of the patient as recorded by Medicare Australia. (b) The dollar amount and percentages may not sum to the total due to rounding. (c) Crude rate is based on the preliminary Australian estimated resident population as at 31 December 2012 and is expressed per 100,000
population (see Appendix C). Source: Australian Government Department of Health analysis of PBS/RPBS data, unpublished.

60 Palliative care services in Australia 2014
Expenditure on PBS/RPBS-subsidised palliative care-related medications over time Over the 5 years from 2008–09 to 2012–13, the benefits paid for palliative care schedule items increased by an annual average of 21.6%. There was variability between medication types, with annual average changes ranging from a 64.6% decrease for anti-emetics and anti-nauseants to a 26.7% increase for analgesics (Table 6.9).
Over the 5 years to 2012–13, the relative proportion that each medication type made to the total amount of benefits paid varied. Analgesics increased from 67.7% to 79.8% over the 5 years, whereas laxatives and anti-epileptics decreased from about 17.0% and 5.7% to 12.3% and 1.7%, respectively (Table 6.9).
Table 6.9: PBS/RPBS benefits paid(a) on palliative care schedule items, 2008–09 to 2012–13
Medication type 2008–09 2009–10 2010–11 2011–12 2012–13
Average annual
change (per cent)
Benefits paid ($)
Analgesics 1,121,677 1,571,594 1,987,303 2,344,567 2,892,777 26.7
Anti-emetics and anti-nauseants 12,943 11,693 13,069 20,903 203 –64.6
Anti-epileptics 95,018 81,027 74,439 57,726 60,227 –10.8
Anti-inflammatory and anti-rheumatic products 16,070 13,547 15,867 21,469 9,102 –13.2
Drugs for functional gastrointestinal disorders 72,132 75,276 105,264 146,953 180,633 25.8
Laxatives 282,494 256,250 295,135 429,428 446,148 12.1
Psycholeptics 50,696 43,956 37,065 24,475 25,214 –16.0
Stomatological preparations 6,158 7,689 6,322 10,605 10,690 14.8
Total(b) 1,657,187 2,061,032 2,534,463 3,056,126 3,624,994 21.6
Per cent
Analgesics 67.7 76.3 78.4 76.7 79.8 . .
Anti-emetics and anti-nauseants 0.8 0.6 0.5 0.7 0.0 . .
Anti-epileptics 5.7 3.9 2.9 1.9 1.7 . .
Anti-inflammatory and anti-rheumatic products 1.0 0.7 0.6 0.7 0.3 . .
Drugs for functional gastrointestinal disorders 4.4 3.7 4.2 4.8 5.0 . .
Laxatives 17.0 12.4 11.6 14.1 12.3 . .
Psycholeptics 3.1 2.1 1.5 0.8 0.7 . .
Stomatological preparations 0.4 0.4 0.2 0.3 0.3 . .
Total(b) 100.0 100.0 100.0 100.0 100.0 . .
(a) All figures are in Australian dollars in current prices (that is, unadjusted for inflation).
(b) The dollar amount and percentages may not sum to the total due to rounding.
Source: Australian Government Department of Health analysis of PBS/RPBS data, unpublished.

Palliative care services in Australia 2014 61
All medications prescribed by palliative medicine specialists The information presented in this section relates to all PBS/RPBS-subsidised prescriptions prescribed by palliative medicine specialists during 2012–13. This number includes all medications prescribed, of which palliative care-related prescriptions on the palliative care schedule are a subset.
Almost 71% of the benefits were paid for medications that act on the nervous system (includes analgesics). This was followed by those that act on the alimentary tract and metabolism (includes drugs for functional gastrointestinal disorders and laxatives), which constitutes about 10% of the total benefits paid by ATC group (Table 6.10).
Table 6.10: PBS/RPBS benefits paid(a) for prescriptions made by palliative medicine specialists, by ATC group, 2012–13
ATC group(b) Benefits paid ($) Per cent
Alimentary tract and metabolism 149,020 9.6
Blood and blood-forming organs 58,201 3.8
Cardiovascular system 21,712 1.4
Dermatologicals 1,892 0.1
Genito urinary system and sex hormones 2,410 0.2
Systemic hormonal preparations, excl. sex hormones and insulins 20,941 1.4
Anti-infectives for systemic use 47,100 3.0
Antineoplastic and immunomodulating agents 70,875 4.6
Musculo-skeletal system 48,188 3.1
Nervous system 1,094,820 70.8
Respiratory system 22,376 1.4
Sensory organs 3,462 0.2
Various 952 0.1
Other 4,362 0.3
Total(c) 1,546,354 100.0
(a) All figures are in Australian dollars in current prices (that is, unadjusted for inflation).
(b) In the ATC classification system, the active substances are divided into different groups according to the organ or system on which they act and their therapeutic, pharmacological and chemical properties (WHO 2011).
(c) The dollar amount may not sum to the total due to rounding.
Source: Australian Government Department of Health analysis of PBS/RPBS data, unpublished.
62 Palliative care services in Australia 2014
7 Workforce
7.1 Introduction The palliative care workforce is made up of a number of health professional groups including specialist palliative medicine physicians, nurses, GPs , pharmacists, other medical specialists (such as oncologists and geriatricians), as well as other health workers, support staff and volunteers.
Medical specialists employed (see Key concepts) in palliative care complete post-graduate specialist training to become specialist palliative medicine physicians. Specialist palliative medicine physicians are required to have completed advanced training in palliative medicine through the Royal Australasian College of Physicians or the Australasian Chapter of Palliative Medicine, and be admitted as Fellows of one or both of these professional bodies (CareSearch 2012). Many of these physicians have previously completed training as either a GP or other medical specialty.
The information presented in this chapter describes the number and characteristics of the workforce of specialist palliative medicine specialists. The annual AIHW Labour Force Surveys for medical practitioners and nurses and midwives were replaced from July 2010 onwards by the National Health Workforce Data Set (NHWDS), from data collected under the National Registration and Accreditation Scheme for health professionals.
Data for palliative care nurses were not collected as part of the 2012 survey but will be available from the 2013 survey onwards. It is expected that NHWDS information on palliative care nurses will be published in the 2015 edition of this report. The most recent published figures for palliative care nurses for 2009 are available in the report Palliative care services in Australia 2012 (AIHW 2012c). Estimates of the medical workforce before 2010 were derived from the responses to the AIHW Medical Labour Force Survey. Further details on these data sources are outlined at Appendix B.
Key concepts Employed health professional is defined in this report as one who: • reported (the week before the survey) work practising medicine in Australia (including
practitioners on leave for less than 3 months), or • was involved with work that is principally concerned with the discipline of medicine
(including medical research, administration, or teaching of medicine). This includes those involved in clinical and non-clinical roles—for example, education, research and administration. ‘Employed’ people are referred to as the ‘workforce’ in this chapter. This includes only practitioners whose main speciality is palliative care and excludes those medical practitioners practising palliative care as a second or third speciality and those who were on extended leave for more than 3 months or who were not employed.
(continued)

Palliative care services in Australia 2014 63
Full-time equivalent (FTE) represents the number of 38-hour-week workloads worked by professionals. The FTE is calculated by multiplying the number of employed professionals in a specific category by the average total hours worked by employed people in that category, and dividing by 38. The figures for FTE per 100,000 population provide a standardised measure of supply of professionals. The standard of a 38-hour working week was used in this report to provide figures comparable with previously published data. Total hours are the total hours worked per week in the profession, including paid and unpaid work. Average total weekly hours are calculated only for those people who reported their hours (that is, those who did not report them are excluded).
7.2 Specialist palliative medicine physicians The information on specialist palliative medicine physicians provides estimates derived from the AIHW Medical Labour Force Surveys 2008 and 2009 and the NHWDS for 2010 to 2012 (see Box 7.1). These surveys collected information on the demographic and employment characteristics of practitioners who were registered in Australia at the time of the survey.
Box 7.1: Medical Workforce Survey 2012 In 2010, the National Registration and Accreditation System for health professionals was introduced and the AIHW Medical Labour Force Survey was replaced with the Medical Workforce Survey. The overall response rate to the Medical Workforce Survey 2012 was 90.1%, which was higher than for any previous AIHW Medical Labour Force Survey. Victoria, New South Wales and the Australian Capital Territory had the highest response rates at 91.4%, 91.3% and 90.5%, respectively. Western Australia had the lowest response rate at 84.7%. To meaningfully compare the supply of specialist palliative medicine physicians across Australia over time, FTE figures are provided in addition to the number of specialist palliative medicine physicians and the average total hours worked. The FTE measures the number of 38-hour-weeks worked by specialist palliative medicine physicians, regardless of how many worked full time or part time. Population standardised FTE figures (FTE per 100,000 population) are also reported, as these take into account differences in the size of the relevant populations between regions and over time. The AIHW labour force surveys and current NHWDS workforce surveys have different collection and estimation methodologies, questionnaire designs and response rates. As a result, care should be taken in comparing historical data from the AIHW labour force surveys and data from the NHWDS.
Characteristics of specialist palliative medicine physicians Specialist palliative medicine physicians made up around 5 in every 1,000 (0.53%) employed medical specialists in Australia, with an estimated 148 working in Australia in 2012 (Table 7.1). Training in palliative medicine occurs through the Australasian Chapter of Palliative Medicine of the Royal Australasian College of Physicians. In 2012, 49 medical practitioners undertook Advanced Training in Palliative Medicine, while 24 undertook a Clinical Diploma in Palliative Medicine as part of their vocational training or continuing professional development (DoHA 2013).

64 Palliative care services in Australia 2014
In 2012, more than half (56.5%) of employed specialist palliative medicine physicians were female. This was more than double the proportion of all employed female medical practitioners who practise under other types of clinician specialities (26.8%) (AIHW 2014a). The average age of specialist palliative medicine physicians was 52, with female physicians being younger, on average, than their male counterparts (Table 7.1).
Specialist palliative medicine physicians worked an average of 39.5 total hours per week in 2012 (Table 7.2), which was less than the average hours worked per week by all employed medical practitioners who were specialists (43.8) (AIHW 2014a). The hours worked per week were, on average, lower for females than males (36.7 hours and 43.1 hours, respectively) (Table 7.2).
Table 7.1: Employed specialist palliative medicine physicians, demographic characteristics, 2008–2012(a)
Demographic characteristic 2008 2009 2010(b) 2011 2012(c) 2012
(per cent)
Sex (number)
Males 69 74 28 40 64 43.5
Females 73 79 31 52 83 56.5
Age group (years) and sex
Males
<35 n.p. 5 n.p. — — —
35–44 11 18 n.p. 5 14 9.4
45–54 26 15 7 9 14 9.4
55–64 23 29 11 20 28 18.8
65+ n.p. 8 6 6 9 6.0
Females
<35 — — n.p. n.p. 4 2.7
35–44 28 29 10 18 27 18.1
45–54 18 25 13 17 27 18.1
55–64 18 19 n.p. 13 21 14.1
65+ 8 6 n.p. n.p. 5 3.4
Total(d) 142 153 59 92 148 100.0
Average age (years)
Males 52.5 51.9 55.8 56.1 55.0 . .
Females 50.2 50.2 48.3 47.6 49.1 . .
All 51.3 51.0 51.9 51.3 51.7 . .
All employed medical practitioners (number) 68,455 72,739 53,646 78,833 79,653 . .
(a) For 2008 and 2009, labour force survey data contained 54 categories for specialty. The 2010 to 2012 NHWDS data contain 23 categories for specialty. Data may not be comparable across years.
(b) Excludes Queensland and Western Australia. (c) There was a change in the methodology for estimating the main specialty of practice for medical practitioners with multiple specialties in
2012. This may have resulted in an increase in the number of medical practitioners identifying as palliative care practitioners in 2012 compared with the previous year
(d) Numbers and percentages may not sum to the total due to the estimation process and/or rounding.
Sources: AIHW Medical Labour Force Surveys 2008, 2009; NHWDS: medical practitioners 2010 to 2012.
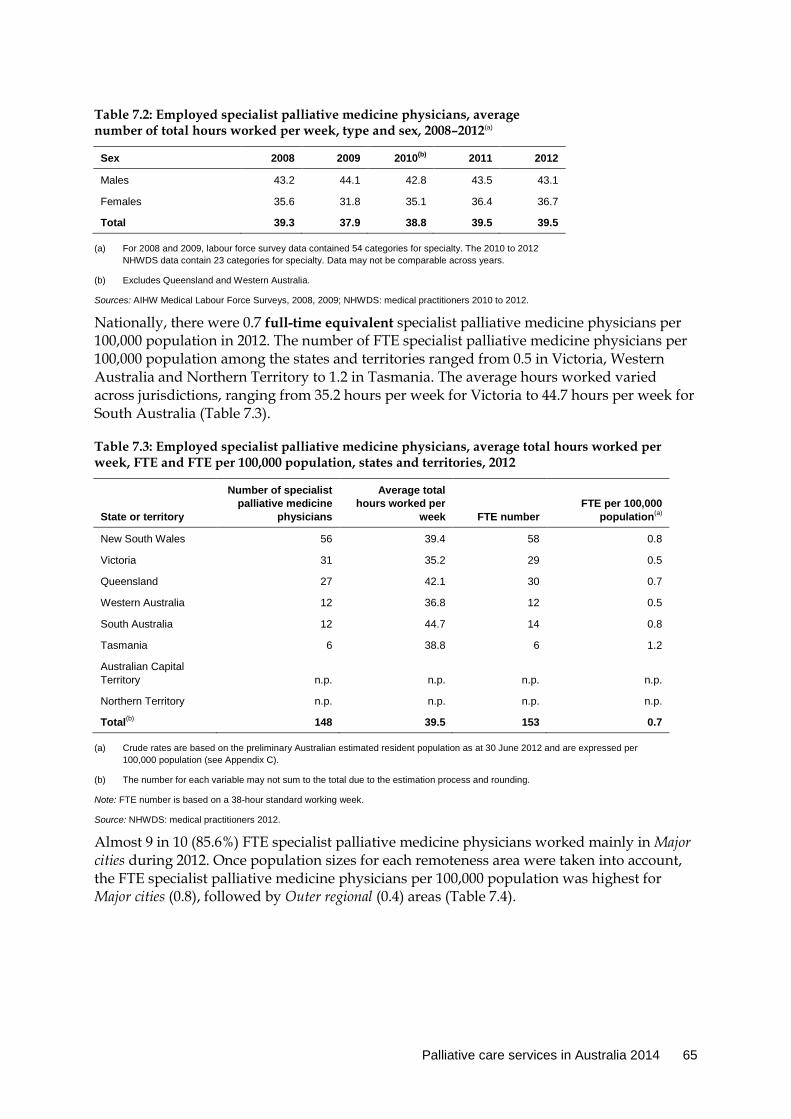
Palliative care services in Australia 2014 65
Table 7.2: Employed specialist palliative medicine physicians, average number of total hours worked per week, type and sex, 2008–2012(a)
Sex 2008 2009 2010(b) 2011 2012
Males 43.2 44.1 42.8 43.5 43.1
Females 35.6 31.8 35.1 36.4 36.7
Total 39.3 37.9 38.8 39.5 39.5
(a) For 2008 and 2009, labour force survey data contained 54 categories for specialty. The 2010 to 2012 NHWDS data contain 23 categories for specialty. Data may not be comparable across years.
(b) Excludes Queensland and Western Australia.
Sources: AIHW Medical Labour Force Surveys, 2008, 2009; NHWDS: medical practitioners 2010 to 2012.
Nationally, there were 0.7 full-time equivalent specialist palliative medicine physicians per 100,000 population in 2012. The number of FTE specialist palliative medicine physicians per 100,000 population among the states and territories ranged from 0.5 in Victoria, Western Australia and Northern Territory to 1.2 in Tasmania. The average hours worked varied across jurisdictions, ranging from 35.2 hours per week for Victoria to 44.7 hours per week for South Australia (Table 7.3).
Table 7.3: Employed specialist palliative medicine physicians, average total hours worked per week, FTE and FTE per 100,000 population, states and territories, 2012
State or territory
Number of specialist palliative medicine
physicians
Average total hours worked per
week FTE number FTE per 100,000
population(a)
New South Wales 56 39.4 58 0.8
Victoria 31 35.2 29 0.5
Queensland 27 42.1 30 0.7
Western Australia 12 36.8 12 0.5
South Australia 12 44.7 14 0.8
Tasmania 6 38.8 6 1.2
Australian Capital Territory n.p. n.p. n.p. n.p.
Northern Territory n.p. n.p. n.p. n.p.
Total(b) 148 39.5 153 0.7
(a) Crude rates are based on the preliminary Australian estimated resident population as at 30 June 2012 and are expressed per 100,000 population (see Appendix C).
(b) The number for each variable may not sum to the total due to the estimation process and rounding.
Note: FTE number is based on a 38-hour standard working week.
Source: NHWDS: medical practitioners 2012.
Almost 9 in 10 (85.6%) FTE specialist palliative medicine physicians worked mainly in Major cities during 2012. Once population sizes for each remoteness area were taken into account, the FTE specialist palliative medicine physicians per 100,000 population was highest for Major cities (0.8), followed by Outer regional (0.4) areas (Table 7.4).

66 Palliative care services in Australia 2014
Table 7.4: Employed specialist palliative medicine physicians by remoteness area, average total hours worked per week, 2012
Remoteness area of main job(a) Number Average total hours
worked per week FTE number FTE per 100,000
population(b)
Major cities 127 39.2 131 0.8
Inner regional 17 40.5 18 0.4
Outer regional n.p. n.p. n.p. n.p.
Remote and very remote n.p. n.p. n.p. n.p.
Total(c) 148 39.5 153 0.7
(a) Remoteness area is derived from the postcode of the respondent’s location of main job. These data should be treated with caution due to the large number of ‘Not reported’ values for remoteness area, relative to the number of values reported in Outer regional and Remote and very remote regions.
(b) Crude rates are based on the preliminary Australian estimated resident population as at 30 June 2012 and are expressed per 100,000 population (see Appendix C).
(c) The number for each variable may not sum to the total due to the estimation process and rounding.
Note: FTE number is based on a 38-hour standard working week. Source: NHWDS: medical practitioners 2012.
Palliative care services in Australia 2014 67
8 Palliative care outcomes
8.1 Introduction The Palliative Care Outcomes Collaboration (PCOC) was established in mid-2005 and is funded by the Australian Government. The PCOC’s goal is to use standardised, validated clinical assessment tools to benchmark and measure patient outcomes in palliative care and to assist palliative care service providers to improve practice and to meet the Palliative Care Australia (PCA) Standards for Providing Quality Palliative Care.
8.2 Palliative Care Outcomes data set Data using Version 1 of the PCOC data set were collected between January 2006 and January 2007. Version 2 of the data set was enacted from July 2007, and Version 3 has been progressively acted on since July 2012 (PCOC 2012). The items included in the PCOC data set serve the purposes of:
• providing clinicians with an approach to systematically assess individual patient experiences
• defining a common clinical language to allow palliative care providers to communicate • facilitating the routine collection of nationally consistent palliative care data for the
purpose of reporting and benchmarking to drive quality improvement.
What data are reported? There were 31,512 patients accessing palliative care services in 2013, an increase of 3.6% from 2012 (30,405). There were 106 palliative care service providers that reported to the PCOC in 2013.
The information presented in this chapter refers to palliative care service data reported to the PCOC for the 1 January to 31 December 2013 period. The three levels of PCOC data items are presented here: patient level, episode level and phase level care data (see the ‘Key concepts’ box below for an explanation of bold terms in the first two sections of this chapter).
The information provided on total number of days for episodes of care is categorised by two broad types of care—inpatient and ambulatory/community care. Inpatient episodes of care are those for which the intent of the admission was for the patient to be in hospital overnight. This includes those patients who were admitted and died on the day of their admission. Ambulatory/community patients refer to those patients who received palliative care either in their home, a residential aged care facility, an outpatient clinic or day only. It should be noted that the number of patients reported to the PCOC refers to patients who may receive services both within the inpatient and ambulatory/community settings. Hence, as these two categories are not mutually exclusive, the same patient can have an inpatient episode and then subsequent ambulatory/community episodes and may be counted for both service settings.

68 Palliative care services in Australia 2014
Key concepts Patient level data relate to patient demographics. Episode level data items provide information on the following: the reasons why and how a palliative care episode starts/ends; the level of support a palliative care patient received, both before and after an episode; and (where applicable) the setting in which the patient died. Phase level data items describe a palliative care patient’s stage of illness, functional impairment and their levels of pain and symptom distress. Five assessment tools are used to describe the clinical condition of a patient, which, in turn, contribute to a patient’s care plan. These assessment tools are phase of care, palliative care problem, severity, Australia-modified Karnofsky, and Resource Utilisation Groups—Activities of Daily Living (RUG—ADL) which provide measures of quality and outcomes of care. The PCOC analyses each service’s data and compares these with the national average. The items at the phase level are used to quantify patient outcomes and are the focus of the PCOC benchmarks. An episode of care is a period of contact between a patient and a service where palliative care is provided in one setting. An episode starts the date a comprehensive palliative care assessment is undertaken and documented using the five PCOC assessment tools. In the community/ambulatory setting, it is the date of first visit or first appointment. In the inpatient setting, it is the date of admission or first consultation. An episode ends when the patient’s setting of care changes (for example, inpatient to community) or when a patient dies.
8.3 Patient characteristics
Age and sex In 2013, there were 41,850 episodes of care reported to the PCOC, of which more than half (54.1%; 22,642) were inpatient episodes. The provision of palliative care by age group for 2013 is shown in Figure 8.1. People aged 65 to 84 accounted for over half of all episodes (52.9%); those aged 45 to 64 accounted for almost 1 in 4 episodes (23.5%) and those aged 85 and over, 1 in 5 (19.7%). People aged 25 to 44 accounted for fewer than 1 in 20 episodes (3.4%), while those aged 24 or younger made up fewer than 1 in 100 (0.4%).
The average age for all patients reported to the PCOC during this period was 71.9, with a median age of 74.0 for all services. There were 22,486 male palliative care patients in 2013, accounting for 53.7% of episodes and 19,359 female patients (46.3% of episodes).
The age and sex characteristics of patients in the 2013 PCOC data are essentially unchanged from the 2012 results.
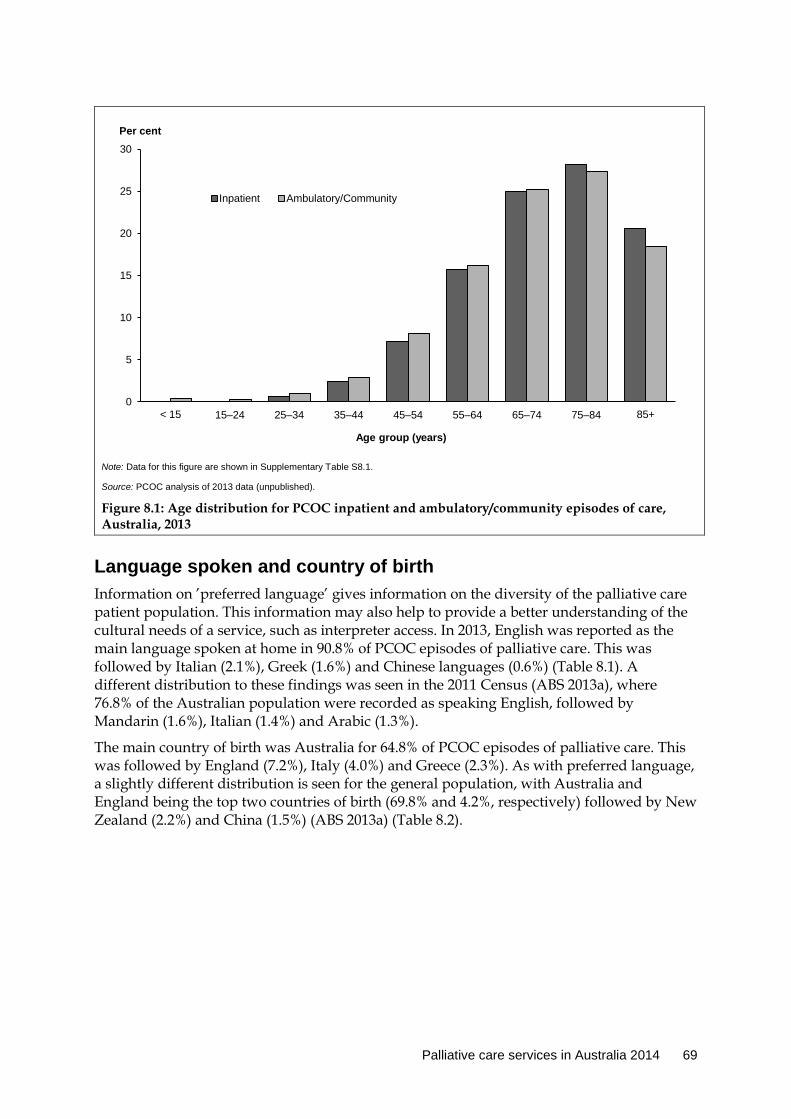
Palliative care services in Australia 2014 69
Note: Data for this figure are shown in Supplementary Table S8.1.
Source: PCOC analysis of 2013 data (unpublished).
Figure 8.1: Age distribution for PCOC inpatient and ambulatory/community episodes of care, Australia, 2013
Language spoken and country of birth Information on ’preferred language’ gives information on the diversity of the palliative care patient population. This information may also help to provide a better understanding of the cultural needs of a service, such as interpreter access. In 2013, English was reported as the main language spoken at home in 90.8% of PCOC episodes of palliative care. This was followed by Italian (2.1%), Greek (1.6%) and Chinese languages (0.6%) (Table 8.1). A different distribution to these findings was seen in the 2011 Census (ABS 2013a), where 76.8% of the Australian population were recorded as speaking English, followed by Mandarin (1.6%), Italian (1.4%) and Arabic (1.3%).
The main country of birth was Australia for 64.8% of PCOC episodes of palliative care. This was followed by England (7.2%), Italy (4.0%) and Greece (2.3%). As with preferred language, a slightly different distribution is seen for the general population, with Australia and England being the top two countries of birth (69.8% and 4.2%, respectively) followed by New Zealand (2.2%) and China (1.5%) (ABS 2013a) (Table 8.2).
0
5
10
15
20
25
30
< 15 15–24 25–34 35–44 45–54 55–64 65–74 75–84 85+
Per cent
Age group (years)
Inpatient Ambulatory/Community
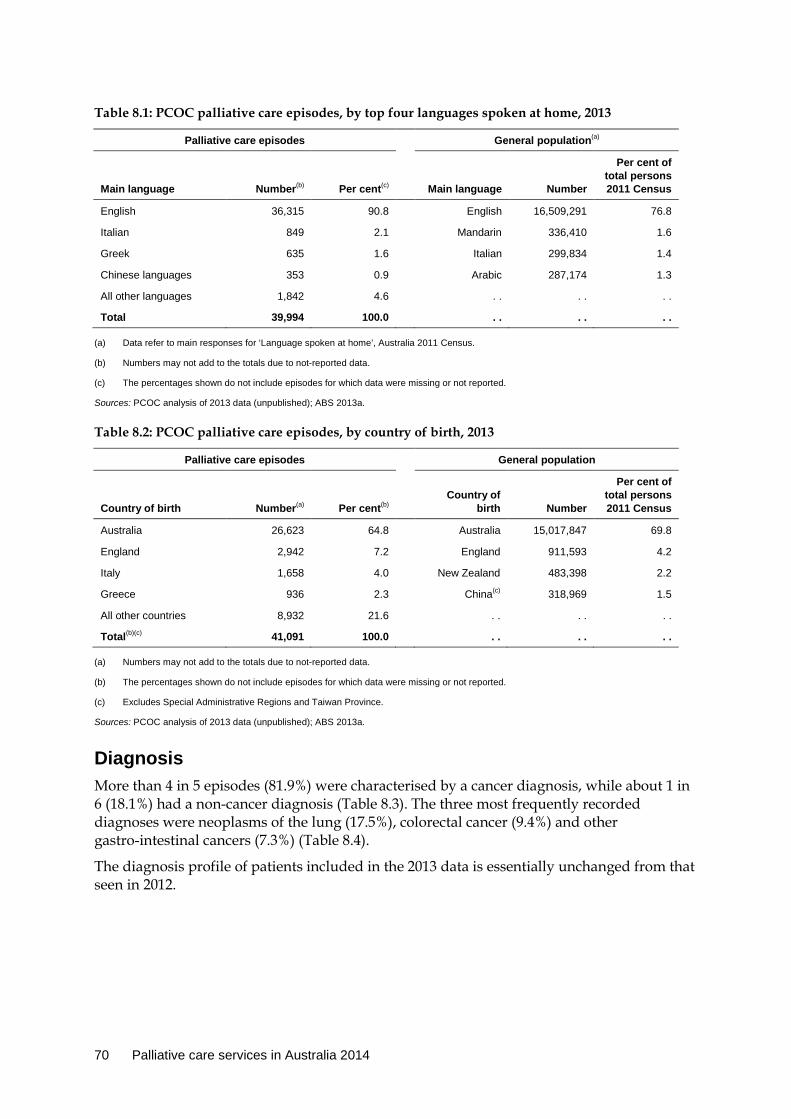
70 Palliative care services in Australia 2014
Table 8.1: PCOC palliative care episodes, by top four languages spoken at home, 2013
Palliative care episodes General population(a)
Main language Number(b) Per cent(c)
Main language Number
Per cent of total persons 2011 Census
English 36,315 90.8 English 16,509,291 76.8
Italian 849 2.1 Mandarin 336,410 1.6
Greek 635 1.6 Italian 299,834 1.4
Chinese languages 353 0.9 Arabic 287,174 1.3
All other languages 1,842 4.6 . . . . . .
Total 39,994 100.0 . . . . . .
(a) Data refer to main responses for ‘Language spoken at home’, Australia 2011 Census.
(b) Numbers may not add to the totals due to not-reported data.
(c) The percentages shown do not include episodes for which data were missing or not reported.
Sources: PCOC analysis of 2013 data (unpublished); ABS 2013a.
Table 8.2: PCOC palliative care episodes, by country of birth, 2013
Palliative care episodes General population
Country of birth Number(a) Per cent(b)
Country of
birth Number
Per cent of total persons 2011 Census
Australia 26,623 64.8 Australia 15,017,847 69.8
England 2,942 7.2 England 911,593 4.2
Italy 1,658 4.0 New Zealand 483,398 2.2
Greece 936 2.3 China(c) 318,969 1.5
All other countries 8,932 21.6 . . . . . .
Total(b)(c) 41,091 100.0 . . . . . .
(a) Numbers may not add to the totals due to not-reported data.
(b) The percentages shown do not include episodes for which data were missing or not reported.
(c) Excludes Special Administrative Regions and Taiwan Province.
Sources: PCOC analysis of 2013 data (unpublished); ABS 2013a.
Diagnosis More than 4 in 5 episodes (81.9%) were characterised by a cancer diagnosis, while about 1 in 6 (18.1%) had a non-cancer diagnosis (Table 8.3). The three most frequently recorded diagnoses were neoplasms of the lung (17.5%), colorectal cancer (9.4%) and other gastro-intestinal cancers (7.3%) (Table 8.4).
The diagnosis profile of patients included in the 2013 data is essentially unchanged from that seen in 2012.

Palliative care services in Australia 2014 71
Table 8.3: PCOC palliative care episodes, cancer and non-cancer diagnosis, 2013
Diagnosis Number(a) Per cent(b)
Cancer 34,025 81.9
Non-cancer 7,527 18.1
Total 41,552 100.0
(a) Numbers may not add to the total due to not-reported data.
(b) The percentages shown do not include episodes for which data were missing and/or not reported.
Source: PCOC analysis of 2013 data (unpublished).
Table 8.4: PCOC palliative care episodes, three most frequently recorded cancer diagnoses, 2013
Diagnosis Number(a) Per cent(b)
Neoplasm of the lung 7,277 21.4
Colorectal cancer 3,888 11.4
Other gastro-intestinal cancer 3,039 8.9
Total cancer 34,025 . .
(a) Numbers may not add to the total due to not reported data.
(b) The percentage shown was calculated using total number of episodes where diagnosis was reported as the denominator.
Source: PCOC analysis of 2013 data (unpublished).
Socioeconomic status This section presents information on PCOC episodes based on the socioeconomic status of the usual residence of the patient. Socioeconomic status is generally associated with access to material resources, educational opportunities and health status (AIHW 2010b).
This section uses the ABS’s Index of Relative Socio-Economic Advantage and Disadvantage (IRSAD). This index is one of a series of similar measures that allow for socioeconomic differences by geographic areas to be described (ABS 2012).
From January to December 2013, people living in areas classified as having the lowest socioeconomic status (group ‘1’) accounted for around 1 in 7 PCOC episodes (13.9%) (Table 8.5). The highest proportion of episodes, almost one-third, was seen for those patients living in the highest socioeconomic status area (group ‘5’) (31.3%), with this group proportionally over-represented in both the inpatient and ambulatory/community settings. Overall, there was little difference in proportions between inpatient and ambulatory/community settings.
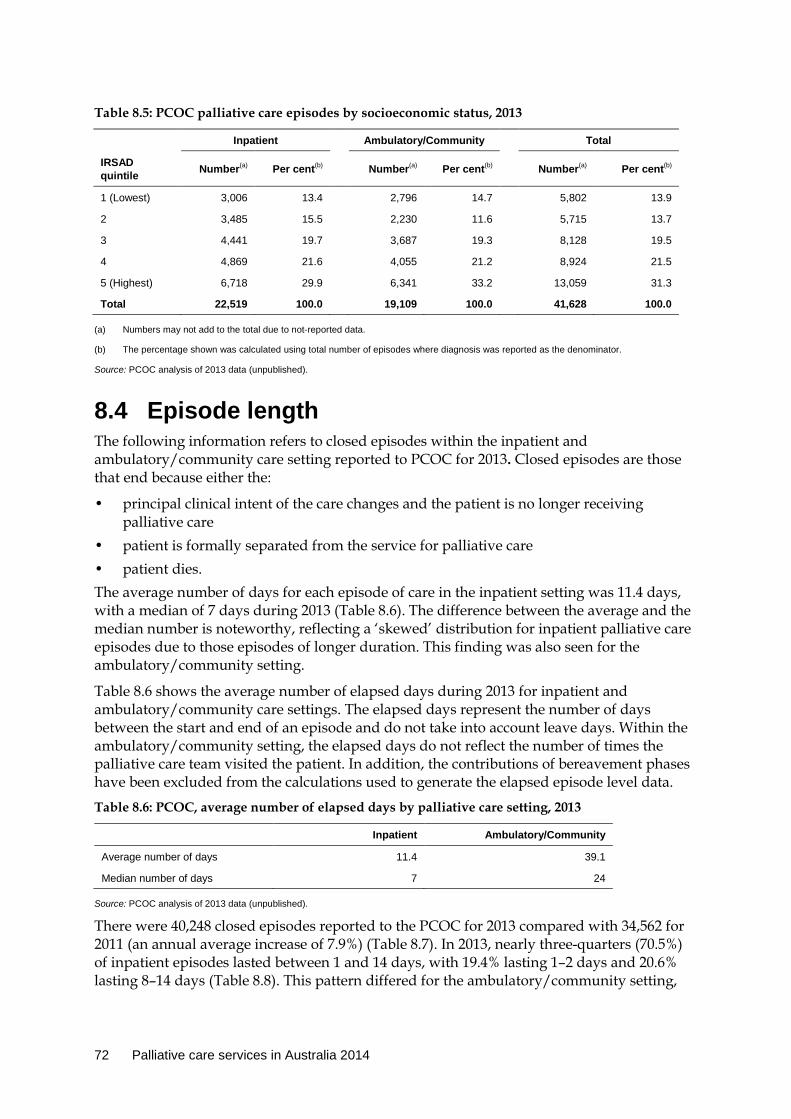
72 Palliative care services in Australia 2014
Table 8.5: PCOC palliative care episodes by socioeconomic status, 2013
Inpatient Ambulatory/Community Total
IRSAD quintile Number(a) Per cent(b) Number(a) Per cent(b) Number(a) Per cent(b)
1 (Lowest) 3,006 13.4 2,796 14.7 5,802 13.9
2 3,485 15.5 2,230 11.6 5,715 13.7
3 4,441 19.7 3,687 19.3 8,128 19.5
4 4,869 21.6 4,055 21.2 8,924 21.5
5 (Highest) 6,718 29.9 6,341 33.2 13,059 31.3
Total 22,519 100.0 19,109 100.0 41,628 100.0
(a) Numbers may not add to the total due to not-reported data.
(b) The percentage shown was calculated using total number of episodes where diagnosis was reported as the denominator.
Source: PCOC analysis of 2013 data (unpublished).
8.4 Episode length The following information refers to closed episodes within the inpatient and ambulatory/community care setting reported to PCOC for 2013. Closed episodes are those that end because either the:
• principal clinical intent of the care changes and the patient is no longer receiving palliative care
• patient is formally separated from the service for palliative care • patient dies. death The average number of days for each episode of care in the inpatient setting was 11.4 days, with a median of 7 days during 2013 (Table 8.6). The difference between the average and the median number is noteworthy, reflecting a ‘skewed’ distribution for inpatient palliative care episodes due to those episodes of longer duration. This finding was also seen for the ambulatory/community setting.
Table 8.6 shows the average number of elapsed days during 2013 for inpatient and ambulatory/community care settings. The elapsed days represent the number of days between the start and end of an episode and do not take into account leave days. Within the ambulatory/community setting, the elapsed days do not reflect the number of times the palliative care team visited the patient. In addition, the contributions of bereavement phases have been excluded from the calculations used to generate the elapsed episode level data.
Table 8.6: PCOC, average number of elapsed days by palliative care setting, 2013
Inpatient Ambulatory/Community
Average number of days 11.4 39.1
Median number of days 7 24
Source: PCOC analysis of 2013 data (unpublished).
There were 40,248 closed episodes reported to the PCOC for 2013 compared with 34,562 for 2011 (an annual average increase of 7.9%) (Table 8.7). In 2013, nearly three-quarters (70.5%) of inpatient episodes lasted between 1 and 14 days, with 19.4% lasting 1–2 days and 20.6% lasting 8–14 days (Table 8.8). This pattern differed for the ambulatory/community setting,

Palliative care services in Australia 2014 73
where the number of episodes increased as the days spent in care increased; 64.8% of palliative care episodes were 15 days or longer (Table 8.8).
Table 8.7: PCOC, number of closed episodes by palliative care setting, 2011 to 2013
Palliative care setting 2011 2012 2013
Annual average change (per
cent)
Inpatient 20,848 21,603 22,428 3.7
Ambulatory/Community 13,714 15,979 17,820 14.0
Total 34,562 37,582 40,248 7.9
Source: PCOC analysis of 2011, 2012 and 2013 data (unpublished).
Table 8.8: PCOC, closed episodes by number of elapsed days in palliative care inpatient and ambulatory/community care settings, 2013
Inpatient Ambulatory/Community Total
Elapsed days (days) Number Per cent Number Per cent Number Per cent
Same-day 1,148 5.1 932 5.2 2,080 5.2
1–2 4,344 19.4 1,008 5.7 5,352 13.3
3–4 3,222 14.4 913 5.1 4,135 10.3
5–7 3,612 16.1 1,261 7.1 4,873 12.1
8–14 4,631 20.6 2,156 12.1 6,787 16.9
15–21 2,179 9.7 1,581 8.9 3,760 9.3
22–30 1,472 6.6 1,593 8.9 3,065 7.6
31–60 1,435 6.4 3,236 18.2 4,671 11.6
61–90 268 1.2 1,713 9.6 1,981 4.9
>90 117 0.5 3,427 19.2 3,544 8.8
Total 22,428 100.0 17,820 100.0 40,248 100.0
Source: PCOC analysis of 2013 data (unpublished).
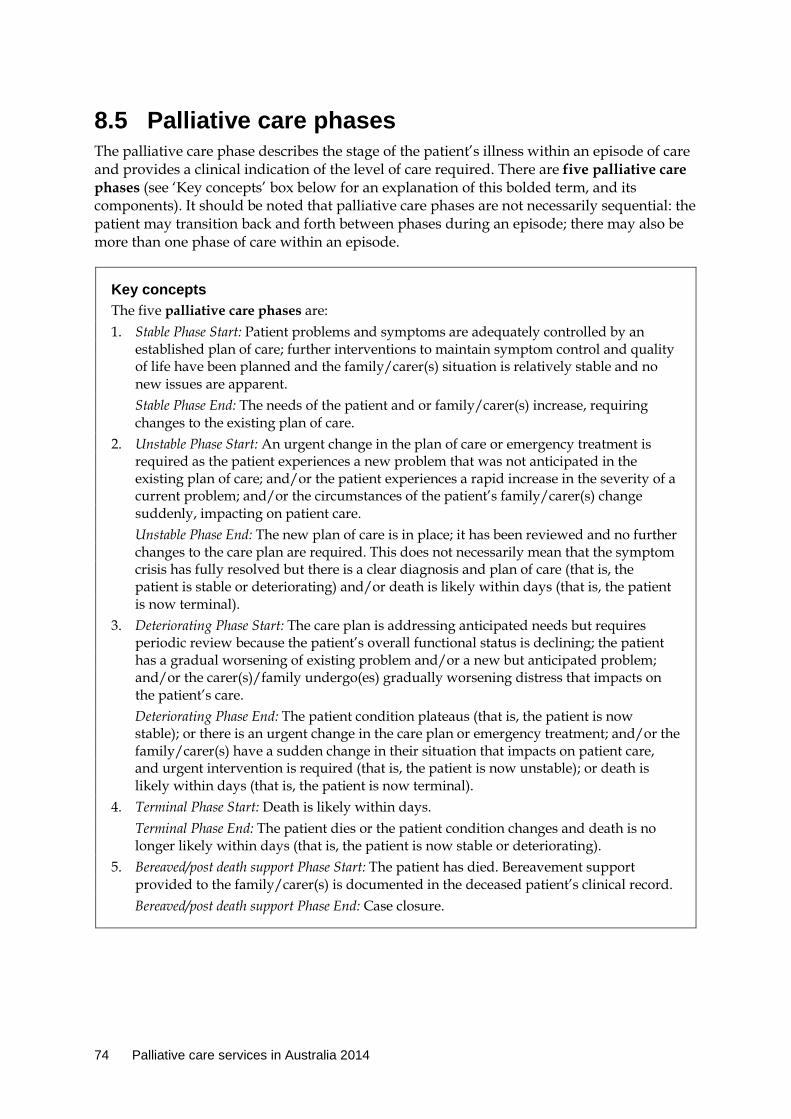
74 Palliative care services in Australia 2014
8.5 Palliative care phases The palliative care phase describes the stage of the patient’s illness within an episode of care and provides a clinical indication of the level of care required. There are five palliative care phases (see ‘Key concepts’ box below for an explanation of this bolded term, and its components). It should be noted that palliative care phases are not necessarily sequential: the patient may transition back and forth between phases during an episode; there may also be more than one phase of care within an episode.
Key concepts The five palliative care phases are: 1. Stable Phase Start: Patient problems and symptoms are adequately controlled by an
established plan of care; further interventions to maintain symptom control and quality of life have been planned and the family/carer(s) situation is relatively stable and no new issues are apparent.
Stable Phase End: The needs of the patient and or family/carer(s) increase, requiring changes to the existing plan of care.
2. Unstable Phase Start: An urgent change in the plan of care or emergency treatment is required as the patient experiences a new problem that was not anticipated in the existing plan of care; and/or the patient experiences a rapid increase in the severity of a current problem; and/or the circumstances of the patient’s family/carer(s) change suddenly, impacting on patient care.
Unstable Phase End: The new plan of care is in place; it has been reviewed and no further changes to the care plan are required. This does not necessarily mean that the symptom crisis has fully resolved but there is a clear diagnosis and plan of care (that is, the patient is stable or deteriorating) and/or death is likely within days (that is, the patient is now terminal).
3. Deteriorating Phase Start: The care plan is addressing anticipated needs but requires periodic review because the patient’s overall functional status is declining; the patient has a gradual worsening of existing problem and/or a new but anticipated problem; and/or the carer(s)/family undergo(es) gradually worsening distress that impacts on the patient’s care.
Deteriorating Phase End: The patient condition plateaus (that is, the patient is now stable); or there is an urgent change in the care plan or emergency treatment; and/or the family/carer(s) have a sudden change in their situation that impacts on patient care, and urgent intervention is required (that is, the patient is now unstable); or death is likely within days (that is, the patient is now terminal).
4. Terminal Phase Start: Death is likely within days. Terminal Phase End: The patient dies or the patient condition changes and death is no
longer likely within days (that is, the patient is now stable or deteriorating). 5. Bereaved/post death support Phase Start: The patient has died. Bereavement support
provided to the family/carer(s) is documented in the deceased patient’s clinical record. Bereaved/post death support Phase End: Case closure.
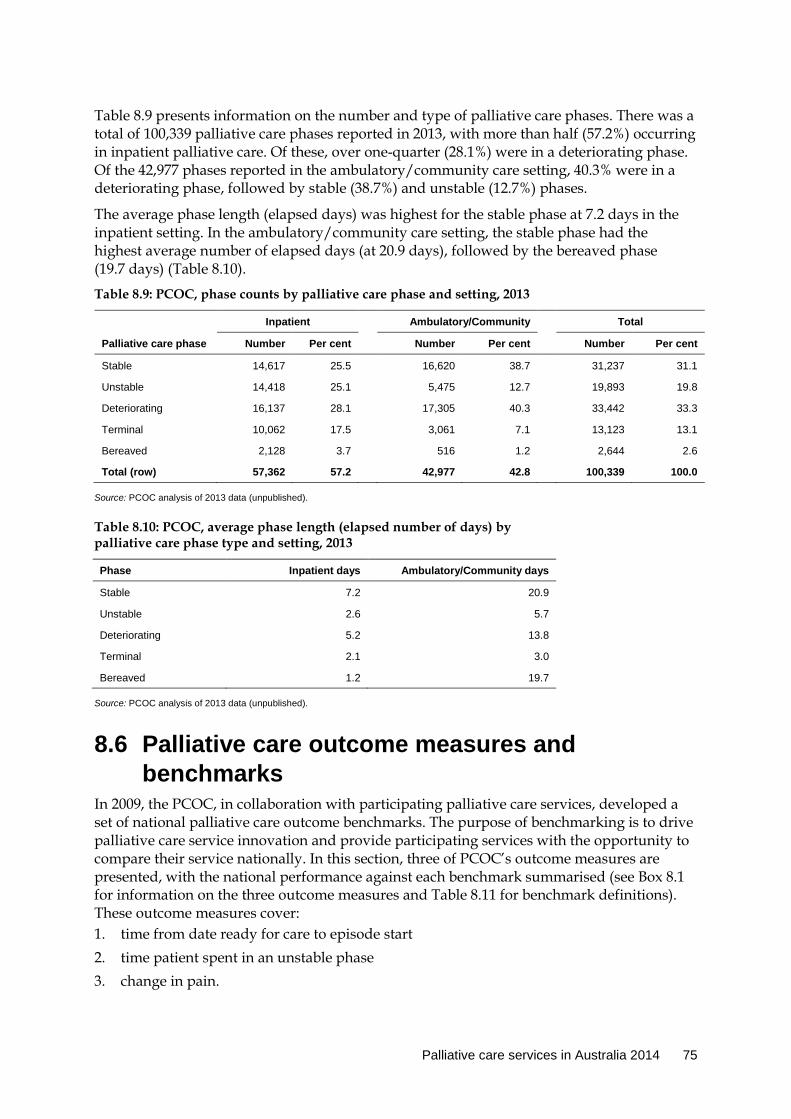
Palliative care services in Australia 2014 75
Table 8.9 presents information on the number and type of palliative care phases. There was a total of 100,339 palliative care phases reported in 2013, with more than half (57.2%) occurring in inpatient palliative care. Of these, over one-quarter (28.1%) were in a deteriorating phase. Of the 42,977 phases reported in the ambulatory/community care setting, 40.3% were in a deteriorating phase, followed by stable (38.7%) and unstable (12.7%) phases.
The average phase length (elapsed days) was highest for the stable phase at 7.2 days in the inpatient setting. In the ambulatory/community care setting, the stable phase had the highest average number of elapsed days (at 20.9 days), followed by the bereaved phase (19.7 days) (Table 8.10).
Table 8.9: PCOC, phase counts by palliative care phase and setting, 2013
Inpatient Ambulatory/Community Total
Palliative care phase Number Per cent Number Per cent Number Per cent
Stable 14,617 25.5 16,620 38.7 31,237 31.1
Unstable 14,418 25.1 5,475 12.7 19,893 19.8
Deteriorating 16,137 28.1 17,305 40.3 33,442 33.3
Terminal 10,062 17.5 3,061 7.1 13,123 13.1
Bereaved 2,128 3.7 516 1.2 2,644 2.6
Total (row) 57,362 57.2 42,977 42.8 100,339 100.0
Source: PCOC analysis of 2013 data (unpublished).
Table 8.10: PCOC, average phase length (elapsed number of days) by palliative care phase type and setting, 2013
Phase Inpatient days Ambulatory/Community days
Stable 7.2 20.9
Unstable 2.6 5.7
Deteriorating 5.2 13.8
Terminal 2.1 3.0
Bereaved 1.2 19.7
Source: PCOC analysis of 2013 data (unpublished).
8.6 Palliative care outcome measures and benchmarks
In 2009, the PCOC, in collaboration with participating palliative care services, developed a set of national palliative care outcome benchmarks. The purpose of benchmarking is to drive palliative care service innovation and provide participating services with the opportunity to compare their service nationally. In this section, three of PCOC’s outcome measures are presented, with the national performance against each benchmark summarised (see Box 8.1 for information on the three outcome measures and Table 8.11 for benchmark definitions). These outcome measures cover: 1. time from date ready for care to episode start 2. time patient spent in an unstable phase 3. change in pain.
76 Palliative care services in Australia 2014
Table 8.11 presents results compared with benchmarks for the three measures of palliative care outcomes, while Supplementary Table S8.2 shows the same benchmark results by palliative care setting (inpatient and ambulatory/community).
Around two-thirds (66.3%) of all PCOC contributing providers met benchmark 1, where 90% of patients must have their episode start on the day of, or the day following, the date ready for care (Table 8.11). Almost 9 out of 10 (88.6%) inpatient services met this benchmark in 2013, compared with more than one-third (36.2%) of ambulatory/community services (Supplementary Table S8.2).
Around 1 in 5 services (22.4%) met benchmark 2 (Table 8.11); there was a difference between the inpatient and ambulatory/community setting, with 29.3% of inpatient services and 7.1% of ambulatory/community services meeting this benchmark (Supplementary Table S8.2).
Benchmark 3.1 (that is, 90% of phases that started with absent/mild pain at the start of the phase remain in absent/mild pain at the end of the phase) was met by 32.7% of all services, while 46.7% of inpatient services and 16.0% of ambulatory/community services met this benchmark. A total of 40.0% and 19.6% of services, respectively, met benchmark 3.2 (that is, moderate/severe pain has reduced to absent/mild pain at phase end for 60% of patients) (Table 8.11).
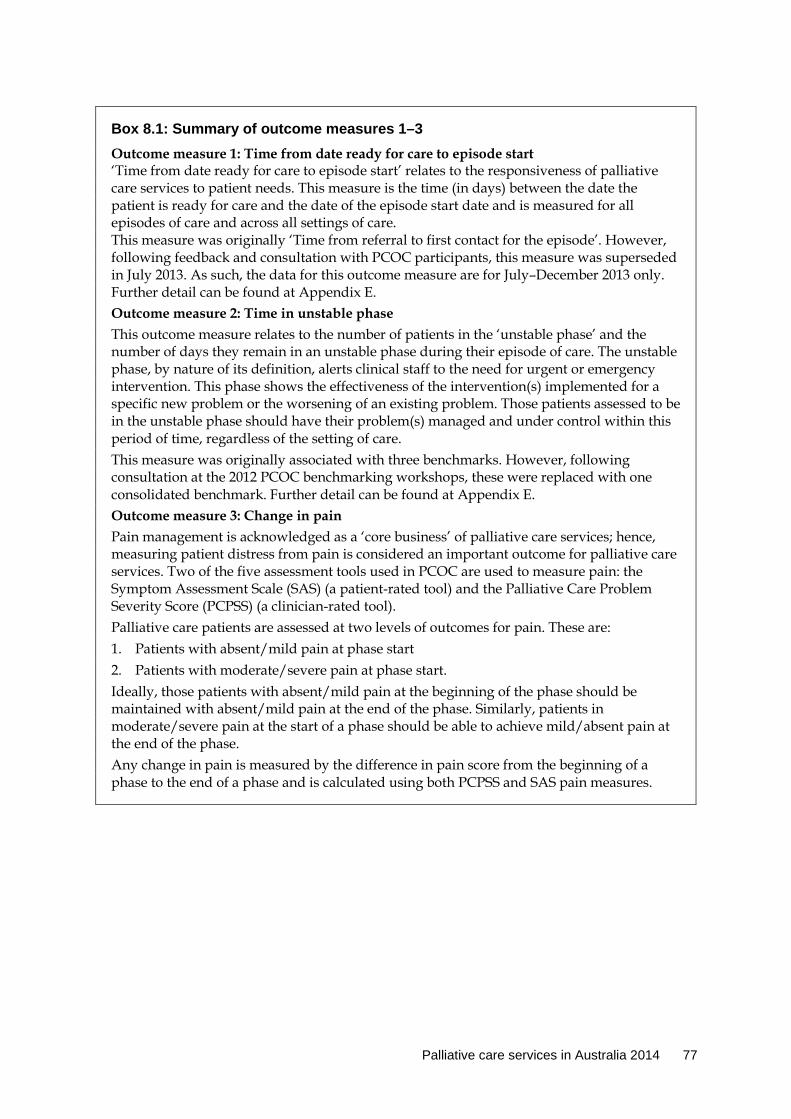
Palliative care services in Australia 2014 77
Box 8.1: Summary of outcome measures 1–3 Outcome measure 1: Time from date ready for care to episode start ‘Time from date ready for care to episode start’ relates to the responsiveness of palliative care services to patient needs. This measure is the time (in days) between the date the patient is ready for care and the date of the episode start date and is measured for all episodes of care and across all settings of care. This measure was originally ‘Time from referral to first contact for the episode’. However, following feedback and consultation with PCOC participants, this measure was superseded in July 2013. As such, the data for this outcome measure are for July–December 2013 only. Further detail can be found at Appendix E. Outcome measure 2: Time in unstable phase This outcome measure relates to the number of patients in the ‘unstable phase’ and the number of days they remain in an unstable phase during their episode of care. The unstable phase, by nature of its definition, alerts clinical staff to the need for urgent or emergency intervention. This phase shows the effectiveness of the intervention(s) implemented for a specific new problem or the worsening of an existing problem. Those patients assessed to be in the unstable phase should have their problem(s) managed and under control within this period of time, regardless of the setting of care. This measure was originally associated with three benchmarks. However, following consultation at the 2012 PCOC benchmarking workshops, these were replaced with one consolidated benchmark. Further detail can be found at Appendix E. Outcome measure 3: Change in pain Pain management is acknowledged as a ‘core business’ of palliative care services; hence, measuring patient distress from pain is considered an important outcome for palliative care services. Two of the five assessment tools used in PCOC are used to measure pain: the Symptom Assessment Scale (SAS) (a patient-rated tool) and the Palliative Care Problem Severity Score (PCPSS) (a clinician-rated tool). Palliative care patients are assessed at two levels of outcomes for pain. These are: 1. Patients with absent/mild pain at phase start 2. Patients with moderate/severe pain at phase start. Ideally, those patients with absent/mild pain at the beginning of the phase should be maintained with absent/mild pain at the end of the phase. Similarly, patients in moderate/severe pain at the start of a phase should be able to achieve mild/absent pain at the end of the phase. Any change in pain is measured by the difference in pain score from the beginning of a phase to the end of a phase and is calculated using both PCPSS and SAS pain measures.
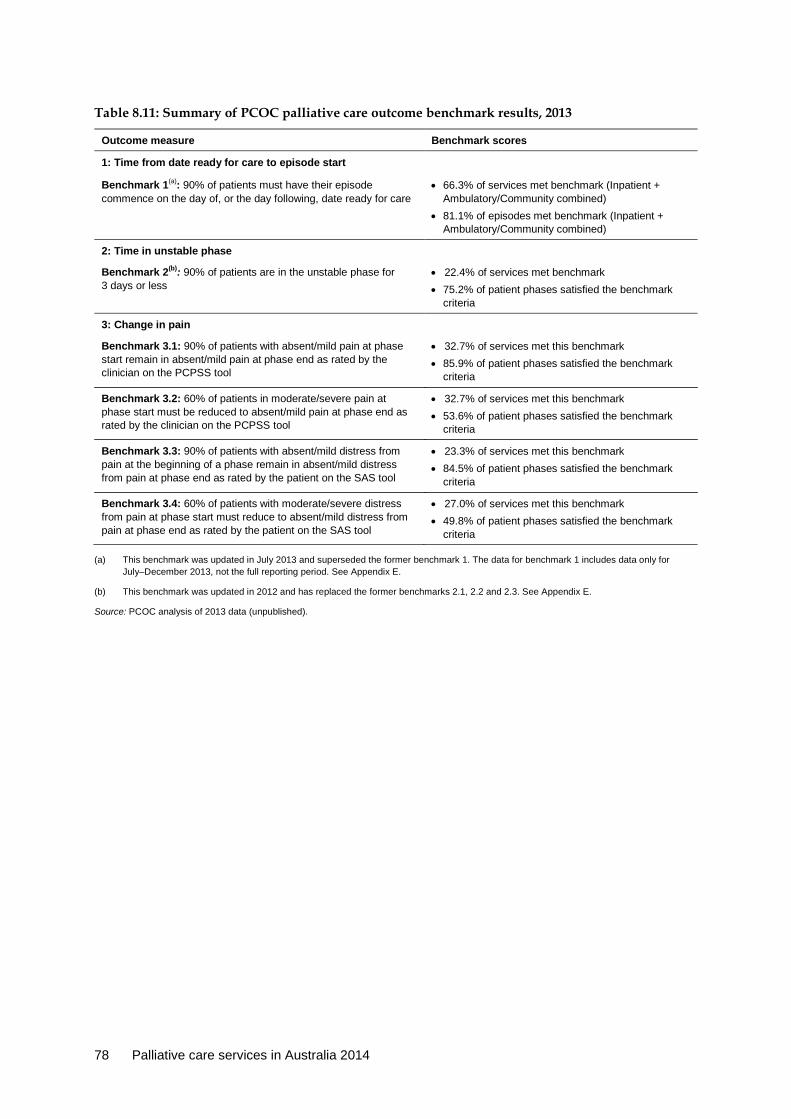
78 Palliative care services in Australia 2014
Table 8.11: Summary of PCOC palliative care outcome benchmark results, 2013
Outcome measure Benchmark scores
1: Time from date ready for care to episode start
Benchmark 1(a): 90% of patients must have their episode commence on the day of, or the day following, date ready for care
• 66.3% of services met benchmark (Inpatient + Ambulatory/Community combined)
• 81.1% of episodes met benchmark (Inpatient + Ambulatory/Community combined)
2: Time in unstable phase
Benchmark 2(b): 90% of patients are in the unstable phase for 3 days or less
• 22.4% of services met benchmark • 75.2% of patient phases satisfied the benchmark
criteria
3: Change in pain
Benchmark 3.1: 90% of patients with absent/mild pain at phase start remain in absent/mild pain at phase end as rated by the clinician on the PCPSS tool
• 32.7% of services met this benchmark • 85.9% of patient phases satisfied the benchmark
criteria
Benchmark 3.2: 60% of patients in moderate/severe pain at phase start must be reduced to absent/mild pain at phase end as rated by the clinician on the PCPSS tool
• 32.7% of services met this benchmark • 53.6% of patient phases satisfied the benchmark
criteria
Benchmark 3.3: 90% of patients with absent/mild distress from pain at the beginning of a phase remain in absent/mild distress from pain at phase end as rated by the patient on the SAS tool
• 23.3% of services met this benchmark • 84.5% of patient phases satisfied the benchmark
criteria
Benchmark 3.4: 60% of patients with moderate/severe distress from pain at phase start must reduce to absent/mild distress from pain at phase end as rated by the patient on the SAS tool
• 27.0% of services met this benchmark • 49.8% of patient phases satisfied the benchmark
criteria
(a) This benchmark was updated in July 2013 and superseded the former benchmark 1. The data for benchmark 1 includes data only for July–December 2013, not the full reporting period. See Appendix E.
(b) This benchmark was updated in 2012 and has replaced the former benchmarks 2.1, 2.2 and 2.3. See Appendix E.
Source: PCOC analysis of 2013 data (unpublished).

Palliative care services in Australia 2014 79
9 Palliative care facilities and services This chapter summarises available information on various palliative care facilities and programs, including hospice care units in public hospitals, as well as Community Nursing services for DVA clients.
9.1 Hospice units in public hospitals This section presents an overview of the number of hospice care units provided across public hospitals in Australia. It also provides information on the number of specialised services provided across public acute hospitals, and time series information on the number of hospice care units for these hospitals from 2007–08 to 2011–12. The hospital types reported in this section relate only to public acute hospitals. Information on public hospital resources was derived from the National Public Hospital Establishments Database (NPHED) (see Appendix B for data source information).
A hospice care unit is a type of specialist unit delivering palliative care services and can include both free-standing hospices and/or palliative care wards within a hospital. In considering the information presented in this chapter, it is useful to note that how hospices are identified in the NPHED varies among jurisdictions. It should also be noted that palliative care services may be delivered in other specialist care units within a hospital, which are unlikely to be identified as a hospice care unit and so are not included within the data reported here. In addition, the information derived from the NPHED does not include all hospice services in Australia; for example, private health-care providers/hospitals providing hospice care services are not in scope for this data collection.
In 2011–12, a total of 120 public acute hospitals reported a hospice care unit nationally, with over one-third located in New South Wales (Table 9.1). Of the 736 public acute hospitals (excluding public psychiatric hospitals) in Australia (AIHW 2013a), about 1 in 6 (16.3%) had a hospice care unit (Table 9.1). Just over one-quarter (25.4%) of all hospitals with hospice care units were located in Major cities (Table 9.1). Data on specialised services were not available for a small number of hospitals, so the services may be under-counted.

80 Palliative care services in Australia 2014
Table 9.1: Public acute hospitals with hospice care units, by remoteness area, states and territories, 2011–12
Remoteness area NSW(a) Vic Qld WA SA(b) Tas ACT NT Total(c)
Number Major cities 15 15 7 0 5 0 1 0 43
Regional 26 11 5 19 2 1 0 1 65
Remote 0 0 0 11 1 0 0 0 12
Total 41 26 12 30 8 1 1 1 120
Per cent(d) Major cities 24.2 28.3 41.2 0.0 38.5 . . 33.3 . . 25.4
Regional 18.7 11.6 6.4 51.4 4.7 5.6 0.0 100.0 15.8
Remote 0.0 0.0 0.0 30.6 4.5 0.0 0.0 0.0 7.7
Total(c)(d) 18.8 17.3 7.2 31.9 10.3 4.5 33.3 20.0 16.3
(a) Data for a small number of hospitals in New South Wales were not available; therefore, the number of services is likely to be under-counted.
(b) The numbers reported for South Australia do not correspond with the numbers for public acute hospitals with hospice care units as reported in Australian Hospital Statistics 2011–12 (AIHW 2013a). Numbers reported here were derived in consultation with South Australia and should not be compared with previous year’s numbers reported for South Australia.
(c) Total for public acute hospitals excludes public psychiatric hospitals.
(d) Calculations were made using number of public acute hospitals with a hospice care unit as the numerator and total number of public acute hospitals as the denominator.
Source: NPHED, AIHW.
How did hospice units vary across states and territories from 2007–08 to 2011–12? Table 9.2 presents the number of public acute hospitals with a hospice care unit by state and territory from 2007–08 to 2011–12, reported as a proportion of all public acute hospitals. There was a general increase in the number of public acute hospitals with hospice care units from 2007–08 to 2010–11, but in 2011–12 the number decreased by 16 units (from 136 to 120), with South Australia and New South Wales accounting for the majority of the drop (5 and 9 units, respectively).
It should be noted that differences across jurisdictions are likely to be due to a range of factors, including differences in the characteristics of the population, health-care systems and service delivery practices.

Palliative care services in Australia 2014 81
Table 9.2: Public acute hospitals(a) with hospice care units, states and territories, 2007–08 to 2011–12
State/territory 2007–08 2008–09 2009–10 2010–11 2011–12
Number
New South Wales 45 47 40 52 41
Victoria 24 23 26 27 26
Queensland 9 7 11 11 12
Western Australia 29 29 30 30 30
South Australia(b) 16 14 13 13 8
Tasmania 1 1 1 1 1
Australian Capital Territory 1 1 1 1 1
Northern Territory 1 1 1 1 1
Total 126 123 123 136 120
Per cent(c)
New South Wales 20.5 21.5 18.3 23.9 18.8
Victoria 16.3 14.9 17.4 18.0 17.3
Queensland 5.2 4.2 6.6 6.6 7.2
Western Australia 31.2 31.2 31.9 32.3 31.9
South Australia(b) 20.5 17.9 16.7 16.7 10.3
Tasmania 4.2 4.0 4.3 4.5 4.5
Australian Capital Territory 33.3 33.3 33.3 33.3 33.3
Northern Territory 20.0 20.0 20.0 20.0 20.0
Total 17.0 16.7 16.7 18.5 16.3
(a) The number of hospitals reported can be affected by administrative and/or reporting arrangements and is not necessarily a measure of the number of physical hospital buildings or campuses.
(b) The numbers reported for South Australia do not correspond with the numbers for public acute hospitals with hospice care units as reported in Australian Hospital Statistics 2011–12 (AIHW 2013a). Numbers reported here were derived in consultation with South Australia and should not be compared with previous year’s numbers reported for South Australia.
(c) Calculations were made using number of public acute hospitals with a hospice care unit as the numerator and total number of public acute hospitals as the denominator.
Source: NPHED, AIHW.
9.2 Private acute and psychiatric hospitals This section includes data on private hospitals, including facilities and specialised services for acute and psychiatric hospitals. These data were derived from the Private Health Establishments Collection (ABS 2013c), which is sourced from the annual survey collecting information relating to private hospital activities in Australia.
There were 221 private acute and psychiatric hospitals nationally in 2011–12 (ABS 2013d). Of these, 25 (11.3%) had hospice units recorded (Table 9.3). The number of average available beds in these hospice units was 221, with an estimated 60,408 patient days and an average length of stay of 11.1 days (ABS 2013d).
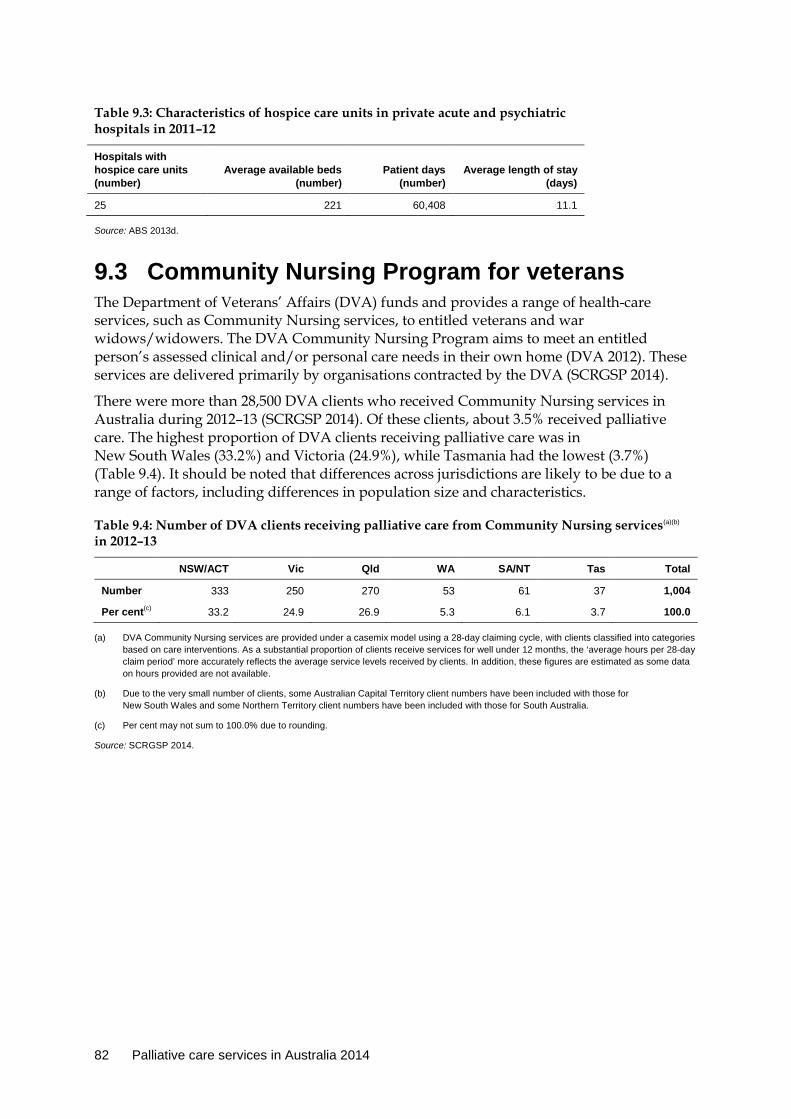
82 Palliative care services in Australia 2014
Table 9.3: Characteristics of hospice care units in private acute and psychiatric hospitals in 2011–12
Hospitals with hospice care units (number)
Average available beds (number)
Patient days (number)
Average length of stay (days)
25 221 60,408 11.1
Source: ABS 2013d.
9.3 Community Nursing Program for veterans The Department of Veterans’ Affairs (DVA) funds and provides a range of health-care services, such as Community Nursing services, to entitled veterans and war widows/widowers. The DVA Community Nursing Program aims to meet an entitled person’s assessed clinical and/or personal care needs in their own home (DVA 2012). These services are delivered primarily by organisations contracted by the DVA (SCRGSP 2014).
There were more than 28,500 DVA clients who received Community Nursing services in Australia during 2012–13 (SCRGSP 2014). Of these clients, about 3.5% received palliative care. The highest proportion of DVA clients receiving palliative care was in New South Wales (33.2%) and Victoria (24.9%), while Tasmania had the lowest (3.7%) (Table 9.4). It should be noted that differences across jurisdictions are likely to be due to a range of factors, including differences in population size and characteristics.
Table 9.4: Number of DVA clients receiving palliative care from Community Nursing services(a)(b)
in 2012–13
NSW/ACT Vic Qld WA SA/NT Tas Total
Number 333 250 270 53 61 37 1,004
Per cent(c) 33.2 24.9 26.9 5.3 6.1 3.7 100.0
(a) DVA Community Nursing services are provided under a casemix model using a 28-day claiming cycle, with clients classified into categories based on care interventions. As a substantial proportion of clients receive services for well under 12 months, the ‘average hours per 28-day claim period’ more accurately reflects the average service levels received by clients. In addition, these figures are estimated as some data on hours provided are not available.
(b) Due to the very small number of clients, some Australian Capital Territory client numbers have been included with those for New South Wales and some Northern Territory client numbers have been included with those for South Australia.
(c) Per cent may not sum to 100.0% due to rounding.
Source: SCRGSP 2014.

Palliative care services in Australia 2014 83
9.4 Palliative care Standards Palliative Care Australia (PCA) has developed the Standards for Providing Quality Palliative Care for all Australians (the Standards, see Box 9.1) in collaboration with the palliative care sector (PCA 2005b). The National Standards Assessment Program (NSAP), funded by the Australian Government Department of Health, has been designed as a quality improvement program for participating specialist palliative care services that undertake self-assessment and monitoring against the Standards.
Box 9.1: The Standards There are 13 Standards and 88 Quality Elements that constitute PCA’s National Standards. Services conduct a self-assessment against the Standards using specifically developed quality elements and then record whether that Standard is rated as a high-, medium- or low-level improvement priority. Full details of the NSAP program can be found on the PCA website: <http://www.palliativecare.org.au/Standards/NSAP.aspx>. 1. Care, decision making and care planning are each based on a respect for the
uniqueness of the patient, their caregiver(s) and family. The patients, their caregiver(s) and families’ needs and wishes are acknowledged and guide decision making and care planning.
2. The holistic needs of the patient, their caregiver(s) and family are acknowledged in the assessment and care planning processes, and strategies are developed to address those needs, in line with their wishes.
3. Ongoing and comprehensive assessment and care planning are undertaken to meet the needs and wishes of the patient, their caregiver(s) and family.
4. Care is coordinated to minimise the burden on the patient, their caregiver(s) and family.
5. The primary caregiver(s) is/are provided with information, support and guidance about their role according to their needs and wishes.
6. The unique needs of dying patients are considered, their comfort maximised and their dignity preserved.
7. The service has an appropriate philosophy, values, culture, structure and environment for the provision of competent and compassionate palliative care.
8. Formal mechanisms are in place to ensure that the patient, their caregiver(s) and family have access to bereavement care, information and support services.
9. Community capacity to respond to the needs of people who have a life limiting illness, their caregiver(s) and family is built through effective collaboration and partnerships.
10. Access to palliative care is available for all people based on clinical need and is independent of diagnosis, age, cultural background or geography.
11. The service is committed to quality improvement and research in clinical and management practices.
12. Staff and volunteers are appropriately qualified for the level of service offered and demonstrate ongoing participation in continuing professional development.
13. Staff and volunteers reflect on practice and initiate and maintain effective self-care strategies.
Source: NSAP (PCA 2014).

84 Palliative care services in Australia 2014
Tables 9.5 and 9.6 presents the five Standards most often rated as a high-improvement priority in cumulative results between 2010 and 2013. Between 2010 and 2013, 140 specialist palliative care services throughout Australia submitted their Cycle 1 self-assessment snapshot results to NSAP and 51 have gone on to submit their equivalent result for Cycle 2 (Tables 9.5 and 9.6). It should be noted that tables 9.5 and 9.6 include all 10 paediatric specialist palliative care services results for both Cycle 1 and Cycle 2—all other services are adult focused.
In 2013, Standard 1 (person-centred care planning) was rated as a high-improvement priority by 42% of participating services, followed by Standard 8 (bereavement care) with 36% of services in Cycle 1 (Table 9.5). Results were slightly different in Cycle 2, with 41% of services rating Standard 8 (bereavement care) as a high-improvement priority followed by person-centred care planning at 27% (Table 9.6)
Table 9.5: Participating Cycle 1 services rating Standards as a high-improvement priority, 2010 to 2013
Services rating Standards as high-improvement priority (per cent)
Standard 2010 2011 2012 2013
1 Person-centred care planning 32 36 42 42
8 Bereavement care 38 35 38 36
11 Quality improvement/Research 34 28 31 31
6 Needs of dying patient 26 27 27 25
2 Holistic needs of the patient 21 21 26 24
Number of services 68 107 125 140
Source: NSAP unpublished (PCA 2014).
Table 9.6: Participating Cycle 2 services rating Standards as a high-improvement priority, 2013
Standard 2013 (Per cent)
8 Bereavement care 41
1 Person-centred care planning 27
2 Holistic needs of the patient 22
6 Needs of dying patient 18
11 Quality improvement/Research 18
Number of services 51
Source: NSAP unpublished (PCA 2014).
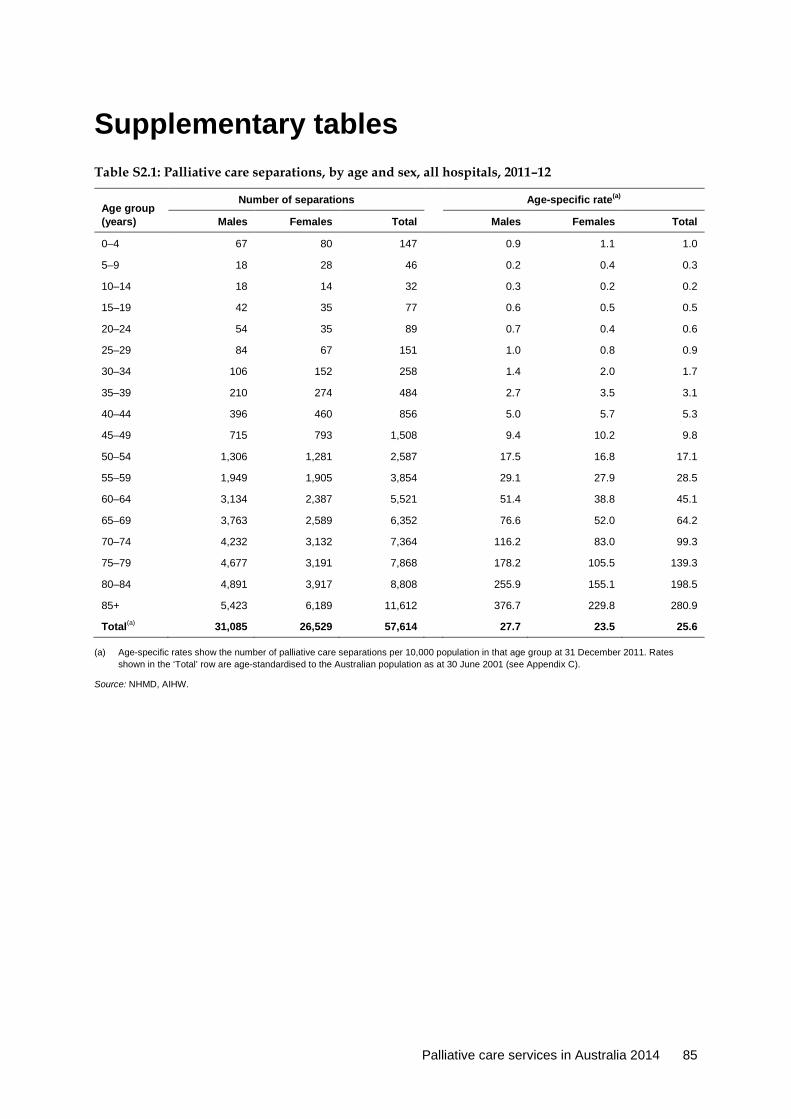
Palliative care services in Australia 2014 85
Supplementary tables Table S2.1: Palliative care separations, by age and sex, all hospitals, 2011–12
Age group (years)
Number of separations Age-specific rate(a)
Males Females Total Males Females Total
0–4 67 80 147 0.9 1.1 1.0
5–9 18 28 46 0.2 0.4 0.3
10–14 18 14 32 0.3 0.2 0.2
15–19 42 35 77 0.6 0.5 0.5
20–24 54 35 89 0.7 0.4 0.6
25–29 84 67 151 1.0 0.8 0.9
30–34 106 152 258 1.4 2.0 1.7
35–39 210 274 484 2.7 3.5 3.1
40–44 396 460 856 5.0 5.7 5.3
45–49 715 793 1,508 9.4 10.2 9.8
50–54 1,306 1,281 2,587 17.5 16.8 17.1
55–59 1,949 1,905 3,854 29.1 27.9 28.5
60–64 3,134 2,387 5,521 51.4 38.8 45.1
65–69 3,763 2,589 6,352 76.6 52.0 64.2
70–74 4,232 3,132 7,364 116.2 83.0 99.3
75–79 4,677 3,191 7,868 178.2 105.5 139.3
80–84 4,891 3,917 8,808 255.9 155.1 198.5
85+ 5,423 6,189 11,612 376.7 229.8 280.9
Total(a) 31,085 26,529 57,614 27.7 23.5 25.6
(a) Age-specific rates show the number of palliative care separations per 10,000 population in that age group at 31 December 2011. Rates shown in the ‘Total’ row are age-standardised to the Australian population as at 30 June 2001 (see Appendix C).
Source: NHMD, AIHW.

86 Palliative care services in Australia 2014
Table S2.2: Palliative care patients among those who died as an admitted patient, public and private hospitals, 2002–03 to 2011–12
Admitted patient deaths (number) Per cent palliative care
patients(a) Palliative care patients(a) Total admitted patient deaths
2002–03 17,552 71,573 24.5
2003–04 18,587 71,932 25.8
2004–05 20,625 70,799 29.1
2005–06 21,649 71,122 30.4
2006–07 22,672 72,440 31.3
2007–08 24,012 74,365 32.3
2008–09 25,552 74,380 34.4
2009–10 27,270 73,021 37.3
2010–11 27,865 74,861 37.2
2011–12 29,665 75,107 39.5
(a) Refers to patients for whom palliative care was the principal clinical intent during part or all of the separations that ended with their death. Source: NHMD, AIHW.

Palliative care services in Australia 2014 87
Table S5.1: Permanent residential aged care residents, by care type, sex and age group, 2012–13
Age group and sex Palliative care Other care Total Per cent
Females
<65 185 3,189 3,374 2.2
65–69 196 3,250 3,446 2.3
70–74 325 5,746 6,071 4.0
75–79 645 11,685 12,330 8.1
80–84 1,291 25,135 26,426 17.4
85+ 5,085 95,449 100,534 66.1
Total 7,727 144,454 152,181 100.0
Males
<65 199 3,832 4,031 5.4
65–69 218 3,752 3,970 5.3
70–74 399 5,555 5,954 8.0
75–79 671 8,609 9,280 12.5
80–84 1,036 14,049 15,085 20.3
85+ 2,439 33,471 35,910 48.4
Total 4,962 69,268 74,230 100.0
Persons
<65 384 7,021 7,405 3.27
65–69 414 7,002 7,416 3.28
70–74 724 11,301 12,025 5.31
75–79 1,316 20,294 21,610 9.54
80–84 2,327 39,184 41,511 18.3
85+ 7,524 128,920 136,444 60.3
Total persons(a) 12,689 213,722 226,411 100.0
Per cent 5.6 94.4 100.0 . .
(a) Percentages may not sum to 100.0% due to rounding. Source: AIHW analysis of 2012–13 ACFI data.
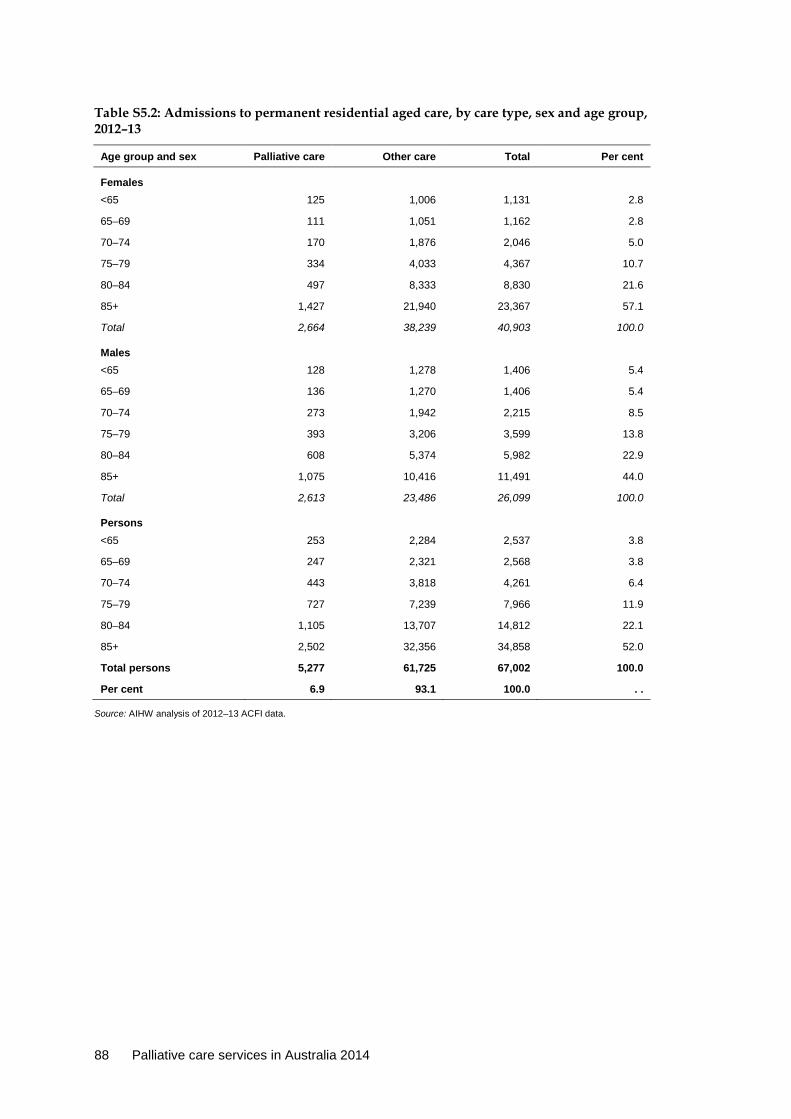
88 Palliative care services in Australia 2014
Table S5.2: Admissions to permanent residential aged care, by care type, sex and age group, 2012–13
Age group and sex Palliative care Other care Total Per cent
Females
<65 125 1,006 1,131 2.8
65–69 111 1,051 1,162 2.8
70–74 170 1,876 2,046 5.0
75–79 334 4,033 4,367 10.7
80–84 497 8,333 8,830 21.6
85+ 1,427 21,940 23,367 57.1
Total 2,664 38,239 40,903 100.0
Males
<65 128 1,278 1,406 5.4
65–69 136 1,270 1,406 5.4
70–74 273 1,942 2,215 8.5
75–79 393 3,206 3,599 13.8
80–84 608 5,374 5,982 22.9
85+ 1,075 10,416 11,491 44.0
Total 2,613 23,486 26,099 100.0
Persons
<65 253 2,284 2,537 3.8
65–69 247 2,321 2,568 3.8
70–74 443 3,818 4,261 6.4
75–79 727 7,239 7,966 11.9
80–84 1,105 13,707 14,812 22.1
85+ 2,502 32,356 34,858 52.0
Total persons 5,277 61,725 67,002 100.0
Per cent 6.9 93.1 100.0 . .
Source: AIHW analysis of 2012–13 ACFI data.
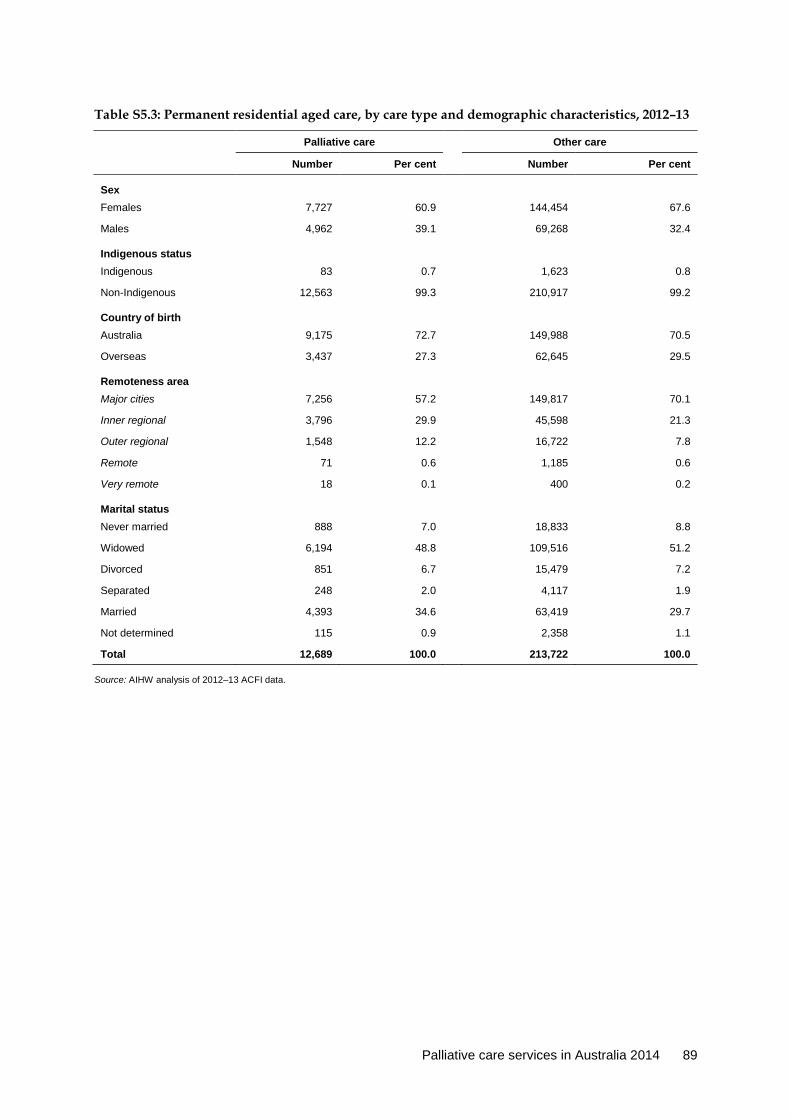
Palliative care services in Australia 2014 89
Table S5.3: Permanent residential aged care, by care type and demographic characteristics, 2012–13
Palliative care Other care
Number Per cent Number Per cent
Sex
Females 7,727 60.9 144,454 67.6
Males 4,962 39.1 69,268 32.4
Indigenous status
Indigenous 83 0.7 1,623 0.8
Non-Indigenous 12,563 99.3 210,917 99.2
Country of birth
Australia 9,175 72.7 149,988 70.5
Overseas 3,437 27.3 62,645 29.5
Remoteness area
Major cities 7,256 57.2 149,817 70.1
Inner regional 3,796 29.9 45,598 21.3
Outer regional 1,548 12.2 16,722 7.8
Remote 71 0.6 1,185 0.6
Very remote 18 0.1 400 0.2
Marital status
Never married 888 7.0 18,833 8.8
Widowed 6,194 48.8 109,516 51.2
Divorced 851 6.7 15,479 7.2
Separated 248 2.0 4,117 1.9
Married 4,393 34.6 63,419 29.7
Not determined 115 0.9 2,358 1.1
Total 12,689 100.0 213,722 100.0
Source: AIHW analysis of 2012–13 ACFI data.
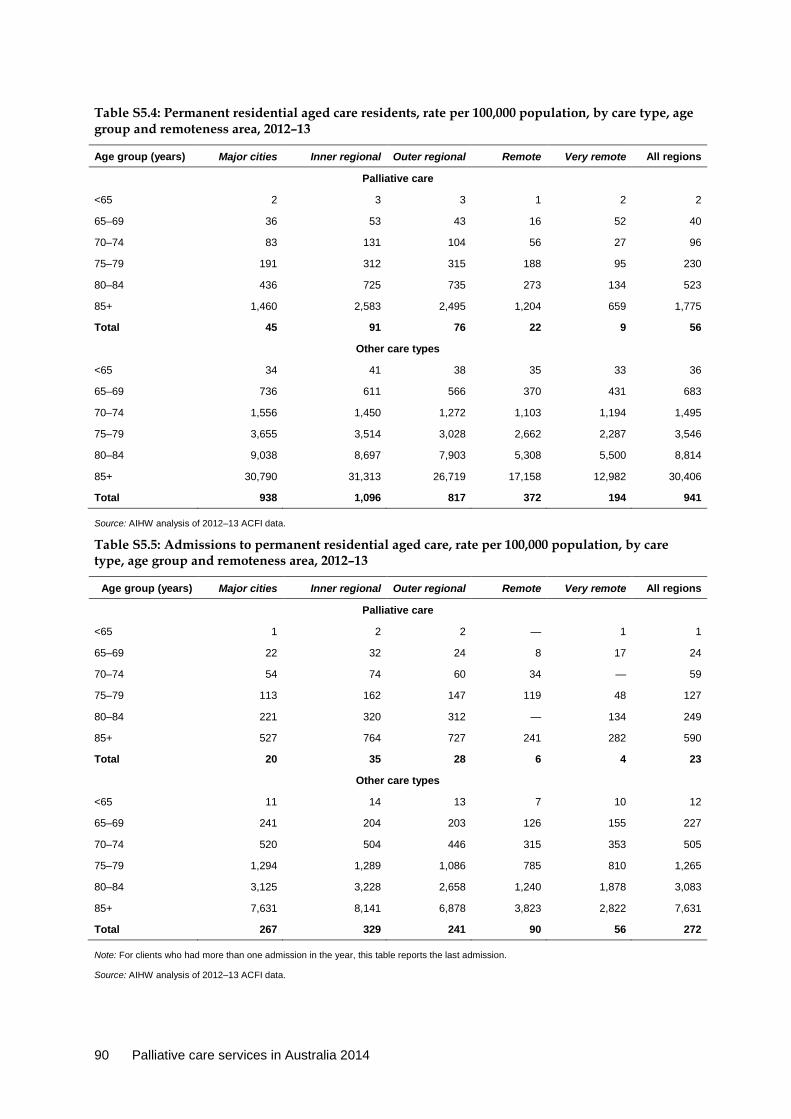
90 Palliative care services in Australia 2014
Table S5.4: Permanent residential aged care residents, rate per 100,000 population, by care type, age group and remoteness area, 2012–13
Age group (years) Major cities Inner regional Outer regional Remote Very remote All regions
Palliative care
<65 2 3 3 1 2 2
65–69 36 53 43 16 52 40
70–74 83 131 104 56 27 96
75–79 191 312 315 188 95 230
80–84 436 725 735 273 134 523
85+ 1,460 2,583 2,495 1,204 659 1,775
Total 45 91 76 22 9 56
Other care types
<65 34 41 38 35 33 36
65–69 736 611 566 370 431 683
70–74 1,556 1,450 1,272 1,103 1,194 1,495
75–79 3,655 3,514 3,028 2,662 2,287 3,546
80–84 9,038 8,697 7,903 5,308 5,500 8,814
85+ 30,790 31,313 26,719 17,158 12,982 30,406
Total 938 1,096 817 372 194 941
Source: AIHW analysis of 2012–13 ACFI data.
Table S5.5: Admissions to permanent residential aged care, rate per 100,000 population, by care type, age group and remoteness area, 2012–13
Age group (years) Major cities Inner regional Outer regional Remote Very remote All regions
Palliative care
<65 1 2 2 — 1 1
65–69 22 32 24 8 17 24
70–74 54 74 60 34 — 59
75–79 113 162 147 119 48 127
80–84 221 320 312 — 134 249
85+ 527 764 727 241 282 590
Total 20 35 28 6 4 23
Other care types
<65 11 14 13 7 10 12
65–69 241 204 203 126 155 227
70–74 520 504 446 315 353 505
75–79 1,294 1,289 1,086 785 810 1,265
80–84 3,125 3,228 2,658 1,240 1,878 3,083
85+ 7,631 8,141 6,878 3,823 2,822 7,631
Total 267 329 241 90 56 272
Note: For clients who had more than one admission in the year, this table reports the last admission.
Source: AIHW analysis of 2012–13 ACFI data.

Palliative care services in Australia 2014 91
Table S5.6: Permanent residential aged care residents, rate per 100,000 population, by care type, age group and state, 2012–13
Age group (years) NSW Vic Qld WA SA Tas ACT NT Total
Palliative care
<65 2 2 2 2 3 6 1 0 2
65–69 37 37 31 37 35 184 27 — 39
70–74 96 78 89 95 66 353 80 77 94
75–79 199 208 205 256 131 1,185 140 — 227
80–84 450 490 452 760 288 2,489 324 163 524
85+ 1,473 1,804 1,440 2,194 1,033 7,995 1,330 544 1,733
Total 52 57 42 57 42 289 29 4 55
Other care types
<65 40 35 34 27 41 38 22 30 36
65–69 698 668 672 569 643 623 568 620 664
70–74 1,522 1,449 1,470 1,342 1,541 1,240 1,317 1,893 1,470
75–79 3,561 3,438 3,644 3,200 3,713 2,753 2,903 4,310 3,497
80–84 8,825 8,874 9,242 8,063 9,301 7,162 7,861 9,372 8,832
85+ 29,673 29,643 30,527 27,699 31,927 24,812 27,114 27,347 29,696
Total 1,011 969 846 709 1,232 881 615 247 933
Source: AIHW analysis of 2012–13 ACFI data.
Table S5.7: Permanent admission to residential aged care, rate per 100,000 population, by care type, age group and state, 2012–13
Age group (years) NSW Vic Qld WA SA Tas ACT NT Total
Palliative care
<65 1 1 1 1 2 3 — — 1
65–69 24 23 17 21 21 97 14 — 23
70–74 61 46 64 46 40 191 30 26 58
75–79 126 119 99 138 76 521 56 — 125
80–84 250 212 211 302 190 947 172 — 249
85+ 580 557 461 593 431 2,108 475 — 576
Total 25 22 17 20 22 97 12 1 23
Other care types
<65 13 12 11 9 11 16 7 5 12
65–69 235 210 239 184 211 184 162 166 220
70–74 530 472 517 450 493 358 442 486 496
75–79 1,295 1,220 1,296 1,121 1,273 1,015 1,234 637 1,247
80–84 3,134 3,106 3,203 2,768 3,212 2,489 2,805 2,037 3,089
85+ 7,581 7,371 7,561 6,951 7,853 6,630 6,745 3,537 7,453
Total 297 277 245 204 343 263 179 45 269
Note: For clients who had more than one admission in the year, this table reports the last admission.
Source: AIHW analysis of 2012–13 ACFI data.

92 Palliative care services in Australia 2014
Table S5.8: Recorded diagnoses in ACFI-appraised permanent residential aged care residents, 2012–13
Disease Palliative care Other care
Cancers
Brain 239 359
Breast 243 842
Colorectal (bowel) 407 1,227
Head and neck 145 297
Leukaemia 60 222
Lung 540 513
Non-Hodgkin lymphoma 53 186
Other malignant tumours n.o.s. 699 1,006
Prostate 426 1,281
Skin 104 671
Stomach 74 126
Other neoplasms (including tumours and tumours of uncertain or unknown behaviour) 133 398
No cancer/Not otherwise defined/Missing 184 4,644
Total cancers 3,307 11,772
Other diseases
Blood 112 992
Circulatory system 2,783 48,102
Congenital malformations 11 264
Digestive system 258 4,155
Ear 70 2,868
Endocrine 555 17,867
Genitourinary 663 10,360
Infectious/parasitic 27 512
Injury/poisoning/external 316 7,585
Musculoskeletal 1,282 39,847
Nervous system/Parkinson disease 668 13,600
Respiratory system 674 8,586
Skin 104 2,462
Vision 292 9,490
No condition/Not further defined/Missing 1,567 35,260
Total other diseases 9,382 201,950
Total cancers and non-cancers 12,689 213,722
Source: AIHW analysis of 2012–13 ACFI data.

Palliative care services in Australia 2014 93
Table S5.9: Separations from permanent residential aged, by care type and length of stay, 2012–13
Palliative care Other care
Length of stay Number Per cent Number Per cent
0–<4 weeks 1,778 20.1 3,087 5.4
4–<8 weeks 1,068 12.1 2,642 4.6
8–<13 weeks 529 6.0 2,717 4.8
13–<26 weeks 737 8.3 5,004 8.8
26–<39 weeks 500 5.7 3,734 6.5
39–<52 weeks 320 3.6 3,052 5.3
1–<2 years 1,049 11.9 9,555 16.7
2–<3 years 747 8.5 7,094 12.4
3–<4 years 586 6.6 5,402 9.5
4–<5 years 400 4.5 3,952 6.9
5–<8 years 681 7.7 6,618 11.6
8+ years 432 4.9 4,201 7.4
Total(a) 8,827 100.0 57,058 100.0
Note: For clients who had more than one admission in the year, this table reports the last admission.
Source: AIHW analysis of 2012–13 ACFI data.
Table S5.10: Permanent residential aged care residents granted hospital leave, by care type, state or territory and remoteness area, 2012–13
Jurisdiction Major cities Inner regional Outer regional Remote Very remote All regions
Palliative care
New South Wales 736 304 73 4 — 1,117 Victoria 648 213 67 3 . . 931 Queensland 404 99 81 5 5 594 Western Australia 424 30 21 — 1 476 South Australia 175 15 24 3 — 217 Tasmania . . 151 68 — — 219 Australian Capital Territory 46 — . . . . . . 46 Northern Territory . . . . 1 2 1 4 Total 2,433 812 335 17 7 3,604
Other care types
New South Wales 16,884 4,474 1,175 49 1 22,583 Victoria 11,255 2,827 675 20 . . 14,777 Queensland 8,421 2,543 1,315 106 55 12,440 Western Australia 4,770 394 398 38 10 5,610 South Australia 4,708 406 668 27 . . 5,809 Tasmania . . 609 136 6 1 752 Australian Capital Territory 770 — . . . . . . 770 Northern Territory . . . . 150 49 11 210 Total 46,808 11,253 4,517 295 78 62,951
Source: AIHW analysis of 2012–13 ACFI data.
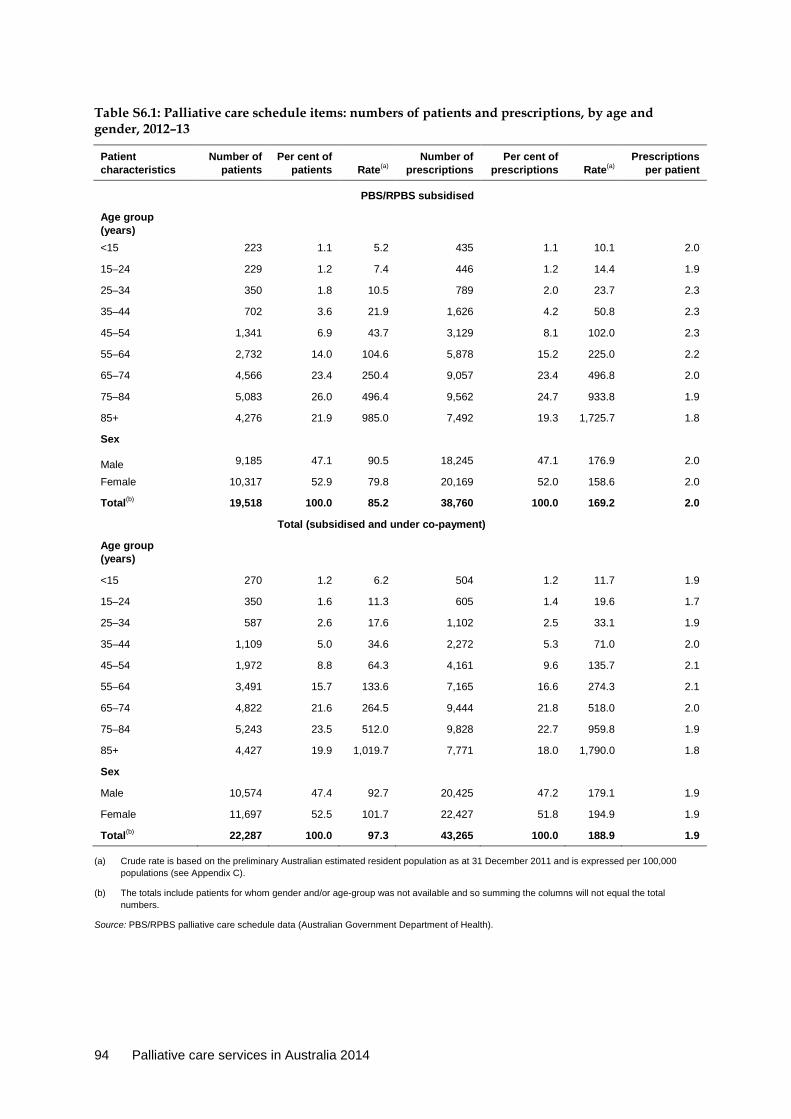
94 Palliative care services in Australia 2014
Table S6.1: Palliative care schedule items: numbers of patients and prescriptions, by age and gender, 2012–13
Patient characteristics
Number of patients
Per cent of patients Rate(a)
Number of prescriptions
Per cent of prescriptions Rate(a)
Prescriptions per patient
PBS/RPBS subsidised
Age group (years)
<15 223 1.1 5.2 435 1.1 10.1 2.0
15–24 229 1.2 7.4 446 1.2 14.4 1.9
25–34 350 1.8 10.5 789 2.0 23.7 2.3
35–44 702 3.6 21.9 1,626 4.2 50.8 2.3
45–54 1,341 6.9 43.7 3,129 8.1 102.0 2.3
55–64 2,732 14.0 104.6 5,878 15.2 225.0 2.2
65–74 4,566 23.4 250.4 9,057 23.4 496.8 2.0
75–84 5,083 26.0 496.4 9,562 24.7 933.8 1.9
85+ 4,276 21.9 985.0 7,492 19.3 1,725.7 1.8
Sex
Male 9,185 47.1 90.5 18,245 47.1 176.9 2.0
Female 10,317 52.9 79.8 20,169 52.0 158.6 2.0
Total(b) 19,518 100.0 85.2 38,760 100.0 169.2 2.0
Total (subsidised and under co-payment)
Age group (years)
<15 270 1.2 6.2 504 1.2 11.7 1.9
15–24 350 1.6 11.3 605 1.4 19.6 1.7
25–34 587 2.6 17.6 1,102 2.5 33.1 1.9
35–44 1,109 5.0 34.6 2,272 5.3 71.0 2.0
45–54 1,972 8.8 64.3 4,161 9.6 135.7 2.1
55–64 3,491 15.7 133.6 7,165 16.6 274.3 2.1
65–74 4,822 21.6 264.5 9,444 21.8 518.0 2.0
75–84 5,243 23.5 512.0 9,828 22.7 959.8 1.9
85+ 4,427 19.9 1,019.7 7,771 18.0 1,790.0 1.8
Sex
Male 10,574 47.4 92.7 20,425 47.2 179.1 1.9
Female 11,697 52.5 101.7 22,427 51.8 194.9 1.9
Total(b) 22,287 100.0 97.3 43,265 100.0 188.9 1.9
(a) Crude rate is based on the preliminary Australian estimated resident population as at 31 December 2011 and is expressed per 100,000 populations (see Appendix C).
(b) The totals include patients for whom gender and/or age-group was not available and so summing the columns will not equal the total numbers.
Source: PBS/RPBS palliative care schedule data (Australian Government Department of Health).
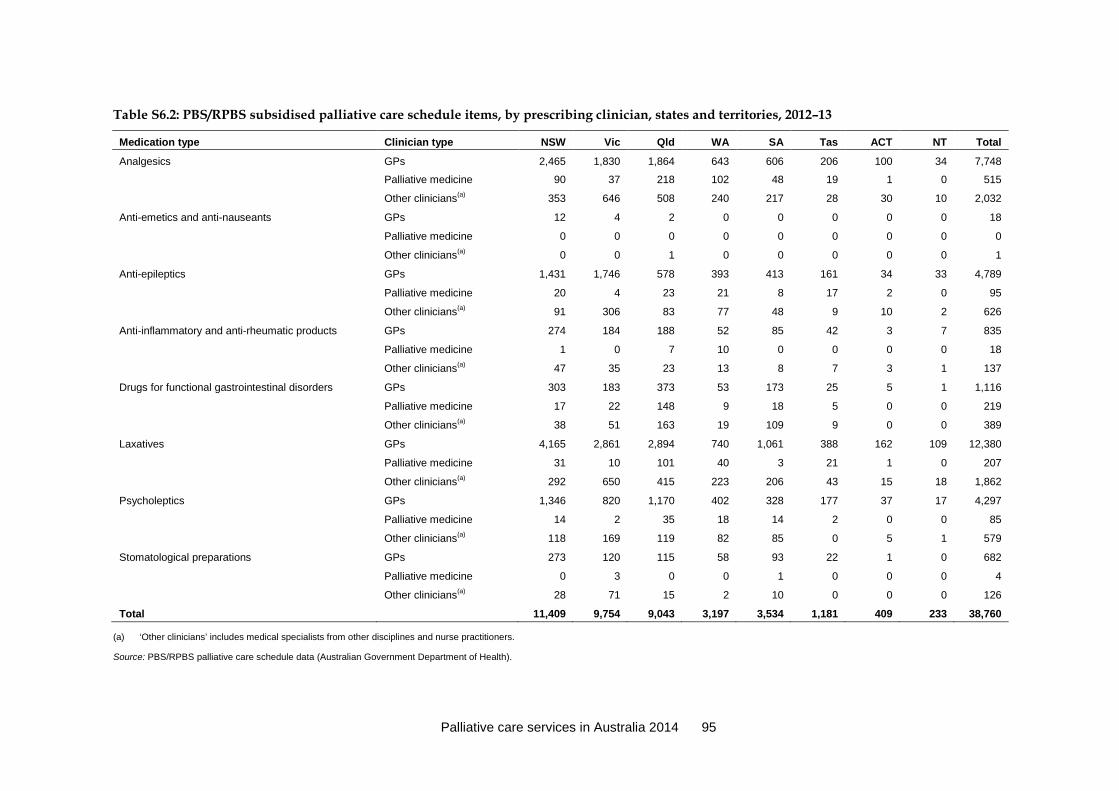
Palliative care services in Australia 2014 95
Table S6.2: PBS/RPBS subsidised palliative care schedule items, by prescribing clinician, states and territories, 2012–13
Medication type Clinician type NSW Vic Qld WA SA Tas ACT NT Total
Analgesics GPs 2,465 1,830 1,864 643 606 206 100 34 7,748
Palliative medicine
90 37 218 102 48 19 1 0 515
Other clinicians(a) 353 646 508 240 217 28 30 10 2,032
Anti-emetics and anti-nauseants GPs 12 4 2 0 0 0 0 0 18
Palliative medicine
0 0 0 0 0 0 0 0 0
Other clinicians(a) 0 0 1 0 0 0 0 0 1
Anti-epileptics GPs 1,431 1,746 578 393 413 161 34 33 4,789
Palliative medicine
20 4 23 21 8 17 2 0 95
Other clinicians(a) 91 306 83 77 48 9 10 2 626
Anti-inflammatory and anti-rheumatic products GPs 274 184 188 52 85 42 3 7 835
Palliative medicine
1 0 7 10 0 0 0 0 18
Other clinicians(a) 47 35 23 13 8 7 3 1 137
Drugs for functional gastrointestinal disorders GPs 303 183 373 53 173 25 5 1 1,116
Palliative medicine
17 22 148 9 18 5 0 0 219
Other clinicians(a) 38 51 163 19 109 9 0 0 389
Laxatives GPs 4,165 2,861 2,894 740 1,061 388 162 109 12,380
Palliative medicine
31 10 101 40 3 21 1 0 207
Other clinicians(a) 292 650 415 223 206 43 15 18 1,862
Psycholeptics GPs 1,346 820 1,170 402 328 177 37 17 4,297
Palliative medicine
14 2 35 18 14 2 0 0 85
Other clinicians(a) 118 169 119 82 85 0 5 1 579
Stomatological preparations GPs 273 120 115 58 93 22 1 0 682
Palliative medicine
0 3 0 0 1 0 0 0 4
Other clinicians(a) 28 71 15 2 10 0 0 0 126
Total 11,409 9,754 9,043 3,197 3,534 1,181 409 233 38,760
(a) ‘Other clinicians’ includes medical specialists from other disciplines and nurse practitioners. Source: PBS/RPBS palliative care schedule data (Australian Government Department of Health).

96 Palliative care services in Australia 2014
Table S6.3: Total (PBS/RPBS subsidised and under co-payment) palliative care schedule items, by prescribing clinician, states and territories, 2012–13
Medication type Clinician type NSW Vic Qld WA SA Tas ACT NT Total
Analgesics GPs 2,552 1,908 1,957 660 628 219 112 42 8,078
Palliative medicine
95 37 223 110 48 19 1 0 533
Other clinicians(a) 367 684 527 251 229 30 31 10 2,129
Anti-emetics and anti-nauseants GPs 12 4 2 0 0 0 0 0 18
Palliative medicine
0 0 0 0 0 0 0 0 0
Other clinicians(a) 0 0 1 0 0 0 0 0 1
Anti-epileptics GPs 1,890 2,109 730 502 494 189 56 45 6,015
Palliative medicine
25 6 35 27 10 20 2 0 125
Other clinicians(a) 195 460 158 134 93 12 12 7 1,071
Anti-inflammatory and anti-rheumatic products GPs 467 357 385 135 158 73 11 18 1,604
Palliative medicine
1 0 7 11 0 0 0 0 19
Other clinicians(a) 80 79 46 33 25 8 4 1 276
Drugs for functional gastrointestinal disorders GPs 306 184 376 53 174 25 5 1 1,124
Palliative medicine
17 22 151 9 18 5 0 0 222
Other clinicians(a) 39 52 166 25 110 9 0 0 401
Laxatives GPs 4,317 2,940 3,030 787 1,110 394 182 123 12,883
Palliative medicine
31 10 105 50 3 22 1 0 222
Other clinicians(a) 321 719 465 267 226 46 16 21 2,081
Psycholeptics GPs 1,523 928 1,279 452 374 192 52 19 4,819
Palliative medicine
14 2 43 21 15 2 1 0 98
Other clinicians(a) 150 197 135 105 103 2 6 2 700
Stomatological preparations GPs 279 123 118 59 94 22 1 0 696
Palliative medicine
0 4 0 0 3 0 0 0 7
Other clinicians(a) 29 84 17 2 11 0 0 0 143
Total 12,710 10,909 9,956 3,693 3,926 1,289 493 289 43,265
(a) ‘Other clinicians’ includes medical specialists from other disciplines and nurse practitioners. Source: PBS/RPBS palliative care schedule data (Australian Government Department of Health).

Palliative care services in Australia 2014 97
Table S6.4: Palliative care schedule items by medication type, by prescribing clinician, 2008–09 to 2012–13
Medication type 2008–09 2009–10 2010–11 2011–12 2012–13
Average annual
change (per
cent)
GPs
Analgesics 2,188 2,490 3,209 5,860 7,748 37.2
Anti-emetics and anti-nauseants 840 715 822 1,351 18 –61.7
Anti-epileptics 5,837 5,512 5,287 4,530 4,789 –4.8
Anti-inflammatory and anti-rheumatic products 808 618 619 838 835 0.8
Drugs for functional gastrointestinal disorders 770 774 773 880 1,116 9.7
Laxatives 8,624 7,264 7,310 11,613 12,380 9.5
Psycholeptics 8,448 7,417 6,151 4,219 4,297 –15.5
Stomatological preparations 384 422 420 642 682 15.4
Total 27,899 25,212 24,591 29,933 31,865 3.4
Palliative medicine specialists
Analgesics 225 338 384 433 515 23.0
Anti-emetics and anti-nauseants 17 14 7 11 0 –100.0
Anti-epileptics 79 73 69 71 95 4.7
Anti-inflammatory and anti-rheumatic products 7 5 9 4 18 26.6
Drugs for functional gastrointestinal disorders 42 22 43 101 219 51.1
Laxatives 63 57 90 110 207 34.6
Psycholeptics 40 39 45 44 85 20.7
Stomatological preparations 3 11 3 6 4 7.5
Total 476 559 650 780 1,143 24.5
Other clinicians(a)
Analgesics 829 999 1,235 1,763 2,032 25.1
Anti-emetics and anti-nauseants 78 94 95 189 1 –66.4
Anti-epileptics 770 650 712 666 626 –5.0
Anti-inflammatory and anti-rheumatic products 102 75 140 242 137 7.7
Drugs for functional gastrointestinal disorders 124 99 181 348 389 33.1
Laxatives 571 557 917 1,793 1,862 34.4
Psycholeptics 517 384 430 452 579 2.9
Stomatological preparations 39 25 31 97 126 34.1
Total 3,030 2,883 3,741 5,550 5,752 17.4
(a) ‘Other clinicians’ includes medical specialists from other disciplines and nurse practitioners. Source: PBS/RPBS palliative care schedule data (Australian Government Department of Health).
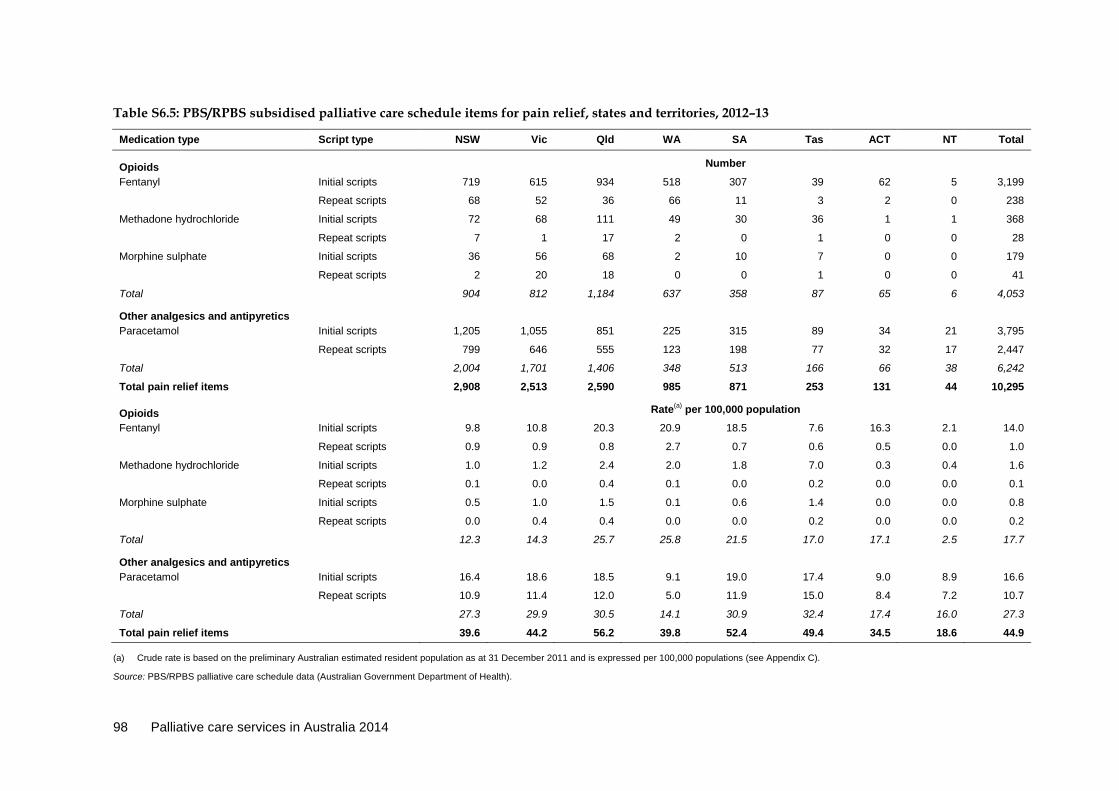
98 Palliative care services in Australia 2014
Table S6.5: PBS/RPBS subsidised palliative care schedule items for pain relief, states and territories, 2012–13
Medication type Script type NSW Vic Qld WA SA Tas ACT NT Total
Opioids
Number
Fentanyl Initial scripts 719 615 934 518 307 39 62 5 3,199
Repeat scripts 68 52 36 66 11 3 2 0 238
Methadone hydrochloride Initial scripts 72 68 111 49 30 36 1 1 368
Repeat scripts 7 1 17 2 0 1 0 0 28
Morphine sulphate Initial scripts 36 56 68 2 10 7 0 0 179
Repeat scripts 2 20 18 0 0 1 0 0 41
Total 904 812 1,184 637 358 87 65 6 4,053
Other analgesics and antipyretics
Paracetamol Initial scripts 1,205 1,055 851 225 315 89 34 21 3,795
Repeat scripts 799 646 555 123 198 77 32 17 2,447
Total 2,004 1,701 1,406 348 513 166 66 38 6,242
Total pain relief items 2,908 2,513 2,590 985 871 253 131 44 10,295
Opioids
Rate(a) per 100,000 population
Fentanyl Initial scripts 9.8 10.8 20.3 20.9 18.5 7.6 16.3 2.1 14.0
Repeat scripts 0.9 0.9 0.8 2.7 0.7 0.6 0.5 0.0 1.0
Methadone hydrochloride Initial scripts 1.0 1.2 2.4 2.0 1.8 7.0 0.3 0.4 1.6
Repeat scripts 0.1 0.0 0.4 0.1 0.0 0.2 0.0 0.0 0.1
Morphine sulphate Initial scripts 0.5 1.0 1.5 0.1 0.6 1.4 0.0 0.0 0.8
Repeat scripts 0.0 0.4 0.4 0.0 0.0 0.2 0.0 0.0 0.2
Total 12.3 14.3 25.7 25.8 21.5 17.0 17.1 2.5 17.7
Other analgesics and antipyretics
Paracetamol Initial scripts 16.4 18.6 18.5 9.1 19.0 17.4 9.0 8.9 16.6
Repeat scripts 10.9 11.4 12.0 5.0 11.9 15.0 8.4 7.2 10.7
Total 27.3 29.9 30.5 14.1 30.9 32.4 17.4 16.0 27.3
Total pain relief items 39.6 44.2 56.2 39.8 52.4 49.4 34.5 18.6 44.9
(a) Crude rate is based on the preliminary Australian estimated resident population as at 31 December 2011 and is expressed per 100,000 populations (see Appendix C).
Source: PBS/RPBS palliative care schedule data (Australian Government Department of Health).

Palliative care services in Australia 2014 99
Table S6.6: Total (PBS/RPBS subsidised and under co-payment) palliative care schedule items for pain relief, states and territories, 2012–13
Medication type Script type NSW Vic Qld WA SA Tas ACT NT Total
Opioids
Number Fentanyl Initial scripts 719 615 934 518 307 39 62 5 3,199
Repeat scripts 68 52 36 66 11 3 2 0 238
Methadone hydrochloride Initial scripts 72 68 111 49 30 36 1 1 368
Repeat scripts 7 1 17 2 0 1 0 0 28
Morphine sulphate Initial scripts 36 56 68 2 10 7 0 0 179
Repeat scripts 2 20 18 0 0 1 0 0 41
Total 904 812 1,184 637 358 87 65 6 4,053
Other analgesics and antipyretics
Paracetamol Initial scripts 1,205 1,055 851 225 315 89 34 21 3,795
Repeat scripts 799 646 555 123 198 77 32 17 2,447
Total 2,004 1,701 1,406 348 513 166 66 38 6,242
Total pain relief items 2,908 2,513 2,590 985 871 253 131 44 10,295
Opioids
Rate(a) per 100,000 population Fentanyl Initial scripts 9.8 10.8 20.3 20.9 18.5 7.6 16.3 2.1 14.0
Repeat scripts 0.9 0.9 0.8 2.7 0.7 0.6 0.5 0.0 1.0
Methadone hydrochloride Initial scripts 1.0 1.2 2.4 2.0 1.8 7.0 0.3 0.4 1.6
Repeat scripts 0.1 0.0 0.4 0.1 0.0 0.2 0.0 0.0 0.1
Morphine sulphate Initial scripts 0.5 1.0 1.5 0.1 0.6 1.4 0.0 0.0 0.8
Repeat scripts 0.0 0.4 0.4 0.0 0.0 0.2 0.0 0.0 0.2
Total 12.3 14.3 25.7 25.8 21.5 17.0 17.1 2.5 17.7
Other analgesics and antipyretics
Paracetamol Initial scripts 16.4 18.6 18.5 9.1 19.0 17.4 9.0 8.9 16.6
Repeat scripts 10.9 11.4 12.0 5.0 11.9 15.0 8.4 7.2 10.7
Total 27.3 29.9 30.5 14.1 30.9 32.4 17.4 16.0 27.3
Total pain relief items 39.6 44.2 56.2 39.8 52.4 49.4 34.5 18.6 44.9
(a) Crude rate is based on the preliminary Australian estimated resident population as at 31 December 2011 and is expressed per 100,000 populations (see Appendix C).
Source: PBS/RPBS palliative care schedule data (Australian Government Department of Health).
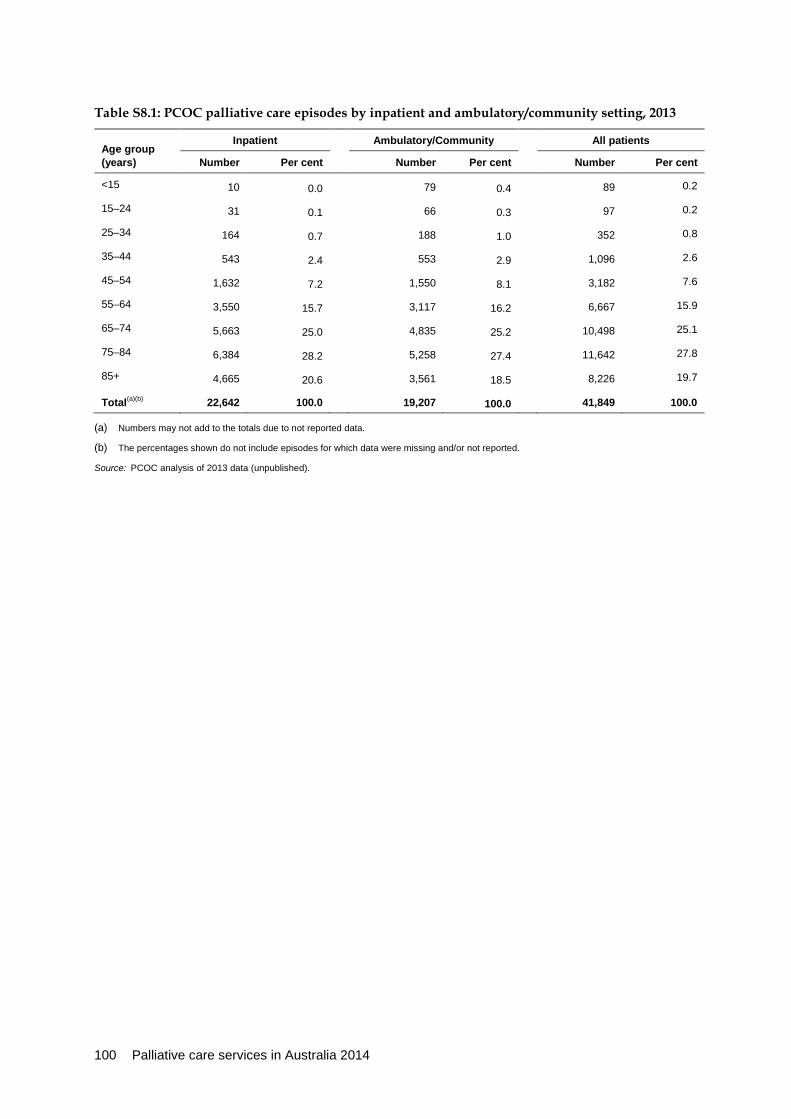
100 Palliative care services in Australia 2014
Table S8.1: PCOC palliative care episodes by inpatient and ambulatory/community setting, 2013
Age group (years)
Inpatient Ambulatory/Community All patients
Number Per cent Number Per cent Number Per cent
<15 10 0.0 79 0.4 89 0.2
15–24 31 0.1 66 0.3 97 0.2
25–34 164 0.7 188 1.0 352 0.8
35–44 543 2.4 553 2.9 1,096 2.6
45–54 1,632 7.2 1,550 8.1 3,182 7.6
55–64 3,550 15.7 3,117 16.2 6,667 15.9
65–74 5,663 25.0 4,835 25.2 10,498 25.1
75–84 6,384 28.2 5,258 27.4 11,642 27.8
85+ 4,665 20.6 3,561 18.5 8,226 19.7
Total(a)(b) 22,642 100.0 19,207 100.0 41,849 100.0
(a) Numbers may not add to the totals due to not reported data. (b) The percentages shown do not include episodes for which data were missing and/or not reported.
Source: PCOC analysis of 2013 data (unpublished).
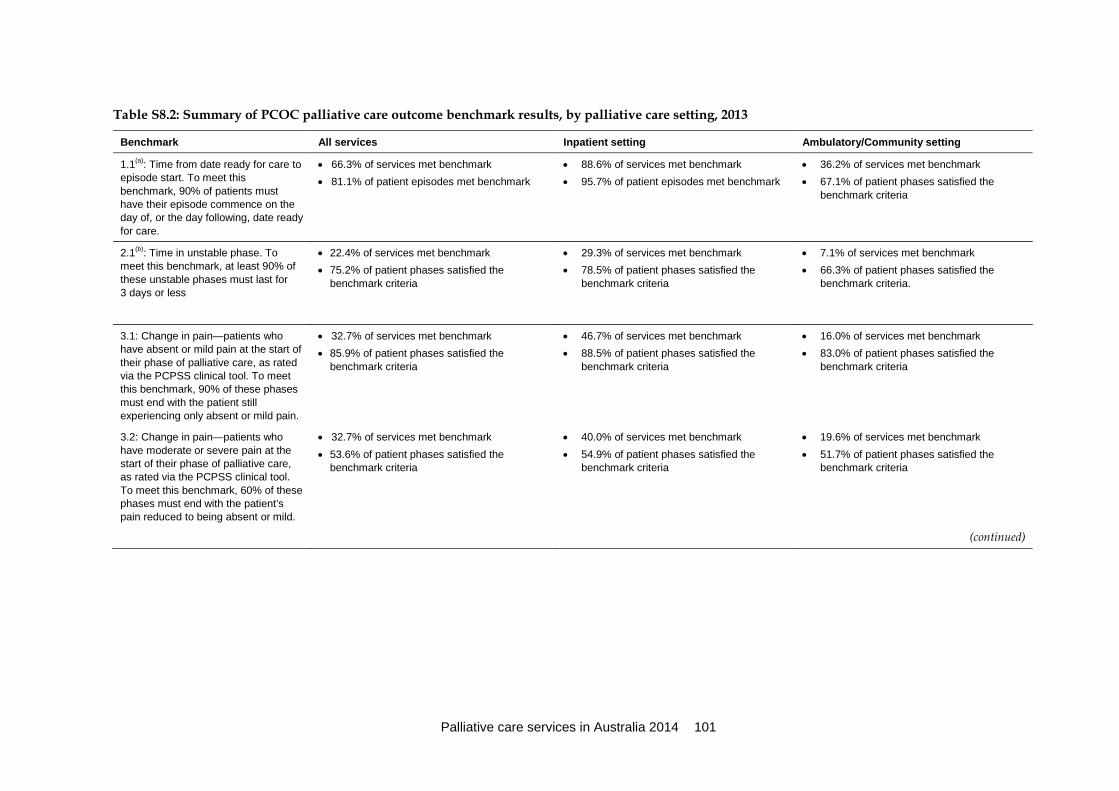
Palliative care services in Australia 2014 101
Table S8.2: Summary of PCOC palliative care outcome benchmark results, by palliative care setting, 2013
Benchmark All services Inpatient setting Ambulatory/Community setting
1.1(a): Time from date ready for care to episode start. To meet this benchmark, 90% of patients must have their episode commence on the day of, or the day following, date ready for care.
• 66.3% of services met benchmark • 81.1% of patient episodes met benchmark
• 88.6% of services met benchmark • 95.7% of patient episodes met benchmark
• 36.2% of services met benchmark • 67.1% of patient phases satisfied the
benchmark criteria
2.1(b): Time in unstable phase. To meet this benchmark, at least 90% of these unstable phases must last for 3 days or less
• 22.4% of services met benchmark • 75.2% of patient phases satisfied the
benchmark criteria
• 29.3% of services met benchmark • 78.5% of patient phases satisfied the
benchmark criteria
• 7.1% of services met benchmark • 66.3% of patient phases satisfied the
benchmark criteria.
3.1: Change in pain—patients who have absent or mild pain at the start of their phase of palliative care, as rated via the PCPSS clinical tool. To meet this benchmark, 90% of these phases must end with the patient still experiencing only absent or mild pain.
• 32.7% of services met benchmark • 85.9% of patient phases satisfied the
benchmark criteria
• 46.7% of services met benchmark • 88.5% of patient phases satisfied the
benchmark criteria
• 16.0% of services met benchmark • 83.0% of patient phases satisfied the
benchmark criteria
3.2: Change in pain—patients who have moderate or severe pain at the start of their phase of palliative care, as rated via the PCPSS clinical tool. To meet this benchmark, 60% of these phases must end with the patient’s pain reduced to being absent or mild.
• 32.7% of services met benchmark • 53.6% of patient phases satisfied the
benchmark criteria
• 40.0% of services met benchmark • 54.9% of patient phases satisfied the
benchmark criteria
• 19.6% of services met benchmark • 51.7% of patient phases satisfied the
benchmark criteria
(continued)
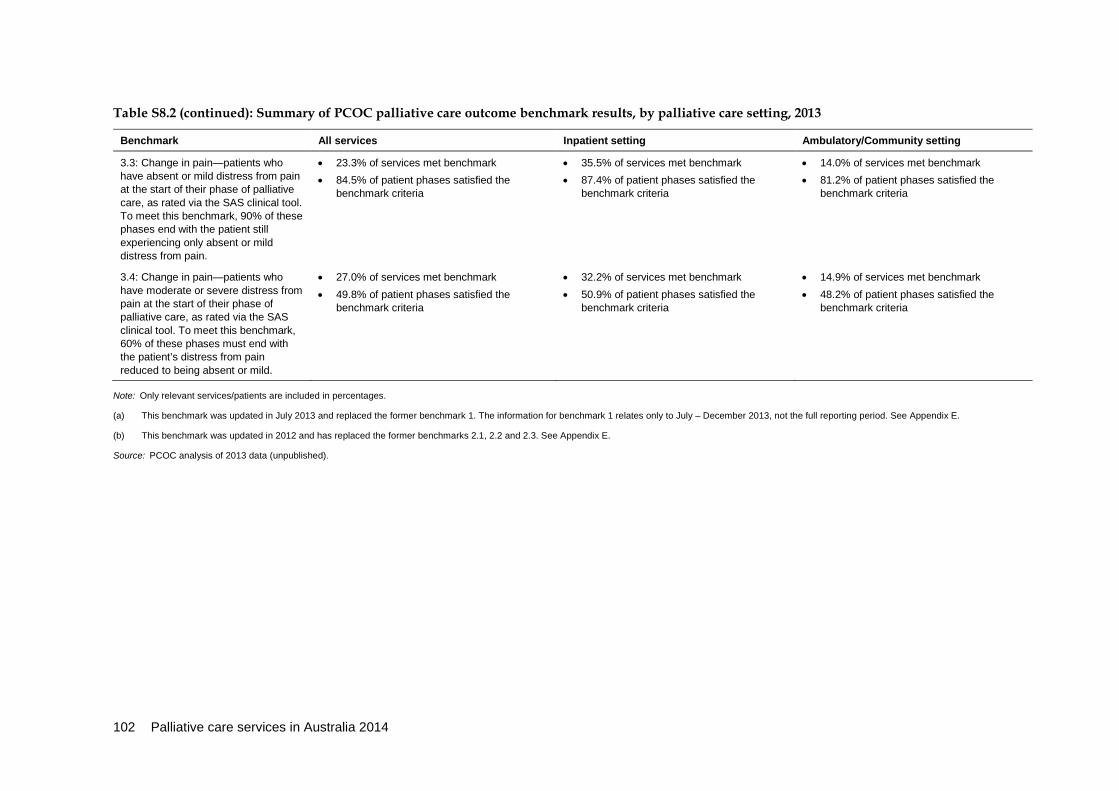
102 Palliative care services in Australia 2014
Table S8.2 (continued): Summary of PCOC palliative care outcome benchmark results, by palliative care setting, 2013
Benchmark All services Inpatient setting Ambulatory/Community setting
3.3: Change in pain—patients who have absent or mild distress from pain at the start of their phase of palliative care, as rated via the SAS clinical tool. To meet this benchmark, 90% of these phases end with the patient still experiencing only absent or mild distress from pain.
• 23.3% of services met benchmark • 84.5% of patient phases satisfied the
benchmark criteria
• 35.5% of services met benchmark • 87.4% of patient phases satisfied the
benchmark criteria
• 14.0% of services met benchmark • 81.2% of patient phases satisfied the
benchmark criteria
3.4: Change in pain—patients who have moderate or severe distress from pain at the start of their phase of palliative care, as rated via the SAS clinical tool. To meet this benchmark, 60% of these phases must end with the patient’s distress from pain reduced to being absent or mild.
• 27.0% of services met benchmark • 49.8% of patient phases satisfied the
benchmark criteria
• 32.2% of services met benchmark • 50.9% of patient phases satisfied the
benchmark criteria
• 14.9% of services met benchmark • 48.2% of patient phases satisfied the
benchmark criteria
Note: Only relevant services/patients are included in percentages. (a) This benchmark was updated in July 2013 and replaced the former benchmark 1. The information for benchmark 1 relates only to July – December 2013, not the full reporting period. See Appendix E.
(b) This benchmark was updated in 2012 and has replaced the former benchmarks 2.1, 2.2 and 2.3. See Appendix E.
Source: PCOC analysis of 2013 data (unpublished).

Palliative care services in Australia 2014 103
Appendix A: Identifying palliative care separations The aim of Chapter 2 in this report is to quantify and describe separations in admitted patient settings for which palliation was a substantial component of the care provided. Two NHMD data items—‘Care type’ and ‘Diagnosis’— capture information on palliative care. The question is whether these two data items should be used to identify palliative care separations. The AIHW explored this question in some detail with the findings released in a technical paper, Identifying palliative care separations in admitted patient data: technical paper (AIHW 2011b).
‘Care type’ data item A ‘Care type’ is assigned for each admitted patient separation, with any one separation equal to either a total hospital stay (from admission to discharge, transfer or death) or to a portion of a hospital stay beginning or ending in a change of care type (for example, from a ‘Care type’ of Acute care to a ‘Care type’ of Palliative care). Such a change in ‘Care type’ leads to a statistical discharge (for the stated example, this would result in the end of the Acute care separation) and a corresponding statistical admission (for example, the start of the Palliative care separation).
One of the categories for the NHMD ‘Care type’ data item is Palliative care, with Palliative care defined as follows (AIHW 2013a):
Palliative care is care in which the clinical intent or treatment goal is primarily quality of life for a patient with an active, progressive disease with little or no prospect of cure. It is usually evidenced by an interdisciplinary assessment and/or management of the physical, psychological, emotional and spiritual needs of the patient; and a grief and bereavement support service for the patient and their carers/family. It includes care provided: • in a palliative care unit • in a designated palliative care program, or • under the principal clinical management of a palliative care physician or, in the
opinion of the treating doctor, when the principal clinical intent of care is palliation.
‘Diagnosis’ data items In addition to the information on the provision of palliative care collected via the ‘Care type’ data item, information on palliative care is also recorded in the NHMD under the ‘Diagnosis’ data items. In Australian hospitals, a principal diagnosis is assigned during each separation; as well, one or more additional diagnoses may also be assigned. The principal diagnosis is ‘the diagnosis established after study to be chiefly responsible for occasioning an episode of admitted patient care’ (AIHW 2012b; NCCH 2010). Additional diagnoses are ‘conditions or complaints either coexisting with the principal diagnosis or arising during the episode of admitted patient care’; such diagnoses give information on the ‘conditions that were significant in terms of treatment required, investigations needed and resources used during the episode of care’ (AIHW 2012b; NCCH 2010).
104 Palliative care services in Australia 2014
The classification used nationally to assign diagnosis codes since 1999–00 is the ICD-10-AM (see Appendix D); one of the codes in that classification—Z51.5—is Palliative care. While diagnosis codes usually describe a disease, injury or poisoning, they can also be used in certain instances to indicate the specific care or service provided for a current condition or other reasons for separation (AIHW 2009). This is the case when Palliative care is recorded as a diagnosis code.
A specific ICD-10-AM coding standard—standard ‘0224’—applies to the recording of Palliative care as a diagnosis (NCCH 2010). This coding standard has two parts: a definition of palliative care and classification rules. The definition of Palliative care in the coding standard, and thus the one used to assign Palliative care as a diagnosis, is the same as the definition used for the ‘Care type’ data item. That is, as for ‘Care type’, Palliative care as a diagnosis is defined to include care provided in a palliative care unit or in a designated palliative care program; or under the principal clinical management of a palliative care physician; or, in the option of the treating doctor, when the principal clinical intent of care is palliation. The classification rules in the coding standard provide an additional instruction (which does not apply when assigning Palliative care as the ‘Care type’) on when palliative care should be assigned as a diagnosis code. The instruction is as follows (NCCH 2010):
Palliative care should be assigned (as an additional diagnosis code) when the intent of care at admission is ‘for palliation’ or if at any time during the admission the intent of care becomes ‘for palliation’ and the care provided to the patient meets the definition above. [emphasis added]
Thus, while the clinical intent of the entire separation is considered to be palliation when Palliative care is assigned as a ‘Care type’, when a diagnosis code of Palliative care is assigned, palliation may have been the clinical intent during either part or all of the separation.
Note that, based on the collection and coding rules, it could be argued that there should not be any separations in which palliation was the clinical intent of care for just part of the separation. That is, since the ‘Care type’ data item is meant to describe the clinical intent of the entire separation, when the clinical intent of a separation changes to become palliation (and thus a diagnosis code of Palliative care is assigned), a statistical discharge from the original care type should occur, along with a corresponding statistical admission with a ‘Care type’ of Palliative care. Thus, for every separation in which a diagnosis of Palliative care is recorded, one might also expect a corresponding ‘Care type’ of Palliative care. Data from the NHMD indicate that such a one-to-one correspondence is not observed in the Australian admitted patient data. There were clear jurisdictional differences in the level of congruence between the coding of ‘Care type’ and diagnosis items.
Identifying palliative care separations For the purposes of this report, palliative care separations are identified using both ‘Care type’ and diagnosis information such that if either (or both) has a code of Palliative care, that separation is included (see AIHW 2011b for further information). This approach allows one to identify those separations in admitted patient settings for which a substantial component of the care was palliation. To make it clear that for some of these separations palliative care may have been the clinical intent for part (not all) of the separation, a palliative care separation is described in this report as ‘a separation for which the principal clinical intent of the care was palliation during part or all of that separation’.
Palliative care services in Australia 2014 105
Note that, at its March 2011 meeting, the Palliative Care Working Group endorsed the use of both ‘Care type’ and diagnosis information to identify those separations in admitted patient settings for which palliative care was a substantial component of the care provided.

106 Palliative care services in Australia 2014
Appendix B: Data sources This appendix describes the data sources used to complete the analyses detailed in this report.
Bettering the Evaluation and Care of Health survey The BEACH survey of general practice activity is a survey undertaken by the Family Medicine Research Centre at the University of Sydney. For each year’s data collection, a random sample of about 1,000 GPs each report details of 100 consecutive GP encounters of all types on structured encounter forms. Each form collects information about the consultations (for example, date and type of consultation), the patient (for example, date of birth, sex, and reasons for encounter), the problems managed and the management of each problem (for example, treatment provided, prescriptions and referrals). Data on patient risk factors, health status and GP characteristics are also collected.
Additional information on the 2012–13 BEACH survey can be obtained from General practice activity in Australia 2012–13 (Britt et al. 2013).
National Health Workforce Data Sets In 2010, the National Registration and Accreditation Scheme (NRAS) was introduced and the AIHW Medical Labour Force Survey was replaced with the Medical Workforce Survey. The new national health workforce surveys are administered to all registered health practitioners by the Australian Health Practitioners Regulation Agency (AHPRA) and are included as part of the registration renewal process. The workforce surveys are voluntary. The Medical Workforce Survey is used to provide nationally consistent estimates of the medical workforce. It provides data not readily available from other sources, such as on the type of work done by, and job setting of, medical practitioners; the number of hours worked in a clinical or non-clinical role, and in total; and the numbers of years worked in, and intended to remain in, the health workforce. The survey also provides information on those registered medical practitioners who are not undertaking clinical work or who are not employed. The information from the NRAS workforce surveys, combined with NRAS registration data items, comprises the NHWDS.
The overall response rate to the Medical Workforce Survey in 2012 was 90.1%, which was higher than any previous AIHW Medical Labour Force Survey (Table B.2, AIHW 2014a). Victoria, New South Wales and the Australian Capital Territory had the highest response rates at 91.4%, 91.3% and 90.5%, respectively. Western Australia had the lowest response rate at 84.7%.
Responses to the surveys have been weighted to benchmark figures to account for non-response based on registration data supplied by the AHPRA. For medical practitioners, the benchmarks used are the number of medical practitioners registered by state and territory (using principal address) by main specialty of practice by sex and age group.
Past and present surveys have different collection and estimation methodologies, questionnaire designs and response rates. As a result, care should be taken in comparing historical data from the AIHW Labour Force Surveys with data from the NHWDS.
Palliative care services in Australia 2014 107
A detailed description of the Medical Workforce Survey 2012, including a summary of changes from the previous AIHW Medical Labour Force Survey is provided, in Appendix B of the Medical Workforce 2012 report (AIHW 2014a).
National Hospital Morbidity Database The data source for the chapter on admitted patient palliative care was the NHMD. These data pertain to admitted patients in public and private hospitals in Australia. Some of these hospitals have hospices affiliated with them.
The NHMD includes administrative data, demographic information on patients, and clinical information including diagnoses and procedures performed. This annual collection is compiled and maintained by the AIHW, using data supplied by state and territory health authorities. Information from almost all hospitals in Australia is included in the database: from public acute and public psychiatric hospitals, private acute and psychiatric hospitals, and from private free-standing day hospital facilities (AIHW 2013a).
Episode-based data The NHMD is episode based, with the term ‘separation’ used to refer to an episode of admitted patient care; individual patients may have multiple separations ending in discharge, transfer or statistical discharge with a change in care type (see ‘Key concepts’ box in Chapter 2) and ultimately death. Each record in the NHMD is based on a single phase of treatment for an admitted patient, with such phases classified in the ‘Care type’ data item as Acute care, Palliative care, Rehabilitation care, Newborn and other types of care. When a patient receives only one type of care during a hospital stay (such as only Acute care or only Palliative care), the length of stay for that separation is equal to the total length of time the patient spent in hospital during that stay. However, where patients receive different types of care during one hospital stay (for example, a person may be admitted for active cancer treatment but then later reclassified as a palliative care patient), the patient may be statistically discharged from the hospital after the first type of care and then statistically admitted into a second phase of care. Thus, patients may have two or more separations during any one hospital stay. Since each record within the NHMD is based on an episode of care, the separation count is a count of episodes, not persons. Data from the PCOC suggest that a relatively small proportion (14%) of patients in Australia have two or more separations for palliative care within a 12-month period (Currow et al. 2008).
Coverage For each of the years considered in this report, the coverage of the NHMD has been very good. For 2011–12, coverage for the NHMD was essentially complete: data from all public hospitals were included except for a small mothercraft hospital in the Australian Capital Territory. As well, the great majority of private hospitals were also included, with the exceptions being the private day hospital facilities in the Australian Capital Territory, and the single private free-standing day hospital facility in the Northern Territory.
Hospitals may be re-categorised as public or private between or within years (see AIHW 2013a for further information). This should be taken into account when comparing data by sector over time.

108 Palliative care services in Australia 2014
Data on state of hospitalisations should be interpreted with caution because of cross-border flows of patients. This is particularly the case for the Australian Capital Territory. In 2011–12, about 20% of separations for Australian Capital Territory were for patients who resided in New South Wales.
The Indigenous status data are of sufficient quality for statistical reporting purposes for all hospitalisations. An estimated 88% of Indigenous patients were correctly identified in Australian public hospital admission records in 2011–12. Based on the results of the survey data, a correction factor of 1.09 was calculated, suggesting that the ‘true’ number of Indigenous persons should be about 9% higher than indicated in the hospital record (AIHW 2013b).
Standard admitted patient care data exclusions As per the standard practice when analysing admitted patient data in the NHMD, the data presented in this report exclude those records for which the ‘Care type’ data item was reported as Newborn (unqualified days only), Hospital boarder or Posthumous organ procurement.
Further information Comprehensive hospital statistics from the NHMD are released by the AIHW on an annual basis (for example, AIHW 2009, 2010c, 2011a, 2012a, 2013a) and further information about the NHMD can be obtained from those publications. Metadata information for the NMDSs that are the basis for the AIHW National Hospital Databases are published in the AIHW’s online metadata registry—METeOR, and the National health data dictionary, which can be accessed on the AIHW website: <http://meteor.aihw.gov.au/content/index.phtml/itemId/181162> <http://www.aihw.gov.au/publication-detail/?id=10737422826>. In those reports, information from the ‘Care type’ data item only (and not diagnosis information) has been used to identify palliative care separations. Thus, the information on palliative care separations presented there will not match the information presented in this report (see Appendix A for additional information on the identification of palliative care separations).
A complete data quality statement for the NHMD database is available online at <http://meteor.aihw.gov.au/content/index.phtml/itemId/529483>.
National Public Hospital Establishments Database The NPHED holds establishment-level data for each public hospital in Australia, including public acute hospitals, psychiatric hospitals, drug and alcohol hospitals, and dental hospitals in all states and territories. The collection covers hospitals within the jurisdiction of the state and territory health authorities only. Hence, public hospitals not administered by the state and territory health authorities (hospitals operated by the Australian Government Department of Health, Department of Defence or correctional authorities, for example, and hospitals located in offshore territories) are not included. The collection does not include data for private hospitals.
The collection is based on the NMDS for public hospital establishments. Information is included on the hospital’s resources, expenditure, average available bed numbers, peer
Palliative care services in Australia 2014 109
group, and the statistical local area and remoteness area of its location. Essentially all public hospitals were included for 2011–12.
For more information on the data collection method and other relevant data issues, refer to the NPHED data quality statement at <http://meteor.aihw.gov.au/content/index.phtml/itemId/529474>.
Data on geographical location Data on geographical location are collected on hospitals in the NPHED and on the area of usual residence of patients in the NHMD and the Non-Admitted Patient Emergency Department Care Database. These data have been provided as state or territory and Statistical Local Area (SLA), a small area unit within the ABS’s ASGS, and/or postcode, and have been aggregated to remoteness areas.
The Remoteness area of hospital presented in this section was based on the ABS 2011 Australian Statistical Geography Standard (ABS 2011).
The ASGS’s remoteness structure categorises geographical areas in Australia into remoteness areas, described in detail on the ABS website <www.abs.gov.au>.
The classification is as follows:
• Major cities • Inner regional • Outer regional • Remote • Very remote.
Geographical location of hospital The remoteness area of each public hospital was determined on the basis of its SLA. For 2011–12, the geographical location was updated to align with the ABS’s ASGS Remoteness Structure 2011.
National Standards Assessment Program The PCA has developed the National Palliative Care Standards in collaboration with the palliative care sector. The NSAP has been designed as a quality improvement program for participating specialist palliative care services which undertake self-assessment and monitoring against the 4th edition of the PCA Standards for providing quality palliative care for all Australians (PCA 2005b) (the Standards).
Participating services are asked to self-assess against the Standards’ quality elements and then assign ‘high’, ‘medium’ or ‘low’ levels of priority to their perceived need for improvement against each of the 13 Standards. Services are also asked to provide action plans for quality improvement, which are subjected to thematic coding by the NSAP to identify categories of quality improvement action across Australia. The current report provides the aggregated results from all 140 services submitting Cycle 1 results over NSAP’s first 3 years (to 30 June 2013). A total of 51 services have gone on to submit their Cycle 2 self-assessment snapshot results.

110 Palliative care services in Australia 2014
Additional information on the NSAP can be obtained from the NSAP national quality report (available on the NSAP website <www.nsap.palliativecare.org.au>).
Palliative Care Outcomes Collaboration The PCOC is a national program using standardised validated clinical assessment tools to benchmark and measure outcomes in palliative care. Participation in the PCOC is voluntary and open to all palliative care service providers across Australia. Representation is sought from public and private health sectors, rural and metropolitan areas, and inpatient and ambulatory settings. The PCOC data set includes the following clinical assessment tools: Palliative Care Phase, PCPSS, SAS, Australia-modified Karnofsky Performance Status Scale, and RUG—ADL. The PCOC aims to assist services to improve the quality of the palliative care it provides through the analysis and benchmarking of patient outcomes.
The national figures used in this report reflect all palliative care services that submitted data for the January–December 2013 period. A full list of these services can be found at <www.pcoc.org.au>.
Population data Throughout this report, estimated resident population data were used to derive age-standardised rates. The population data were sourced from the ABS and the most up-to-date estimates available at the time of analysis were used.
To derive estimates of the resident population, the ABS uses the 5-yearly Census of Population and Housing data as follows:
• All respondents to the Census are coded in relation to their state or territory, statistical local area and postcode of usual residence; overseas visitors are excluded.
• An adjustment is made for persons missed in the Census (approximately 2%). • Australians temporarily overseas on Census night are added to the usual residence
Census count. The resulting numbers provide an estimate of the resident population in the Census year. In the following years, the Census numbers are adjusted by taking into account indicators of population change, such as births, deaths and net migration. More information on the process used to derive population estimates is available from the ABS website <www.abs.gov.au>.
For the Indigenous rates presented in this report, ‘Series B’ of the projected Indigenous experimental resident population estimates for 30 June 2011, as released by the ABS, was used (ABS 2014b).
Mortality data The registration of deaths has been compulsory in Australia since the mid-1850s and this information is registered with the relevant state and territory Registrar of Births, Deaths and Marriages. Since 1906, the Commonwealth Statistician has both compiled the information collected by the Registrars and published national death information. The information on deaths from the Registrars is coded nationally by the ABS according to rules set forward in various versions of the International Classification of Diseases (ICD). In the ABS deaths data,

Palliative care services in Australia 2014 111
information is available in terms of the year in which a person died and the year in which the death was registered.
In the chapter on admitted patient palliative care, ABS deaths data on the total number of Australian deaths that occurred during the specified financial years are shown (ABS 2013b). These mortality data were based on the year of death as this aligns with the information on deaths of admitted patients as recorded in the NHMD.
Medicare Benefits Schedule data Medicare Australia collects data on the activity of all providers making claims through the MBS and provides this information to the Australian Government Department of Health. Information collected includes the type of service provided (MBS item number) and the benefit paid by Medicare Australia for the service. The item number and benefits paid by Medicare Australia are based on the Medicare Benefits Schedule Book (DoHA 2012). Services that are not included in the MBS are not included in the data.
Table B1 lists all MBS items that have been defined as palliative medicine specialist services.
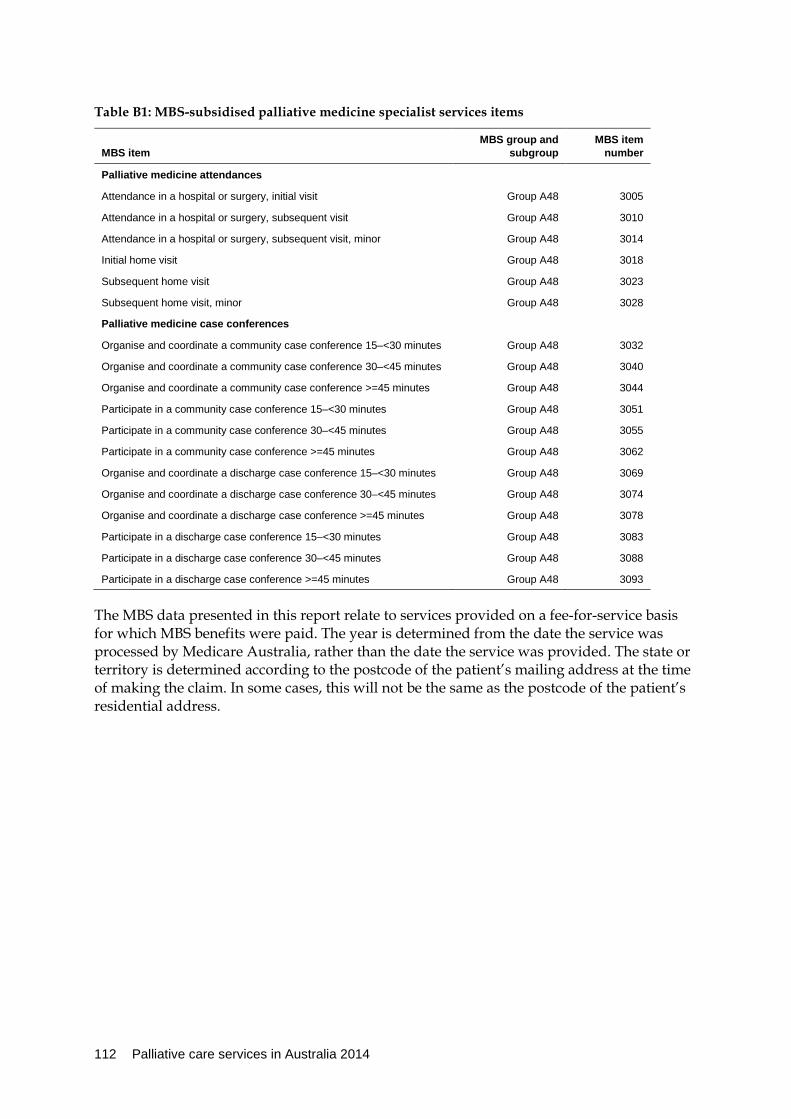
112 Palliative care services in Australia 2014
Table B1: MBS-subsidised palliative medicine specialist services items
MBS item MBS group and
subgroup MBS item
number
Palliative medicine attendances
Attendance in a hospital or surgery, initial visit Group A48 3005
Attendance in a hospital or surgery, subsequent visit Group A48 3010
Attendance in a hospital or surgery, subsequent visit, minor Group A48 3014
Initial home visit Group A48 3018
Subsequent home visit Group A48 3023
Subsequent home visit, minor Group A48 3028
Palliative medicine case conferences
Organise and coordinate a community case conference 15–<30 minutes Group A48 3032
Organise and coordinate a community case conference 30–<45 minutes Group A48 3040
Organise and coordinate a community case conference >=45 minutes Group A48 3044
Participate in a community case conference 15–<30 minutes Group A48 3051
Participate in a community case conference 30–<45 minutes Group A48 3055
Participate in a community case conference >=45 minutes Group A48 3062
Organise and coordinate a discharge case conference 15–<30 minutes Group A48 3069
Organise and coordinate a discharge case conference 30–<45 minutes Group A48 3074
Organise and coordinate a discharge case conference >=45 minutes Group A48 3078
Participate in a discharge case conference 15–<30 minutes Group A48 3083
Participate in a discharge case conference 30–<45 minutes Group A48 3088
Participate in a discharge case conference >=45 minutes Group A48 3093
The MBS data presented in this report relate to services provided on a fee-for-service basis for which MBS benefits were paid. The year is determined from the date the service was processed by Medicare Australia, rather than the date the service was provided. The state or territory is determined according to the postcode of the patient’s mailing address at the time of making the claim. In some cases, this will not be the same as the postcode of the patient’s residential address.

Palliative care services in Australia 2014 113
Appendix C: Technical notes
Population rates Crude rates were calculated using the ABS estimated resident population (ERP) at the midpoint of the data range (for example, rates for 2011–12 data were calculated using ERP at 31 December 2011, while rates for the 2012 calendar year data were calculated using ERP at 30 June 2012). Rates for 2012–13 data were calculated using preliminary ERP at 31 December 2012.
Crude rates for Indigenous status, country of birth and remoteness area data were calculated using ERP at 30 June of the relevant year.
Age-specific rates Age-specific rates provide information on the incidence of a particular event in a specified age group relative to the total number of people ‘at risk’ of that event in the same age group. It is calculated by dividing the number of events occurring in each specified age group by the corresponding population in the same group, and then multiplying the result by a constant (for example, 10,000) to derive the rate.
In this report, age-specific rates are reported in Chapter 2; they are expressed per 10,000 persons and were based on ABS population estimates as at 31 December 2011.
Age-standardised rates A crude rate provides information on the number of events (for example, palliative care separations) relative to the population ‘at risk’ (for example, the entire population) in a specified period. No age adjustments are made when calculating such a rate. Since the likelihood of a palliative care separation is associated with age, crude rates are not suitable for making comparisons across time or groups when differences by age structure exist. More meaningful comparisons can be made by using age-standardised rates, with such rates adjusted for age in order to facilitate comparisons between populations that have different age structures.
There are two standardisation methods commonly used to adjust for age: direct and indirect. The direct standardisation approach is used in this report. To calculate age-standardised rates, age-specific rates (grouped in 5-year intervals) were multiplied against a constant population (namely, the Australian population as at 30 June 2001). This effectively removes the influence of age structure on the rate and it is described as the age-standardised rate.
For data analysis purposes, the ABS population estimates at the midpoint of the respective financial year were used to indicate the size of the population ‘at risk’. For example, for analyses of the 2011–12 data, the ABS population estimates for 31 December 2011 were used. However, in some instances, estimates for December were not available according to a particular characteristic (such as Indigenous status). In such instances, as shown in Table C1, population estimates for 30 June of the respective financial year were used. The same approach was used to analyse 2012–13 data.
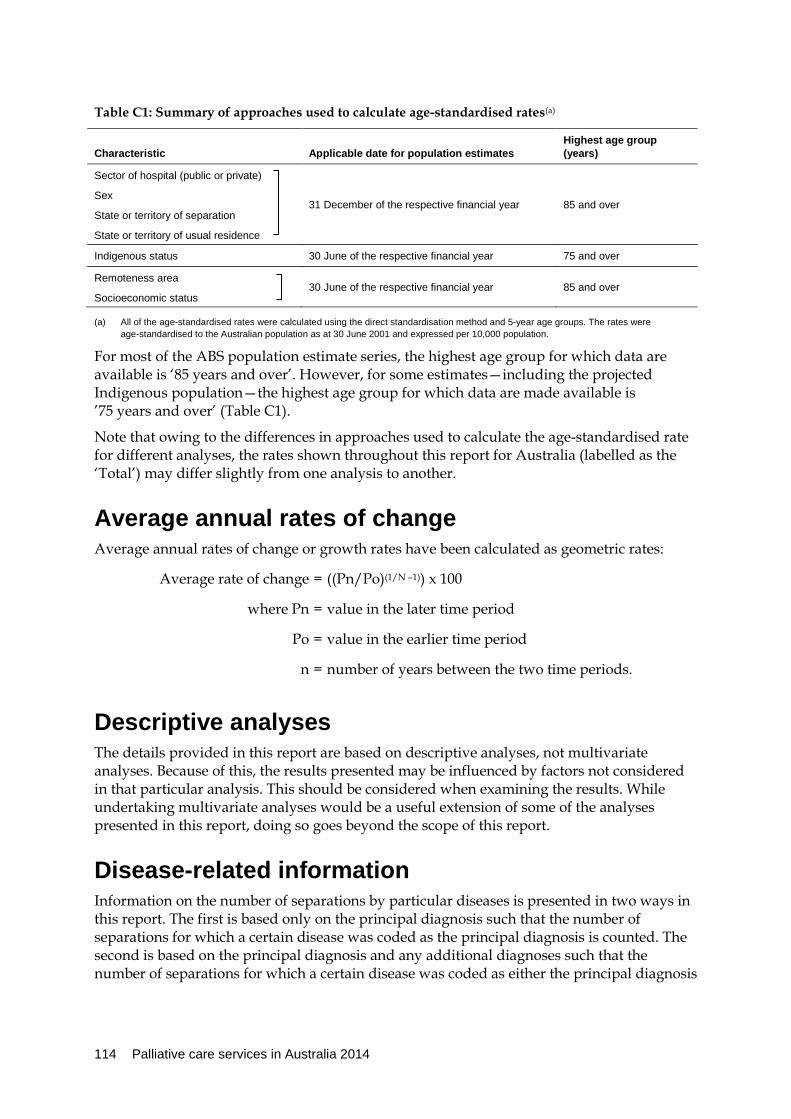
114 Palliative care services in Australia 2014
Table C1: Summary of approaches used to calculate age-standardised rates(a)
Characteristic Applicable date for population estimates Highest age group (years)
Sector of hospital (public or private)
Sex
State or territory of separation
State or territory of usual residence
31 December of the respective financial year 85 and over
Indigenous status 30 June of the respective financial year 75 and over
Remoteness area
Socioeconomic status 30 June of the respective financial year 85 and over
(a) All of the age-standardised rates were calculated using the direct standardisation method and 5-year age groups. The rates were age-standardised to the Australian population as at 30 June 2001 and expressed per 10,000 population.
For most of the ABS population estimate series, the highest age group for which data are available is ‘85 years and over’. However, for some estimates—including the projected Indigenous population—the highest age group for which data are made available is ’75 years and over’ (Table C1).
Note that owing to the differences in approaches used to calculate the age-standardised rate for different analyses, the rates shown throughout this report for Australia (labelled as the ‘Total’) may differ slightly from one analysis to another.
Average annual rates of change Average annual rates of change or growth rates have been calculated as geometric rates:
Average rate of change = ((Pn/Po)(1/N –1)) x 100
where Pn = value in the later time period
Po = value in the earlier time period
n = number of years between the two time periods.
Descriptive analyses The details provided in this report are based on descriptive analyses, not multivariate analyses. Because of this, the results presented may be influenced by factors not considered in that particular analysis. This should be considered when examining the results. While undertaking multivariate analyses would be a useful extension of some of the analyses presented in this report, doing so goes beyond the scope of this report.
Disease-related information Information on the number of separations by particular diseases is presented in two ways in this report. The first is based only on the principal diagnosis such that the number of separations for which a certain disease was coded as the principal diagnosis is counted. The second is based on the principal diagnosis and any additional diagnoses such that the number of separations for which a certain disease was coded as either the principal diagnosis
Palliative care services in Australia 2014 115
or an additional diagnosis is counted. While only one principal diagnosis can be assigned for any one separation, one or more additional diagnoses may also be assigned.
Information relating to cancer The ICD-10-AM diagnosis codes used in the admitted patient chapter to identify cancer patients mirrors the approach used in Cancer in Australia: an overview 2010 (see Appendix I in AIHW & AACR 2010). This approach takes into account that, for some cancer-related separations, the treatment relating to the patient’s cancer (such as chemotherapy or the insertion of a drug delivery device) is recorded as the principal diagnosis, rather than the specific form of cancer the person had, as per ICD-10-AM coding standards (NCCH 2008a). Thus, in this report, three different criteria are used to identify those separations with a principal diagnosis of cancer; these are summarised in Box C1.
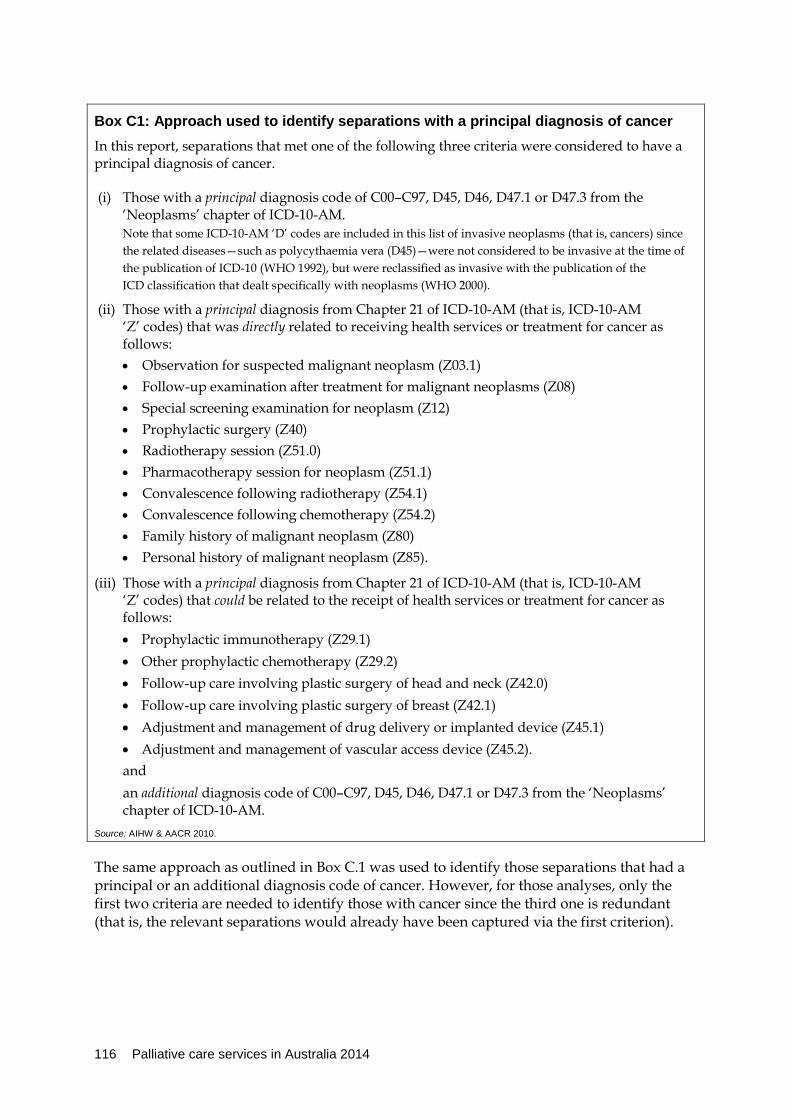
116 Palliative care services in Australia 2014
Box C1: Approach used to identify separations with a principal diagnosis of cancer In this report, separations that met one of the following three criteria were considered to have a principal diagnosis of cancer.
(i) Those with a principal diagnosis code of C00–C97, D45, D46, D47.1 or D47.3 from the ‘Neoplasms’ chapter of ICD-10-AM. Note that some ICD-10-AM ‘D’ codes are included in this list of invasive neoplasms (that is, cancers) since the related diseases—such as polycythaemia vera (D45)—were not considered to be invasive at the time of the publication of ICD-10 (WHO 1992), but were reclassified as invasive with the publication of the ICD classification that dealt specifically with neoplasms (WHO 2000).
(ii) Those with a principal diagnosis from Chapter 21 of ICD-10-AM (that is, ICD-10-AM ‘Z’ codes) that was directly related to receiving health services or treatment for cancer as follows: • Observation for suspected malignant neoplasm (Z03.1) • Follow-up examination after treatment for malignant neoplasms (Z08) • Special screening examination for neoplasm (Z12) • Prophylactic surgery (Z40) • Radiotherapy session (Z51.0) • Pharmacotherapy session for neoplasm (Z51.1) • Convalescence following radiotherapy (Z54.1) • Convalescence following chemotherapy (Z54.2) • Family history of malignant neoplasm (Z80) • Personal history of malignant neoplasm (Z85).
(iii) Those with a principal diagnosis from Chapter 21 of ICD-10-AM (that is, ICD-10-AM ‘Z’ codes) that could be related to the receipt of health services or treatment for cancer as follows: • Prophylactic immunotherapy (Z29.1) • Other prophylactic chemotherapy (Z29.2) • Follow-up care involving plastic surgery of head and neck (Z42.0) • Follow-up care involving plastic surgery of breast (Z42.1) • Adjustment and management of drug delivery or implanted device (Z45.1) • Adjustment and management of vascular access device (Z45.2). and an additional diagnosis code of C00–C97, D45, D46, D47.1 or D47.3 from the ‘Neoplasms’ chapter of ICD-10-AM.
Source: AIHW & AACR 2010.
The same approach as outlined in Box C.1 was used to identify those separations that had a principal or an additional diagnosis code of cancer. However, for those analyses, only the first two criteria are needed to identify those with cancer since the third one is redundant (that is, the relevant separations would already have been captured via the first criterion).
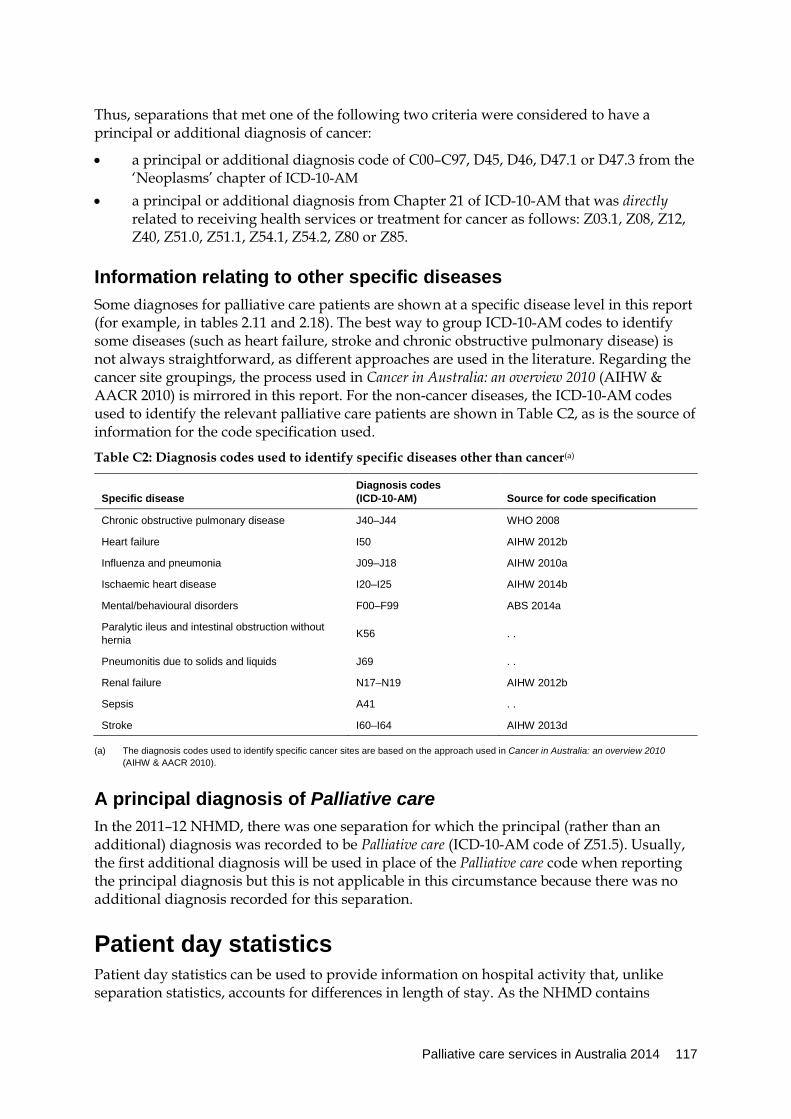
Palliative care services in Australia 2014 117
Thus, separations that met one of the following two criteria were considered to have a principal or additional diagnosis of cancer:
• a principal or additional diagnosis code of C00–C97, D45, D46, D47.1 or D47.3 from the ‘Neoplasms’ chapter of ICD-10-AM
• a principal or additional diagnosis from Chapter 21 of ICD-10-AM that was directly related to receiving health services or treatment for cancer as follows: Z03.1, Z08, Z12, Z40, Z51.0, Z51.1, Z54.1, Z54.2, Z80 or Z85.
Information relating to other specific diseases Some diagnoses for palliative care patients are shown at a specific disease level in this report (for example, in tables 2.11 and 2.18). The best way to group ICD-10-AM codes to identify some diseases (such as heart failure, stroke and chronic obstructive pulmonary disease) is not always straightforward, as different approaches are used in the literature. Regarding the cancer site groupings, the process used in Cancer in Australia: an overview 2010 (AIHW & AACR 2010) is mirrored in this report. For the non-cancer diseases, the ICD-10-AM codes used to identify the relevant palliative care patients are shown in Table C2, as is the source of information for the code specification used.
Table C2: Diagnosis codes used to identify specific diseases other than cancer(a)
Specific disease Diagnosis codes (ICD-10-AM) Source for code specification
Chronic obstructive pulmonary disease J40–J44 WHO 2008
Heart failure I50 AIHW 2012b
Influenza and pneumonia J09–J18 AIHW 2010a
Ischaemic heart disease I20–I25 AIHW 2014b
Mental/behavioural disorders F00–F99 ABS 2014a
Paralytic ileus and intestinal obstruction without hernia K56 . .
Pneumonitis due to solids and liquids J69 . .
Renal failure N17–N19 AIHW 2012b
Sepsis A41 . .
Stroke I60–I64 AIHW 2013d
(a) The diagnosis codes used to identify specific cancer sites are based on the approach used in Cancer in Australia: an overview 2010 (AIHW & AACR 2010).
A principal diagnosis of Palliative care In the 2011–12 NHMD, there was one separation for which the principal (rather than an additional) diagnosis was recorded to be Palliative care (ICD-10-AM code of Z51.5). Usually, the first additional diagnosis will be used in place of the Palliative care code when reporting the principal diagnosis but this is not applicable in this circumstance because there was no additional diagnosis recorded for this separation.
Patient day statistics Patient day statistics can be used to provide information on hospital activity that, unlike separation statistics, accounts for differences in length of stay. As the NHMD contains
118 Palliative care services in Australia 2014
records for patients ceasing separation during a specific reporting period (such as 1 July 2011 to 30 June 2012), this means that all patients who ceased separation during the reporting period are included, regardless of whether or not they were admitted during that period. Thus, not all patient days reported will have occurred during the reporting period. However, it is expected that, in general, patient days for patients who ceased separation in 2011–12, but who were admitted before 1 July 2011, will be generally counterbalanced by the patient days for patients still in hospital on 30 June 2012 who will cease separation in future reporting periods.
Quality of Indigenous status data The AIHW report Indigenous identification in hospital separations data: quality report (AIHW 2013b) presented the latest findings on the quality of Indigenous identification in Australian hospital separations data, based on studies of Indigenous identification in public hospitals conducted during 2011 and 2012. The results of the studies indicated that data for all jurisdictions should be used in any analyses of Indigenous hospitalisation rates, and that all states and territories are included in national analyses of Indigenous admitted patient care for data from 2010–11 onwards.
Palliative care services in Australia 2014 119
Appendix D: Classifications This section describes the classification systems referred to in this report.
Australian Statistical Geographical Standard for Remoteness Areas The ASGS was developed by the ABS to collect and disseminate geographically classified statistics. In this report, the ASGS Remoteness Areas were used to assign areas across Australia to a remoteness category (ABS 2007). This classification divides all areas of Australia into five categories—namely, Major cities, Inner regional, Outer regional, Remote and Very remote (AIHW 2004). Information on the quality of the data in the NHMD on the usual residence of the patient can be found in Appendix 1 of Australian hospital statistics 2009–10 (AIHW 2011a).
Index of Relative Socio-economic Advantage and Disadvantage, and the Index of Relative Socio-economic Disadvantage The IRSAD and the IRSD are two of four SEIFAs developed by the ABS (ABS 2008). Each of these indexes summarises a different aspect of the socioeconomic conditions in an area; the indexes were created using a different set of information (ABS 2008). Broadly, they are based on factors such as average household income, education levels, unemployment rates, occupation and housing characteristics. The IRSAD and IRSD are area-based (not person-based) measures of socioeconomic status in which small areas of Australia are classified on a continuum from disadvantaged to affluent. This information is used as a proxy for the socioeconomic status of people living in those areas and may not be correct for each person living in that area. In this report, the first socioeconomic status group (labelled ‘1’) corresponds to geographical areas containing the 20% of the population with the lowest socioeconomic status according to the IRSAD and the IRSD, and the fifth group (labelled ‘5’) corresponds to the 20% of the population with the highest socioeconomic status.
International Statistical Classification of Diseases and Related Health Problems The ICD, which was developed by the WHO, is the international standard for coding morbidity and mortality statistics. It was designed to promote international comparability in collecting, processing, classifying and presenting these statistics. The ICD is periodically reviewed to reflect changes in clinical and research settings (WHO 2011).
The version currently used in Australia to code causes of death, ICD-10 (WHO 1992), was endorsed in May 1990 and officially came into use in WHO member states from 1994. Further information on the ICD is available from the WHO website at <http://www.who.int/classifications/icd/en/>.

120 Palliative care services in Australia 2014
ICD-10-AM The Australian Modification of ICD-10, referred to as the ICD-10-AM (NCCH 2008b), is based on ICD-10. ICD-10 was modified for the Australian setting by the NCCH to make it more relevant to Australian clinical practice. Compatibility with ICD-10 at the higher levels (that is, up to 4 character codes) of the classification has been maintained. ICD-10-AM has been used to classify diagnoses in hospital records in all Australian states and territories since 1999–00 (AIHW 2000).
The ICD-10-AM disease classification is hierarchical; a small number of summary disease chapters are divided into a large number of more specific disease groupings (represented by 3-character codes). Most of the 3-character disease groupings can be divided into an even larger number of very specific disease categories represented by 4 and 5-character codes.

Palliative care services in Australia 2014 121
Appendix E: PCOC benchmark revisions The PCOC’s first set of national benchmarks were developed in consultation with participating services in 2009. These were included in PCOC’s 6-monthly benchmarking reports from Report 8, which covered July to December 2009. Included in this set were three benchmarks for time spent in the unstable phase:
• Benchmark 2.1: 85% of patients remain in the unstable phase for less than 7 days—first phase of episode.
• Benchmark 2.2: 90% of patients remain in the unstable phase for less than 7 days—not first phase of episode.
• Benchmark 2.3: The median time in the unstable phase is 2 days or less. Stakeholders at PCOC’s 2012 benchmarking workshops suggested that benchmarks 2.1 and 2.2 be combined, as the distinction between’ first phase’ and ‘not first phase’ did not provide any additional information. It was also suggested that the ‘less than 7 days’ time frame did not represent best practice and should be reduced.
To investigate these suggestions, the PCOC analysed data for July to December 2009 (Report 8) and for January to June 2012 (Report 13). This analysis showed that setting the benchmark at 90% for a length of unstable phase of 3 days or less, resulted in a similar level of performance for the top 10 services as was achieved for benchmarks 2.1 and 2.2 in both time periods. It was therefore deemed appropriate to replace benchmarks 2.1 and 2.2 with ‘Benchmark 2: 90% of patients are in the unstable phase for 3 days or less’.
Table E1 compares the percentage of all services and patient phases that meet the original and revised benchmarks.
Table E1: Per cent of all service and patient phases that meet benchmarks 2.1, 2.2 and revised benchmark 2, by report
Benchmark 2.1 Benchmark 2.2 Benchmark 2
Report 8 Report 13 Report 8 Report 13 Report 13
Patient phases 66 83 73 84 66
Services 23 54 20 45 12
Source: PCOC analysis of 2012 data (unpublished).
In light of the new benchmark 2, the PCOC decided that benchmark 2.3 (median time in the unstable phase for 2 days or less) was redundant and subsequently removed it from the suite of PCOC benchmarks.
The amalgamated benchmark was implemented as of the PCOC’s Report 14, covering July to December 2012.
Subsequently, the PCOC undertook a review of outcome measure 1 ‘Time from referral to first contact for the episode’ and its associated benchmark 1.1 ‘90% of patients are contacted by a member of the clinical team on the day of, or the day after, referral’.
Feedback from PCOC participants concluded that access to palliative care should be measured based on patient need rather than service availability. As a result, services operating 5 days a week are not distinguished from services operating 7 days a week under the revised outcome measure 1 ‘Time from date ready for care to episode start’ and its

122 Palliative care services in Australia 2014
associated benchmark 1.1 ‘90% of patients must have their episode commence on the day of, or the day following date ready for care’.
This measure superseded the previous measure for July–December 2013 reporting. As such, the data for outcome measure 1 includes data only for the July–December 2013 period.
Palliative care services in Australia 2014 123
Glossary
This section provides a general description of the terms used in this report. The terms have been defined in the context of this report; some may have other meanings in other contexts. Where applicable, the identification number from the METeOR is shown after the definition of the term. METeOR is Australia’s central repository for health, community services and housing assistance metadata. METeOR can be viewed on the AIHW website at <www.aihw.gov.au>.
Additional diagnosis: a condition or complaint either coexisting with the principal diagnosis or arising during the episode of care (METeOR identifier 333832).
Administrative database: observations about events that are routinely recorded or required by law to be recorded. Such events include births, deaths, hospital separations and cancer incidence. The NHMD is an example of an administrative database.
Admitted patient: a person who undergoes a hospital’s formal admission process to receive treatment and/or care. Such treatment or care is provided over a period of time and can occur in hospital and/or in the person’s home (as a ‘hospital-in-the-home’ patient) (METeOR identifier 268957).
Aged Care Funding Instrument: a resource allocation instrument which focuses on three domains that discriminate care needs among residents. The ACFI assesses core needs as a basis for allocating funding.
Average length of stay: the average number of patient days for admitted patient episodes. Patients admitted and separated on the same day are allocated a length of stay of 1 day.
Care type: the overall nature of a clinical service provided to an admitted patient during an episode of care. The ‘Care type’ categories applicable for admitted patient care are listed below (METeOR identifier 270174):
• acute care • rehabilitation care • palliative care • geriatric evaluation and management • psychogeriatric care • maintenance care • newborn care • other admitted patient care. Encounter: any professional interchange between a patient and a GP; it includes both face-to-face encounters and indirect encounters where there is no face-to-face meeting but where a service is provided (for example, a prescription or referral) (Britt et al. 2013).
Episode of care: the period of admitted patient care between a formal or statistical admission and a formal or statistical discharge, characterised by only one care type (METeOR identifier 268956) (also see Care type, Separation and Statistical discharge).
124 Palliative care services in Australia 2014
Establishment type: type of establishment (defined in terms of legislative approval, service provided and patients treated) for each separately administered establishment. Establishment types include acute care hospitals, psychiatric hospitals, alcohol and drug treatment centres and hospices (METeOR identifier: 269971).
Funding source for hospital patient: expected principal source of funds for an admitted patient episode or non-admitted patient service event (METeOR identifier: 339080).
General practitioner: a medical practitioner who is vocationally registered under Section 3F of the Health Insurance Act 1973 (Cwlth), or a Fellow of the Royal Australian College of General Practitioners or a trainee for vocational registration.
Hospital: a health-care facility established under Australian Government, state or territory legislation as a hospital or a free-standing day procedure unit and authorised to provide treatment and/or care to patients (METeOR identifier: 268971).
Hospital-in-the-home care: care provided to hospital admitted patients in their place of residence as a substitute for hospital accommodation. Place of residence may be permanent or temporary (METeOR identifier: 270305).
Indigenous status: a measure of whether a person identifies as being of Aboriginal or Torres Strait Islander origin (METeOR identifier: 291036).
International Statistical Classification of Diseases and Related Health Problems: the WHO’s internationally accepted classification of diseases and related health conditions. The Australian Modification of the tenth revision of the ICD (namely, ICD-10-AM) has been used in all Australian jurisdictions to code admitted patient data since 1999–00 (see Appendix D).
Length of stay: the length of stay of an overnight patient, which is calculated by subtracting the date the patient is admitted from the date of separation and deducting days the patient was on leave. A same-day patient is allocated a length of stay of 1 day (METeOR identifier: 269982).
MBS-subsidised palliative medicine specialist services: services provided by a palliative medicine specialist on a fee-for-service basis that are partially or fully funded under the Australian Government’s Medicare program. These services cover patient attendances (or consultations) provided in different settings as well as services such as case conferencing.
Median: the value in a set of ranked observations that divides the data into two parts of equal size. With an odd number of observations, the median is the middle value. With an even number of observations, the median is the mean of the two central values.
Mode of admission: the mechanism by which a person begins an episode of admitted patient care (METeOR identifier: 269976).
Mode of separation: the status at separation of a person (discharge, transfer or death) and the place to which the person is released (where applicable) (METeOR identifier: 270094). Overnight-stay patient: a patient who, following a clinical decision, receives hospital treatment for a minimum of 1 night (that is, who is admitted to and separated from the hospital on different dates).
Palliative care: care in which the clinical intent or treatment goal is primarily quality of life for a patient with an active, progressive disease with little or no prospect of cure. It is usually evidenced by an interdisciplinary assessment and/or management of the physical, psychological, emotional and spiritual needs of the patient, and by a grief and bereavement support service for the patient and their carers/family. It includes care provided in a

Palliative care services in Australia 2014 125
palliative care unit, in a designated palliative care program, and under the principal clinical management of a palliative care physician or (in the opinion of the treating doctor) when the principal clinical intent of care is palliation (also see Care type).
Palliative care in residential aged care: residential aged care residents are identified in the ACFI data through care needs being appraised as palliative care in the complex health care domain. This appraisal process identifies residents undergoing a palliative care program where ongoing care will involve very intensive clinical nursing and/or complex pain management in the residential care setting.
Palliative care-related encounters: encounters identified using the BEACH coding system’s four ICPC-2 PLUS palliative care-related codes against three data elements: Reason for encounter, Diagnosis and Referral, which are used by GPs to record a reason for the encounter. A palliative care-related encounter includes one or more of these ICPC-2 PLUS codes which are recorded for one or more of the three data elements.
Palliative care-related separation: a separation for which the principal clinical intent of the care was palliation during all or some of that separation (also see Palliative care).
Palliative medicine specialist: a medical practitioner who, in order to be eligible for payment of MBS subsidies for palliative care services, must be a fellow of the Fellowship of the Australasian Chapter of Palliative Medicine (FAChPM).
Patient days: the total number of days for patients who were admitted for an episode of care and who separated during a specified reference period. A patient who is admitted and separated on the same day is allocated 1 patient day (METeOR identifier: 270045).
Permanent admission: an admission to residential aged care for expected long-term care during the reporting period.
Permanent resident: a resident who is admitted to residential aged care for permanent care (long-term care).
Principal diagnosis: the diagnosis established after study to be chiefly responsible for occasioning an episode of admitted patient care (METeOR identifier 333838).
Private hospital: a privately owned and operated institution, catering for patients who are treated by a doctor of their own choice. Patients are charged fees for accommodation and other services provided by the hospital and relevant medical and paramedical practitioners. Acute care and psychiatric hospitals are included, as are private free-standing day hospital facilities (also see Establishment type).
Procedure: a clinical intervention that is surgical in nature, carries a procedural risk, carries an anaesthetic risk, requires specialised training and/or requires special facilities or equipment available only in the acute care setting (METeOR identifier: 361687).
Public hospital: a hospital controlled by a state or territory health authority. Public hospitals offer free diagnostic services, treatment, care and accommodation to all eligible patients (also see Establishment type).
Same-day: an admitted patient who is admitted and separates on the same date. Such patients are allocated a length of stay of 1 day.
Separation: a term that refers to the episode of admitted patient care, which can be a total hospital stay (from admission to discharge, transfer or death) or a portion of a hospital stay beginning or ending in a change of type of care (for example, from acute care to

126 Palliative care services in Australia 2014
rehabilitation). ‘Separation’ also means the process by which an admitted patient completes an episode of care by being discharged, dying, transferring to another hospital or changing type of care.
Statistical admission: an administrative process that starts an admitted patient episode of care when there was a change in the clinical intent of treatment (for example, from acute care to palliative care) (also see Care type, Episode of care and Statistical discharge).
Statistical discharge: an administrative process that ends an admitted patient episode of care when there is a change in the clinical intent of treatment (for example, from acute care to palliative care). For each statistical discharge, there should be a corresponding statistical admission; that is, a new episode of care with a different care type is created (also see Care type and Episode of care).

Palliative care services in Australia 2014 127
References ABS (Australian Bureau of Statistics) 2007. Australian Standard Geographical Classification, July 2007. ABS cat. no. 1216.0. Canberra: ABS. ABS 2008. Information paper: an introduction to Socio-Economic Indexes for Areas (SEIFA) 2006. ABS cat. no. 2039.0. Canberra: ABS. ABS 2011. Australian Standard Geographical Standard (ASGS): Volume 1—Main structure and greater capital city statistical areas, July 2011. ABS cat. no. 1270.0.55.001. Canberra: ABS.
ABS 2012. Socio-Economic Indexes for Areas (SEIFA)—Census. Canberra: ABS. Viewed 5 July 2012, <http://www.abs.gov.au/websitedbs/censushome.nsf/home/seifa>. ABS 2013a. 2011 Census QuickStats: Australia. Canberra: ABS. Viewed 30 May 2014, <http://www.censusdata.abs.gov.au/census_services/getproduct/census/2011/ quickstat/0>. ABS 2013b. Deaths, Australia 2012: data cubes. ABS cat. no. 3302.0. Canberra: ABS.
ABS 2013c. Private health establishments collection. Canberra: ABS. Viewed 30 May 2014, <http://www.abs.gov.au/AUSSTATS/[email protected]/DetailsPage/4390.02011-12?OpenDocument>.
ABS 2013d. Private hospitals, Australia 2011–12. ABS cat. no. 4390.0. Canberra: ABS.
ABS 2014a. Cause of death, Australia 2012. ABS cat. no. 3303.0. Canberra: ABS.
ABS 2014b. Experimental estimates and projections, Aboriginal and Torres Strait Islander Australians, 2001 to 2026. ABS cat. no. 3238.0. Canberra: ABS.
AIHW (Australian Institute of Health and Welfare) 2000. Australian hospital statistics 1998–99. Health services series no. 15. Cat. no. HSE 11. Canberra: AIHW. AIHW 2004. Rural, regional and remote health: a guide to remoteness classifications. Cat. no. PHE 53. Canberra: AIHW. AIHW 2008. Review and evaluation of Australian information about primary health care: a focus on general practice. Cat. no. HWI 103. Canberra: AIHW.
AIHW 2009. Australian hospital statistics 2007–08. Health services series no. 33. Cat. no. HSE 71. Canberra: AIHW. AIHW 2010a. Asthma, chronic obstructive pulmonary disease and other respiratory diseases in Australia. Cat. no. ACM 20. Canberra: AIHW.
AIHW 2010b. Australia’s health 2010. Australia’s health series no. 12. Cat. no. AUS 122. Canberra: AIHW. AIHW 2010c. Australian hospital statistics 2008–09. Health services series no. 17. Cat. no. HSE 84. Canberra: AIHW. AIHW 2010d. National palliative care performance indicators: results of the 2008 performance indicator data collection. Cat. no. HWI 106. Canberra: AIHW.
AIHW 2011a. Australian hospital statistics 2009–10. Health services series no. 40. Cat. no. HSE 107. Canberra: AIHW. AIHW 2011b. Identifying palliative care separations in admitted patient data: technical paper. Cat. no. HWI 113. Canberra: AIHW.
128 Palliative care services in Australia 2014
AIHW 2011c. The health and welfare of Australia’s Aboriginal and Torres Strait Islander people, an overview 2011. Cat. no. IHW 42. Canberra: AIHW.
AIHW 2011d. Residential aged care in Australia 2009–10: a statistical overview. Aged care statistics series no. 35. Cat. no. AGE 66. Canberra: AIHW.
AIHW 2012a. Australian hospital statistics 2010–11. Health services series no. 43. Cat. no. HSE 117. Canberra: AIHW.
AIHW 2012b. National health data dictionary. Version 16. Cat. no. HWI 119. Canberra: AIHW.
AIHW 2012c. Palliative care services in Australia 2012. Cat. no. HWI 120. Canberra: AIHW.
AIHW 2013a. Australian hospital statistics 2011–12. Health services series no. 50. Cat. no. HSE 134. Canberra: AIHW.
AIHW 2013b. Indigenous identification in hospital separations data: quality report. Cat. no. IHW 90. Canberra: AIHW.
AIHW 2013c. Palliative care services in Australia 2013. Cat. no. HWI 123. Canberra: AIHW.
AIHW 2013d. Stroke and its management in Australia: an update. Cat. no. CVD 61. Canberra: AIHW.
AIHW 2014a. Medical Workforce 2012. National health workforce series no. 8. Cat. no. HWL 54. Canberra: AIHW.
AIHW 2014b. Trends in coronary heart disease mortality: age groups and populations. Cardiovascular disease series no. 38. Cat. no. CVD 67. Canberra: AIHW.
AIHW & AACR (Australasian Association of Cancer Registries) 2010. Cancer in Australia: an overview 2010. Cancer series no. 60. Cat. no. CAN 56. Canberra: AIHW. ANZSPM (Australian and New Zealand Society of Palliative Medicine) 2008. Defining the meaning of the terms consultant physician in palliative medicine and palliative medicine specialist. Canberra: ANZSPM. Viewed 18 April 2012, <http://www.anzspm.org.au/c/anzspm?a=sendfile&ft=p&fid=1320262441&sid=>.
ANZSPM 2009. Caring for people at the end of life: submission to the National Health and Hospitals Reform Commission. Canberra: ANZSPM Incorporated. Viewed February 2012, < http://www.health.gov.au/internet/nhhrc/publishing.nsf/Content/430/$FILE/430%20-%20ANZSPM.pdf >. Australian Government Department of Health 2014a. Pharmaceutical benefits for palliative care. Canberra: Australian Government Department of Health. Viewed 24 April 2014, <http://www.pbs.gov.au/browse/palliative-care>.
Australian Government Department of Health 2014b. Schedule of pharmaceutical benefits. Canberra: Australian Government Department of Health. Viewed 24 April 2014, <http://www.pbs.gov.au/publication/schedule/2014/04/2014-04-01-general-schedule.pdf>.
Britt H, Miller GC, Henderson J, Bayram C, Valenti L, Harrison C et al. 2013. General practice activity in Australia 2012–13. General practice series no. 33. Sydney: Sydney University Press.
CareSearch 2012. Role of palliative care specialists. Adelaide: Flinders University. Viewed 17 April 2012, <http://www.caresearch.com.au/caresearch/tabid/727/Default.aspx>.

Palliative care services in Australia 2014 129
Currow DC, Eagar K, Aoun S, Fildes D, Yates P & Kristjanson L 2008. Is it feasible and desirable to collect voluntarily quality and outcome data nationally in palliative oncology care? Journal of Clinical Oncology 26(23):3853–9.
DoHA (Department of Health and Ageing) 2009. Aged Care Funding Instrument: user guide. Canberra: DoHA.
DoHA 2010. Supporting Australians to live well at the end of life: National Palliative Care Strategy 2010. Canberra: DoHA.
DoHA 2012. Medicare Benefits Schedule Book, effective 1 July 2012. Canberra: DOHA.
DoHA 2013. Medical Training Review Panel, sixteenth report. Canberra: DoHA .
DoHA (WestWood Spice) 2005. Activity implementation report: National Palliative Care Strategy. Canberra: DoHA.
Department of Human Services (DHS) 2013. Collection of under co-payment prescription data, Canberra: DHS. Viewed 28 March 2013, <http://www.medicareaustralia.gov.au/provider/pbs/pharmacists/collection_of_under_co-payment_precscription_data.jsp>.
DVA (Department of Veterans’ Affairs) 2012. DVA Community Nursing Program. Canberra: DVA. Viewed 16 April 2013, <http://www.dva.gov.au/service_providers/community_nursing/Pages/index.aspx>.
Family Medicine Research Centre 2013. ICPC-2 PLUS: the BEACH coding system. Sydney: University of Sydney. Viewed 16 May 2013 < http://sydney.edu.au/medicine/fmrc/icpc-2-plus/>.
Giles LC, Cameron ID & Crotty M 2003. Disability in older Australians: projections for 2006-2031. Medical Journal of Australia 179(3):130-3.
Glare PA, Auret KA, Aggarwal G, Clark KJ, Pickstock SE & Lickiss JN 2003. The interface between palliative medicine and specialists in acute-care hospitals: boundaries, bridges and challenges. Medical Journal of Australia. 179:S29-S31.
Grbich C, Maddocks C, Parker D, Brown M, Willis E & Hofmeyer A 2005. Palliative care in aged care facilities for residents with a non-cancer diagnosis: results of a survey of aged care facilities in South Australia. Australasian Journal on Ageing 24(2):108–13.
McNamara B, Rosenwax LK & Holman CDJ 2006. A method for defining and estimating the palliative care population. Journal of Pain and Symptom Management 32(1):5–12.
Medicare (Medicare Australia) 2013. MBS statistics. Canberra: Medicare. Viewed May 2013, <http://www.medicareaustralia.gov.au/provider/medicare/mbs.jsp>.
Murtagh FEM, Bausewein C, Verne J, Groeneveld EI, Kaloki YE & Higginson IJ 2014. How many people need palliative care? A study developing and comparing methods for population-based estimates. Palliative Medicine 28(1):49-58.
NCCH (National Centre for Classification in Health) 2008a. Australian coding standards for ICD-10-AM and ACHI, sixth edition. Sydney: NCCH.
NCCH 2008b. International Statistical Classification of Diseases and Related Health Problems, 10th revision, Australian Modification, sixth edition. Sydney: NCCH.
NCCH 2010. Australian coding standards for ICD-10-AM and ACHI, seventh edition. Sydney: NCCH.

130 Palliative care services in Australia 2014
NHMRC (National Health and Medical Research Council) 2006. Guidelines for a palliative approach in residential aged care—May 2006. Canberra: NHMRC.
NSAP (National Standards Assessment Program) 2014. The Standards. Canberra: NSAP. Viewed 3 June 2014, <http://www.caresearch.com.au/caresearch/tabid/2409/Default.aspx>.
Parker MH, Cartwright CM & Williams GM 2008. Impact of specialty on attitudes of Australian medical practitioners to end-of-life decisions. Medical Journal of Australia 188:450–6.
PC (Productivity Commission) 2011. Caring for older Australians, Report no. 53, Final Inquiry Report. Canberra: PC.
PCA (Palliative Care Australia) 2005a. A guide to palliative care service development: A population based approach. Canberra: PCA.
PCA 2005b. Standards for providing quality palliative care for all Australians. Canberra: PCA.
PCOC (Palliative Care Outcomes Collaboration) 2010. PCOC national report on palliative care in Australia: January to June 2010. Wollongong: University of Wollongong.
PCOC 2012. PCOC Version 3.0 Dataset: data dictionary and technical guidelines. Wollongong: University of Wollongong. Viewed 1 July 2014, <https://ahsri.uow.edu.au/content/groups/public/@web/@chsd/@pcoc/documents/doc/uow126175.pdf >.Rosenwax LK, McNamara B, Blackmore AM & Holman CDJ 2005. Estimating the size of a potential palliative care population. Palliative Medicine 19:556–62.
SCRSGP (Steering Committee for the Review of Government Service Provision) 2014. Report on government services 2014. Canberra: Productivity Commission.
Senate Community Affairs References Committee 2012. Palliative care in Australia. Report to the Senate, Australian Government. Canberra: Senate Community Affairs References Committee.
Tieman JJ, Abernethy AP, Fazekas BS & Currow DC 2005. Caresearch: finding and evaluating Australia’s missing palliative care literature. BMC Palliative Care 4(4).
WHO (World Health Organization) 1992. International Statistical Classification of Diseases and Related Health Problems, tenth revision. Vol. 1. Geneva: WHO.
WHO 2000. International Classification of Diseases for Oncology, third edition. Geneva: WHO.
WHO 2002. National cancer control programmes: policies and managerial guidelines, second edition. Geneva: WHO.
WHO 2008. The global burden of disease: 2004 update. Geneva: WHO.
WHO 2011. International Classification of Diseases (ICD). Geneva: WHO. Viewed December 2011, <http://www.who.int/classifications/icd/en/>.
WHO 2014. Global Atlas of Palliative Care at the End of Life. Geneva: WHO.
Willard C & Luker K 2006. Challenges to end of life care in the acute hospital setting. Palliative Medicine 20:611–15.
Palliative care services in Australia 2014 131
List of tables Table 2.1: Palliative care-related separations by sex and all separations, public and
private hospitals, 2011–12 .............................................................................................................. 8
Table 2.2: Palliative care-related separations by age and sex, all separations, public and private hospitals, 2011–12 .............................................................................................................. 8
Table 2.3: Palliative care-related separations by state and territory, and all separations, public and private hospitals, 2011–12 .......................................................................................... 9
Table 2.4: Palliative care-related separations, all separations, by sex, patient days and ALoS, public and private hospitals, 2011–12 ............................................................................ 10
Table 2.5: Palliative care-related separations, by state and territory, ALoS, public and private hospitals, 2011–12 ............................................................................................................ 11
Table 2.6: Palliative care-related separations, all separations, by principal source of funds, states and territories, public and private hospitals, 2011–12 .................................................. 12
Table 2.7: Palliative care-related separations and all separations, by mode of completing separation, states and territories, public and private hospitals, 2011–12 .............................. 14
Table 2.8: Palliative care-related separations, by Indigenous status, selected states and territories, public and private hospitals, 2011–12 ..................................................................... 16
Table 2.9: Palliative care-related separations, by remoteness area of patient’s usual residence, public and private hospitals, 2011–12 ..................................................................... 17
Table 2.10: Palliative care-related separations, by socioeconomic status, public and private hospitals, 2011–12 ............................................................................................................ 19
Table 2.11: Palliative care-related separations, by the 10 principal diagnoses most frequently recorded, public and private hospitals, 2011–12 ...................................................................... 20
Table 2.12: Palliative care separations and all separations, public and private hospitals, 2002–03 to 2011–12 ........................................................................................................................ 21
Table 2.13: Palliative care-related separations and all separations, public and private hospitals, 2002–03 to 2011–12 ...................................................................................................... 22
Table 2.14: Palliative care-related separations, states and territories, public and private hospitals, 2007–08 to 2011–12 ...................................................................................................... 23
Table 2.15: Palliative care-related separations, states and territories, age-standardised rates, public and private hospitals, 2007–08 to 2011–12 ..................................................................... 24
Table 2.16: Palliative care-related separations, patient days and ALoS, all hospitals, 2002–03 to 2011–12 ....................................................................................................................................... 26
Table 2.17: Admitted patient deaths, all hospitals and all deaths, 2002–03 to 2011–12 .......................... 27
Table 2.18: Palliative care patients among those who died as an admitted patient, by the 10 principal diagnoses most often recorded, public and private hospitals, 2011–12 .......... 29
Table 3.1: Estimated number of palliative care-related encounters, BEACH survey, 2012–13 ............ 32
Table 3.2: Patient demographics for palliative care-related encounters, BEACH survey 2012–13 ........................................................................................................................................... 33
Table 4.1: MBS-subsidised palliative medicine specialist services: numbers of patients and services, 2012–13 ................................................................................................................... 35

132 Palliative care services in Australia 2014
Table 4.2: MBS-subsidised palliative medicine specialist services: patient demographic characteristics and number of services received, 2012–13 ...................................................... 36
Table 4.3: MBS-subsidised palliative medicine specialist services: MBS item groups, 2012–13 .......... 37
Table 4.4: Palliative medicine specialist services subsidised through Medicare by schedule item, states and territories, 2012–13 ........................................................................................... 38
Table 4.5: MBS-subsidised palliative medicine specialist services: services by remoteness area, 2012–13 .................................................................................................................................. 39
Table 4.6: Palliative medicine specialist services subsidised through Medicare by schedule item, 2008–09 to 2012–13 ............................................................................................................. 40
Table 4.7: Medicare benefits paid on palliative medicine specialist services, by item group, states and territories, 2012–13 ..................................................................................................... 41
Table 4.8: Medicare benefits paid on palliative medicine specialist services, Australia, 2008–09 to 2012–13 ........................................................................................................................ 42
Table 5.1: Admissions to permanent residential aged care and permanent residents appraised as requiring palliative care or other care types, 2012–13 ...................................... 44
Table 5.2: Permanent residential aged care residents, appraised as requiring palliative or other care types, by sex, 2012–13 ............................................................................................... 45
Table 5.3: Diagnosed diseases in ACFI-appraised permanent residential aged care residents, 2012–13 ........................................................................................................................................... 47
Table 5.4: Separations of permanent residential aged care residents appraised as requiring palliative care or other care types, by mode of separation, 2012–13...................................... 47
Table 5.5: Permanent residential aged care residents appraised as requiring palliative care or other care types using ACFI, with an episode of hospital leave, by remoteness area, 2012–13 .................................................................................................................................. 48
Table 6.1: Palliative care schedule items: numbers of patients and prescriptions, 2012–13 ................. 51
Table 6.2: Patients dispensed palliative care-related prescriptions (subsidised and under co-payment), by remoteness, 2012–13 ........................................................................................ 52
Table 6.3: Palliative care-related prescriptions, by medication type prescribed and prescribing clinician, 2012–13 .......................................................................................................................... 54
Table 6.4: Palliative care-related prescriptions, by medication type per 100,000 population, all clinicians, states and territories, 2012–13.............................................................................. 55
Table 6.5: PBS/RPBS subsidised palliative care-related prescriptions, by medication type, all clinicians, 2008–09 to 2012–13 ................................................................................................ 56
Table 6.6: PBS/RPBS subsidised palliative care-related prescriptions for pain relief, initial and repeat prescriptions, by medication group, 2012–13 ............................................ 57
Table 6.7: Palliative care schedule items prescribed by palliative medicine specialists, by ATC* group, 2012–13 ................................................................................................................... 58
Table 6.8: PBS/RPBS benefits paid on PBS/RPBS palliative care-related medications, states and territories, 2012–13 ................................................................................................................ 59
Table 6.9: PBS/RPBS benefits paid on palliative care schedule items, 2008–09 to 2012–13 ................. 60
Table 6.10: PBS/RPBS benefits paid for prescriptions made by palliative medicine specialists, by ATC group, 2012–13 ............................................................................................ 61
Palliative care services in Australia 2014 133
Table 7.1: Employed specialist palliative medicine physicians, demographic characteristics, 2008–2012 ....................................................................................................................................... 64
Table 7.2: Employed specialist palliative medicine physicians, average number of total hours worked per week, type and sex, 2008–2012 .............................................................................. 65
Table 7.3: Employed specialist palliative medicine physicians, average total hours worked per week, FTE and FTE per 100,000 population, states and territories, 2012 ....................... 65
Table 7.4: Employed specialist palliative medicine physicians by remoteness area, average total hours worked per week, 2012 ............................................................................................ 66
Table 8.1: PCOC palliative care episodes, by top four languages spoken at home, 2013 ..................... 70
Table 8.2: PCOC palliative care episodes, by country of birth, 2013 ....................................................... 70
Table 8.3: PCOC palliative care episodes, cancer and non-cancer diagnosis, 2013 ............................... 71
Table 8.4: PCOC palliative care episodes, three most frequently recorded cancer diagnoses, 2013 ................................................................................................................................................. 71
Table 8.5: PCOC palliative care episodes by socioeconomic status, 2013............................................... 72
Table 8.6: PCOC, average number of elapsed days by palliative care setting, 2013 ............................. 72
Table 8.7: PCOC, number of closed episodes by palliative care setting, 2011 to 2013 .......................... 73
Table 8.8: PCOC, closed episodes by number of elapsed days in palliative care inpatient and ambulatory/community care settings, 2013 ............................................................................. 73
Table 8.9: PCOC, phase counts by palliative care phase and setting, 2013 ............................................ 75
Table 8.10: PCOC, average phase length (elapsed number of days) by palliative care phase type and setting, 2013 ................................................................................................................... 75
Table 8.11: Summary of PCOC palliative care outcome benchmark results, 2013 .................................. 78
Table 9.1: Public acute hospitals with hospice care units, by remoteness area, states and territories, 2011–12 ........................................................................................................................ 80
Table 9.2: Public acute hospitals with hospice care units, states and territories, 2007–08 to 2011–12 ........................................................................................................................ 81
Table 9.3: Characteristics of hospice care units in private acute and psychiatric hospitals in 2011–12 ...................................................................................................................... 82
Table 9.4: Number of DVA clients receiving palliative care from Community Nursing services in 2012–13 ....................................................................................................................... 82
Table 9.5: Participating Cycle 1 services rating Standards as a high-improvement priority, 2010 to 2013 .................................................................................................................................... 84
Table 9.6: Participating Cycle 2 services rating Standards as a high-improvement priority, 2013 ................................................................................................................................................. 84
Table S2.1: Palliative care separations, by age and sex, all hospitals, 2011–12 ........................................ 85
Table S2.2: Palliative care patients among those who died as an admitted patient, public and private hospitals, 2002–03 to 2011–12 ................................................................................. 86
Table S5.1: Permanent residential aged care residents, by care type, sex and age group, 2012–13 ........................................................................................................................................... 87
Table S5.2: Admissions to permanent residential aged care, by care type, sex and age group, 2012–13 ............................................................................................................................. 88

134 Palliative care services in Australia 2014
Table S5.3: Permanent residential aged care, by care type and demographic characteristics, 2012–13 ........................................................................................................................................... 89
Table S5.4: Permanent residential aged care residents, rate per 100,000 population, by care type, age group and remoteness area, 2012–13 ................................................................ 90
Table S5.5: Admissions to permanent residential aged care, rate per 100,000 population, by care type, age group and remoteness area, 2012–13 ........................................................... 90
Table S5.6: Permanent residential aged care residents, rate per 100,000 population, by care type, age group and state, 2012–13 ............................................................................................. 91
Table S5.7: Permanent admission to residential aged care, rate per 100,000 population, by care type, age group and state, 2012–13 .................................................................................... 91
Table S5.8: Recorded diagnoses in ACFI-appraised permanent residential aged care residents, 2012–13 ......................................................................................................................... 92
Table S5.9: Separations from permanent residential aged, by care type and length of stay, 2012–13 ........................................................................................................................................... 93
Table S5.10: Permanent residential aged care residents granted hospital leave, by care type, state or territory and remoteness area, 2012–13 ....................................................................... 93
Table S6.1: Palliative care schedule items: numbers of patients and prescriptions, by age and gender, 2012–13 ..................................................................................................................... 94
Table S6.2: PBS/RPBS subsidised palliative care schedule items, by prescribing clinician, states and territories, 2012–13 ..................................................................................................... 95
Table S6.3: Total (PBS/RPBS subsidised and under co-payment) palliative care schedule items, by prescribing clinician, states and territories, 2012–13 .......................................................... 96
Table S6.4: Palliative care schedule items by medication type, by prescribing clinician, 2008–09 to 2012–13 ........................................................................................................................ 97
Table S6.5: PBS/RPBS subsidised palliative care schedule items for pain relief, states and territories, 2012–13 ........................................................................................................................ 98
Table S6.6: Total (PBS/RPBS subsidised and under co-payment) palliative care schedule items for pain relief, states and territories, 2012–13 ................................................................. 99
Table S8.1: PCOC palliative care episodes by inpatient and ambulatory/community setting, 2013 ............................................................................................................................................... 100
Table S8.2: Summary of PCOC palliative care outcome benchmark results, by palliative care setting, 2013 ......................................................................................................................... 101
Table B1: MBS-subsidised palliative medicine specialist services items .............................................. 112
Table C1: Summary of approaches used to calculate age-standardised rates ..................................... 114
Table C2: Diagnosis codes used to identify specific diseases other than cancer ................................. 117
Palliative care services in Australia 2014 135
List of figures Figure 2.1: Palliative care-related separations, patient days and ALOS, public and private
hospitals, 2002–03 to 2011–12 ...................................................................................................... 25
Figure 2.2: Palliative care patients among those who died as an admitted patient, all hospitals, 2002–03 to 2011–12 ........................................................................................................................ 28
Figure 5.1: Residential aged care permanent residents and permanent admissions appraised as requiring palliative care, by age group, 2012–13 ...................................................................... 45
Figure 5.2: Residential aged care permanent residents appraised as requiring palliative care or other care types, by remoteness area, 2012–13 ......................................................................... 46
Figure 5.3: Permanent residential aged care residents appraised as requiring palliative care or other care types using ACFI, by length of stay, 2012–13 ......................................................... 48
Figure 6.1: Palliative care schedule items (subsidised and under co-payment), prescriptions and patients, by age group, 2012–13 .................................................................................................. 51
Figure 8.1: Age distribution for PCOC inpatient and ambulatory/community episodes of care, Australia, 2013 ............................................................................................................................... 69

136 Palliative care services in Australia 2014
List of boxes Box 1.1: World Health Organization’s definition of palliative care .......................................................... 1
Box 2.1: Index of Relative Socio-Economic Disadvantage ........................................................................ 18
Box 3.1: Defining a palliative care-related encounter ................................................................................ 32
Box 7.1: Medical Workforce Survey 2012 .................................................................................................... 63
Box 8.1: Summary of outcome measures 1–3 ............................................................................................. 77
Box 9.1: The Standards .................................................................................................................................. 83
Box C1: Approach used to identify separations with a principal diagnosis of cancer ....................... 116

Palliative care services in Australia 2014 137
Related publications This report, Palliative care services in Australia 2014, is part of an annual release. The earlier editions can be downloaded for free from the AIHW website <http://www.aihw.gov.au/publication-detail/?id=60129545247>. The website also includes information on ordering printed copies.
The following AIHW publications relating to palliative care might also be of interest:
• AIHW 2011. Identifying admitted patient palliative care hospitalisations: technical paper. Cat. no. HWI 113. Canberra: AIHW.
• AIHW 2011. Trends in palliative care in Australian hospitals. Cat. no. HWI 112. Canberra: AIHW.
Palliative care services in Australia 2014
Palliative care services in Australia 2014 is the third in a planned series of annual reports providing a detailed picture of the national response to the palliative care needs of Australians. Information from a range of data sources from 2012–13 and, where indicated 2011–12, are presented, as are changes over time. There were more than 57,600 palliative care-related separations reported in public and private hospitals in 2011–12. Almost $4.7 million in Medicare Benefits Schedule payments was paid for palliative medicine specialist services in 2012–13.
Palliative care services in Australia 2014A
IHW