Embed Size (px)
Citation preview

Paleoshorelines in the Upper Cretaceous Point Lookout Sandstone,
Southern San Juan Basin, New Mexico
Robert S. Zech
U.S. Geological Survey
Denver, CO
Open-File Report 82-135
1982
This report is preliminary and has not been reviewed
for conformity with U.S. Geological Survey editorial
standards.

Table of Contents
Page
Abstract.............................................................. 1
Introduction..........................................................2
Geologic Setting......................................................4
Depositional Envi ronments.............................................8
Upper Shoreface..................................................8
Foreshore.......................................................12
Beach Ridge and Washover........................................12
Eolian..........................................................15
Depositional Sequence................................................15
Interpretation of Paleogeomorphic Features...........................16
Economic Significance................................................20
Summa ry.............................................................. 21
References...........................................................22
Illustrations
Figure 1. Index map showing study area and Point Lookout Sandstone...3
2. Topographic map showing location of study area.............5
3. Schematic diagram showing stratigraphic relationships......?
4. Cross section _A-A/ showing sedimentary structures,..........
measured sections A-D, and sedimentary sequence IV.......9
5. Cross section JJ-]^' showing^sedimentary structures, mea
sured sections E-K, and sedimentary sequences I-III.....10
6. Plan view diagram showing nearshore currents..............11
7. Schematic cross sections of washover deposits.............14
8. Topographic map showing distribution of paleo-
geomorphic features.....................................19

ABSTRACT
LANDSAT images and aerial photography reveal several parallel linear
features as much as 17 km long and 0.7 km wide. Detailed cross sections
normal to a linear feature show it to be an exhumed paleoshoreline containing
several overlapping sandstone units. Each unit tends to pinchout into the
shales of the overlying Menefee Formation, showing a range of depositional
environments including upper shoreface, foreshore, washover and eolian.
Paleogeomorphic elements, predominately beach ridges and interridge swales,
shape the upper surface of the sandstone and produce a relief *as great as 4.2
m. The various components found in the paleoshoreline create a trellis-like
drainage pattern that contrasts with the regional dendritic drainage pattern;
the resulting linear feature is easily discernible on aerial photography and
LANDSAT images. The rapid lithologic and thickness changes of the sandstone
bodies in these linear features provide excellent potential as stratigraphic
trap for hydrocarbons. Paleoshoreline facies are likely to be preserved in
areas of thickest marginal marine regressive sand accumulation and similar
paleoshoreline systems may be preserved at depth in the Point Lookout
(Sandstone) or other Cretaceous sandstones.

INTRODUCTION
Field investigation of a prominent linear feature first identified on
Landsat imagery and aerial photography (Zech and Knepper, 1979) has led to the
recognition of a paleoshoreline as reflected by modern geomorphology. Landsat
image E-1425-17193 shows this feature to be approximately 17 km in length and
0.7 km in width. The linear feature is best exposed in the study area 32 km
northeast of Gallup, New Mex. (fig. 1). At this locality the overlying
Menefee Formation is present and its relationship with the Point Lookout may
easily be seen. The linear feature is the result of variations in lithology
and thickness, and by paleogeomorphic and depositional features preserved in
the upper part of the Point Lookout Sandstone. These elements are reflected
in modern topography and are the result of Cretaceous coastal processes which
formed the Point Lookout Sandstone.
Field work on the paleoshorelines of the Point Lookout Sandstone was done
during the summer of 1980. Methods of study included the following:
interpretation of LANDSAT images and aerial photographs, fracture and fault
analysis, construction of detailed measured sections and cross sections, Abney
level surveys, and investigation along the length of the feature to determine
continuity of form and internal structures. Previous work in this area
includes the geologic mapping of the Oak Springs and Hard Ground Flats
Quadrangles (Kirk and Zech, 1976a, 1976b).

109* 108' 107' 106'
37' -
36' -
35* -
N.M. _/
Index MapOutcrop of
Point Lookout Sandstone550 Farmington
Outcrop ofPoint Lookout
Sandstone
' i' \ f ' I . 0 ZO 40 _____KILOMETERS
Figure 1.--Index map showing study area and Point Lookout Sandstone outcrop in the San Juan Basin, New Mexico.

GEOLOGIC SETTING
Within the study area (fig. 2), three Upper Cretaceous rock units are
exposed; the Gibson Coal Member of the Crevasse Canyon Formation, the Point
Lookout Sandstone, and the Cleary Coal member of the Menefee Formation.
Structurally, the study area may be characterized as a homocline gently
dipping 3° to the north-northeast. Inspection and analysis of fractures and
faults did not reveal any significant trend prarallel to the linear feature.
However, a regional fracture pattern trending N. 25° E. is well developed in
the Point Lookout Sandstone and strongly influences the modern-day drainage
pattern. Except for minor intraformational faults in the Cleary Coal Member,
the area generally lacks any surface expression of faulting.
The Gibson Coal Member of the Crevasse Canyon Formation represents
sediment accumulation in a lower coastal-plain environment. It is composed of
a variable, interbedded sequence of light- to dark-gray shale and siltstone,
lenticular very fine to medium-grained crossbedded sandstone, minor dark-gray
carbonaceous shale and lenticular, subbituminous coals (Kirk and Zech, 1977).
The thickness of the Gibson Coal Member in the study area is 30-45 m.
The Point Lookout Sandstone is a regressive marginal marine coastal
barrier sandstone which separates the open marine facies from the restricted
or nonmarine facies. The Point Lookout is approximately 49 m thick in the
study area. It is generally a yellowish gray (5_^ 7/2) to a pale-grayish-
orange (10^7/4), very fine- to fine-grained, well-sorted, subrounded to
subangular, calcareous sandstone. The Point Lookout Sandstone overlies the
Gibson Coal Member of the Crevasse Canyon Formation, and the contact is
generally sharp and well defined to the north-northeast (Kirk and Zech,
1976b). Five kilometers north of the study area, the Point Lookout Sandstone
is split into two units by the Satan Tongue of the Mancos Shale. The lower

108°30'00" 108° 27'30'
30" -
5°40'00 nn»
Figure 3
Crownpoint
Contour Interval 200 ft
Figure 2. Topographic map showing location of study area and cross sections A-A 1 and B-B 1 .

regressive unit of the Point Lookout Sandstone is called the Hosta Tongue.
Rocks equivalent to the Hosta Tongue interval may make up the lower half of
the Point Lookout in the study area but are not differentiated due to the
absence of the Satan Tongue. The Point Lookout Sandstone changes character
and thins to the west and south of the study area reflecting the transition
from marine to fluvial facies (fig. 3) (Kirk and Zech, 1976b). Seven
kilometers south of the linear feature the Point Lookout pinches out between
the continental beds of the overlying Cleary Coal Member of the Menefee
Formation and the Gibson Coal Member of the Crevasse Canyon Formation.
Sedimentary structures and bedding in the Point Lookout Sandstone include
gently dipping parallel beds, small- and medium-scale low- to high-angle
trough-crossbedded, wavy-nonparallel beds, and contorted beds. These
structures will be discussed in more detail in the following section.
The Cleary Coal Member of the Menefee Formation represents sediment
accumulation in a lower coastal-plain environment which prograded to the
northeast parallel to and landward of the regressive Point Lookout
coastline. The Cleary Coal Member is composed of a variable interbedded
sequence of light- to dark-gray shale and siltstone, lenticular very fine to
medium-grained, white to tan fluvial sandstone, minor dark-gray cabonaceous
shale, and lenticular subbituminous coal beds. The contact with the
underlying Point Lookout Sandstone is generally sharp but interfingered,
particularly to the south and west^toward the depositional pinchout of the
Point Lookout Sandstone (Kirk and Zech, 1976b). The thickness of the Cleary
Member is approximately 62 m. A few intraformational faults with
displacements of 0.5 m or less are present in the Cleary Coal Member and are
probably the result of differential compaction beneath the channel sandstones
(Cavaroc and Flores, 1980).

sw NE
Marine sandstone
Paludal shale and sandstone
Figure 3.--Schematic diagram showing stratigraphic relationships and major depositional facies of rock units in the study area Kmf, Menefee Formation; Kpl, Point Lookout Sandstone; Kplh, Hosta Tongue of the Point Lookout Sandstone; Kms, Satan Tongue of the Mancos Shale; and Keg, Gibson Coal Member of the Crevasse Canyon Formation.

DEPOSITIONAL ENVIRONMENTS
Eleven detailed measured sections and the construction of two cross sections
(fig. 2) perpendicular to the linear feature shows an orderly sequence of
coastal sedimentation from shoreface to lower coastal-plain environments.
Most of the data for the cross sections were collected along the lines of
section, however some details were projected along the depositional strike of
the Point Lookout Sandstone in order to complete the section and aid in
interpretation.
Upper Shoreface
The northern third of cross section _A-V (fig. 4) and the northern part
of unit I of section j^'-B/ (fig. 5) show the upper part of the Point Lookout
Sandstone to be predominately composed of medium- to small-scale low-angle
trough crossbeds oriented in a northwest-southeast direction. These trough
crossbeds v are thought to be produced by longshore currents which develop
within the breaker zone by wave action and run parallel to the shoreline a few
tens of meters distant (Reineck and Singh, 1975; Molenaar, 1973). The plunge
of the trough axes indicate the dominant sediment transport direction was to
the northwest. These troughs range in width from 0.4 to 1.5 m and from 0.1 to
0.45 m in height. The few troughs found oriented at right angles to the
shoreline may be products of rip currents draining excess water from the swash
zone and backshore runnels (fig. 6). The sandstone in this environment is
moderately well sorted, lower medium grained (1.5 0), and subrounded, with
little interstitial clay. A few sandstone pebbles may be found at the base of
the larger troughs. These pebbles may represent a local early cementation of
the unconsolidated Point Lookout Sandstone which was then transported,
rounded, and redeposited by longshore currents. The upper shoreface

METE
RS FE
ET
10 MO
20
0 20
40
FEET
0A0
(
i- ',
i'
0 5
10
15 ME
TERS
Dep
osit
ion
s!
En
viro
nm
ents
Lo
wa
r C
oaata
l P
lain
Eo
llan
Wa
ah
ov
ar
Fo
rcth
or*
Up
pe
r 3h
or«
f«o
*
Clc
ary
C
oal
M
«m
b»r,
M
*n«l*
«
Fo
rmat
ion
) P
oin
t L
oo
kou
t S
and
ato
na
Figu
re 4. Cross
sect
ion
A-A
1 sh
owin
g se
dime
ntar
y st
ruct
ures
, meas
ured
sections
A-D, an
d se
dime
ntar
y sequence I
V.

B'
Dep
osit
ion
s!
En
viro
nm
ents
Lo
w»
r C
o«
tt«
l P
lain
Flu
vlc
l o
r T
ld»
l C
h*n
n«l
Eo
lltn
W«ih
ov»r
Fo
rcth
or*
Up
per
Sh
orc
fac
*
Clt
ary
C
oal
M
«mb
«r.
M«n
«f««
F
orm
atio
n
) P
oin
t L
oo
kou
t S
and
sto
ne
Figu
re 5
. Cross
sect
ion
B.-B
/ sh
owin
g se
dime
ntar
y st
ruct
ures
, measured s
ections
E-K, an
d sedimentary
sequ
ences
I-II
I.

COASTAL CURRENT
LONGSHORE
CURRENT
SWASH
Figure 6.--Plan view diagram showing nearshore currents. (Modified from Reineck and Singh, 1975.)
11
environment is also present in part of the measured sections A, B, (fig. 4),
and measured sections E through I (fig. 5).
Foreshore
Within the study area the foreshore facies may reach a thickness of 6 m
and is thought to represent deposition in the swash zone or beach. The
foreshore beds are typically 7.5-20 cm thick, parallel, and inclined at a low
angle in a seaward direction (northeast). Individual beds may be followed as
much as 19 m parallel to and as much as 12 m normal to the shoreline. Where
the unit is overlain by the finer grained sediments of the lower coastal plain
environment, the bedding is partially to totally obscured by burrowing and
root tubes(?); this bioturbation may reach a depth of 1 m or more. The
sandstone in this environment is very fine grained (2.0 0), well sorted,
subrounded to rounded and contains little interstitial clay. Slight angular
differences between beds or groups of beds may indicate this unit was not
deposited during one event, but built up over several events. This facies
frequently shows evidences of subaerial erosion such as fluvial or tidal
channels (fig. 5, section I) and storm scarps. The foreshore facies is
present in measured sections B, H, I, and J (figs. 4 and 5).
Beach Ridge and Washover
The beach ridge and washover deposits are discussed together due to the
incomplete development of a beach ridge facies and the merging without
apparent discontinuity of the foreshore and washover facies.
The poorly developed beach ridge facies are located in the transition
zone between foreshore and washover facies. The beach ridge facies are
characterized by forset stratification composed of beds 5-20 cm thick dipping
12

2°-9° landward to the southwest. The forset stratification ranges from 0.25 m
to 1.0 m in height and from 1.1 m to 2.2 m in length. The foreset beds become
wavy, irregular, and non-parallel, merging with the washover deposits. The
beach ridge may be overlain by subsequent washover deposits.
The washover deposits in the study area were deposited in the upper part
of the beach immediately landward of the foreshore or beach ridge. This is
produced by the overwash that carries over the foreshore without flowing
directly back to the sea. The area of the coast where washover deposition
occurs is normally dry except during high-water periods such as storm surges
when the area is flooded by overwash and receives most of its sediment. This
environment typically serves as a major sand source for back beach dunes
during interstorm periods and may show deflation features or eolian ripples.
The bedding preserved in this unit are subhorizontal wavy discontinuous to
continuous nonparallel beds 5-15 cm thick. The dip of the beds is generally at
a low angle in the landward direction. Small trough crossbeds are preserved
in the medial and distal parts of the washover deposit and probably represent
the beginning of channelized flow of the overwash. Delta-foreset strata may
be present in washover deposits and are produced when the washover sediment is
transported into a standing body of water. The landward-dipping delta
foresets show a dip as much as 26° and may show forset slump structures. A
schematic cross section of washover deposits is shown in figure 7.
Sand composing both the beach ridge and washover deposits ia the study
area ranges from lower to upper fine grained (2.5-2.0 0) moderately sorted,
and subangular. Sedimentary structures of both environments may be obscured
by burrowing or root tubes(?). Washover deposits are shown in measured
sections C, F, G, H, and K (figs. 4, 5).
13


Eolian
The sand deposited along the seashore is exposed to wind activity and may
be reworked into dunes. The eolian facies is the least likely of all the
coastal facies to be preserved, because they are commonly reworked by
prograding fluvial facies. However in measured sections I and K (fig. 5) the
rather steep foreset laminae of eolian beds have eroded into the washover
facies and are preserved. Sand composing this facies is slightly finer
grained (2.5 0) and better sorted than the sand of the water-laid sediments
discussed above. A fine-grained, friable, and structureless sandstone unit is
present north of measured section B (fig. 4). This unit may represent an
eolian deposit which accumulated in the lee of a storm or high-tide erosional
scarp.
DEPOSITIONAL SEQUENCE
The sedimentary structures exposed in the upper part of the Point Lookout
Sandstone in the study area are alined parallel to a linear Cretaceous
shoreline and clearly show several overlapping events of regressive coastal
sedimentation. Stratigraphic unit I shows the first sedimentary sequence
deposited (fig. 5). Tracing this unit lateraly from northeast to southwest
reveals sedimentary structures indicative of upper shoreface, foreshore, beach
ridge(?), washover, and eolian environments. The regressive sequence is
completed by the prograding back-barrier deposits of the Cleary Coal Member
which directly overlies unit I from measured sections K to F.
The middle Stratigraphic unit (II) shows medial and distal washover
sediments deposited on the eroded unit I (measured section E) and into the
carbonaceous shaly sands of the prograding lower coastal plain environment of
the Cleary Coal Member (measured sections F, G, and H). A series of landward-
15

dipping (southwest) delta foresets indicate deposition during several events
into a standing body of water. Progradation of the back-barrier coastal-plain
sediments continues and overlies the washover deposit (measured section H).
A sequence of delta foresets similar to unit II make up the bulk of unit
III and indicate this part of the unit was also deposited in a washover
environment (measured sections F, G, H, fig. 5). A reworking of these
sediments by eolian dunes which cut out the washover sequence can be seen in
measured section I. These large scale eolian beds form a linear ridge
parallel to the paleoshoreline. The eolian sediments thin landward becoming a
unit (measured section J) consisting of generally horizontal beds which are
bioturbated, contorted, and locally contain a few trough crossbeds. This
probably indicates the landward thinning and intertonguing of eolian deposts
into the coastal-plain environment. Dewatering of the fine-grained coastal-
plain sediments may have formed the contorted beds.
Exposures did not permit a detailed correlation of the northern cross
section (jA-jA 1 fig. 3) with the southern cross section (JMJ/ fig. 4).
Projected along strike, the facies exposed in cross section _A.-jA' appear to be
younger and stratigraphicly higher than those of cross section JB-JT. The
upper shoreface, foreshore, beach ridge, and washover facies exposed in this
cross section represent another regressive event similar to unit I in figure 4.
INTERPRETATION OF PALEOGEOMORPHIC FEATURES
In addition to the various coastal sedimentary facies, the Point Lookout
paleoshoreline contains several recognizable paleogeomorphic features. The
northern edge of this linear paleoshoreline is marked by a scarp 2.2 m in
height and approximately 900 m in length (measured section B, fig. 4). This
feature is very similar to scarps found on modern beaches which are produced
16

by the erosive action of storm waves (Ruzyla, 1973). Behind the scarp a ridge
and swale system is preserved on the upper surface of the Point Lookout Sand
stone. The ridge lithology and structure has already been described, however
it should be noted that the ridge is a positive paleogeomorphic feature with a
present measured maximum relief of 2.1 m. The maximum length noted of a
single ridge is 1200 m. Landward from the beach ridge, a parallel interridge
swale is carved into the underlying washover deposits. The swales are
approximately 30 m wide and as deep as 2 m. Ridge and swale features of
similar dimensions are found in the modern coastal environment and have been
reported by several authors-(Bernard and others, 1970, Davis and others 1972,
Reineck and Singh, 1975). The swales are negative paleogeomorphic features
and were filled in with the finer grained carbonaceous shales, sandstones, and
silty coals of the Cleary Coal Member. A few lenticular trough crossbedded
sandstones are present in this fill with trough axes parallel to the beach.
Swales are distinguished from beach runnels by their position behind the beach
ridge and the predominance of fine-gained fill. The paleogeomorphic features
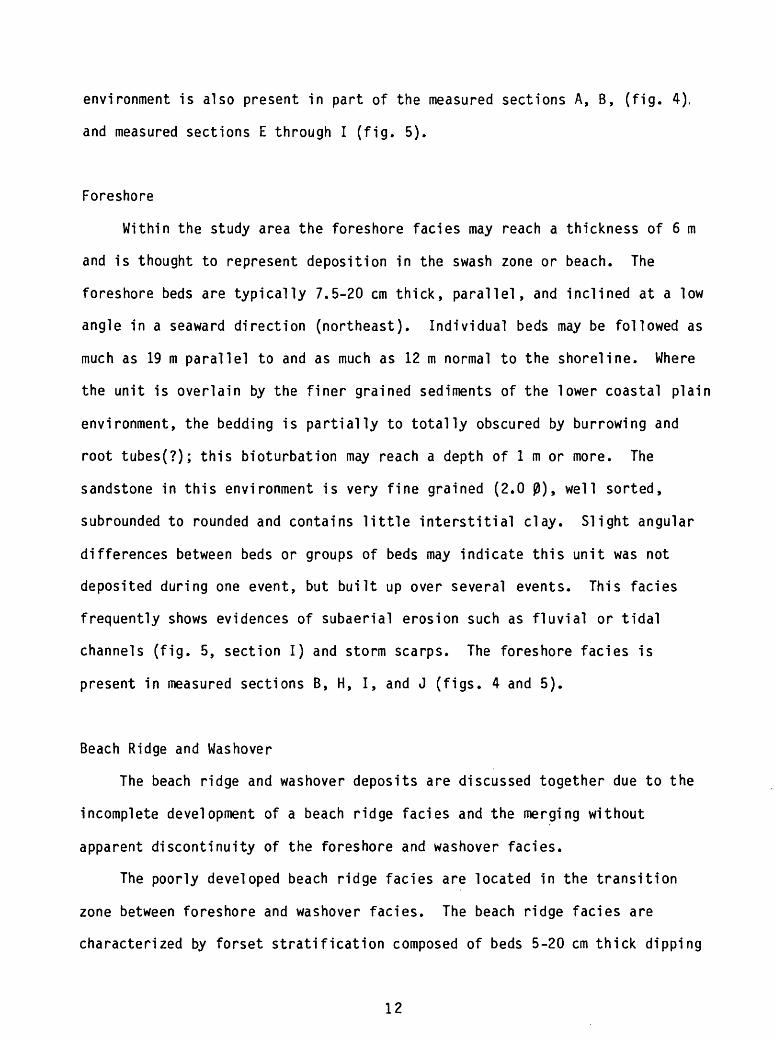
noted in the area of study are shown in figure 8.
The thickening of the resistant Point Lookout Sandstone in the washover
deposits and ridges and its thinning in the swales which were filled with the
less-resistant Cleary Coal Member has influenced present-day topography and
drainage. Regionally major streams flow down the structural dip to the north
toward the center of the San Juan Basin and are controlled in part by the
northeast-trending regional fracture pattern. Tributaries to the main streams
commonly exhibit a dendritic pattern except locally where they are altered to
a trellis-like pattern along the Point Lookout paleoshoreline. This change in
the drainage pattern is controlled by the presence of easily eroded Cleary
sediments deposited as fill in the paleoswales. Upon further topographic
17

dissection, ridges are formed by the thicker and more resistant beach ridge
and washover facies. The effects of paleotopographic and paleogeomorphic
features on modern topography can be seen by noting the changes in stream
courses in figure 8.
On a regional scale, a linear feature resulting from the paleoshoreline
system can easily be seen. The feature is enhanced on aerial photographs and
Landsat images by the absence of vegetation on the paleoridges and the
presence of vegetation in the paleoswales or present-day drainages.
18
108° SO'OO" 108° 27*30'
35° 42'30"
Dashed where inferred «« Ridge
x x x x x *-* Swale
0 2000
0 2000 4000 METERS
i Wave Cut Scarp FEET
Contour interval 200 ft
Figure 8. Topographic map showing distribution of paleogeomorphic features in the Point Lookout Sandstone.
19

ECONOMIC SIGNIFICANCE
The paleoshoreline exposed in the Point Lookout Sandstone serves as an
exhumed example of a potential stratigraphic trap. An effective trap may be
formed by the paleotopography on the upper surface of the Point Lookout
Sandstone. A paleoshoreline system may contain many ridge and swale sets,
each with a relief as great as 4.2 m. The length of each of these features
may be as much as 1200 m. Another potential trap is the rapid thinning and
pinching out of marginal-marine and washover deposits. These wedge-shaped
sandstone bodies may have a thickness of as much as 5 m and a length equal to
or greater than the associated ridges. In both of the above examples the
sandstones are overlain or intertongue with the relatively impermeable lower
coastal-plain deposits of the Menefee Formation.
It should be noted that these facies overlap seaward and this imbrication
increases the thickness of a potential stratigraphic trap. Also, the length
of the paleoshoreline is limited by its surface exposure. It would be
reasonable to assume the exposed paleoshoreline continues for some distance in
the subsurface.
Similar paleoshoreline features may be present deeper in the San Juan
Basin in the Point Lookout Sandstone and in other Cretaceous marginal-manine
sandstones. Hollenshead and Pritchard (1973) observed that "the regressive
Point Lookout *** shoreline did not move uniformly, depositing a blanket of
sand of constant thickness. Instead, it moved very rapidly across some areas,
whereas in other areas it remained stationary, within a narrow belt. In areas
where the shoreline remained stationary, thick well-sorted sand bodies are
present." Foreshore, washover and eolian facies would not be as well
developed or preserved in areas of rapid shoreline movement. The facies which
have potential as stratigraphic traps are more likely to be found in areas
20
where the shoreline remained stationary for relatively long periods of time.
Likewise the landward lower coastal-plain deposits would remain stationary,
have a greater overall thickness and thicker coal beds.
SUMMARY
A northwest trending linear feature originally identified from aerial
photography and LANDSAT images of the southern San Juan Basin is the result of
differential erosion along a paleoshoreline complex in the Upper Cretaceous
Point Lookout Sandstone. The paleoshoreline is 17.0 km long and 0.7 km wide
and is made up of a number of shorter linear sedimentary deposits and
paleotopographic features such as beach ridges, eolian dunes, swales and
coalesced washover sediments. The geometry of the various elements which make
up the paleoshoreline complex holds significant potential as a strati graphic
trap for hydrocarbons. These deposits may form during a particular style of
regressive deposition where the shoreline was stationary for relatively long
periods of time. Additional paleoshoreline systems may be found at depth in
the Point Lookout or in other Cretaceous regressive marine sandstones such as
the Gall up Sandstone or Dalton Sandstone Member of the Crevasse Canyon
Formation.
21
REFERENCES
Bernard, H. A., Major, C. F., Jr., and Parrott, B. S., 1970, The Galveston
Barrier Island and Environments: A model for Predicting Reservoir
Occurrence and Trend, in (Bureau of Economic Geology, The University of
Texas at Austin): Recent Sediments of Southeast Texas, Guidebook Number
II.
Cavaroc, V. V., Jr., and Flores, R. M., 1980, Variations in Cretaceous coal -
bearing strata, Gallup coal field, New Mexico; Denver Colorado American
Association of Petroleum Geologists and Society of Economic
Paleontologists and Mineralogists Annual Convention, 1980 Denver Colorado
Book of Abstracts.
Davis, R. A., Jr., Fox, W. T., Hayes, M. 0. and Boothroyd, J. C., 1972,
Comparison of ridge and runnel systems in tidal and non tidal
environments: Journal of Sedimentary Petrology, v. 2, p. 413-421.
Hollenshead, C. T., Pritchard, R. L., 1973, Geometry of producing Mesa Verde
sandstones, San Juan Basin; j_n_ Sandstone reservoirs and stratigraphic
concepts II: American Association of Petroleum Geologists Reprint Series
No. 8, p. 4-25.
Kirk, A. R., and Zech, R. S., 1976a, Preliminary geologic and structure
contour map of the Oak Springs Quadrangle, McKinley County, New Mexico;
U.S. Geological Survey, Open-File Report 76-347, scale 1:24,000.
____, 1976b, Preliminary geologic and structure contour map of the Hard
Ground Flats Quadrangle, McKinley County, New Mexico; U.S. Geological
Survey Open-File Report 76-859., scale 1:24,000.
22

Kirk, A. R., and Zech, R. S., 1977, The transgressive and regressive
relationships between the Upper Cretaceous Mulatto Tongue of the Mancos
Shale and the Da!ton Sandstone Member of the Crevasse Canyon Formation,
Gallup-Pinedale area, New Mexico: New Mexico Geologic Society Guidebook,
28th Ann. Field Conference, p. 185-192.
Molenaar, C. M., 1973, Sedimentary facies and correlation of the Gallup
Sandstone and associated formations, Northwestern New Mexico: Four
Corners Geologic Society Memoir Book 1973, p. 88.
Reineck, H. E., Singh, I. B., 1975, Depositional Sedimentary Environments:
New York, Springer-Verlag, p. 286-294.
Ruzyla, K., 1973, Effects of erosion on barrier-island morphology at Fire
Island, New York, jh^ Coates, D. R., ed., Coastal geomorphology: State
University of New York at Binghamton, p. 219-237.
Schwartz, R. K., 1975, Nature and genesis of some storm washover deposits;
U.S. Army Corps of Engineers, Technical Memorandum No. 61, 69 p.
Zech, R. S., and Knepper, D. H., 1979, Landsat linear feature data of the
Gallup-Grants uranium district, New Mexico; U. S. Geol. Survey Open-File
Report 79-1507, 34 p.
23


![kmf]S; 08f' ] tfn - d2ouvy59p0dg6k.cloudfront.netd2ouvy59p0dg6k.cloudfront.net/downloads/phoksundo_booklet.pdf · kmf]S; 08f' ] tfn - d2ouvy59p0dg6k.cloudfront.net ... 5 Æ](https://img.dokumen.tips/doc/110x75/5c91e52f09d3f21a578c6e75/kmfs-08f-tfn-kmfs-08f-tfn-5-a.jpg)