Embed Size (px)
Citation preview
Hydrol. Earth Syst. Sci., 18, 3891–3905, 2014www.hydrol-earth-syst-sci.net/18/3891/2014/doi:10.5194/hess-18-3891-2014© Author(s) 2014. CC Attribution 3.0 License.
Paleo-modeling of coastal saltwater intrusion during the Holocene:an application to the Netherlands
J. R. Delsman1,2, K. R. M. Hu-a-ng1,3,*, P. C. Vos1, P. G. B. de Louw1, G. H. P. Oude Essink1,3, P. J. Stuyfzand2,4, andM. F. P. Bierkens1,3
1Unit Subsurface and Groundwater Systems, Deltares, P.O. Box 85467, 3508 AL Utrecht, the Netherlands2Critical Zone Hydrology Group, Department of Earth Sciences, VU University Amsterdam, De Boelelaan 1085,1081 HV Amsterdam, the Netherlands3Department of Physical Geography, Utrecht University, P.O. Box 80.115, 3508 TC Utrecht, the Netherlands4KWR Watercycle Research Institute, P.O. Box 1072, 3430 BB Nieuwegein, the Netherlands* now at: Acacia Water, Jan van Beaumontstraat 1, 2805 RN Gouda, the Netherlands
Correspondence to:J. R. Delsman ([email protected])
Received: 24 October 2013 – Published in Hydrol. Earth Syst. Sci. Discuss.: 13 November 2013Revised: – – Accepted: 7 August 2014 – Published: 2 October 2014
Abstract. Coastal groundwater reserves often reflect a com-plex evolution of marine transgressions and regressions, andare only rarely in equilibrium with current boundary condi-tions. Understanding and managing the present-day distri-bution and future development of these reserves and theirhydrochemical characteristics therefore requires insight intotheir complex evolution history. In this paper, we constructa paleo-hydrogeological model, together with groundwaterage and origin calculations, to simulate, study and evaluatethe evolution of groundwater salinity in the coastal area ofthe Netherlands throughout the last 8.5 kyr of the Holocene.While intended as a conceptual tool, confidence in our modelresults is warranted by a good correspondence with a hydro-chemical characterization of groundwater origin. Throughoutthe modeled period, coastal groundwater distribution neverreached equilibrium with contemporaneous boundary condi-tions. This result highlights the importance of historicallychanging boundary conditions in shaping the present-daydistribution of groundwater and its chemical composition.As such, it acts as a warning against the common use ofa steady-state situation given present-day boundary condi-tions to initialize groundwater transport modeling in com-plex coastal aquifers or, more general, against explaining ex-isting groundwater composition patterns from the currentlyexisting flow situation. The importance of historical bound-ary conditions not only holds true for the effects of the large-scale marine transgression around 5 kyr BC that thoroughly
reworked groundwater composition, but also for the more lo-cal effects of a temporary gaining river system still recog-nizable today. Model results further attest to the impact ofgroundwater density differences on coastal groundwater flowon millennial timescales and highlight their importance inshaping today’s groundwater salinity distribution. We foundfree convection to drive large-scale fingered infiltration ofseawater to depths of 200 m within decades after a marinetransgression, displacing the originally present groundwa-ter upwards. Subsequent infiltration of fresh meteoric waterwas, in contrast, hampered by the existing density gradient.We observed discontinuous aquitards to exert a significantcontrol on infiltration patterns and the resulting evolution ofgroundwater salinity. Finally, adding to a long-term scientificdebate on the origins of groundwater salinity in Dutch coastalaquifers, our modeling results suggest a more significant roleof pre-Holocene groundwater in the present-day groundwa-ter salinity distribution in the Netherlands than previouslyrecognized. Though conceptual, comprehensively modelingthe Holocene evolution of groundwater salinity, age and ori-gin offered a unique view on the complex processes shapinggroundwater in coastal aquifers over millennial timescales.
Published by Copernicus Publications on behalf of the European Geosciences Union.
3892 J. R. Delsman et al.: Paleo-modeling of coastal saltwater in the Netherlands
1 Introduction
While fresh groundwater reserves in coastal areas are a vitalresource for millions of people, they are vulnerable to salin-ization, given both their proximity to the sea and the usuallylarge demands on freshwater by the larger population densi-ties in coastal areas (Barlow and Reichard, 2009; Custodioand Bruggeman, 1987; Ferguson and Gleeson, 2012; Postand Abarca, 2009; Werner et al., 2013). Reported impactsof salinizing coastal aquifers include the salinization of ab-straction wells (Custodio, 2002; Stuyfzand, 1996), decreaseof agricultural yield (Pitman and Läuchli, 2002), degradingquality of surface waters (De Louw et al., 2010), and ad-verse effects on vulnerable ecosystems (Mulholland et al.,1997), issues that will only intensify in the future, given theprospects of global change (Kundzewicz et al., 2008; OudeEssink et al., 2010; Ranjan et al., 2006). The above issueshave sparked a surge in renewed scientific interest in the“classic” saltwater intrusion process, i.e., the development ofa landward-protruding saline groundwater wedge under theinfluence of groundwater density differences, as reviewed byWerner et al. (2013).
Given their vulnerability, sustainable management ofcoastal fresh groundwater reserves is of paramount impor-tance. A prerequisite is an accurate description of the present-day distribution of fresh groundwater reserves. That accu-rate description is, however, difficult to obtain: measure-ments are sparse, especially at greater depths, while salinityvaries within short distances, driven by relatively minor headgradients that vary over time (De Louw et al., 2011). Andalthough recent advances in airborne geophysics (FanecaSànchez et al., 2012; Gunnink et al., 2012; Siemon et al.,2009; Sulzbacher et al., 2012) are promising, the availabilityof airborne data is still limited and its reliability decreaseswith depth. Variable density groundwater modeling may beused to assess coastal freshwater resources and managementstrategies (e.g., Nocchi and Salleolini, 2013; Oude Essink etal., 2010). However, as a result of the density feedback of so-lute concentration on groundwater flow, this requires an ade-quate description of the initial solute concentration: a viciouscircle of having to know the salinity distribution to modelthe salinity distribution. A frequent workaround is the as-sumption of steady state, obtained by a spin-up period apply-ing current boundary conditions (e.g., Souza and Voss, 1987;Vandenbohede et al., 2011; Vandenbohede and Lebbe, 2002).However, given the usually long timescales involved, coastalgroundwater systems are rarely in equilibrium, often still re-flecting events occurring thousands or even millions of yearsago (e.g., Groen et al., 2000; Post et al., 2003; Stuyfzand,1993).
Paleo-hydrogeologic modeling, or the transient modelingof the long-term co-evolution of landscape and groundwa-ter flow, may provide a way out of this vicious circle. Thisinvolves starting a model run at a reference point in timewhere the salinity distribution is either more or less known,
or is certain not to influence the present-day salinity distri-bution. Successful use of paleo-hydrogeologic modeling isdifficult however, given the long timescales considered, theoften limited availability of data on paleo-boundary condi-tions and the impossibility of validating past time frames(Van Loon et al., 2009), on top of the “normal” difficul-ties in hydrogeologic (transport) modeling (Konikow, 2010).Paleo-hydrogeologic modeling has been previously appliedto study the influence of groundwater during glacial cy-cles (Bense and Person, 2008; Lemieux and Sudicky, 2009;Person et al., 2012; Piotrowski, 1997), to better explainthe observed pattern in groundwater ages using carbon dat-ing (Sanford and Buapeng, 1996), to study the degrada-tion of fen areas in the Netherlands (Van Loon et al., 2009;Schot and Molenaar, 1992), and to relate archeological settle-ments to historic phreatic groundwater levels (Zwertvaegheret al., 2013). Applications of paleo-hydrogeologic modelingin variable-density flow situations are scarce however, andare limited to the evolution of fresh- and saltwater over thelast century (Nienhuis et al., 2013; Oude Essink, 1996) ormillennium (Lebbe et al., 2012; Vandevelde et al., 2012), us-ing available historic information.
In this paper, we apply paleo-hydrogeologic modelingto study the processes controlling the Holocene evolutionof groundwater salinity in a representative deltaic coastalaquifer: the coastal region of the Netherlands. The studiedregion (Sect. 2) has a complex paleo-geographic history ofmarine trans- and regressions, peat accumulation and degra-dation, and more recently land reclamation, drainage andgroundwater abstraction. The groundwater salinity distribu-tion still reflects this complex history (Oude Essink et al.,2010; Post et al., 2003; Stuyfzand, 1993), and both the paleo-geographic evolution (Vos et al., 2011) and the distribu-tion of aquifer properties (Weerts et al., 2005) are relativelywell known. As such, the region is well suited to a paleo-hydrogeologic modeling approach. In addition, societal inter-est in the region’s groundwater salinity distribution is spurredby a deterioration of surface water quality through exfiltra-tion of brackish groundwater, adversely affecting agricul-ture and vulnerable ecosystems (De Louw et al., 2010; OudeEssink et al., 2010; Van Rees Vellinga et al., 1981). Whilesalinity is the prime focus of the present paper, the approachpresented is considered relevant for the many other societallyrelevant groundwater constituents in coastal aquifers, like nu-trients (Van Rees Vellinga et al., 1981; Stuyfzand, 1993) orarsenic (Harvey et al., 2006; Michael and Voss, 2009).
2 Site description
2.1 Study area
We studied an approximately west-to-east-oriented transect,located some 10 km south of the city of Amsterdam, theNetherlands (Fig. 1). The 65 km long transect is oriented per-pendicular to the coastline and extends from 12 km offshore
Hydrol. Earth Syst. Sci., 18, 3891–3905, 2014 www.hydrol-earth-syst-sci.net/18/3891/2014/

J. R. Delsman et al.: Paleo-modeling of coastal saltwater in the Netherlands 3893
Model transect
Coastline
Head data (n=382)
Chloride data (n=474)
> 20 m MSL
15 - 20 m MSL
10 - 15 m MSL
5 - 10 m MSL
2.5 - 5 m MSL
0 - 2.5 m MSL
2.5 - 0 m BSL
5 - 2.5 m BSL
10 - 5 m BSL
15 - 10 m BSL
20 - 15 m BSL
> 20 m BSL
North Sea
AmsterdamA
B
LakeIJssel
polderHaarlemmermeer
polderHorstermeer
Coastaldunes
Ice-pushedridge
D
B
NL
A'
0 105 km
b)
a)
A' BHolocene
Pleistocene
Figure 1.Location of studied transect (A–B), elevation and main topographical features(a), and a lithological cross section along the transect(A’–B) (b); dashed line in(b) demarcates Pleistocene and Holocene deposits.
to the midpoint of an ice-pushed ridge, forming a regionalgroundwater divide. The transect is exemplary for this partof the coastal region of the Netherlands, intersecting coastalsand dunes, reclaimed lakes, managed fen areas and theaforementioned ice-pushed ridge. Elevations along the tran-sect range from 5 m below mean sea level (b.s.l.) in thedeep polder areas, to locally 35 and 30 m above mean sealevel (m.s.l.) for the dune area and ice-pushed ridge, respec-tively. Present-day climate is categorized as moderate mar-itime, with temperatures that average 10◦C, an average an-nual precipitation total of 840 mm, and an average annualMakkink reference evapotranspiration total (Makkink, 1957)of 590 mm (KNMI, 2010).
The hydrogeology of the area is characterized by 300 mthick deposits of predominantly Pleistocene marine, glacialand fluvial deposits, forming alternating sandy aquifers andclayey aquitards (Fig. 1b). The Maassluis formation com-prises the oldest Pleistocene deposits and includes sandy andclayey sediments of marine origin, limited dated samples in-dicate remaining connate marine groundwater (Post et al.,2003). An aquiclude of Tertiary clays is present below thesedeposits (Dufour, 2000). Excluding the coastal dune area,Holocene deposits are generally no more than 10 m thick,
thinning out in an easterly direction. A more elaborate de-scription of these Holocene deposits and their genesis is pre-sented below. Present-day groundwater flow is directed fromthe elevated dune and ice-pushed ridge areas towards thedeep polder areas in the center of the transect. Water man-agement in the central part is aimed at keeping groundwaterlevels at an optimal level for agriculture, within 1–2 m be-low the ground surface, and requires an extensive network ofcanals, ditches and subsurface drains to drain excess precip-itation and exfiltrating groundwater. Flow direction reversesduring summer, when freshwater from the river Rhine is redi-rected to compensate for precipitation deficits and salinityincreases.
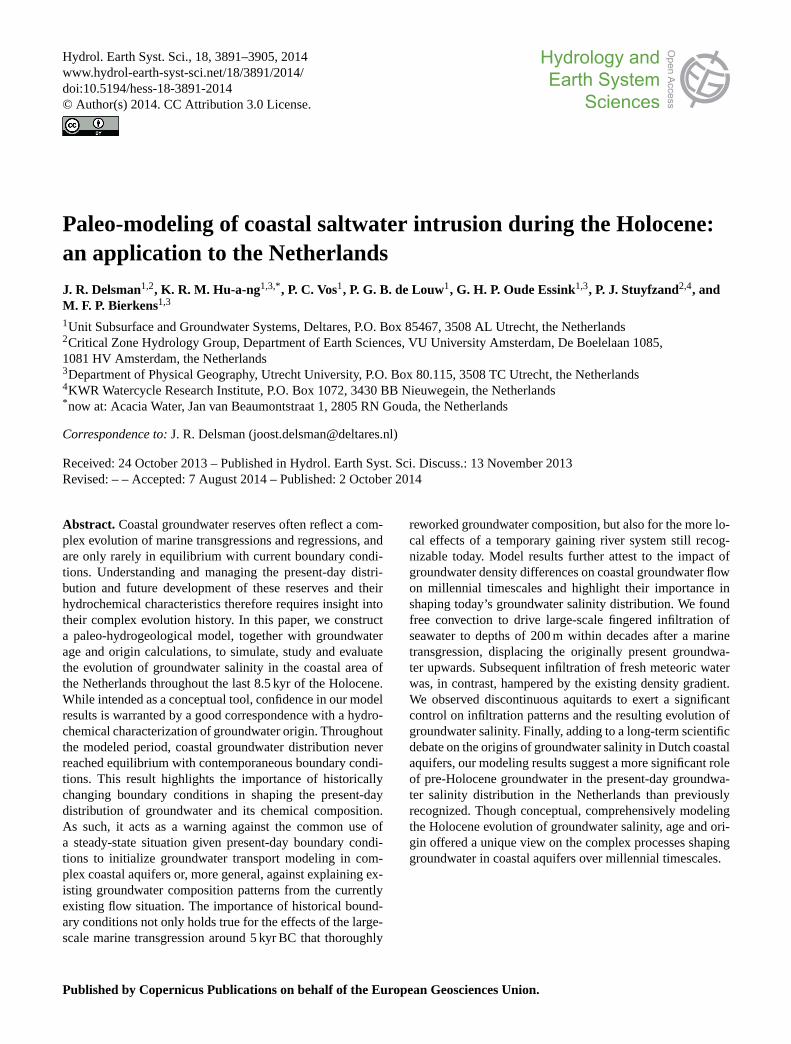
2.2 Holocene paleo-geographical development
An overview of the Holocene paleo-geographical develop-ment of the area is presented in Fig. 2. At the end of thePleistocene, up to about 13 000 BC, the area was character-ized by sandy plains with braided rivers, sloping gently fromthe ice-pushed ridge towards the contemporaneous coast-line. Because of post-glacial sea level rise during the earlyHolocene, groundwater levels started to rise in the coastal
www.hydrol-earth-syst-sci.net/18/3891/2014/ Hydrol. Earth Syst. Sci., 18, 3891–3905, 2014

3894 J. R. Delsman et al.: Paleo-modeling of coastal saltwater in the Netherlands
2000 AD1850 AD
1500 AD1500 BC
3850 BC5500 BC
a)
Embanked area
Reclaimed area
Urban area
Pleistocene deposits
Tidal flats
Salt marsh
Dune area (high)
Dune area (low)
Beach barrier
Peat
Fresh water lake
Floodplain
Model transect
Present coastline
Water course
Sea
c)
e) f)
d)
b)
g)
time [ky AD]
sea
leve
l [m
MS
L]
a
bc
de
f
Legend
Figure 2. Overview of Holocene paleo-geographical development(a–f) and sea level rise (g, adapted from Van de Plassche, 1982).Red dots and letters in(g) refer to the corresponding paleo-geographical map(a–f). For reference, note that the extent of thepaleo-geographical maps equals the extent of Fig. 1a.
zone and promoted the widespread formation of peat. Thecontinuing sea level rise resulted around 6500 BC in the sub-mersion of these peat deposits, when an open barrier sys-tem with barriers and a tidal basin formed to a maximumextent of about three-quarters of the studied transect (trans-gression phase). Around 3950 BC the Dutch coast becamea closed system, when sediment availability had begun tomatch the decreased sea level rise rate (regression phase).The coast now changed into a prograding system that ex-tended into the North Sea until 2500 BC. The tidal areassilted up and freshened, stimulating large-scale peat devel-opment behind the coastal barriers. Peat development was ata maximum around AD 1000, reaching a maximum thicknessof 6 m (elevation of 2 m m.s.l.). Subsequently, peat extractionand anthropogenic drainage resulted in rapid peat degrada-tion, a lowering of the ground surface and the eventual for-mation of several freshwater lakes. Increased sand availabil-ity in the coastal zone around AD 900 led to the formationof an extended and higher coastal dune system (Jelgersmaet al., 1970). Anthropogenic influence grew in importancefrom AD 1500 onwards, through land cultivation, improvedagricultural drainage, river embankment and urban devel-opment. Large-scale land reclamation projects were carriedout on most freshwater lakes in the 19th century, result-ing in the deep polders of Haarlemmermeer (AD 1852) andHorstermeer (AD 1888). Groundwater abstraction started inthe coastal dunes and the ice-pushed ridge in the mid-1800s.Subsequent salinization problems prompted the abandon-
ment of most abstraction wells in the coastal dunes in favorof the current Rhine water infiltration scheme in use since1957, whereby water is infiltrated in infiltration ponds andextracted using recovery canals and horizontal drains.
2.3 Hydrochemical facies analysis (HYFA)
In the 1980s, about 20 piezometer nests in the western partof the studied transect, each with four to fifteen 1 m longmonitor well screens, were sampled and analyzed on mainconstituents, trace elements and environmental tracers (loca-tions and depths in Fig. 6a). Stuyfzand (1993, 1999) usedthe resulting data set (with many more data from monitorwells along the Dutch coast) to depict the spatial distributionof groundwater bodies with a specific origin (hydrosomes),and their hydrochemical facies (distinct hydrochemical zoneswithin each hydrosome). Environmental tracers (Cl / Br ratio,18O, 3H, 14C, SO4 and HCO3) were used to discern the fol-lowing hydrosomes, in order of increasing salinity: (i) freshdune groundwater (rainwater infiltrated in coastal dunes) (inFig. 6d), (ii) fresh, artificially recharged Rhine River water,(iii) slightly brackish polder water (a mix of rainwater, RhineRiver water and exfiltrated Holocene transgression water),which after mixing infiltrated via canals and ditches on ahigher topographical level than the deep polders from whichthe mix originated (P), (iv) two types of brackish ground-water, which infiltrated during the Holocene transgression(LC / Lm), (v) brackish to saline paleo-groundwater upcon-ing from deep marine Tertiary aquitards (M), and (vi) intrud-ing North Sea water (S) (Fig. 6a). Within each hydrosome avariety of hydrochemical facies was discerned by a combina-tion of four aspects: (a) the redox level, as deduced from theconcentrations of O2, NO3, SO4, Fe, Mn and CH4; (b) thecalcite saturation index; (c) a pollution index (POLIN) basedon six equally weighted quality aspects; and (d) the Base EX-change index (BEX), defined as the sum of the cations Na, K,and Mg (in meq L−1), corrected for a contribution of sea salt.
3 Paleo-hydrogeological modeling
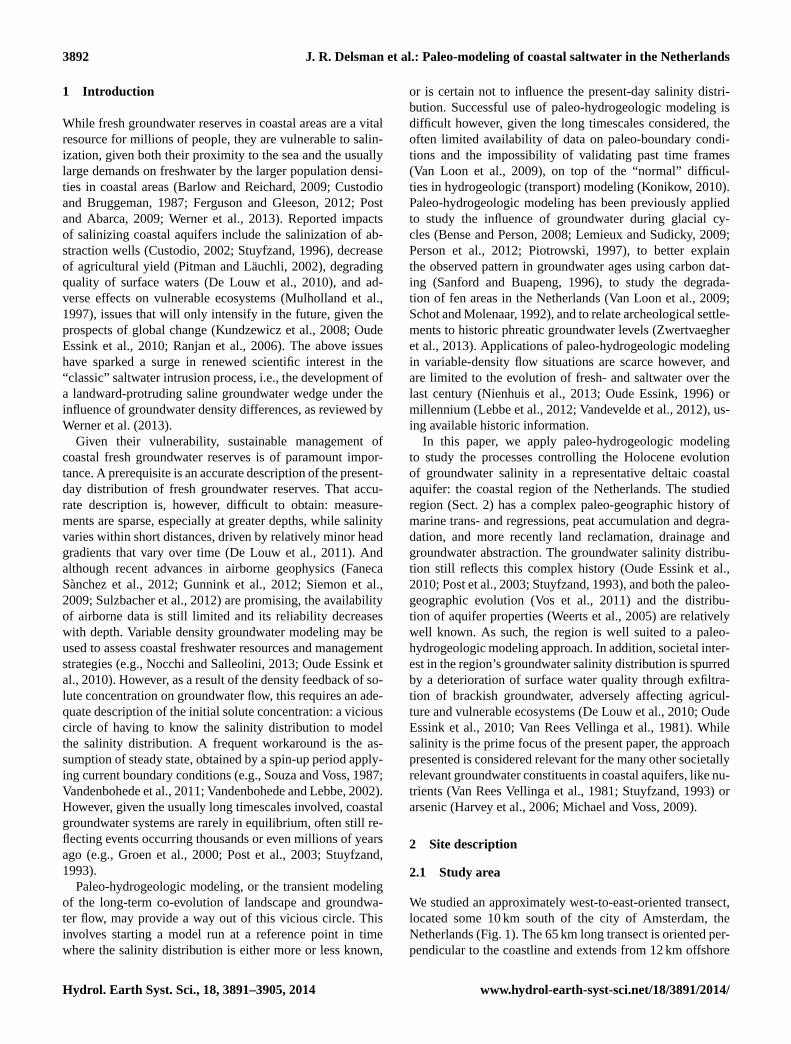
To model the evolution of groundwater salinity through-out the Holocene, we used the variable density groundwa-ter modeling software SEAWAT (Langevin and Guo, 2006)to set up a 2-D model for the described transect (A–B inFig. 1a, conceptual outline in Fig. 3). We assumed a Dirich-let boundary condition (sea level) on the western side, andno-flow boundaries (groundwater divide and geohydrologi-cal base, taken as the top of Tertiary clays (below the Maass-luis formation, Fig. 1b; Dufour, 2000)) on the eastern andbottom side of the transect, respectively. The assumption ofno-flow on the eastern side is motivated by the elevated posi-tion of the ice-pushed ridge in its surroundings during the en-tire modeled period and is supported by model results of thenational groundwater model of the Netherlands (De Lange etal., 2014). The model domain was divided into six hundred
Hydrol. Earth Syst. Sci., 18, 3891–3905, 2014 www.hydrol-earth-syst-sci.net/18/3891/2014/

J. R. Delsman et al.: Paleo-modeling of coastal saltwater in the Netherlands 3895
no flo
w b
oundary
no flow boundary
65 km
300 m
recharge drainage varying per time-slice
ground surfacevarying per time-slice
const
ant head (
sea le
vel)
constant head(sea level varying per time-slice)
extent shown in model results
uniform propertiesKh: 30 m/dKv: 3 m/d
cell varying propertiesdx: 100mdz: 1m - 10m
Figure 3. Conceptual model representation.
fifty-one, 100 m wide model cells in the horizontal, and 102layers in the vertical, whose thicknesses increase with depth(thickness 1 m in upper 60 m, increasing to 10 m at maximumdepth) in the vertical. Cell-specific geohydrological prop-erties were taken from national geohydrological databasesREGIS (Vernes and Van Doorn, 2005) and GEOTOP (Vander Meulen et al., 2013; Stafleu et al., 2011) (both avail-able fromhttp://www.dinoloket.nl). GEOTOP provides de-tailed (100× 100× 0.5 m) estimates of lithology to a depthof 50 m, we applied REGIS-derived formation-specific hy-draulic properties for the deeper subsurface. We assumed ahomogeneous aquifer seaward of the present coastline, giventhe limited availability of geohydrological information. In-formation on present-day water management was obtainedfrom the Netherlands Hydrological Instrument model (DeLange et al., 2014, available fromhttp://www.nhi.nu).
We used chloride to represent salinity, as chloride is thedominant anion in Dutch coastal groundwater and densityis linearly related to it within naturally occurring concen-trations. To better understand the evolution of groundwa-ter salinity, we included several fictitious inert tracers, rep-resenting the various inputs to the groundwater system, asadditional mobile species in the simulation. These tracerswere given a concentration of one when they entered themodel domain, or were present during model start. We referto these fictitious tracers as origin tracers in the remainderof this paper. Furthermore, we modeled direct groundwaterage (Goode, 1996) by including an additional specie with anegative zero-th order decay term (Zheng, 2009). This specieis zero when entering the model domain, then gains one forevery year spent inside the model. An overview of the differ-ent origin tracers and their relation to hydrosomes (Sect. 2.3)is presented in Table 1. Longitudinal dispersivity was set to1 m, the lower bound found for similar settings in experimen-tal work reviewed by Gelhar et al. (1992), and similar to val-ues used in comparable settings (Lebbe, 1999; Oude Essinket al., 2010). Horizontal and vertical transversal dispersiv-ities were assumed 0.1 and 0.01 m, respectively (Zheng and
Wang, 1999), and we assigned a uniform molecular diffusioncoefficient of 10−9 m2 s−1. We did not attempt to calibrateour model, recognizing that calibration would only be pos-sible for the most recent periods, and a rigorous sensitivityanalysis was impossible given the long calculation times. Weregard our model therefore primarily as a conceptual tool.Still, we assessed the validity of the model by comparingmodel results to measured heads and chloride measurements,tritium-derived groundwater ages and a hydrochemical inter-pretation of groundwater origin (HYFA, see Sect. 2.3). Avail-able radiocarbon measurements were proven impossible touse for accurate dating in this area, due to the large contribu-tion of heterogeneously aged sedimentary carbon sources toinorganic carbon dissolved in groundwater (Post, 2004).
The geographical changes throughout the Holocene wereimplemented using 10 successive time slices, with each timeslice representing a distinct period in the paleo-geographicalevolution (Fig. 2, Table 2). Model start was set at 6500 BC,marking the start of marine influence in the area. Condi-tions during a time slice were assumed constant, with theexception of the rapidly rising sea level (implemented us-ing 10 stress periods) during the first 2 time slices (trans-gression phase). The model state (head and concentration) atthe end of each time slice was used as the starting state forthe subsequent time slice; model cells not present in a previ-ous time slice were given the state of the previously upper-most model cell per column. Specific to each time slice wereits sea level, surface elevation, near-surface geohydrologicalproperties, drainage structure and groundwater abstractions,which were reconstructed based on the depositional historyreflected in the near-surface geological record and various lit-erature sources (Table 3). In addition to reconstructed larger-scale drainage structures such as e.g. the river Vecht, we ap-plied infinite drainage at the model surface to represent smallstreams and creeks. As little erosion has taken place sincethe start of modeling, and compaction of clay was not con-sidered significant, the near-surface geological record pro-vided a good approximation of the historical landscape. An
www.hydrol-earth-syst-sci.net/18/3891/2014/ Hydrol. Earth Syst. Sci., 18, 3891–3905, 2014

3896 J. R. Delsman et al.: Paleo-modeling of coastal saltwater in the Netherlands
Table 1.Description of modeled origin tracers and relation to hydrosomes.
Tracer Description Related hydrosome
Maassluis Water present in the Maassluis formation (Weerts et al., 2005; seeFig. 1b) at start of modeling. Note that this tracer is applied irrespec-tive of the pre-model history of water in this formation, and shouldnot be confused with connate Maassluis water, enclosed at depositionof this formation 2.5 My ago.
Maassluis (M)
Transgression Seawater infiltrating from the surface east ofx coordinate 95 kmduring transgression phase, i.e., before 3300 BC
Holocene transgression – coastal type(LC)
Sea Seawater, excluding infiltrating transgression water Actual North Sea (S)
Recharge Infiltrating meteoric recharge, excluding recharge marshlands Dune (D) west ofx coordinate 105 km,polder (P) east of 105 km (note that theHYFA analysis does not include the areaeast ofx coordinate 110 km)
Rechargemarshlands
Infiltrating meteoric recharge in marshlands between the coastal dunesand ice-pushed ridge, between 3300 BC and AD 1500
Holocene transgression – ancient marshtype (Lm1), and Holocene transgression– young marsh type (Lm2). The two aredifferentiated based on the 4 kyr age con-tour obtained by direct age calculations(Goode, 1996) and mixing with transgres-sion origin.
Surface water Infiltrating surface water Polder (P)
Initial Groundwater present at model start, excluding Maassluis, sea- andtransgression water
–
Table 2.Description of model time slices.
Time slice Description
6500 BC–4500 BC Sea level rise, linearly from 22 to 8 m b.s.l. (10 stress periods). Maximum transgression extent reached.Tidal area develops over Pleistocene surface, “basal” peat deposits left mostly intact. Surface drainage.
4500 BC–3300 BC Sea level rise, linearly from 8 to 5 m b.s.l. (10 stress periods). Open system with strong marine influence.Deposition of marine clay and sand. Peat extent expands.
3300 BC–2100 BC Sea level at 3.5 m b.s.l. Closed system, freshening of hinterland. Peat development behind barriers,peat elevation 3 m b.s.l.
2100 BC–700 BC Sea level at 2 m b.s.l. Peat development accelerates, peat domes rise to 1 m m.s.l.
700 BC–AD 500 Sea level at 1 m b.s.l. Peat elevation 1.5 m m.s.l. River Vecht system develops (0.7 m b.s.l.).
AD 500–AD 1500 Sea level at 1 m b.s.l. Maximal peat elevation: 2 m m.s.l. “young dunes” develop, coastal dunes rise to 12 m m.s.l.
AD 1500–AD 1850 Sea level at 0.3 m b.s.l. Rapid degradation of peat due to peat extraction and anthropogenic drainage (0 m m.s.l.).Freshwater lakes develop. Water level River Vecht 0.05 m b.s.l.
AD 1850–AD 1900 Sea level at 0.1 m b.s.l. Reclamation of Haarlemmermeer (AD 1852) and Horstermeer (AD 1882).Anthropogenic drainage through canals and ditches.
AD 1900–AD 1950 Sea level at 0.05 b.s.l. Subsurface drains introduced. Groundwater (over-) abstraction in coastal dunes.
AD 1950–AD 2010 Present-day situation, sea level at 0 m.s.l. Groundwater abstraction in ice-pushed ridge,groundwater abstraction in coastal dunes decreased.
Hydrol. Earth Syst. Sci., 18, 3891–3905, 2014 www.hydrol-earth-syst-sci.net/18/3891/2014/

J. R. Delsman et al.: Paleo-modeling of coastal saltwater in the Netherlands 3897
Table 3.References for paleo-model implementation.
Property References
Surface level Vernes and Van Doorn (2005), Vos (1998), Vos et al. (2011)
Sea level rise Beets et al. (2003), Denys and Baeteman (1995), Jelgersma (1961), Kiden (1995), Ludwig et al. (1981),Van de Plassche (1982)
Geohydrological properties Van Asselen et al. (2010), Kechavarzi et al. (2010), Stafleu et al. (2013), Vernes and Van Doorn (2005)
Recharge KNMI (2010), Van Loon et al. (2009)
Drainage De Lange et al. (2014), Van Loon et al. (2009)
Vecht River system Bos (2010)
Reclaimed areas Dufour (2000), Schultz (1992)
Groundwater abstractions Van Loon (2010), Oude Essink (1996)
important exception is the build-up and subsequent degrada-tion of peat domes; we derived model parameters for peat el-evations and extent from a detailed reconstruction located ina similar setting just north of Amsterdam (Vos, 1998). Geo-hydrological properties for historical surface sediments wereassumed to equal their current (buried) properties, except foruncompacted peat deposits, set in accordance to relevant lit-erature values (Kechavarzi et al., 2010).
As no long-term precipitation record exist for the Nether-lands, and annual temperatures have remained approximatelyconstant over the past 7 kyr (Davis et al., 2003), we chose toapply a constant uniform recharge of 0.7 mm d−1, equal tothe current long-term average, for all time slices. We did notdifferentiate recharge amounts for vegetation types, given thelack of data on past vegetation patterns. North Sea chlorideconcentration was kept at a constant 16 g L−1 over the entiremodel time, the present average concentration. Initial chlo-ride concentration (at 6500 BC) was set to 16 g L−1 belowthe area initially inundated by the sea, and zero throughoutthe remainder of the model, as the 100 kyr period of the We-ichselian glacial stage preceding the modeled period is ex-pected to have caused extensive freshening of the Pleistoceneaquifers (Post et al., 2003). The only exception is the lowpermeable Maassluis formation at the bottom of the transect,where limited dated samples indicate only partial fresheningof this connate marine groundwater (Post et al., 2003). Theinitial concentration in the Maassluis formation was there-fore assumed to be 10 g L−1, the approximate upper limitof measured concentrations (Stuyfzand, 1993). In addition tothe described scenario, four additional sensitivity runs wereperformed to explore two main model uncertainties: disper-sivity and the chloride concentration of water present in theMaassluis formation at model start. Dispersivities were de-creased 10-fold, and the initial Maassluis concentration wasset to 0, 5 and 15 g L−1 in these runs, respectively, all otherparameters remaining unchanged.
4 Results
4.1 Sensitivity runs
SEAWAT model run time simulating 8.5 kyr and includingseven additional mobile species was approximately 3 dayson a standard single cpu; no convergence problems were en-countered, including at time-slice transitions. The performedsensitivity runs did not reveal a significant influence of dis-persivity on the general shape of the present-day salinity dis-tribution. A 10-fold decrease in dispersivity did, however, re-sult in a narrower transition zone between fresh and salinegroundwater, most importantly beneath the coastal dunes(100 to 25 m). Further inland, the width of the transitionzone decreased from around 50 m to around 25 m. Whilemeasurements indicate a narrow transition zone beneath thecoastal dunes, they suggest a wide transition zone further in-land and are therefore inconclusive in regards to the “bet-ter” value. The Maassluis sensitivity runs revealed a cleardependence of the modeled historical trajectory and present-day location of Maassluis water on its initial chloride con-centration. While the general processes acting on this watertype remain the same, the extent to which Maassluis wa-ter is transported through the subsurface is negatively re-lated to its chloride concentration. At 15 g L−1, the densitydifference between infiltrating transgression water and resi-dent Maassluis water clearly provides less incentive for flowthan at 0 g L−1. As a result, while a significant fraction ofMaassluis water is still present at its original location in the15 g L−1 run at model end, it is almost completely displacedin the 0 g L−1 run, with the 5 and 10 g L−1 scenarios in be-tween those extremes. Comparison with the HYFA results ofStuyfzand (1993), although based on only limited samples atthe relevant depths, suggests an initial Maassluis concentra-tion of around 10 g L−1, showing agreement in the relativelyshallow occurrence of Maassluis at a depth of 100 m aroundx coordinate 112 km.
www.hydrol-earth-syst-sci.net/18/3891/2014/ Hydrol. Earth Syst. Sci., 18, 3891–3905, 2014

3898 J. R. Delsman et al.: Paleo-modeling of coastal saltwater in the Netherlands
4.2 Model validation
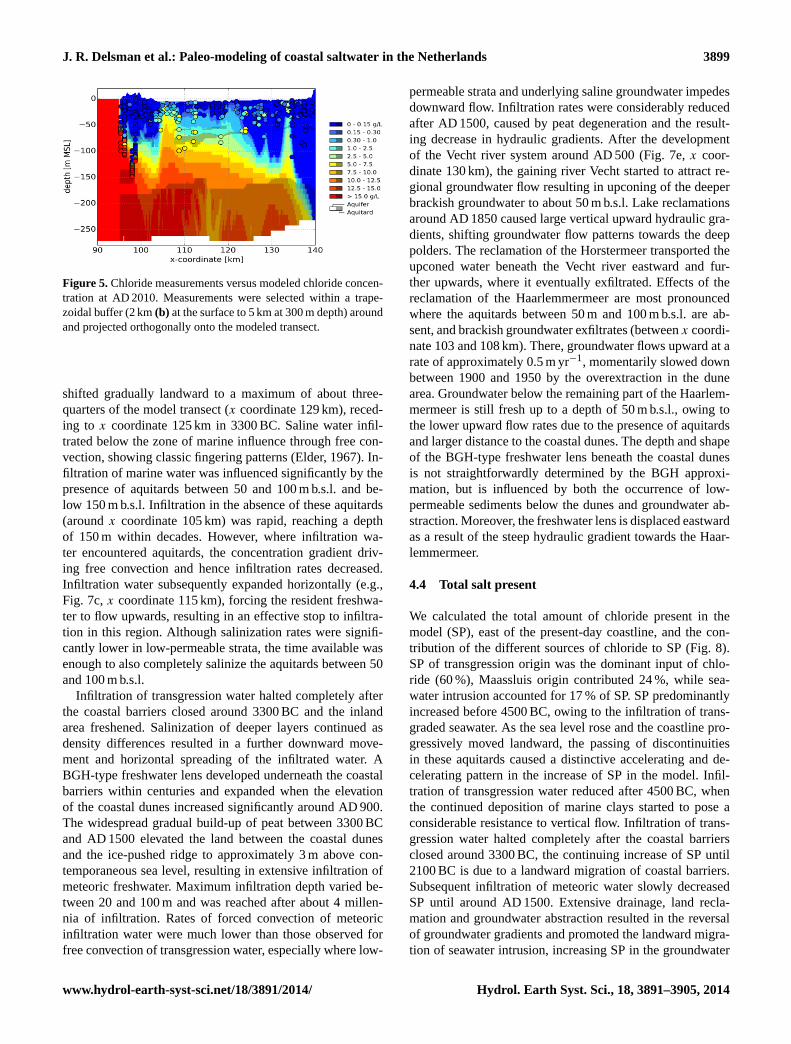
We compared modeled heads with averaged heads mea-sured in 382 piezometers located along the modeled tran-sect (RMSE of 1.4 m, Fig. 4, locations in Fig. 1). Visual in-spection revealed a concentration of absolute errors in thecoastal dune area: the RMSE of modeled versus measuredheads excluding the dune area is a mere 0.7 m. RMSE nor-malized to the range of observed values (NRMSE) is in bothcases 11 %. Larger absolute deviations in the coastal dunearea were expected given the large head variation over shortdistances caused by the varied relief, the concentration ofwell fields and the presence of an artificial recharge instal-lation, factors implemented in the model only in a simplifiedway. Chloride measurements are available in the study areafrom AD 1891 onwards, which we compared to concomitantmodel results (RMSE, NRMSE of 2.7 g L−1, 16 %, respec-tively, 1.5 g L−1, 22 % excluding the coastal dunes, locationsin Fig. 1). These relatively large RMSEs reflect the diffi-culty in obtaining good fits between measured and modeledvalues along a transect due to the large spatial variation in(modeled) chloride concentrations over short distances. Nev-ertheless, the measured groundwater chloride distribution isapproximated quite well (Fig. 5), with the model capturingboth the depth of the Badon Ghijben-Herzberg (BGH)-typelens below the coastal dunes and the upward movement ofchloride below the inland deep polder areas, even includ-ing the occurrence of very localized brackish groundwaterbelow the Horstermeer. Discrepancies aroundx coordinates113 and 125 are likely due to the orthogonal projection ofchloride measurements on the model transect, and caused bylocal head gradients not included in the chosen model tran-sect. And while the several tens-of-meters-wide transitionzone between fresh and saline water inland is well-capturedby the model, the width of the transition zone beneath theBGH lens below the dunes is overestimated by the appliedmodel-wide dispersion parameters. A comparison of avail-able tritium measurements with the modeled 1952 age con-tour was hampered by the necessary orthogonal projection ofthe sparsely available tritium measurements on the modeledtransect. Notwithstanding, tritium ages generally confirmedthe modeled vertical extent of both post-1952 groundwaterin infiltration areas around the deep polder Horstermeer, thecoastal dunes and the ice-pushed ridge area, and pre-1952groundwater beneath the exfiltrating deep polder Haarlem-mermeer. Age calculation results were omitted from this pa-per for the sake of brevity, but are included in the film avail-able as supplementary information.
We compared the present-day distribution of modeledorigin tracers to results of a hydrochemical facies analy-sis (HYFA) (Sect. 2.3; Stuyfzand, 1993, 1999) along themodel transect, approximately betweenx coordinates 95 and110 km (Fig. 6). HYFA uses the hydrochemistry of ground-water to identify groundwater bodies (hydrosomes) and thehydrochemical zones within them, and thus provides clues
Figure 4. Comparison of measured versus modeled heads. Loca-tions (Fig. 1) were selected within a trapezoidal buffer (0.5 km atthe surface to 5 km at 300 m depth) around and projected orthog-onally onto the modeled transect. Measurement values are the av-erage of time series of head measurements from AD 1990 onwardscontaining at least 25 measurements.
to their respective histories. This comparison therefore pro-vides a comprehensive, independent model test. Various dis-crepancies exist between the distribution of modeled origintracers and measured distribution of hydrosomes. Discrepan-cies are largest at depths greater than 150 m b.s.l. beneath thecoastal dunes, and below 80 m b.s.l. in the deep polder area.This is due to the depth limits of observation wells (differingin both zones), giving rise to uncertainties in both the hydro-chemical, hydraulic and hydrogeological data underlying theHYFA analysis and in the structure of the model. The differ-ences call for further model optimizations where the hydro-chemical patterns are very reliable, for instance regarding theadvance of the intruding North Sea water, shape of the freshdune water lens and transition zone below it, and the pres-ence of polder water in the central parts of the deep polderHaarlemmermeer. Overall, however, the comparison shows aclear correspondence between the position of modeled ori-gin tracers and hydrosomes, in both relatively recent (sea-water wedge, infiltrating dune water) and older water types(Maassluis water, and water infiltrated during transgressionand after extensive peat formation).
4.3 Evolution of groundwater salinity
An overview of the modeled evolution of the groundwaterchloride distribution is presented in Fig. 7; a film of theevolution of chloride, age and origin tracers is available assupplementary information. Before 4500 BC, the coastline
Hydrol. Earth Syst. Sci., 18, 3891–3905, 2014 www.hydrol-earth-syst-sci.net/18/3891/2014/
J. R. Delsman et al.: Paleo-modeling of coastal saltwater in the Netherlands 3899
Figure 5. Chloride measurements versus modeled chloride concen-tration at AD 2010. Measurements were selected within a trape-zoidal buffer (2 km(b) at the surface to 5 km at 300 m depth) aroundand projected orthogonally onto the modeled transect.
shifted gradually landward to a maximum of about three-quarters of the model transect (x coordinate 129 km), reced-ing to x coordinate 125 km in 3300 BC. Saline water infil-trated below the zone of marine influence through free con-vection, showing classic fingering patterns (Elder, 1967). In-filtration of marine water was influenced significantly by thepresence of aquitards between 50 and 100 m b.s.l. and be-low 150 m b.s.l. Infiltration in the absence of these aquitards(aroundx coordinate 105 km) was rapid, reaching a depthof 150 m within decades. However, where infiltration wa-ter encountered aquitards, the concentration gradient driv-ing free convection and hence infiltration rates decreased.Infiltration water subsequently expanded horizontally (e.g.,Fig. 7c,x coordinate 115 km), forcing the resident freshwa-ter to flow upwards, resulting in an effective stop to infiltra-tion in this region. Although salinization rates were signifi-cantly lower in low-permeable strata, the time available wasenough to also completely salinize the aquitards between 50and 100 m b.s.l.
Infiltration of transgression water halted completely afterthe coastal barriers closed around 3300 BC and the inlandarea freshened. Salinization of deeper layers continued asdensity differences resulted in a further downward move-ment and horizontal spreading of the infiltrated water. ABGH-type freshwater lens developed underneath the coastalbarriers within centuries and expanded when the elevationof the coastal dunes increased significantly around AD 900.The widespread gradual build-up of peat between 3300 BCand AD 1500 elevated the land between the coastal dunesand the ice-pushed ridge to approximately 3 m above con-temporaneous sea level, resulting in extensive infiltration ofmeteoric freshwater. Maximum infiltration depth varied be-tween 20 and 100 m and was reached after about 4 millen-nia of infiltration. Rates of forced convection of meteoricinfiltration water were much lower than those observed forfree convection of transgression water, especially where low-
permeable strata and underlying saline groundwater impedesdownward flow. Infiltration rates were considerably reducedafter AD 1500, caused by peat degeneration and the result-ing decrease in hydraulic gradients. After the developmentof the Vecht river system around AD 500 (Fig. 7e,x coor-dinate 130 km), the gaining river Vecht started to attract re-gional groundwater flow resulting in upconing of the deeperbrackish groundwater to about 50 m b.s.l. Lake reclamationsaround AD 1850 caused large vertical upward hydraulic gra-dients, shifting groundwater flow patterns towards the deeppolders. The reclamation of the Horstermeer transported theupconed water beneath the Vecht river eastward and fur-ther upwards, where it eventually exfiltrated. Effects of thereclamation of the Haarlemmermeer are most pronouncedwhere the aquitards between 50 m and 100 m b.s.l. are ab-sent, and brackish groundwater exfiltrates (betweenx coordi-nate 103 and 108 km). There, groundwater flows upward at arate of approximately 0.5 m yr−1, momentarily slowed downbetween 1900 and 1950 by the overextraction in the dunearea. Groundwater below the remaining part of the Haarlem-mermeer is still fresh up to a depth of 50 m b.s.l., owing tothe lower upward flow rates due to the presence of aquitardsand larger distance to the coastal dunes. The depth and shapeof the BGH-type freshwater lens beneath the coastal dunesis not straightforwardly determined by the BGH approxi-mation, but is influenced by both the occurrence of low-permeable sediments below the dunes and groundwater ab-straction. Moreover, the freshwater lens is displaced eastwardas a result of the steep hydraulic gradient towards the Haar-lemmermeer.
4.4 Total salt present
We calculated the total amount of chloride present in themodel (SP), east of the present-day coastline, and the con-tribution of the different sources of chloride to SP (Fig. 8).SP of transgression origin was the dominant input of chlo-ride (60 %), Maassluis origin contributed 24 %, while sea-water intrusion accounted for 17 % of SP. SP predominantlyincreased before 4500 BC, owing to the infiltration of trans-graded seawater. As the sea level rose and the coastline pro-gressively moved landward, the passing of discontinuitiesin these aquitards caused a distinctive accelerating and de-celerating pattern in the increase of SP in the model. Infil-tration of transgression water reduced after 4500 BC, whenthe continued deposition of marine clays started to pose aconsiderable resistance to vertical flow. Infiltration of trans-gression water halted completely after the coastal barriersclosed around 3300 BC, the continuing increase of SP until2100 BC is due to a landward migration of coastal barriers.Subsequent infiltration of meteoric water slowly decreasedSP until around AD 1500. Extensive drainage, land recla-mation and groundwater abstraction resulted in the reversalof groundwater gradients and promoted the landward migra-tion of seawater intrusion, increasing SP in the groundwater
www.hydrol-earth-syst-sci.net/18/3891/2014/ Hydrol. Earth Syst. Sci., 18, 3891–3905, 2014

3900 J. R. Delsman et al.: Paleo-modeling of coastal saltwater in the Netherlands
Figure 6. Position of hydrosomes, inferred from hydrochemical facies analysis (adapted from Fig. 4.6 in Stuyfzand, 1993)(a) and frommodeled origin tracers(b). Capitals denote discerned hydrosomes: D= dune (also containing nested artificial recharge hydrosome; notshown), LC= Holocene transgression (L) – coastal type, Lm1 = L – ancient marsh type, Lm2
= L – young marsh type, M= Maassluis,P= polder, S= (actual) North Sea. See Sect. 2.3 for a description of discerned hydrosomes, and Table 1 for the mapping of origin tracers tohydrosomes, dots and dashed lines in(a) denote locations of piezometers used in HYFA.
Figure 7. Modeled evolution of groundwater chloride concentra-tion (a–g). White lines are contours of the stream function, contourintervals are equal for all time slices. Except for(a) (starting con-centration), transect times correspond to paleo-geographical mapsin Fig. 2.
system. The steep increase in SP of sea origin between 1900and 1950 was caused by groundwater (over-) abstraction inthe coastal dunes.
4.5 Origin tracers
The modeled origin tracers provided a comprehensiveoverview of the evolution of groundwater types of differ-
Figure 8. Contribution of transgression, sea, and Maassluis to totalsalt present (SP). Only the model domain east fromx coordinate95 km is considered. Vertical dashed lines denote time-slice tran-sitions, discontinuities at transitions result from changing numbersof active model cells. Legend percentages are percentages at modelend.
ent origin (Fig. 9). As already noted, widespread infiltrationof transgression water occurred through free convection be-tween 6500 and 3300 BC. The infiltration had a pronouncedeffect on other tracers, as resident older water was pushedupwards around the infiltrating fingers. This mechanism ismost readily apparent in the evolution of Maassluis water,mobilized from its original position below 170 m b.s.l. up-wards to the ground surface (Fig. 9b). After marine infil-tration stopped, the mobilized Maassluis water moved grad-ually downward, while the Maassluis water still present atgreater depths was slowly displaced upwards by the moresaline transgression water due to density differences. Thiscombination resulted in its fairly compact present positionbelow around 80 m b.s.l. and east ofx coordinate 115 km.The upward movement of groundwater after the reclamation
Hydrol. Earth Syst. Sci., 18, 3891–3905, 2014 www.hydrol-earth-syst-sci.net/18/3891/2014/

J. R. Delsman et al.: Paleo-modeling of coastal saltwater in the Netherlands 3901
Figure 9. Modeled evolution of groundwater origin(a–g). Whitelines are contours of the stream function, contour intervals are equalfor all time slices. Except for(a) (starting situation), transect timescorrespond to paleo-geographical maps in Fig. 2.
of polder Haarlemmermeer, put forward by Stuyfzand (1993)to explain the present-day position of Maassluis water, wasshown to be only of minor influence.
The infiltration of meteoric infiltration water caused thesubmarine groundwater discharge of earlier transgressionwater seaward of the coastal dunes (Fig. 9d,x coordinate95 km), owing to a regional seaward flow system under-lying the coastal dunes. The influence of the classic sea-water intrusion mechanism, the landward-intruding seawa-ter wedge (origin tracer sea), was limited to about 5 kmfrom the coastline, in general agreement with results ofStuyfzand (1993). Maassluis water constituted the third inputof chloride, mainly contributing to chloride concentrations inthe eastern part of the model transect.
5 Discussion
While the paleo-geographical development of the Nether-lands is relatively well documented, based on numerous in-vestigations of the near-surface geology, carbon dating andarcheological evidence (Vos and Gerrets, 2005; Vos et al.,2011; Weerts et al., 2005), such reconstructions necessar-ily entail a significant degree of interpretation and henceuncertainty. This uncertainty is only enlarged in a paleo-hydrogeological model, both through model simplificationand the introduction of additional uncertain parameters (e.g.,
climate, sea salinity, historical surface elevation, and hy-draulic parameters of the subsurface). In addition, the em-ployed 2-D approach neglects variation perpendicular to themodel transect, and the use of time slices introduces discreteand significant jumps in the gradually changing geology andhydrology. Finally, the chosen model discretization preventsthe inclusion of boils, highly localized conduits penetratingthe low-permeable Holocene strata (De Louw et al., 2010)that contribute significantly to the exfiltration of salts in thepolder Haarlemmermeer (Delsman et al., 2013). We did notattempt to quantify the uncertainty in our model, and there-fore do not claim its validity other than as a conceptual tool.Nevertheless, judging from comparisons to measured heads,chloride concentrations, age patterns and, perhaps most as-suring, hydrochemical facies analysis, the model appearsto explain the present-day distribution of both groundwa-ter salinity and origin quite well. We are confident, there-fore, that the important processes occurring over the modeledperiod, responsible for the present-day salinity distributionon the scale considered, are well represented by the paleo-hydrogeological model.
The influence of variable density on groundwater flow pat-terns has been widely demonstrated in either idealized small-scale numerical or sandbox experiments (e.g., Simmons etal., 2001; Post and Kooi, 2003; Post and Simmons, 2009;Jakovovic et al., 2011) or in numerical studies describ-ing present-day salinization patterns in real-world aquifers(e.g., Oude Essink et al., 2010; Nocchi and Salleolini, 2013;Cobaner et al., 2012). However, reports on the long-termeffects of these processes in real-world aquifers over thetimescales considered here have remained scarce. Post andKooi (2003) investigated the ability of free convective infil-tration to salinize high-permeable aquifers, and reported pos-sible infiltration velocities of several meters per year. Withinfiltrating saltwater reaching 150 m depth within decadeswhere aquitards are absent, our results confirm these find-ings. In addition, they show the importance of these “infiltra-tion hotspots” for the salinization of regions underlying low-permeable strata (Simmons et al., 2001). Our results furthersignify that aquitards at greater depths can effectively im-pede infiltration in overlying strata, with effects still visiblein the present-day salinity distribution. However, we did notfind aquitards that effectively resist salinization or freshening(Groen et al., 2000): the timescales considered are evidentlylong enough, and hydraulic gradients high enough in the con-sidered setting to eventually lead to salinization or freshen-ing. Mixing zones between salt- and freshwater have beenreported to vary widely in geologic settings across the world(Werner et al., 2013), resulting from diffusive processes andkinetic mass transfer (Lu et al., 2009). Measurements indi-cate that mixing zones even vary widely within our mod-eled transect, from a narrow zone of some meters aroundthe BGH lens beneath the coastal dunes, to a wide verticalmixing zone of several tens of meters inland. We attributethis variation to the difference between the relatively steady
www.hydrol-earth-syst-sci.net/18/3891/2014/ Hydrol. Earth Syst. Sci., 18, 3891–3905, 2014
3902 J. R. Delsman et al.: Paleo-modeling of coastal saltwater in the Netherlands
evolution of the BGH lens, resulting in a transition widthcontrolled by molecular diffusion and pore-scale transversaldispersion (Paster and Dagan, 2007), versus the highly tran-sient evolution history of groundwater salinity on the land-ward side. Wide mixing zones associated with vertical sea-water intrusion result from the slow mixing of small-scale(meters) seawater fingers with the intermediary freshwaterafter the fingers reach the aquifer bottom and flow effec-tively stops (Kooi et al., 2000). Model-wide dispersivity val-ues could not satisfactorily simulate both these extremes. Adual-domain approach (Lu et al., 2009) could perhaps yieldbetter results.
The present-day salinity distribution in the coastal zone ofthe Netherlands has been widely recognized to result fromfree-convective infiltration during Holocene transgressions,widespread peat development and subsequent degradation,and the increasing anthropogenic influence in the more recentpast (Post, 2004; Stuyfzand, 1993). Our modeling resultsclearly support this evolution history, but provide a moredetailed overview of the processes involved, signifying therole of aquitards, the ice-pushed ridge flow system, and pre-model Maassluis water. The role of (connate) salt present inthe Maassluis formation in explaining the present-day salin-ity distribution has been the subject of some controversyover the past decades, with some authors attributing the pres-ence of brackish groundwater in Pleistocene aquifers to up-wards diffusion of salts from this formation (Meinardi, 1991;Volker, 1961). Our results indicate that (1) some salt musthave been initially (i.e., at model start, 6500 BC) present inthis formation to explain the present-day occurrence of thiswater type, (2) this salt was rapidly mobilized during the ma-rine transgression in the Holocene, and (3) pre-model saltstill contributes with a significant percentage to the present-day salinity distribution. The evolution of salinity in theMaassluis formation throughout the trans- and regression pe-riods during the Quaternary clearly deserves further study.
Regional-scale numerical modeling studies to understandpresent-day or predict future variable density flow in real-world aquifers are faced with the problem of applying aninitial salinity distribution, inherently unknown as measure-ments are sparse and salinity varies on short-length scales.An often-applied approach is the assumption of steady state,conditioned on present-day boundary conditions (e.g., Souzaand Voss, 1987; Vandenbohede and Lebbe, 2002). Such anapproach is clearly not warranted for coastal aquifers asthe one considered here, as the present-day salinity distribu-tion is almost entirely determined by the significant paleo-geographical changes occurring throughout the Holocene.Moreover, neither the salinity distribution nor, consequently,the head distribution was, throughout the modeled period,ever in steady state. A second approach is the constructionof the initial salinity distribution based on available mea-surements, generally by three-dimensional interpolation ofavailable point measurements of salinity (Van der Meij andMinnema, 1999; Oude Essink et al., 2010). This approach
necessarily disregards the many small-scale salinity varia-tions not represented by measurements, resulting in an initialsalinity distribution not in equilibrium with applied boundaryconditions and, consequently, in difficult-to-detect model ar-tifacts. Recent advances have been made in the application ofairborne geophysical techniques (AEM) to map groundwa-ter salinity variations over larger scales as input to numericalmodels (Faneca Sànchez et al., 2012). While this techniqueis very promising, adequate separation of the contribution oflithology and salinity in the acquired signal requires elabo-rate ground-truthing (Gunnink et al., 2012), but the resolu-tion of AEM is too coarse to delineate small-scale featuresand its accuracy decreases with depth. The primarily concep-tual paleo-geographical modeling approach presented in thispaper cannot yet claim to provide an alternative to the aboveapproaches. Ultimately however, the incorporation of thepresented approach within a rigorous uncertainty framework,calibrated to an increasing amount of present-day salinitydata supplemented with airborne techniques, may prove suc-cessful in adequately describing present-day salinity distri-butions.
6 Conclusions
We successfully modeled the effect of paleo-geographicalchanges throughout the Holocene on the intrusion and re-distribution of salts in a representative coastal aquifer. Thisapproach refined our current understanding of the evolutionof the salinity distribution in the coastal region of the Nether-lands, and yielded insights into the long-term, real-world ef-fects of processes previously investigated in idealized exper-imental settings. Not once reaching steady state throughoutthe Holocene, our results attest to the long-term dynamics ofsalinity in coastal aquifers. The implications of our resultsextend beyond understanding the present-day distribution ofsalinity, as the proven complex history of coastal groundwa-ter holds important clues for understanding the distributionof other societally relevant groundwater constituents like nu-trients (Van Rees Vellinga et al., 1981; Stuyfzand, 1993) andarsenic (Harvey et al., 2006; Michael and Voss, 2009).
The Supplement related to this article is available onlineat doi:10.5194/hess-18-3891-2014-supplement.
Acknowledgements.We thank Jeroen Schokker for providingGeoTop data, and Kim Cohen and Wim de Lange for the valuablediscussions on paleo-geography and groundwater flow. We thanktwo anonymous reviewers whose constructive comments helpedimprove this paper. This work was carried out within the DutchKnowledge for Climate program.
Edited by: S. Attinger
Hydrol. Earth Syst. Sci., 18, 3891–3905, 2014 www.hydrol-earth-syst-sci.net/18/3891/2014/

J. R. Delsman et al.: Paleo-modeling of coastal saltwater in the Netherlands 3903
References
Barlow, P. M. and Reichard, E. G.: Saltwater intrusion incoastal regions of North America, Hydrogeol. J., 18, 247–260,doi:10.1007/s10040-009-0514-3, 2009.
Beets, D. J., De Groot, T. A. M., and Davies, H. A.: Holocenetidal back-barrier development at decelerating sea-level rise: a5 millennia record, exposed in the western Netherlands, Sedi-ment. Geol., 158, 117–144, doi:10.1016/S0037-0738(02)00263-4, 2003.
Bense, V. F. and Person, M. A.: Transient hydrodynamics within in-tercratonic sedimentary basins during glacial cycles, J. Geophys.Res., 113, F04005, doi:10.1029/2007JF000969, 2008.
Bos, I. J.: Distal delta-plain successions: architecture and lithofaciesof organics and lake fills in the Holocene Rhine-Meuse delta,The Netherlands, PhD thesis, Faculty of Geosciences, UtrechtUniversity, 208 pp., 2010.
Cobaner, M., Yurtal, R., Dogan, A., and Motz, L. H.: Three dimen-sional simulation of seawater intrusion in coastal aquifers: A casestudy in the Goksu Deltaic Plain, J. Hydrol., 464–465, 262–280,doi:10.1016/j.jhydrol.2012.07.022, 2012.
Custodio, E.: Aquifer overexploitation: what does it mean?, Hydro-geol. J., 10, 254–277, doi:10.1007/s10040-002-0188-6, 2002.
Custodio, E. and Bruggeman, G. A.: Groundwater problems incoastal areas, Studies an, UNESCO, Paris, 1987.
Davis, B. A. S., Brewer, S., Stevenson, A. C. and Guiot,J.: The temperature of Europe during the Holocene recon-structed from pollen data, Quaternary Sci. Rev., 22, 1701–1716,doi:10.1016/S0277-3791(03)00173-2, 2003.
De Lange, W. J., Prinsen, G. F., Hoogewoud, J. C., Veldhuizen, A.A., Verkaik, J., Oude, G. H. P., Walsum, P. E. V. Van, Delsman,J. R., Hunink, J. C., Massop, H. T. L., and Kroon, T.: An op-erational, multi-scale, multi-model system for consensus-based,integrated water management and policy analysis: The Nether-lands Hydrological Instrument, Environ. Model. Softw., 59, 98–108, doi:10.1016/j.envsoft.2014.05.009, 2014.
De Louw, P. G. B., Oude Essink, G. H. P., Stuyfzand, P.J., and Van der Zee, S. E. A. T. M.: Upward groundwa-ter flow in boils as the dominant mechanism of salinizationin deep polders, The Netherlands, J. Hydrol., 394, 494–506,doi:10.1016/j.jhydrol.2010.10.009, 2010.
De Louw, P. G. B., Eeman, S., Siemon, B., Voortman, B. R., Gun-nink, J., van Baaren, E. S., and Oude Essink, G. H. P.: Shal-low rainwater lenses in deltaic areas with saline seepage, Hy-drol. Earth Syst. Sci., 15, 3659–3678, doi:10.5194/hess-15-3659-2011, 2011.
Delsman, J. R., Oude Essink, G. H. P., Beven, K. J., and Stuyfzand,P. J.: Uncertainty estimation of end-member mixing using gen-eralized likelihood uncertainty estimation (GLUE), applied ina lowland catchment, Water Resour. Res., 49, 4792–4806,doi:10.1002/wrcr.20341, 2013.
Denys, L. and Baeteman, C.: Holocene evolution of relative sealevel and local mean high water spring tides in Belgium –a first assessment, Mar. Geol., 124, 1–19, doi:10.1016/0025-3227(95)00029-X, 1995.
Dufour, F. C.: Groundwater in the Netherlands: Facts and figures,Netherlands Inst. of Applied Geoscience TNO, 2000.
Elder, J.: Transient convection in a porous medium, J. Fluid Mech.,27, 609–623, 1967.
Faneca Sànchez, M., Gunnink, J. L., Van Baaren, E. S., OudeEssink, G. H. P., Siemon, B., Auken, E., Elderhorst, W., andDe Louw, P. G. B.: Modelling climate change effects on aDutch coastal groundwater system using airborne electromag-netic measurements, Hydrol. Earth Syst. Sci., 16, 4499–4516,doi:10.5194/hess-16-4499-2012, 2012.
Ferguson, G. and Gleeson, T.: Vulnerability of coastal aquifers togroundwater use and climate change, Nat. Clim. Chang., 2, 342–345, doi:10.1038/nclimate1413, 2012.
Gelhar, L. W., Welty, C., and Rehfeldt, K. R.: A critical review ofdata on field-scale dispersion in aquifers, Water Resour. Res., 28,1955–1974, 1992.
Goode, D. J.: Direct simulation of groundwater age, Water Resour.Res., 32, 289–296, 1996.
Groen, J., Velstra, J., and Meesters, A. G. C. A.: Salinization pro-cesses in paleowaters in coastal sediments of Suriname: evidencefrom δ37Cl analysis and diffusion modelling, J. Hydrol., 234, 1–20, doi:10.1016/S0022-1694(00)00235-3, 2000.
Gunnink, J. L., Bosch, J. H. A., Siemon, B., Roth, B., and Auken,E.: Combining ground-based and airborne EM through Arti-ficial Neural Networks for modelling glacial till under salinegroundwater conditions, Hydrol. Earth Syst. Sci., 16, 3061–3074, doi:10.5194/hess-16-3061-2012, 2012.
Harvey, C. F., Ashfaque, K. N., Yu, W., Badruzzaman, A. B. M., Ali,M. A., Oates, P. M., Michael, H. A., Neumann, R. B., Beckie,R., Islam, S., and Ahmed, M. F.: Groundwater dynamics and ar-senic contamination in Bangladesh, Chem. Geol., 228, 112–136,doi:10.1016/j.chemgeo.2005.11.025, 2006.
Jakovovic, D., Werner, A. D., and Simmons, C. T.: Numeri-cal modelling of saltwater up-coning: Comparison with ex-perimental laboratory observations, J. Hydrol., 402, 261–273,doi:10.1016/j.jhydrol.2011.03.021, 2011.
Jelgersma, S.: Holocene sea level changes in the Netherlands, PhDthesis, Leiden University, 100 pp., 1961.
Jelgersma, S., De Jong, J., and Zagwijn, W. H.: The Coastal Dunesof the Western Netherlands: Geology, Vegetational History andArchaeology, Ernest van Aelst, Maastricht, the Netherlands,1970.
Kechavarzi, C., Dawson, Q., and Leeds-Harrison, P. B.: Physi-cal properties of low-lying agricultural peat soils in England,Geoderma, 154, 196–202, doi:10.1016/j.geoderma.2009.08.018,2010.
Kiden, P.: Holocene relative sea-level change and crustal move-ment in the southwestern Netherlands, Mar. Geol., 124, 21–41,doi:10.1016/0025-3227(95)00030-3, 1995.
KNMI: Schiphol, langjarige gemiddelden, tijdvak 1981–2010, DeBilt, 2010.
Konikow, L. F.: The Secret to Successful Solute-TransportModeling, Ground Water, 1–16, doi:10.1111/j.1745-6584.2010.00764.x, 2010.
Kooi, H., Groen, K., and Leijnse, A.: Modes of seawater intru-sion during transgressions, Water Resour. Res., 36, 3581–3589,doi:10.1029/2000WR900243, 2000.
Kundzewicz, Z., Mata, L., Arnell, N., Döll, P., Jimenez, B., Miller,K., Oki, T., Sen, Z., and Shiklomanov, I.: The implications ofprojected climate change for freshwater resources and their man-agement, Hydrol. Sci. J., 53, 37–41, 2008.
Langevin, C. D. and Guo, W.: MODFLOW/MT3DMS-basedsimulation of variable-density ground water flow and
www.hydrol-earth-syst-sci.net/18/3891/2014/ Hydrol. Earth Syst. Sci., 18, 3891–3905, 2014

3904 J. R. Delsman et al.: Paleo-modeling of coastal saltwater in the Netherlands
transport., Ground Water, 44, 339–351, doi:10.1111/j.1745-6584.2005.00156.x, 2006.
Lebbe, L.: Parameter identification in fresh-saltwater flow based onborehole resistivities and freshwater head data, Adv. Water Re-sour., 22, 791–806, 1999.
Lebbe, L., Adams, R., and De Deckere, E.: Modeling of histori-cal evolution of salt water distribution on the right bank of theScheldt in the Antwerp harbor, in: Proc. 22nd Salt Water Intru-sion Meeting., 2012.
Lemieux, J.-M. and Sudicky, E. A.: Simulation of groundwa-ter age evolution during the Wisconsinian glaciation overthe Canadian landscape, Environ. Fluid Mech., 10, 91–102,doi:10.1007/s10652-009-9142-7, 2009.
Lu, C., Kitanidis, P. K., and Luo, J.: Effects of kinetic masstransfer and transient flow conditions on widening mixingzones in coastal aquifers, Water Resour. Res., 45, W12402,doi:10.1029/2008WR007643, 2009.
Ludwig, G., Müller, H., and Streif, H.: New Dates on Holocene Sea-Level Changes in the German Bight, in: Holocene Marine Sed-imentation in the North Sea Basin, edited by: Nio, S. D., Shüt-tenhelm, R. T. E., and Van Weering, T. C. E., 211–219, WileyOnline Library, 1981.
Makkink, G. F.: Testing the Penman formula by means of lysime-ters, J. Inst. Water Eng., 11, 277–288, 1957.
Meinardi, C.: The origin of brackish groundwater in the lower partsof the Netherlands, in: Hydrogeology of salt water intrusion: Aselection of SWIM papers Internation Contributions to Hydroge-ology, edited by: De Breuck, W., 271–290, Hannover, Germany,1991.
Michael, H. A. and Voss, C. I.: Controls on groundwater flow in theBengal Basin of India and Bangladesh: regional modeling anal-ysis, Hydrogeol. J., 17, 1561–1577, doi:10.1007/s10040-008-0429-4, 2009.
Mulholland, P., Best, G., Coutant, C., Hornberger, G., Meyer, J.,Robinson, P., Stenberg, J., Turner, R., Vera-Herrera, F., and Wet-zel, R.: Effects of climate change on freshwater ecosystems ofthe south-eastern United States and the Gulf Coast of Mexico,Hydrol. Process., 11, 949–970, 1997.
Nienhuis, P., Kamps, P., and Olsthoorn, T. N.: 160 Years of His-tory of the Amsterdam Water Supply Dune Area Modeled withVariable Density, Outlook into the Future, in: Proc. of MOD-FLOW and More 2013: Translating Science into Practice, editedby: Maxwell, R., Hill, M., Zheng, C., and Tonkin, M., Golden,CO, USA, 2013.
Nocchi, M. and Salleolini, M.: A 3D density-dependentmodel for assessment and optimization of water manage-ment policy in a coastal carbonate aquifer exploited forwater supply and fish farming, J. Hydrol., 492, 200–218,doi:10.1016/j.jhydrol.2013.03.048, 2013.
Oude Essink, G. H. P.: Impact of sea level rise on groundwater flowregimes: A sensitivity analysis for the Netherlands, PhD thesis,Faculty of Civil Engineering and Geosciences, Delft Universityof Technology, 411 pp., 1996.
Oude Essink, G. H. P., Van Baaren, E. S., and De Louw, P. G. B.:Effects of climate change on coastal groundwater systems: Amodeling study in the Netherlands, Water Resour. Res., 46, 1–16, doi:10.1029/2009WR008719, 2010.
Paster, A. and Dagan, G.: Mixing at the interface between two fluidsin porous media: a boundary-layer solution, J. Fluid Mech., 584,455–472, doi:10.1017/S0022112007006532, 2007.
Person, M. A., Bense, V. F., Cohen, D., and Banerjee, A.: Modelsof ice-sheet hydrogeologic interactions: a review, Geofluids, 12,58–78, doi:10.1111/j.1468-8123.2011.00360.x, 2012.
Piotrowski, J.: Subglacial hydrology in north-western Germany dur-ing the last glaciation: groundwater flow, tunnel valleys and hy-drological cycles, Quaternary Sci. Rev., 16, 169–185, 1997.
Pitman, M. and Läuchli, A.: Global impact of salinity and agricul-tural ecosystems, in: Salinity: environment–plants–molecules,edited by: Läuchli, A. and Lüttge, U., 3–20, Kluwer AcademicPublishers, Dordrecht, 2002.
Post, V. E. A.: Groundwater salinization processes in the coastalarea of the Netherlands due to transgressions during theHolocene, PhD thesis, Faculty of Earth Sciences, VU UniversityAmsterdam, 154 pp., 2004.
Post, V. E. A. and Abarca, E.: Preface: Saltwater and fresh-water interactions in coastal aquifers, Hydrogeol. J., 18, 1–4,doi:10.1007/s10040-009-0561-9, 2009.
Post, V. E. A. and Kooi, H.: Rates of salinization by free convectionin high-permeability sediments: insights from numerical model-ing and application to the Dutch coastal area, Hydrogeol. J., 11,549–559, doi:10.1007/s10040-003-0271-7, 2003.
Post, V. E. A. and Simmons, C. T.: Free convective controls on se-questration of salts into low-permeability strata: insights fromsand tank laboratory experiments and numerical modelling, Hy-drogeol. J., 18, 39–54, doi:10.1007/s10040-009-0521-4, 2009.
Post, V. E. A., Plicht, H., and Meijer, H.: The origin of brackishand saline groundwater in the coastal area of the Netherlands,Netherlands J. Geosci./Geol. en Mijnb., 82, 133–147, 2003.
Ranjan, P., Kazama, S., and Sawamoto, M.: Effects of climatechange on coastal fresh groundwater resources, Global Envi-ron. Chang., 16, 388–399, doi:10.1016/j.gloenvcha.2006.03.006,2006.
Sanford, W. E. and Buapeng, S.: Assessment of a groundwater flowmodel of the Bangkok Basin, Thailand, using carbon-14-basedages and paleohydrology, Hydrogeol. J., 4, 26–40, 1996.
Schot, P. P. and Molenaar, A.: Regional changes in groundwaterflow patterns and effects on groundwater composition, J. Hydrol.,130, 151–170, doi:10.1016/0022-1694(92)90108-8, 1992.
Schultz, B.: De waterbeheersing van droogmakerijen, PhD thesis,Faculty of Civil Engineering and Geosciences, Delft Universityof Technology, 506 pp., 1992.
Siemon, B., Christiansen, A. V., and Auken, E.: A review ofhelicopter-borne electromagnetic methods for groundwater ex-ploration, Near Surf. Geophys., 7, 629–646, 2009.
Simmons, C. T., Fenstemaker, T. R., and Sharp, J. M.: Variable-density groundwater flow and solute transport in heterogeneousporous media: approaches, resolutions and future challenges., J.Contam. Hydrol., 52, 245–275, 2001.
Souza, W. R. and Voss, C. I.: Analysis of an anisotropic coastalaquifer system using variable-density flow and solute transportsimulation, J. Hydrol., 23, 17–41, 1987.
Stafleu, J., Maljers, D., and Gunnink, J. L.: 3D modelling of theshallow subsurface of Zeeland, the Netherlands, Netherlands J.Geosci./Geol. en Mijnb., 90, 293–310, 2011.
Stafleu, J., Maljers, D., Busschers, F. S., Gunnink, J. L. J. L.,Schokker, J., Dambrink, R. M., Hummelman, H. J., and Schijf,
Hydrol. Earth Syst. Sci., 18, 3891–3905, 2014 www.hydrol-earth-syst-sci.net/18/3891/2014/

J. R. Delsman et al.: Paleo-modeling of coastal saltwater in the Netherlands 3905
M. L.: GeoTop modellering, TNO report R10991, NetherlandsInst. of Applied Geoscience TNO, Utrecht, 2013.
Stuyfzand, P. J.: Hydrochemistry and hydrology of the coastal dunearea of the Western Netherlands, PhD thesis, Faculty of EarthSciences, VU University Amsterdam, 362 pp., 1993.
Stuyfzand, P. J.: Salinization of drinking water in the Netherlands:anamnesis, diagnosis and remediation, in: Proceedings of the14th Saltwater Intrusion Meeting, Malmö, Sweden, 168–177,Malmö, Sweden., 1996.
Stuyfzand, P. J.: Patterns in groundwater chemistry result-ing from groundwater flow, Hydrogeol. J., 7, 15–27,doi:10.1007/s100400050177, 1999.
Sulzbacher, H., Wiederhold, H., Siemon, B., Grinat, M., Igel, J.,Burschil, T., Günther, T., and Hinsby, K.: Numerical modellingof climate change impacts on freshwater lenses on the North SeaIsland of Borkum using hydrological and geophysical methods,Hydrol. Earth Syst. Sci., 16, 3621–3643, doi:10.5194/hess-16-3621-2012, 2012.
Van Asselen, S., Stouthamer, E., and Smith, N. D.: Factors control-ling peat compaction in alluvial floodplains: a case study in thecold-temperate Cumberland Marshes, Canada, J. Sediment. Res.,80, 155–166, 2010.
Vandenbohede, A. and Lebbe, L.: Numerical modelling and hydro-chemical characterisation of a fresh-water lens in the Belgiancoastal plain, Hydrogeol. J., 10, 576–586, doi:10.1007/s10040-002-0209-5, 2002.
Vandenbohede, A., Hinsby, K., Courtens, C., and Lebbe, L.: Flowand transport model of a polder area in the Belgian coastalplain: example of data integration, Hydrogeol. J., 19, 1599–1615,doi:10.1007/s10040-011-0781-7, 2011.
Van de Plassche, O.: Sea-level change and water-level movementsin the Netherlands during the Holocene, PhD thesis, Faculty ofEarth Sciences, VU University Amsterdam, 1982.
Van der Meij, J. and Minnema, B.: Modelling of the effect of a sea-level rise and land subsidence on the evolution of the groundwa-ter density in the subsoil of the northern part of the Netherlands,J. Hydrol., 226, 152–166, doi:10.1016/S0022-1694(99)00150-X,1999.
Van der Meulen, M., Doornenbal, J., Gunnink, J. L., Stafleu, J.,Schokker, J., Vernes, R. W., Van Geer, F. C., Van Gessel, S. F.,Van Heteren, S., Van Leeuwen, R. J. W., Bakker, M. A. J., Bo-gaard, P. J. F., Busschers, F. S., Griffioen, J., Gruijters, S. H. L.L., Kiden, P., Schroot, B. M., Simmelink, H. J., Van Berkel, W.O., Van der Krogt, R. A. A., Westerhoff, W. E., and Van Daalen,T. M.: 3D geology in a 2D country: perspectives for geologi-cal surveying in the Netherlands, Netherlands J. Geosci./Geol.en Mijnb., 92, 217–241, 2013.
Vandevelde, D., Kaland, L., Lermytte, J., Lebbe, L., Oude Essink,G. H. P., Vandenbohede, A., Janssen, G., Claus, J., D’Hont, D.,and Thomas, P.: Modelling the historical evolution of the fresh-salt water distribution in a Dutch-Flemish transboundary aquifer,in: Proc. 22nd Salt Water Intrusion Meeting, 2012.
Van Loon, A. H.: Unravelling hydrological mechanisms behind fendeterioration in order to design restoration strategies, PhD thesis,Faculty of Geosciences, Utrecht University, 140 pp., 2010.
Van Loon, A. H., Schot, P. P., Griffioen, J., Bierkens, M. F. P., andWassen, M. J. J.: Palaeo-hydrological reconstruction of a man-aged fen area in The Netherlands, J. Hydrol., 378, 205–217,doi:10.1016/j.jhydrol.2009.09.014, 2009.
Van Rees Vellinga, E., Toussaint, C., and Wit, K.: Water quality andhydrology in a coastal region of the Netherlands, J. Hydrol., 50,105–127, 1981.
Vernes, R. W. and Van Doorn, T. H. M.: Van Gidslaag naar Hy-drogeologische Eenheid – Toelichting op de totstandkoming vande dataset REGIS II, TNO report, Netherlands Inst. of AppliedGeoscience TNO, Utrecht, the Netherlands, 2005.
Volker, A.: Source of brackish ground water in Pleistocene forma-tions beneath the Dutch polderland, Econ. Geol., 56, 1045–1057,1961.
Vos, P. C.: Profiel reconstructies door de Zaanstreek tussenGroenedijk en Twiske (3000 v. Chr.-heden), Aanvullende geol-ogische informatie [Profile reconstructions in the Zaan area be-tween Groenedijk and Twiske (3000 BC-present), Supplementalgeological information], TNO report, Netherlands Inst. of Ap-plied Geoscience TNO, Delft, 1998.
Vos, P. C. and Gerrets, D. A.: Archaeology: a major toolin the reconstruction of the coastal evolution of West-ergo (northern Netherlands), Quaternary Int., 133–134, 61–75,doi:10.1016/j.quaint.2004.10.008, 2005.
Vos, P. C., Bazelmans, J., Weerts, H. J. T., and der Meulen, M.: Atlasvan Nederland in het Holoceen [Atlas of the Netherlands duringthe Holocene], Bert Bakker, Amsterdam, 2011.
Weerts, H. J. T., Westerhoff, W. E., Cleveringa, P., Bierkens,M. F. P., Veldkamp, J. G., and Rijsdijk, K. F.: Quaternarygeological mapping of the lowlands of The Netherlands, a21st century perspective, Quaternary Int., 133–134, 159–178,doi:10.1016/j.quaint.2004.10.011, 2005.
Werner, A., Bakker, M., Post, V. E. A., Vandenbohede, A., Lu, C.,Ataie-Ashtiani, B., Simmons, C. T., and Barry, D. A.: Seawa-ter intrusion processes, investigation and management: Recentadvances and future challenges, Adv. Water Resour., 51, 3–26,doi:10.1016/j.advwatres.2012.03.004, 2013.
Zheng, C.: Recent Developments and Future Directions forMT3DMS and Related Transport Codes, Ground Water, 47, 620–625, doi:10.1111/j.1745-6584.2009.00602.x, 2009.
Zheng, C. and Wang, P.: MT3DMS: A Modular Three-DimensionalMultispecies Transport Model for Simulation of Advection, Dis-persion, and Chemical Reactions of Contaminants in Groundwa-ter Systems; Documentation and User’s Guide, Washington, DC,1999.
Zwertvaegher, A., Finke, P., De Reu, J., Vandenbohede, A., Lebbe,L., Bats, M., De Clercq, W., De Smedt, P., Gelorini, V., Ser-gant, J., Antrop, M., Bourgeois, J., De Maeyer, P., Van Meir-venne, M., Verniers, J., and Crombé, P.: Reconstructing PhreaticPalaeogroundwater Levels in a Geoarchaeological Context: ACase Study in Flanders, Belgium, Geoarchaeology, 28, 170–189,doi:10.1002/gea.21435, 2013.
www.hydrol-earth-syst-sci.net/18/3891/2014/ Hydrol. Earth Syst. Sci., 18, 3891–3905, 2014