Embed Size (px)
Citation preview
2
nd Floor Freeman Building, J.C. Aquino Avenue, Butuan City
Telephone: (686) (085) 815-2878 / 342-5764 www.psa.gov.ph
Date of Release: May 2018 Reference No. 2018- 010
Palay Situation Report for 2017
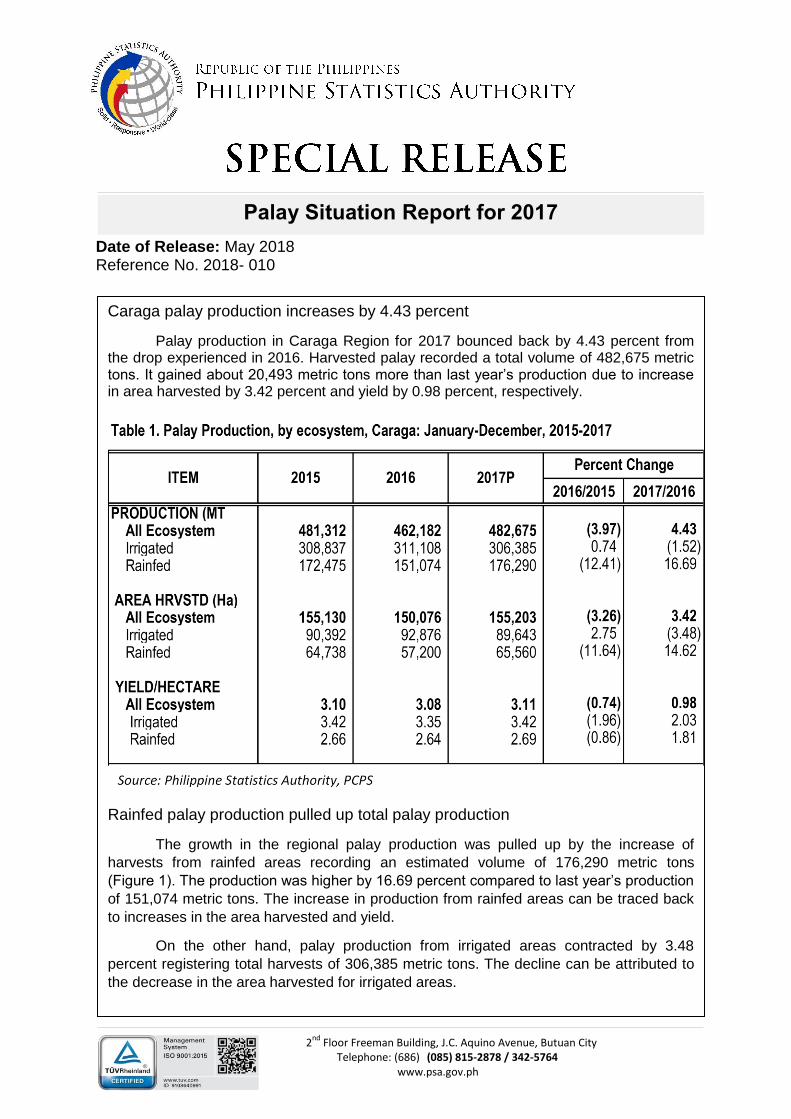
Caraga palay production increases by 4.43 percent
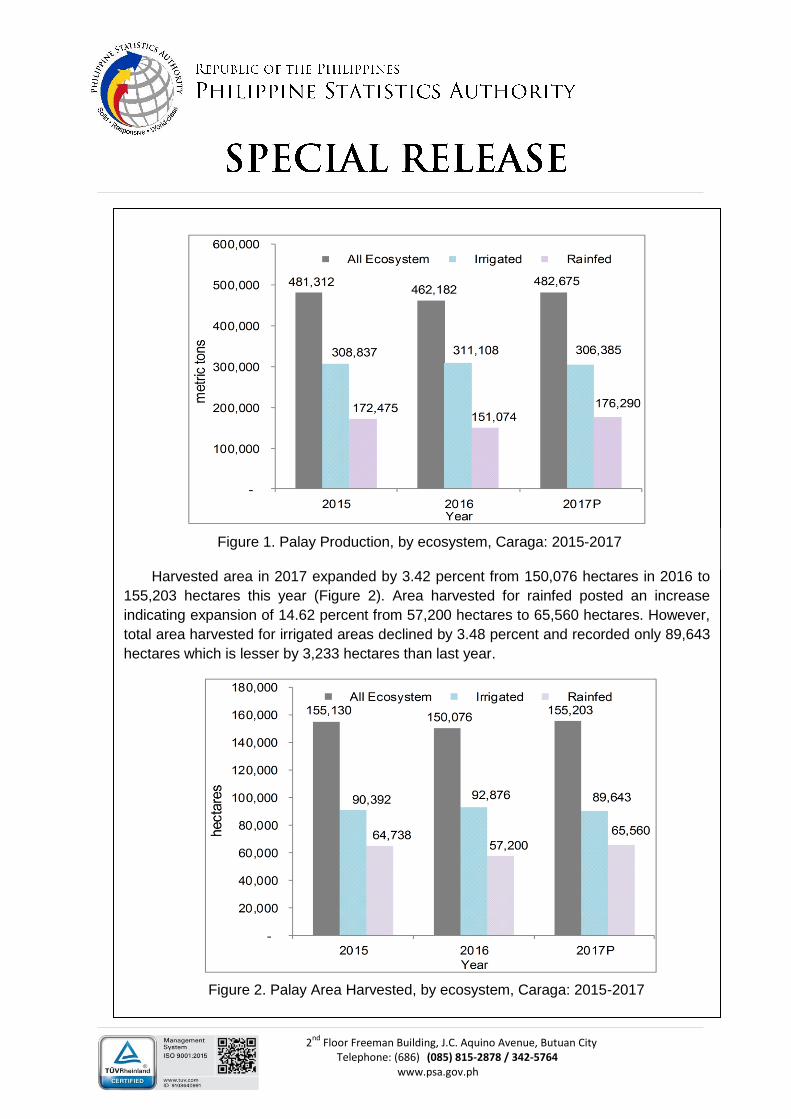
Palay production in Caraga Region for 2017 bounced back by 4.43 percent from the drop experienced in 2016. Harvested palay recorded a total volume of 482,675 metric tons. It gained about 20,493 metric tons more than last year’s production due to increase in area harvested by 3.42 percent and yield by 0.98 percent, respectively.
Rainfed palay production pulled up total palay production
The growth in the regional palay production was pulled up by the increase of
harvests from rainfed areas recording an estimated volume of 176,290 metric tons
(Figure 1). The production was higher by 16.69 percent compared to last year’s production
of 151,074 metric tons. The increase in production from rainfed areas can be traced back
to increases in the area harvested and yield.
On the other hand, palay production from irrigated areas contracted by 3.48
percent registering total harvests of 306,385 metric tons. The decline can be attributed to
the decrease in the area harvested for irrigated areas.
2
nd Floor Freeman Building, J.C. Aquino Avenue, Butuan City
Telephone: (686) (085) 815-2878 / 342-5764 www.psa.gov.ph
Palay area harvested expands by 3.42 percent
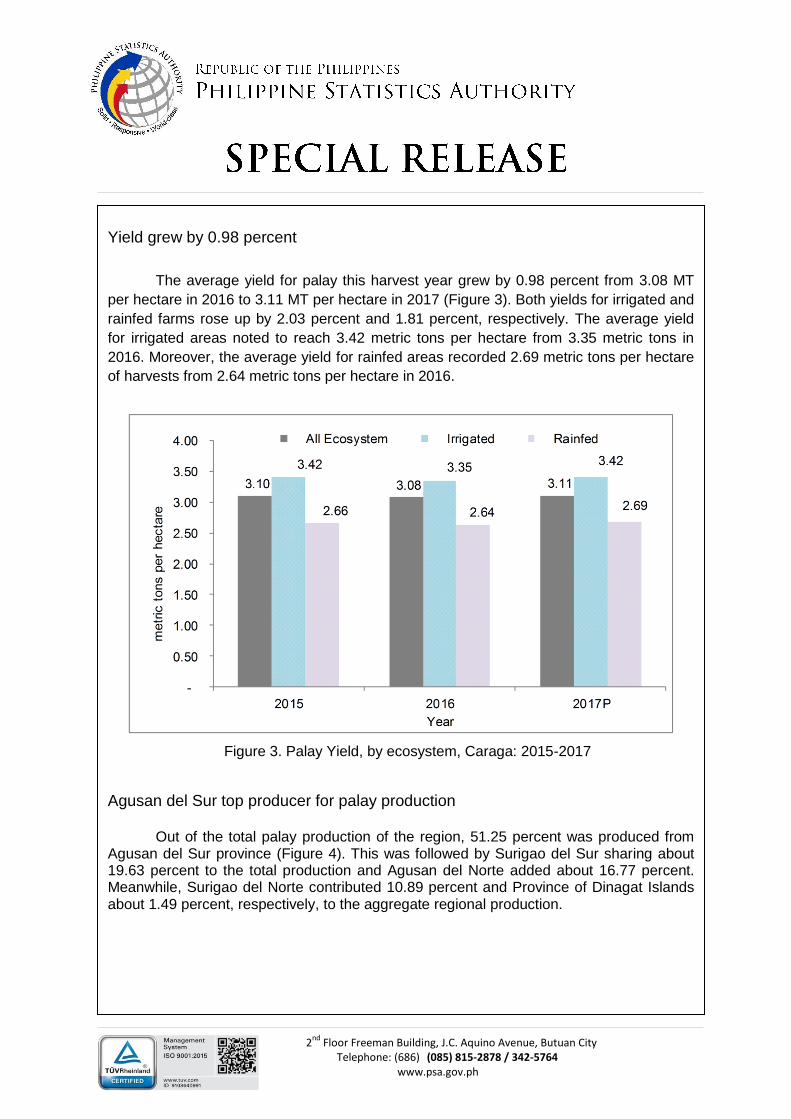
Harvested area in 2017 expanded by 3.42 percent from 150,076 hectares in 2016 to
155,203 hectares this year (Figure 2). Area harvested for rainfed posted an increase
indicating expansion of 14.62 percent from 57,200 hectares to 65,560 hectares. However,
total area harvested for irrigated areas declined by 3.48 percent and recorded only 89,643
hectares which is lesser by 3,233 hectares than last year.
Figure 1. Palay Production, by ecosystem, Caraga: 2015-2017
Figure 2. Palay Area Harvested, by ecosystem, Caraga: 2015-2017
2
nd Floor Freeman Building, J.C. Aquino Avenue, Butuan City
Telephone: (686) (085) 815-2878 / 342-5764 www.psa.gov.ph
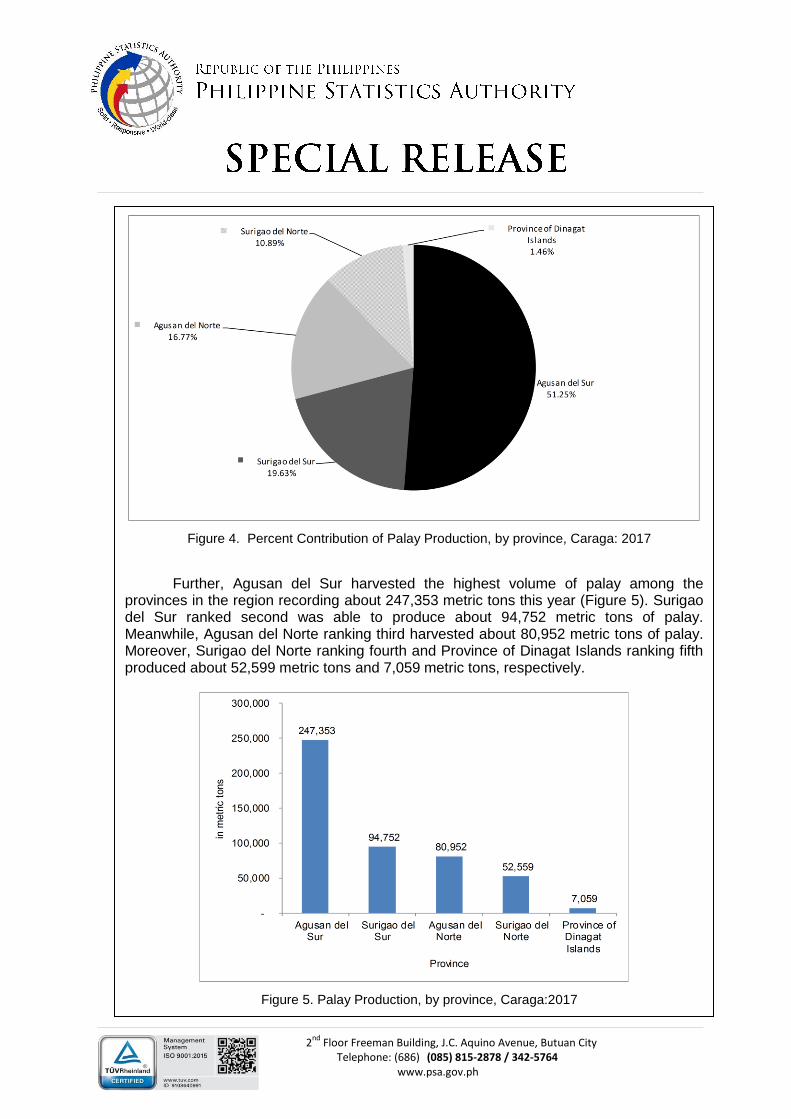
Yield grew by 0.98 percent
The average yield for palay this harvest year grew by 0.98 percent from 3.08 MT
per hectare in 2016 to 3.11 MT per hectare in 2017 (Figure 3). Both yields for irrigated and
rainfed farms rose up by 2.03 percent and 1.81 percent, respectively. The average yield
for irrigated areas noted to reach 3.42 metric tons per hectare from 3.35 metric tons in
2016. Moreover, the average yield for rainfed areas recorded 2.69 metric tons per hectare
of harvests from 2.64 metric tons per hectare in 2016.
Agusan del Sur top producer for palay production
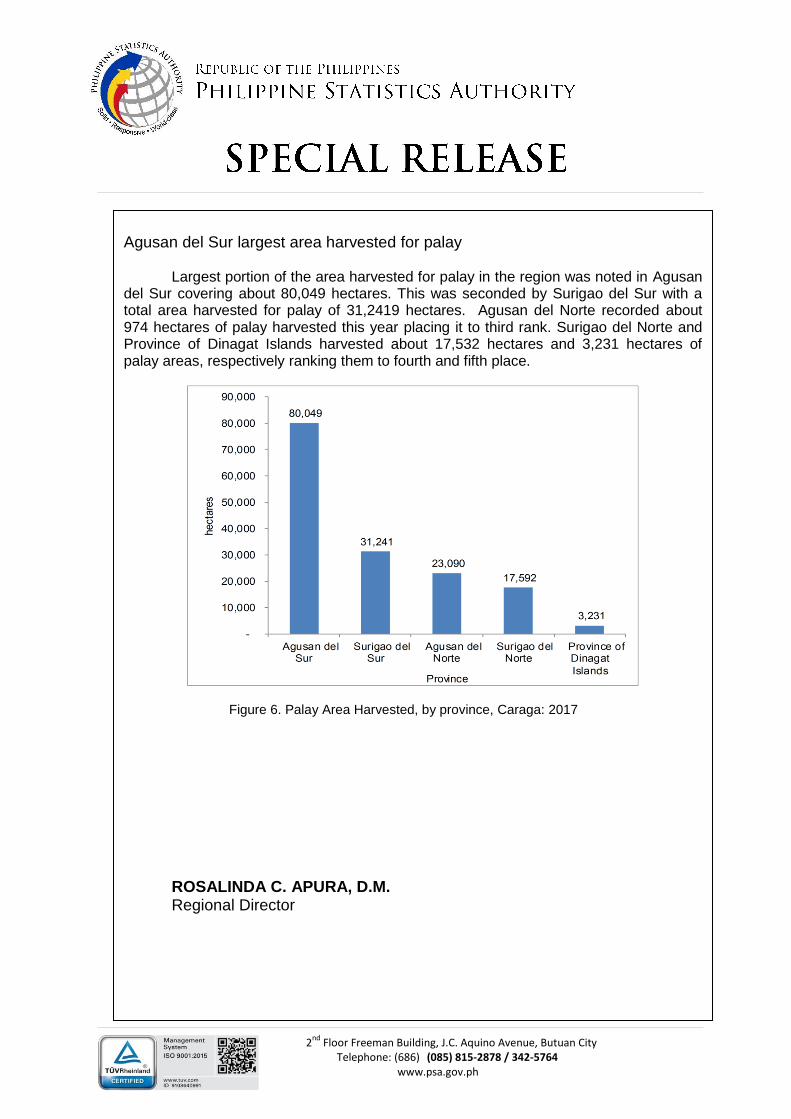
Out of the total palay production of the region, 51.25 percent was produced from Agusan del Sur province (Figure 4). This was followed by Surigao del Sur sharing about 19.63 percent to the total production and Agusan del Norte added about 16.77 percent. Meanwhile, Surigao del Norte contributed 10.89 percent and Province of Dinagat Islands about 1.49 percent, respectively, to the aggregate regional production.
Figure 3. Palay Yield, by ecosystem, Caraga: 2015-2017
2
nd Floor Freeman Building, J.C. Aquino Avenue, Butuan City
Telephone: (686) (085) 815-2878 / 342-5764 www.psa.gov.ph
Further, Agusan del Sur harvested the highest volume of palay among the provinces in the region recording about 247,353 metric tons this year (Figure 5). Surigao del Sur ranked second was able to produce about 94,752 metric tons of palay. Meanwhile, Agusan del Norte ranking third harvested about 80,952 metric tons of palay. Moreover, Surigao del Norte ranking fourth and Province of Dinagat Islands ranking fifth produced about 52,599 metric tons and 7,059 metric tons, respectively.
Figure 4. Percent Contribution of Palay Production, by province, Caraga: 2017
Figure 5. Palay Production, by province, Caraga:2017
2
nd Floor Freeman Building, J.C. Aquino Avenue, Butuan City
Telephone: (686) (085) 815-2878 / 342-5764 www.psa.gov.ph
Agusan del Sur largest area harvested for palay
Largest portion of the area harvested for palay in the region was noted in Agusan del Sur covering about 80,049 hectares. This was seconded by Surigao del Sur with a total area harvested for palay of 31,2419 hectares. Agusan del Norte recorded about 974 hectares of palay harvested this year placing it to third rank. Surigao del Norte and Province of Dinagat Islands harvested about 17,532 hectares and 3,231 hectares of palay areas, respectively ranking them to fourth and fifth place.
ROSALINDA C. APURA, D.M. Regional Director
Figure 6. Palay Area Harvested, by province, Caraga: 2017

2
nd Floor Freeman Building, J.C. Aquino Avenue, Butuan City
Telephone: (686) (085) 815-2878 / 342-5764 www.psa.gov.ph
Technical Notes:
Production—refers to the quantity produced and actually harvested for a
particular crop during the reference period.
For palay and corn, harvest area refers to the actual area harvested/to be
harvested during the reference quarter.
Estimates and forecasts of production and harvest area of palay and corn are
generated from the Quarterly Palay and Corn Production Survey (PCPS) of
which there are four survey rounds in a year, that is, January, April, July and
October.
2
nd Floor Freeman Building, J.C. Aquino Avenue, Butuan City
Telephone: (686) (085) 815-2878 / 342-5764 www.psa.gov.ph
2016/2015 2017/2016
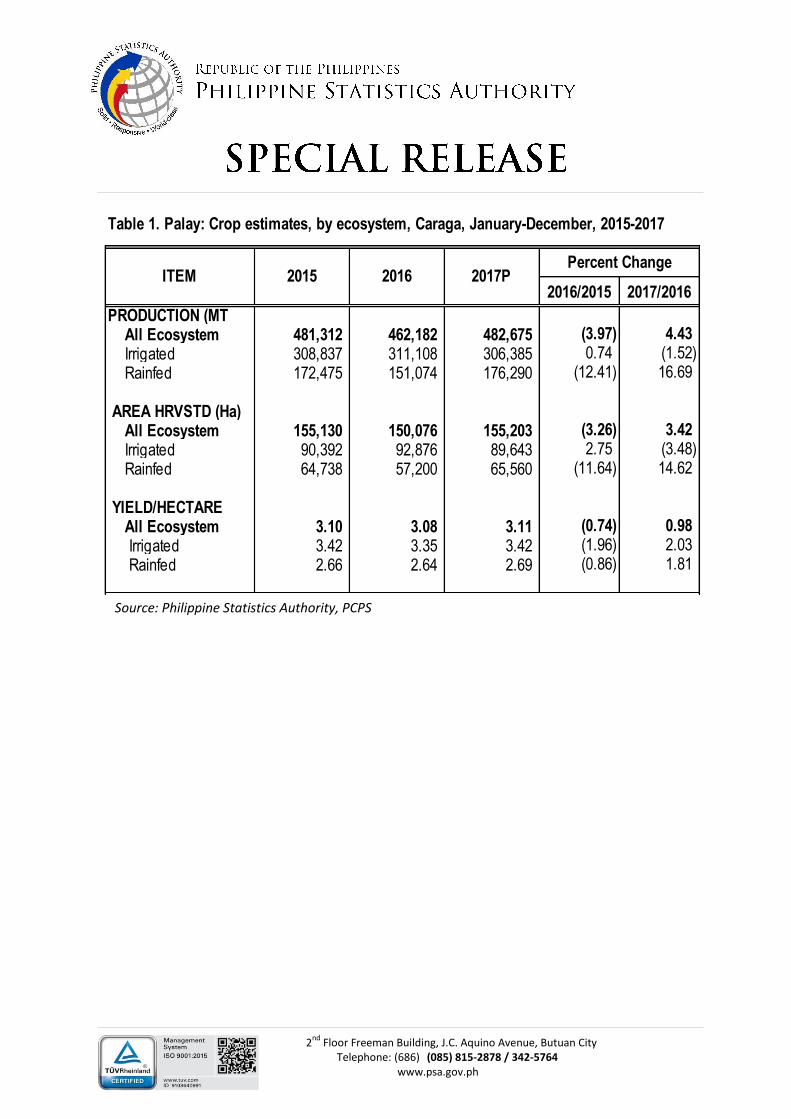
PRODUCTION (MT All Ecosystem 481,312 462,182 482,675 (3.97) 4.43
Irrigated 308,837 311,108 306,385 0.74 (1.52)
Rainfed 172,475 151,074 176,290 (12.41) 16.69
AREA HRVSTD (Ha) All Ecosystem 155,130 150,076 155,203 (3.26) 3.42
Irrigated 90,392 92,876 89,643 2.75 (3.48)
Rainfed 64,738 57,200 65,560 (11.64) 14.62
YIELD/HECTARE All Ecosystem 3.10 3.08 3.11 (0.74) 0.98
Irrigated 3.42 3.35 3.42 (1.96) 2.03
Rainfed 2.66 2.64 2.69 (0.86) 1.81
Table 1. Palay: Crop estimates, by ecosystem, Caraga, January-December, 2015-2017
ITEM 2015 2016 2017PPercent Change
Source: Philippine Statistics Authority, PCPS
2
nd Floor Freeman Building, J.C. Aquino Avenue, Butuan City
Telephone: (686) (085) 815-2878 / 342-5764 www.psa.gov.ph
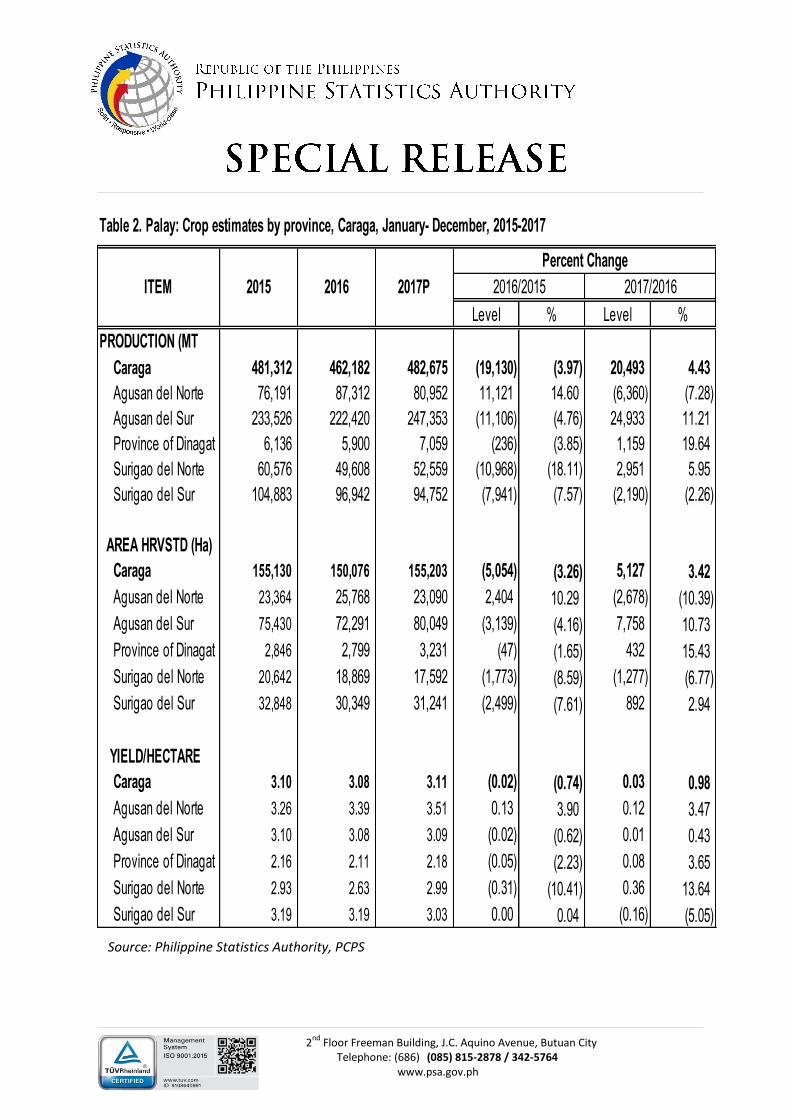
Level % Level %
PRODUCTION (MT
Caraga 481,312 462,182 482,675 (19,130) (3.97) 20,493 4.43
Agusan del Norte 76,191 87,312 80,952 11,121 14.60 (6,360) (7.28)
Agusan del Sur 233,526 222,420 247,353 (11,106) (4.76) 24,933 11.21
Province of Dinagat Islands 6,136 5,900 7,059 (236) (3.85) 1,159 19.64
Surigao del Norte 60,576 49,608 52,559 (10,968) (18.11) 2,951 5.95
Surigao del Sur 104,883 96,942 94,752 (7,941) (7.57) (2,190) (2.26)
AREA HRVSTD (Ha)
Caraga 155,130 150,076 155,203 (5,054) (3.26) 5,127 3.42
Agusan del Norte 23,364 25,768 23,090 2,404 10.29 (2,678) (10.39)
Agusan del Sur 75,430 72,291 80,049 (3,139) (4.16) 7,758 10.73
Province of Dinagat Islands 2,846 2,799 3,231 (47) (1.65) 432 15.43
Surigao del Norte 20,642 18,869 17,592 (1,773) (8.59) (1,277) (6.77)
Surigao del Sur 32,848 30,349 31,241 (2,499) (7.61) 892 2.94
YIELD/HECTARE
Caraga 3.10 3.08 3.11 (0.02) (0.74) 0.03 0.98
Agusan del Norte 3.26 3.39 3.51 0.13 3.90 0.12 3.47
Agusan del Sur 3.10 3.08 3.09 (0.02) (0.62) 0.01 0.43
Province of Dinagat Islands 2.16 2.11 2.18 (0.05) (2.23) 0.08 3.65
Surigao del Norte 2.93 2.63 2.99 (0.31) (10.41) 0.36 13.64
Surigao del Sur 3.19 3.19 3.03 0.00 0.04 (0.16) (5.05)
Table 2. Palay: Crop estimates by province, Caraga, January- December, 2015-2017
2016/2015 2017/2016ITEM 2015 2016 2017P
Percent Change
Source: Philippine Statistics Authority, PCPS