Embed Size (px)
Citation preview

This article was downloaded by: [University of Glasgow]On: 21 December 2014, At: 10:04Publisher: Taylor & FrancisInforma Ltd Registered in England and Wales Registered Number: 1072954 Registeredoffice: Mortimer House, 37-41 Mortimer Street, London W1T 3JH, UK
Advances in PhysicsPublication details, including instructions for authors and subscriptioninformation:http://www.tandfonline.com/loi/tadp20
Palaeomagnetic measurements on KarroodoleritesK.W.T. Graham a & A.L. Hales aa Bernard Price Institute of Geophysical Research University of theWitwatersrand , JohannesburgPublished online: 02 Jun 2006.
To cite this article: K.W.T. Graham & A.L. Hales (1957) Palaeomagnetic measurements on Karroodolerites, Advances in Physics, 6:22, 149-161, DOI: 10.1080/00018739700101511
To link to this article: http://dx.doi.org/10.1080/00018739700101511
PLEASE SCROLL DOWN FOR ARTICLE
Taylor & Francis makes every effort to ensure the accuracy of all the information (the“Content”) contained in the publications on our platform. However, Taylor & Francis, ouragents, and our licensors make no representations or warranties whatsoever as to theaccuracy, completeness, or suitability for any purpose of the Content. Any opinions andviews expressed in this publication are the opinions and views of the authors, and are notthe views of or endorsed by Taylor & Francis. The accuracy of the Content should not berelied upon and should be independently verified with primary sources of information. Taylorand Francis shall not be liable for any losses, actions, claims, proceedings, demands, costs,expenses, damages, and other liabilities whatsoever or howsoever caused arising directly orindirectly in connection with, in relation to or arising out of the use of the Content.
This article may be used for research, teaching, and private study purposes. Any substantialor systematic reproduction, redistribution, reselling, loan, sub-licensing, systematic supply,or distribution in any form to anyone is expressly forbidden. Terms & Conditions of accessand use can be found at http://www.tandfonline.com/page/terms-and-conditions

[ 149 ]
P a l a e o m a g n e t i c M e a s u r e m e n t s on Karroo D o l e r i t e s
By K. W. T. GI~AI~IAM and A. L. HALES Bernard Price Institute of Geophysical Research University of the
Witwatersrand, Johannesburg
§ 1. INTRODUCTION IN 1955 the authors started on a programme of measurement of the direction of magnetization of the sedimentary rocks of the Karroo systein. In selecting specimens for palaeomagnetic measurement it is necessary to avoid regions of dolcrite intrusion in view of the possibility of the sediments being baked by such intrusions.. I t is well known that. there are extensive dolerite intrusions in the Karroo system north and east of the line marked on the 1939 edition of du Toit's map (du Toit !939) as the southern limit of the Karroo dolerites, but omitted from the 1954 edition. Dolerites of possible Karroo age do occur south of this line bu t comparatively i~ffre- quently. However, in this southern region the Karroo sediments have been affected by the Cape folding and in some cases show evidence of shear. Thus, these rocks too, must be used with caution for palaeomagnetic measurements.
In view of the doleritc difficulty i~ became clear that it was desirable to measure the direction of magnetization associated with the dolerites at an early stage. The first collection of 30 dolerite samples from 13 sills and dykes exposed in road cuttings and quarries was made in December 1955 during a visit of Dr. John W. Graham of the Department of Terrestrial Magnetism, Carnegie Insti tution of Washington. On a later trip the authors collected a fhrther 17 samples from 7 similar fresh exposures and six additional samples from a sill sampled during the first trip. The results of this survey were disa.ppointing in that they showed considerable scatter. Remoasurement after a period of seven or eight months showed that the scatter could be Considerably reduced by the elimination oLthe samples which were demonstrably unstable. Details of the measurements of the surface samples will be given in § 6 of this paper.
In the meantime measurements had been made on underground samples from two localities viz : (a) from the shafts of Winkelhaak Gold Mine to the eas t of Johannesburg and (b) from a railway tunnel near Estcourt in Natal. The scatter in the underground samples was considerably less than that in the surface samples as had been found by Gougll (1956) in a similar survey of the Pilansberg dyke system.
§ 2. METHOD OF COLLECTION
In general the sample collected is in the form of a one inch diameter cylinder some five or six inches long. This is .drilled in situ using a portable diamond carcing drill driven by a small petrol engine. The principal difficulty in drilling away from road transport is that a minimum
Dow
nloa
ded
by [
Uni
vers
ity o
f G
lasg
ow]
at 1
0:04
21
Dec
embe
r 20
14
150 K . W . T . Graham and A. L. Halos on
of two gallons of water is required to drill a six inch core. A line is scratched down the length of the core while still in situ and the bearing of this line and the inclination of the axis of the cylindrical core in two directions are determined by means of a Brunton compass. The top and bottom of the core are carefully marked.
In the first collection of dolerites oriented hand samples were chipped from the rock and drilled in the laboratory. A similar procedure wa~ used by the staff of the Geology Department of Union Corporation in collecting samples from the sh.af~s of WinkeLhaak mine.
Usually four or five specimens in the form of cylinders one inch in dia- meter and one inch long are cut from each sample whether it is drilled in si tu or in the laboratory.
§ 3. METHOD OF MEASUR~MEI~T
The instrument used for measurement is a spinner type magnetometer similar to that described by Graham (1955). In this type of magnetometer a signal i~om the coils, generated by the spinning specimen~ is compared in phase with that received by a photoelectric cell from a paint pattern on the spinning top. In the system as devised by Graham the signals from the coils and the photoelectric unit are fed through carefully matched narrow band pass filters before they are compared in a phase discriminating circuit. For the early measurements reported here a circuit involving only one filter unit w~,s used. The signals from the coil and the photoelectric unit were mixed before filtering. I f the signal from the photoelectric unit be adjusted until it is equal in amplitude but opposite in phase to that from the coils, then the resultant signal received from the filter will be a mini- mum. The filter unit in this case functions as a null detector. This method works very well do~n to intensities of magnetization of the order of 10 -8 c.g.s.u, giving an accuracy at this level of better than 2 or 3 degrees. However, as the signal approaches noise level, the accuracy with which it is possible to set to a minimum falls rapidly so that the system containing two separate filters, as used by Graham, is very much more convenient for measuring weakly magnetized specimens. The Department of Terres- trial Magnetism, Carnegie Institution of Washington, has very kindly lent us a pair of their matched filter units and the instrument was modified to operate in the Graham manner before measurements were made on the specimens from the Wi,~ke]haak shafts and the Estcottrt tunnel.
§ 4. MEASUREMENTS OF UNDERGROUND DOLERITES FROM W1-NKELHAAK, NEAR KINI~OSS, TRANSVAAL
Oriented samples were very kindly collected for us by geologists of Union Corporation during the course of shaft sinking operations at Winkelhaak Milms Ltd. on the Far East Rand. The position of the mine is marked as ' W ' on the map of the Eastern half of the Union shown in fig. 1. Two pairs of vertical shafts were sunk, the members of a pair being approxi- mately 750 feet apart and the distance between the pairs about one mile.
Dow
nloa
ded
by [
Uni
vers
ity o
f G
lasg
ow]
at 1
0:04
21
Dec
embe
r 20
14
Palaeomagnetic Measurements on Karroo Dolerites 151
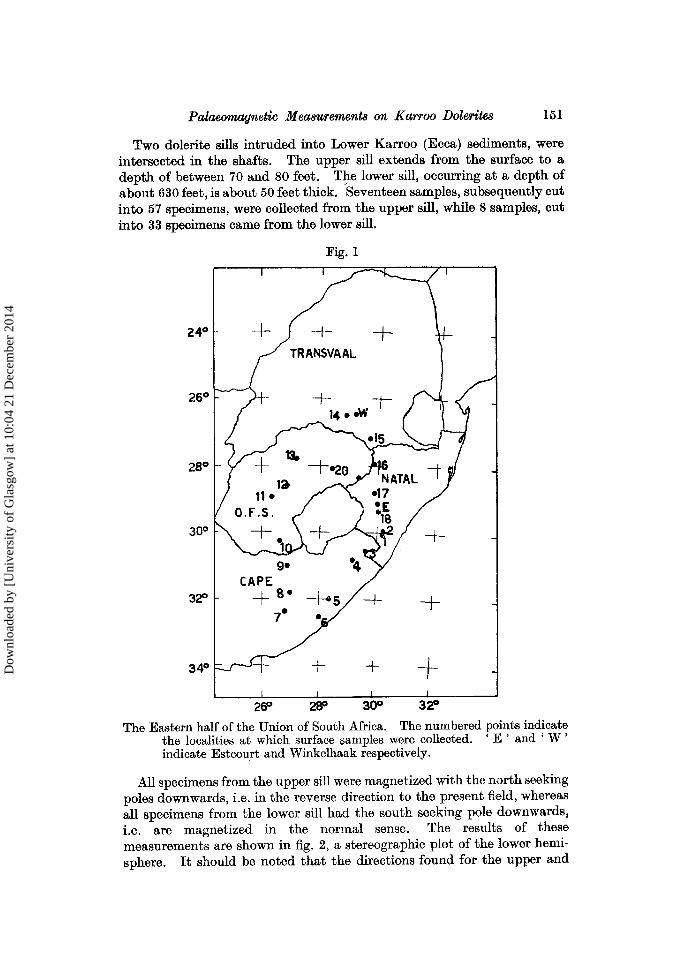
Two dolerite sills intruded into Lower Karroo (Eeca) sediments, were intersected in the shafts. The upper sill extends from the surface to a depth of between 70 and 80 feet. The lower sill, occurring at a depth of about 630 feet, is about 50 feet thick. Seventeen samples, subsequently cut into 57 specimens, were collected from the upper sill, while 8 samples, cut into 33 specimens came from the lower sill.
Fig. 1
I I t ~ / I
;~4 o
26 °
28 °
30 °
32 °
3 4 °
, - ~ TRANSVAAL
- f- -1- 14 ° ° W
13,
11 ° O.F.S. ~..
--t-- '20 , ~ , , T , , , - ~
"17
9. *a CAPE S. I °S~//
-~ 7° .
-+-
I 3 2 =
The numbered points indicate
I I I i J 26 ° 28 ° 3O °
The Eastern half of the Union of South Africa. the localities at which surface samples were collected. ' E ' and ' W ' indicate Estcourt and Winkelhaak respectively.
All specimens from the upper sill were magnetized with the north seeking poles downwards, i.e. in the reverse direction to the present field, whereas all specimens from the lower sill had the south seeking pole downwards, i.e. are magnetized in the normal sense. The results of these measurements are shown in fig. 2, a stereographic plot of the lower hemi- sphere. I t should be noted that the directions found for the upper and
Dow
nloa
ded
by [
Uni
vers
ity o
f G
lasg
ow]
at 1
0:04
21
Dec
embe
r 20
14
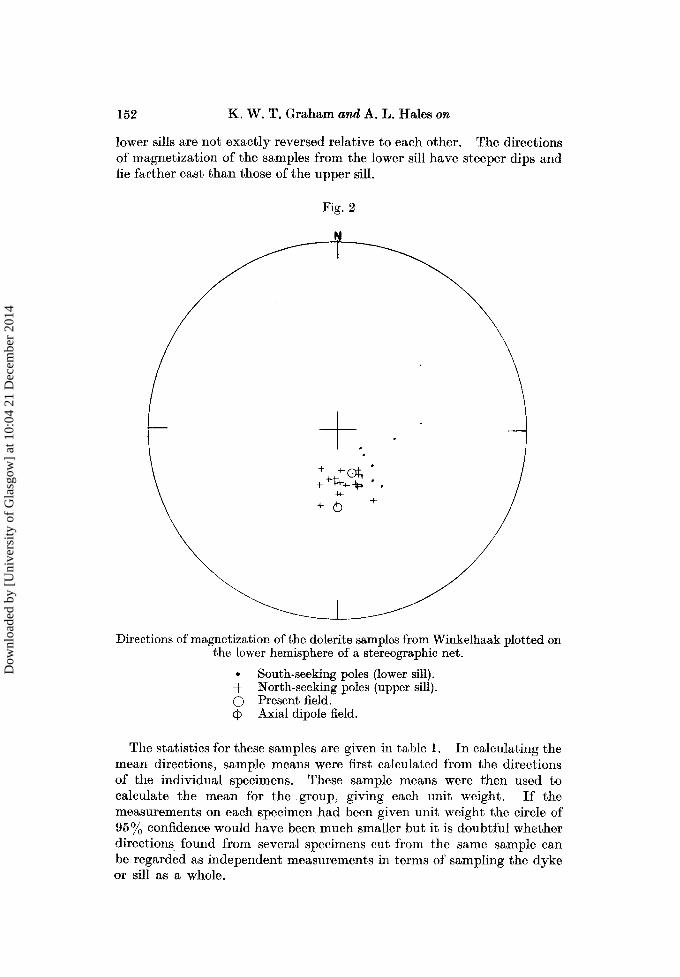
Fig. 2
P
152 K . W . T . Graham and A. L. Hales on
lower sills are not exactly reversed relative to each other. The directions of magnetization of the samples from the lower sill have steeper dips and lie farther east than those of the upper sill.
Directions of magnetization of the dolerite samples from Winkelhaak plotted on the lower hemisphere of a stereographie net.
• South-seeking poles (lower sill). q- North-seeking poles (upper sill). () Present field. (~ Axial dipole field.
The statistics for these samples are given in table 1. In calculating the mean directions, sample means were first calculated from the directions of the individual specimens. These sample means were Vhen used to calculate the mean for the group, giving each unit weight. I f the measurements on each specimen had been given unit weight the circle of 95~o confidence would have been much smaller but it is doubtful whether directions found from several specimens cut from the same sample can be regarded as independent measurements in terms of sampling the dyke or sill as a whole.
Dow
nloa
ded
by [
Uni
vers
ity o
f G
lasg
ow]
at 1
0:04
21
Dec
embe
r 20
14
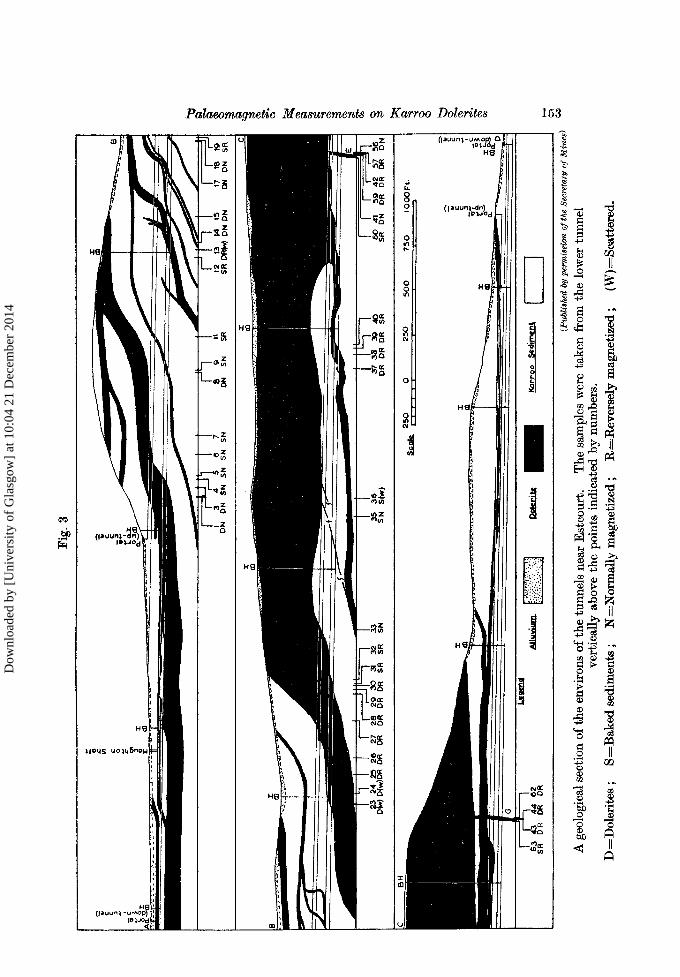
Fig.
3
cO
-3
.',;.z
I 3
4 5
8 7
8 g
1~
)N
DN
S
N
SN
S
N
SN
D
N
SN
S
R
12
13
14
15,
17
115
19
;R D
R(w
) D
N D
N
DN
D
N
SR
DR
D
R
DR
S
R
~,H
;c
ale
25
0
0 21
50
50
0
50
41
5
9
42
5
7
56
1
;R
DN
D
R
DR
D
R
DN
I
63
4
2 A
lluv;
um
D
ole
rite
K
orr
oo
S
edim
ent
;R
D R
D
R
DR
~5
0
lOO
OF
t.
3
__
Ca~
L
3~
(P2~
blis
hed b
y pe
rmis
sion
of t
he S
ecre
tary
of M
ines
)
A g
eolo
gica
l sec
tion
of
the
envi
rons
of
the
tunn
els
near
Est
cour
t.
The
sam
ples
wer
e ta
ken
from
the
low
er t
unne
l ve
rtic
ally
abo
ve t
he p
oint
s in
dica
ted
by n
umbe
rs.
D=
Dol
erit
es ;
S-
---B
aked
sed
imen
ts ;
l~
I---
-Nor
maU
y mag
neti
zed
; R
----
Rev
erse
ly m
agne
tize
d ;
(W)-
---S
catte
red.
Dow
nloa
ded
by [
Uni
vers
ity o
f G
lasg
ow]
at 1
0:04
21
Dec
embe
r 20
14
154 K . W . T . Graham a n d A. L. Hales on
§ 5. MEASUREMENTS OF UNDERGROUND SAMPLES FROM A ~:~AILWAY TUNNEL NEAR ESTCOURT, NATAL
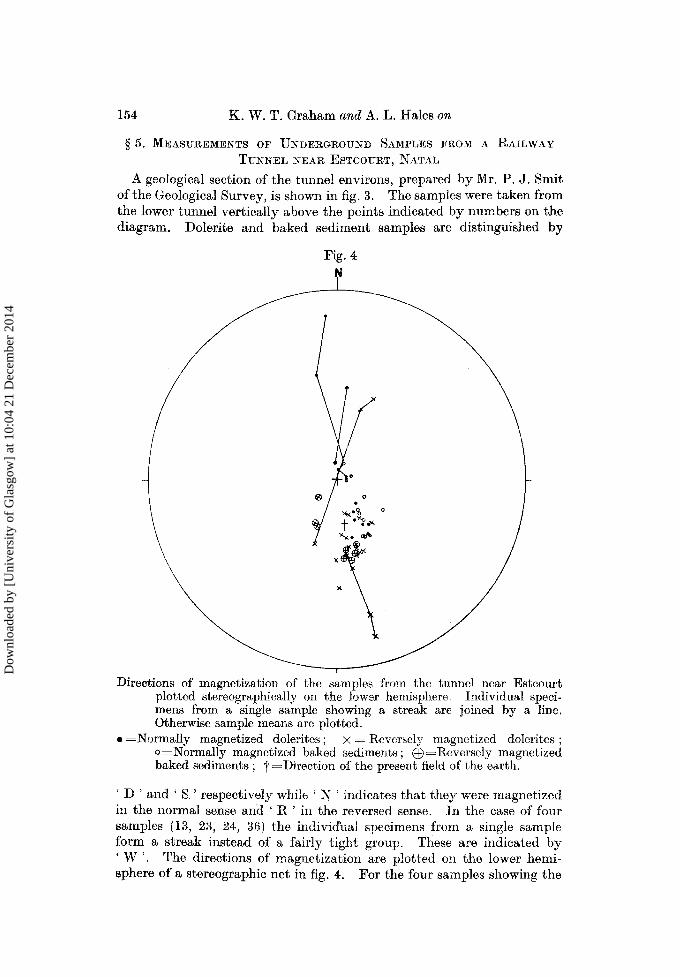
A geological section of the tunnel environs, prepared b y Mr. P. J. Smit of the Geological Survey, is shown in fig. 3. The samples were taken from the lower tunnel vert ical ly above the points indicated by numbers on the diagram. Dolerite and baked sediment samples are dist inguished by
Fig. 4
Directions of magnetization of the samples from the tunnel near Esteourt plotted stereographieally on the lower hemisphere° Individual speci- mens from a single samp]e showing a streak are joined by a line. Otherwise sample means are p]otted.
®=Normally magnetized dolerites; × ~-Reversely magnetized dolerites; o=Normally magnetized baked sediments; +@--Reversely magnetized baked sediments ; -~ =INreetion of the present field of the earth.
' D ' and ' S ' respect ively while ' N ' indicates tha t they' were magnet ized in the normal sense and ' R ' in the reversed sense. In the case of four samples (13, 23, 24, 36) the individual specimens from a single sample form a s t reak instead of a fairly t ight group. These are indicated b y ' W '. The directions of magnet iza t ion are plot ted on the lower hemi- sphere of a stereographic ne t in fig. 4. For the four samples showing the
Dow
nloa
ded
by [
Uni
vers
ity o
f G
lasg
ow]
at 1
0:04
21
Dec
embe
r 20
14
Palaeomarjnetic Measurements on Karroo Doler{te~ 155
streaking the directions of magnetization of the individual specimens have been plotted, those from the same sample being linked by a line. The rest are shown as the mean for the sample, calculated from several specimens.
Examination of the data in fig. 3 shows that in general the baked sediments are magnetized in the same sense as the adjacent dolerites. There are, however, some anomalies.
When the first collection was made two samples (41, 42) were taken from the dyke at point E. One of these (41) was found to be magnetized in the normal sense, the other in the reversed sense. I t was decided to return to the tunnel to collect additional samples from this dyke. (The other anomalous regions had already been cemented up.) These samples served to show that the chill zones were normally magnetized, whereas the interior of the dyke and the only sample of baked sediment that was measurable, were magnetized in the reversed sense. Possible explanations of this are :
Ca) that the chill zones are unstable ; (b) that a self-reversing mechanism operates in the chill zones ; (c) t h a t a self-reversing mechanism operates in both the interior of the
dyke and in the adjacent sediments but not in the chill zones ; (d) that a reversal of the earth's field occurred while the dyke was
cooling ; (e) that there is in fact more than one intrusion with a reversal of the
earth's field between the intrusions.
The possibilities (4), (d) and (e) seem unlikely. On the information available at present it is impossible to decide between Ca) and (b), though the possibility of instability in some samples of dolerite is supported by the streaking ncted in samples 13, 23 and 24.
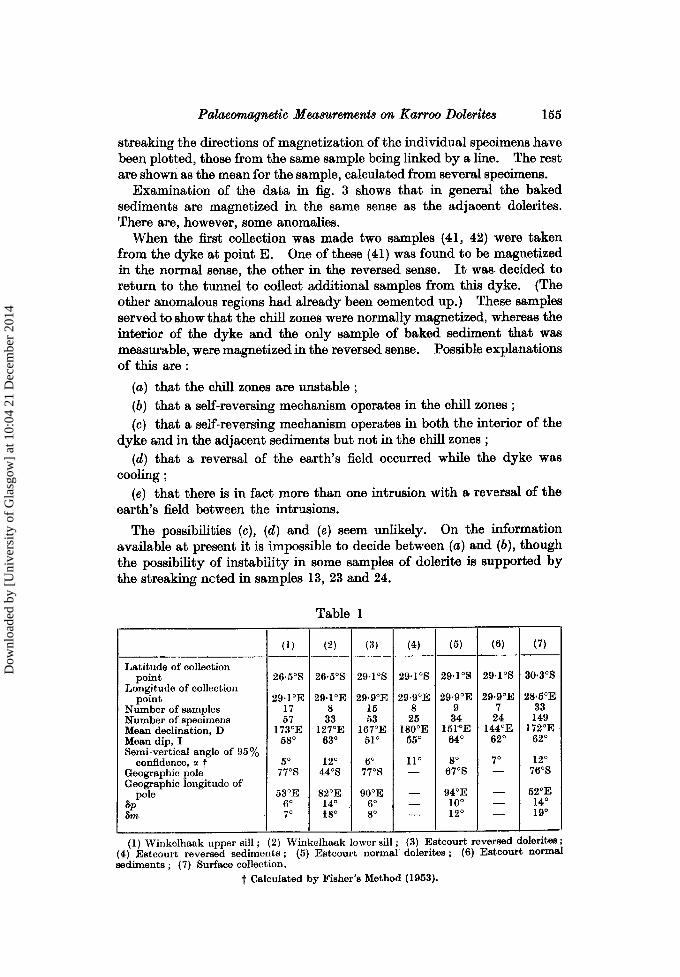
Table 1
L a t i t u d e of col lect ion po in t
Long i tude of col lect ion po in t
N u m b e r of samples N u m b e r of spec imens Mean dec l ina t ion , D Mean dip, I Semi-~er t ica l angle of 95%
confidence, u Geographic pole Geographic long i tude of
pole 8p ~m
(i)
26.5°S
(2)
26.5°S
29.1°E 29.1°E 17 8 57 33
173°E 127°E 58 ° 63 °
5 ° 12 ~ 77°S 44°S
53°E 82°E 6 o 14 ° 7 o t 8 °
(3)
29.1°8
29.9°E 15 53
167°E 51 o
6 ° 77°S
90°E 6 °
8 °
(4)
29.1°S
29.9°E 8
25 1 8 0 ° E
55 °
11 o
(5) (6)
29.1°S 29.1°S
29.9OE 29.9°E 9 7
34 24 151~E 144°E
64 ° 62 °
8 ° 7 °
67°S
94OE 10 o 12 °
(7)
3 0 . 3 ° S
28.5°E 33 149
172°E 62 °
12 ° 76°S
52°E 14 ° 19 °
(1) W i n k e l h a a k upper sill ; (2) W i n k e l h a a k lower sill ; (3) E s t e o u r t r eversed doler i tes (4) E s t c o u r t reversed s e d i m e n t s ; (5) E s t c o u r t no rma l doler i tes ; (6) E s t c o u r t no rma l s e d i m e n t s ; (7) Surface col lect ion.
t Ca lcu la t ed by F i she r ' s Method (1953).
Dow
nloa
ded
by [
Uni
vers
ity o
f G
lasg
ow]
at 1
0:04
21
Dec
embe
r 20
14
156 K. W. T. Graham and A. L. Hales on
Considering the results from this tunnel as a whole, mean directions calculated from the reversely magnetized dolerites, the reversely mag- netized sediments, the normally magnetized dolerites and the normally magnetized sediments are given in table 1. Samples 13, 23, 24 and 36 have been omitted from these calculations. The difference between the sediments and the dolerites is in all cases within the limits of erro r of the means, whereas the mean for the normally magnetized samples is
Fig. 5
N
I
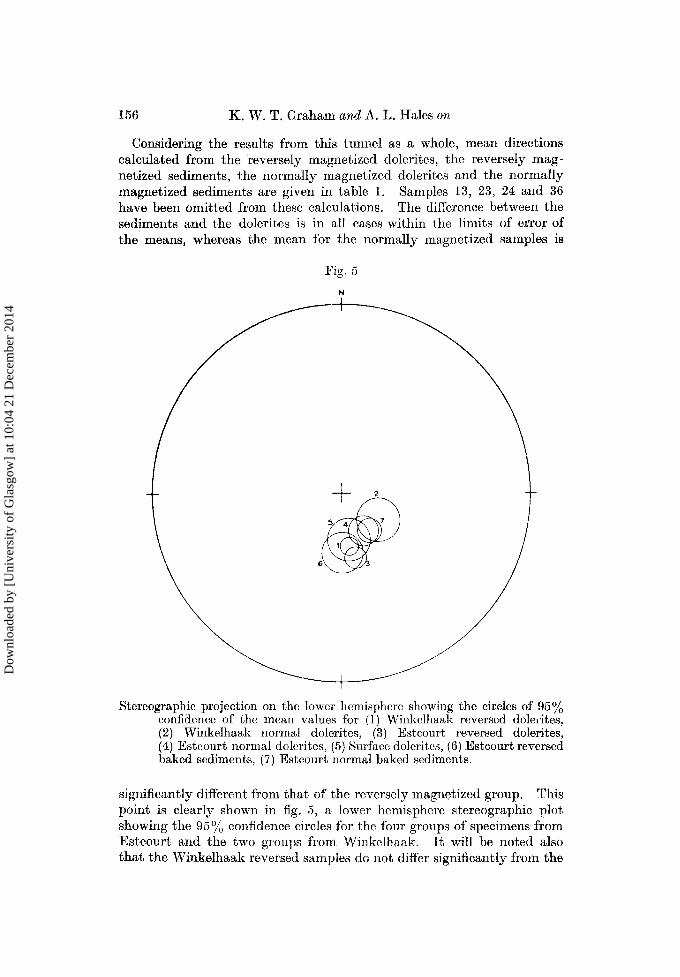
Stereographie projection on the lower hemisphere showing the circles of 95% confidence of the mean values for (1) Winkelhaak reversed dolerites, (2) Winkelhaak normal dolerites, (3) Esteourt reversed dolerites, (4) Esteourt normal dolerites, (5) Surii~ee dolerites, (6) Esteourt reversed baked sediments, (7) Esteourt normal baked sediments.
significantly different from that of tile reversely magnetized group. This point is dear ly shown in fig. 5, a lower hemisphere stereographic plot. showing the 95% confidence circles for the four groupsof specimens from Esteourt and the two groups from Winkelhaak. I t will be noted also that the Winkelhaak reversed samples do not, differ significantly from the
Dow
nloa
ded
by [
Uni
vers
ity o
f G
lasg
ow]
at 1
0:04
21
Dec
embe
r 20
14
Palaeomagnetic Measurements on Karroo Doleritss 157
Esteourt reversed samples nor do the Winkelhaak normal samples differ significantly from the normal Estcourt samples. All the normMly magnetized samples do, however, differ significantly from the reversed ones. I t may be expected that , in view of the possible instability of some of the normally magnetized samples, the mean for these samples might not be as satisfactory a datum as that found from the reversely magnetized ones. In the case of the latter it is considered that the fact that they have retained a direction of magnetization which is in the opposite sense to the present field is in itseff an assurance of their stability.
Inspection of fig. 4 reveals that, although the normally magnetized samples give magnetic directions closer to the present field of the earth than do the reversed ones, they all lie off to the East, and it seems unlikely tha t they are all unstable. Furthermore, it is difficult to see why, in general, the baked sediments should only be unstable close to dolerites tha t are unstable. Similarly, it seems unlikely that a serf-reversal mechanism should affect dolerites and their baked sediments in some areas while those in other areas should be unchanged.
The explanation of these observations would seem to be complex. I t seems probable that these intrusions are not strictly contemporaneous and the possibility of a reversal of the earth's field during the time of intrusion of this swarm of sills and dykes must be considered. Perhaps samples 13, 23 and 24 happened to be cooling through their Curie points at the time of the reversal of the field. I f we assume that such a reversM did take place, we would have a picture of normally magnetized sills and dykes with normally magnetized adjacent sediments and reversely magnetized dolerites with their reversed baked sediments. Secondary effects, due to self-reversal under special circumstances or to instability, might be superimposed on the simple picture.
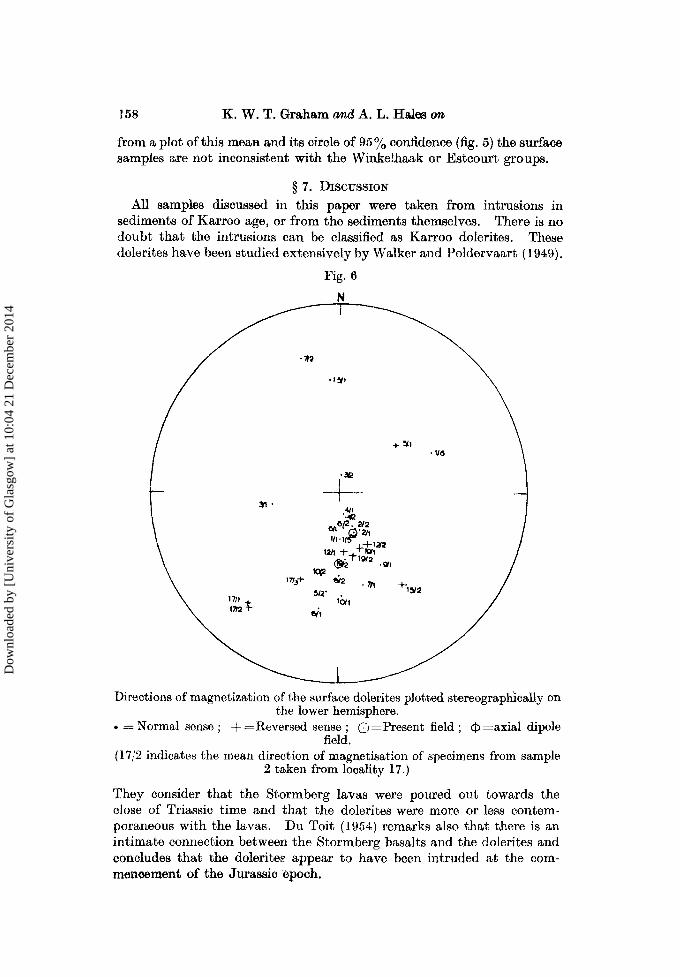
§ 6. THE M]~ASUREM]~TS O~ THE SVRFACE SAMPLES
The localities from which the samples were collected are indicated by numbers on a map in fig. 1. All the surface samples were measured as soon after collection as possible. One specimen from each sample was remeasured three or four months later and another specimen from each was remeasured some seven or eight months after the first measurements. I t was found that some specimens showed a considerable change from the direction of magnetization first measured and it seems reasonable to conclude that those specimens for which the change was considerable are unstable: I t was decided to exclude all samples from a locality if any one of the specimens remeasured had shown a change in the direction of magnetization of more than 10 degrees. The sample means for the remaining samples are shown in fig. 6. I t will be noted that there are still a number of scattered measurements but in such cases the two samples from the same locality do not agree and they, too, may be unstable. The mean for the surface collection was calculated disregarding sign and giving unit weight to each sample and is given in table 1. As will be seen
Dow
nloa
ded
by [
Uni
vers
ity o
f G
lasg
ow]
at 1
0:04
21
Dec
embe
r 20
14
158 K . W . T . Graham and A. L. Hales on
f rom a plot of this mean and its circle of 95% confidence (fig. 5) the surface samples are not inconsistent with the Winkelhaak or Es tcour t groups.
§ 7. D i scus s ion
All samples discussed in this paper were taken f rom intrusions in sediments of Kar roo age, or f rom the sediments themselves. There is no doubt t ha t the intrusions can be classified as Kar roo dolerites. These dolerites have been studied extensively b y Walker and Poldervaar t (1949).
Fig. 6
N
Directions of magnetization of the surface dolerites plotted stereograph]cally on the lower hemisphere.
• ----- Normal sense ; -~ : R e v e r s e d sense ; G : P r e s e n t field ; qb----axial dipole field.
(17/2 indicates the mean direct ion of magnetisation of specimens from sample 2 taken from locality 17.)
Th ey consider t ha t the S tormberg lavas were poured out towards the close of Triassic t ime and tha t the dolerites were more or less contem- poraneous wi th the lavas. Du Toi t (1954) remarks also t h a t there is an in t imate connect ion between the S tormberg basalts and the dolerites and concludes tha t the dolerites appear to have been in t ruded at the com- mencement of the Jurassic epoch.
Dow
nloa
ded
by [
Uni
vers
ity o
f G
lasg
ow]
at 1
0:04
21
Dec
embe
r 20
14
Palaeomagne$ic Measurements on Karroo Dolerites 159
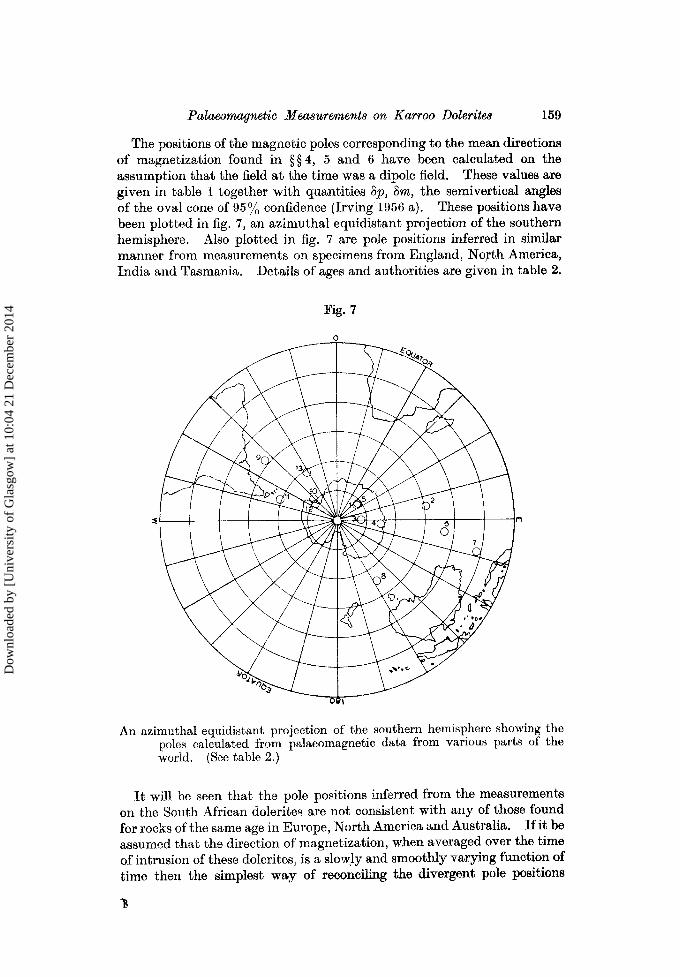
The positions of the magnetic poles corresponding to the mean directions of magnetization found in §§4, 5 and 6 have been calculated on the assumption that the field at the time was a dipole field. These values are given in table t together wi th quantities Sp, Sin, the semivertical angles of the oval cone of 95~o confidence (Irving 1956 a). These positions have been plotted in fig. 7, an azimuthal equidistant projection of the southern hemisphere. Also plotted in fig. 7 are pole positions inferred in similar manner from measurements on specimens from England, North America, India and Tasmania. Details of ages and authorities are given in table 2.
Fig. 7
o
An azimuthal equidistant projection of the southern hemisphere showing the poles calculated from palaeomagnetic data from various parts of the world. (See table 2.)
I t will be seen that the pole positions inferred from the measurements on the South African dolerite.~ are not consistent with any of those found for rocks of the same age in Europe, North America and Australia. I f it be assumed that the direction of magnetization, when averaged over the time of intrusion of these dolerites, is a slowly and smoothly varying function of time then the simplest way of reconciling the divergent pole positions
Dow
nloa
ded
by [
Uni
vers
ity o
f G
lasg
ow]
at 1
0:04
21
Dec
embe
r 20
14

160 K. W. T. Graham a n d A. L. Hales on
is to postulate relative displacement of the continents, i.e. Continental drift. I t is noteworthy that the displacements required are of the kind proposed by Wegener (1924), du Toit (1937), King (1953) and Carey (1955).
I t should be noted, however, that there is some evidence that the assumption of a slowly varying direction of magnetization is an over- simplification. Clegg et al. (1956), point out that the lavas from the Khandala region are younger than those from Linga. Since the Khandala measurements give a pole position nearer to India than do the Einga
Table 2
1. Winkelhaak upper sill--Jurassic. 2. Winkelhaak lower sill-~Iurassie. 3. Estcourt, reverse sense---Jurassic. 4. Estcourt, normal sense--Jurassic. 5. Surface collection--Jurassic. 6. Linga area, late Cretaceous to early Eocene, Clegg et al. (1956). 7. Khandala area, early Eocene, Clegg et al. (1956). 8. Tasmanian dolerite, probably Jurassic, Irving (1956 b). 9. Keuper marls, Triassic, Clegg et al. (1954).
10. Antrim lavas, Eocene, Hospers and Charlesworth (7954). l l . Arizona, Triassic, Runcorn (1955). 12. Colorado plateau, Cretaceous, Runcorn (1955). 13. Maryland, Triassic, J. W. Graham (1955).
measurements, this means that either the drift pattern was complicated, or that there was polar movement of some 20 degrees between the times of intrusion of the two series of lava flows. I t is interesting to note that the difference in the direction of magnetization of the reversed and normal South African dolerites is indicative of a fairly rapid movement of the pole or of the continent.
I t is clear that more accurately dated measurements covering a larger proportion of the stratigraphic column than are at present available are required in order to establish with certainty whether or not the present misfit of palaeomagnetic data is due to imperfect correlation. Only then will one be able to describe with any confidence the possible drift paths followed by the continents.
ACKNOWLEDGMENTS
It is with pleasure that we acknowledge our indebtedness to the many people who have assisted us in the work reported in this paper. Our thanks are due especially to Dr. Merle A. Tuve, Carnegie Institution of Washington, for the loan of the narrow band filters ; Dr. John W. Graham for much helpful advice on spinner magnetometers and palaeomagnetism generally; Mr. A. Frost, Consulting Geologist, Union Corporation and Mr. E. F. Marland and the staff of the Union Corporation Geo!ogy Depart- ment for the collection of the Winkelhaak samples ; Dr. F. C. Truter,
Dow
nloa
ded
by [
Uni
vers
ity o
f G
lasg
ow]
at 1
0:04
21
Dec
embe
r 20
14

Palaeomagnetic Measurements on Karroo Dolerites 161
Director Geological Survey, Dr. L. E. Kent and Mr. P. J. Smit for geo- logical information about the railway tunnel near Estcourt ; Mr. A. Goldstein, Chief Civil Engineer, South African Railways and Harbours, Messrs. Rand Earthworks Ltd., for permission to collect specimens in the tunnel ; The South African Council for Scientific and Industrial Research, for a grant for a research assistant ; Mr. R. Green, who made many of the measurements and Mr. J. A. Keiller and Mr. J. Magee of the Bernard Price Institute workshop who built the equipment.
REFERENCES
CAXEY, S. W., 1955, Pap. Roy. Soc. Tasm., 89, 255. CLEQG, J. A., ALMOND, M., and STUBRS, P. H. S., 1954, Phil. Mag., 45, 583. CLEGG, J .A. , D~UTSOI-I, R. E., and GRIFFITHS, D. H., 1956, Phil. Mag., 1~ 419. DU TOIT, A. L., 1937, Our Wandering Continents (Edinburgh : Oliver and Boyd). DU TOIT, A. L., 1939, Geology of South Africa (Edinburgh : Oliver and Boyd),
2nd Edition ; 1954, Ibid., 3rd Edition. FISHER, R. A., 1953, Proc. Roy. Soc. A, 217, 295. GOUGH, D. I., 1956, Mon. Not. Roy. Astr. Soc. Geophys. Suppl., 7, 196. G R ~ M , J. W., 1955, J. Geophys. Res., 60, 329. IRVING, E., 1956 a, Geofis. Pur. Appl., 33, 23 ; 1956 b, Pap. Roy, Soc. Tasm.,
90~ 157. HOSPERS, J., and CHARLESWORTH, H. A. K., 1954, Mon. Not. Roy. Astr. Soc.
Geophys. Su~,p., 7, 32. KinG, L. C., 1953, Bull. Amer. Ass. Pert. Geol., 37, 2163. RU~CORN, S. K., 1955, iVature, Lond., 176, 505. WALKER, F., and POLDERVAART, A., 1949, Bull. Geol. Soc. Amer., 69, 591. WEGENER, A., 1924, The Origin of Continents and Oceans (English Translation
by J. G. A. Skerl), London.
P.M. SUPPL.--APRIL 1957
Dow
nloa
ded
by [
Uni
vers
ity o
f G
lasg
ow]
at 1
0:04
21
Dec
embe
r 20
14