Embed Size (px)
Citation preview

Issue 1 July, 2013 Page 1 of 11
Pakistan Food Security Bulletin is produced by the Vulnerability Analysis and Mapping (VAM) Unit of the World Food Programme as a contribution to periodic food security monitoring in the country. This is the first issue of the bulletin and it is expected that such periodic bulletins will help provide information on the latest food security situation and provide a basis for evidence-based decisions for addressing food insecurity.
Highlights
With the harvest of staple crop wheat completed in May, the harvest has been fairly good with estimates suggesting a total national production of about 24 million metric tonnes (MMT), compared to 23.4 MMT last year.
Rising food prices, particularly of the main staple, continue to be a problem. Even though they have been somewhat stable in recent months, the prices of wheat and wheat flour in June 2013 were higher by 18 and 20 percent respectively, than the same time one year ago.
Food security of the poor households has suffered due to worsening of terms-of-trade caused by the rise in wheat prices while the wage rates have remained about the same. Amount of wheat flour which could be bought by an unskilled laborer with a day’s wage in June 2013 was 8% less than a year ago.
Populations displaced from FATA are particularly vulnerable to acute food insecurity, especially with the recent influx of displacements from Tirah valley and Kurram.
The rainfall pattern so far and available predictions indicate towards a normal monsoon season this year. The situation should be closely monitored for the likely floods in August-September in various parts of the country.
Situation Overview Overall, Pakistan is in a comfortable situation in terms of food supply and availability, particularly for the key staple food, due to the recent harvest of wheat, which is estimated to be slightly higher than the previous year. However, the problem of food insecurity in Pakistan these days is more of access to food of poor households, rather than of national production. Staple cereal prices have been rising significantly in Pakistan, even though the price of wheat remained stable for few months since March 2013. The wheat and wheat flour prices in June 2013 were higher by 18 and 20 percent respectively than a year ago, while the wage rates have remained about the same. Thus, the terms-of-trade for the poor households is lower than a year ago, even though there was indication of slight improvement in the past few months. Food insecurity of the Temporary Displaced Populations (TDPs) from various
agencies of FATA continues to be critical, particularly with the recent influx of additional TDPs from Tirah valley and Kurram agency to Peshawar and adjoining areas. Some 1.1 million TDPs continue to be in a state of vulnerability requiring life-saving humanitarian assistance. In the areas affected by the rain induced flood of September 2012, slight improvement was seen in most districts, due to a combination of humanitarian assistance (including food/and or cash for work) and household resilience. However, two districts were still classified in phase 4 of IPC as of March 2013, meaning affected populations in those areas continued to be under severe food insecurity. As the monsoon progresses the situation needs to be closely monitored for impact of likely floods in August-September period.
Fig
hti
ng
Hu
ng
er W
orl
dw
ide
Pakistan Food Security Bulletin Issue 1, July 2013
Food Distribution Photo: WFP\Amjad Jamal Vegetable Shop-Photo: WFP\Aman ur Rehman Khan Mutton and Poultry shop – Photo: WFP\Aman ur Rehman Khan Photo: WFP\Amjad Jamal

Issue 1 July, 2013 Page 2 of 11
Food Security Phase Classification Integrated Food Security Phase Classification (IPC) IPC is a methodology whereby stakeholders related to food security based on an agreed analytical framework using a list of agreed indicators and thresholds assign food security phases to different geographical units (or population groups) of a given country or area and present it as a snapshot of food security situation for the country or area. IPC was first initiated more than ten years ago and has now been used in many countries throughout the world in recent years. In Asia, Nepal has the most robust IPC-adapted food security monitoring system, called NeKSAP after its Nepali acronym, and has been in place since last five years. FAO and WFP implemented the pilot phase of IPC project in Pakistan from March 2012 until April 2013, under the funding from ECHO. This included awareness raising workshop at the national level as well as provinces, consultation workshops at various levels, IPC trainings, and workshops for analysis and development of outputs based on IPC. Two maps of acute food insecurity phase classification have been prepared – the first one in September 2012 and then in March 2013. The IPC initiative in Pakistan has been officially hosted by the Ministry of National Food Security and Research (MNFSR) while the technical working groups are co-chaired by National Disaster Management Authority (NDMA) and MNFSR. The project is now extended for another year and the plan is to have more rigorous analysis in the provinces in order to produce IPC maps utilizing more local level information. According to the IPC framework, there are five possible phases of food (in)security for a given area. These are phase 1 (Generally food secure or minimal food insecurity), phase 2 (Moderately/borderline food insecure or situation of stress), phase 3 (highly food insecure or crisis), phase 4 (severely food insecure or emergency), and phase 5 (humanitarian catastrophe).
Figure 1: Pilot IPC maps of acute food insecurity for September 2012 (top) and March 2013 (bottom) prepared by workshops of stakeholders.
Maps based on Integrated Food Security Phase Classification (IPC) provide a useful snapshot of periodic food security situation. Two maps produced from IPC analysis for acute food insecurity are presented, from March 2013 and September 2012. These maps were produced by experts from all the provinces representing Government organizations, UN agencies, NGOs and academia. A working group for each province made the analysis for a cluster of similar districts based on agro-ecological zones, socioeconomic level and occurrence of disaster. Analysis was done for each among a total of such 24 zones thus identified. The respective working groups made analysis for each of these zones using IPC based analytical framework and a list of 23 indicators (Annex I) for Pakistan, which were decided after a series of consultations in Islamabad and various provinces, involving participants from various Government agencies, UN, NGOs and academia. The outputs were then discussed in plenary so as to ensure consistency in methods across different areas and to make conclusion on phase classification. The output of these IPC analyses revealed the dynamic nature of food security situation which can change over time. This was particularly clear in the areas affected by the flood of September 2012. While there were 6 districts in phase 4 (emergency or severely food insecure) in end September, the analysis in March 2013 showed that four of these districts were no longer in phase 4, reflecting some improvement as a result of humanitarian assistance as well as resilience at the household/community level. However, two districts in Sindh (Jacobabad and Kashmore) were still in phase 4, signifying the vulnerability of the populations in those districts. Other areas with severe food insecurity included some districts in eastern Gilgit Baltistan (very poor access conditions), FATA (affected by the insecurity), western Balochistan (drought affected and poor food access) and eastern Sindh (desert areas with very high acute malnutrition rates). Most districts in Punjab, the food basket of the country, were found to be in phase 1, while other areas were in between phase 1 and various levels of food insecurity. Annex II provides a summary situation of the districts in phase 3 (highly food insecure) and phase 4 (severely food insecure). Overall, it has been found that high to severe food insecurity in Pakistan is mostly related to the occurrence of natural disasters and insecurity.

Issue 1 July, 2013 Page 3 of 11
74.6 %
15.7 %
6.7 % 3 %
Figure 2: Contribution to national Wheat Production by Province (MMT)
Punjab Sindh KP Balochistan
D.G
. Kh
an H
arve
st P
ho
to :
WFP
\Hir
a B
utt
Figure 3: Wheat Production Estimates by District 2012-13
1 Quoted in indexmundi http://www.indexmundi.com/agriculture/?country=pk&commodity=wheat&graph=production 2 PAK-SCMS Bulletin July 2013, Pakistan Space and Upper Atmosphere Research Commission (SUPARCO) 3 Based on provincial estimates from SUPARCO and WFP VAM estimates for population
Crops and Livestock production situation Crop Production Wheat, which is the main staple crop in the country, has been harvested in April-May. As per the Economic Survey of the Ministry of Finance, the total production estimates by the Ministry of Food Security and Research (MNFSR) for this year is 24.3 MMT. Similarly, the estimated wheat production, for the marketing year 2012-13 is 24 MMT as per the USDA estimates
1. This is about three percent higher
compared to the wheat production of 2012 and four percent lower to the bumper harvest of 2011, when the production was 25.2 MMT. The estimates from SUPARCO are slightly on the higher side (26.3 MMT).
Thus, it can be concluded that the production this year is likely to be slightly higher than the last year and considering the current estimated population, it may be just about adequate to meet the annual demand of this staple food, which is about 24 MMT. Production in 2011-12 was just about adequate to meet the consumption whereas it was in surplus by around 2.1 MMT in 2010-11. There is a significant geographic variation in production. As per the data from SUPARCO, Punjab accounts for about 75% of the total national production, followed by Sindh (16%)
2 as shown in
Figure 2. Average national yield per hectare has been estimated at 2.8 tons, with the highest in Punjab (2.94 tons per hectare), and the lowest in Balochistan (2.38 tons per hectare). Even though overall, there is a fairly comfortable situation in terms of national wheat production, there are also areas with relatively poor production situation. Looking at the average production per capita by province, the situation in Punjab is very good with an estimated 196 Kg per person, and the lowest is in KP with only 71 Kg per person (Table 1)
3.
Table 1: Estimated wheat production per capita (2013) by provinces
Provinces Per Capita Production (KGs)
Punjab 196.26
Sindh 93.69
KP 71.00
Balochistan 83.20
Pakistan 147.53
Figure 3 shows the estimated average per capita production of wheat by district. This is prepared by using estimated production data from SUPARCO based on analysis of satellite data and further interpolation in some districts by WFP VAM, and population estimates by WFP VAM. It shows that in spite of overall good situation, there are many districts, particularly in KP, Balochistan, and Sindh where production is not adequate for the populations.
Initiative for National Food Security Policy and Zero Hunger Programme
After the first national workshop on Food Security organized by the Ministry of National Food Security and Research (MNFSR) also supported by WFP and FAO, the Government of Pakistan announced a national zero hunger programme with an aim to improve food security and nutrition situation in the country. A Pakistan-Brazil seminar on food security and poverty alleviation was organized in December by the MNFSR in collaboration with the Embassy of Brazil, WFP and FAO. This has been followed by consultation on the draft national food security policy document which is now being finalized by the MNFSR. WFP and MNFSR continue to collaborate on this important work together with FAO and other stakeholders in order to help achieve food security in Pakistan. The continued collaboration between WFP and MNFSR has also resulted in significant wheat contribution from the GOP, which is used by WFP to assist the food insecure populations.

Issue 1 July, 2013 Page 4 of 11
0.00
5.00
10.00
15.00
20.00
25.00
30.00
20
02
20
03
20
04
20
05
20
06
20
07
20
08
20
09
20
10
20
11
20
12
20
13
Production Consumption
Figure 4: Wheat Production vs. consumption
0
20
40
60
80
100
PK
R P
ER K
G
Fig. 5 a): Cereal Prices (May 12-June 13)
Wheat Wheat Flour
Rice-irr-6 Rice Basmati Broken
Figure 4 shows the trends of wheat production versus consumption for the past ten years, considering the estimated production of 24.3 MMT and projected consumption figure for 2013.
Even though it is premature to make predictions for Kharif crops, the rainfall situation so far suggests towards a normal Kharif crop in the country.
Livestock situation Livestock is the second main source of livelihood for many rural households in Pakistan. Even though no data were available on the latest supply situation of livestock, recent trends of market prices suggest a normal situation. The prices of mutton and beef have shown only marginal increase since the beginning of 2013, while compared to a year ago these prices in May were higher by seven and six percent respectively. The price of livestock products and animals has been increasing in recent years, mainly attributed to the export of live animals or meat to the Middle-East and Afghanistan. The prices have somehow stabilized after the government imposed a ban on the export of livestock (live animal and meat) to Afghanistan mid-2012. Pakistan’s national livestock herd size was estimated at 165.7 million heads during 2012-13, compared to 161.1 million during 2011-12, suggesting an annual growth of 3 percent. Livestock sector’s contribution towards agriculture value-added and national GDP during 2012-13 were calculated at 55.4 and 11.9 percent respectively. Thus livestock sector has a significant role towards both national economy and food security, especially of small farming communities, who rely to a great extent on livestock resource for their daily dietary needs such as milk and cash income, and for that matter their food security. The milk & meat production in Pakistan has increased by 3.2 and 4.5 percent during 2012-13 compared to the previous year, suggesting better prospects for national economy and wellbeing of livestock farming communities. Table 2 shows the trends in livestock-based food consumption in Pakistan over last three years.
Table 2: Trends of livestock-based food consumption
Milk Consumption (000
tonnes)
Meat Consumption (000 tonnes)
Beef Mutton
2010-11 36656 1711 616
2011-12 37861 1769 629
2012-13 39105 1829 643
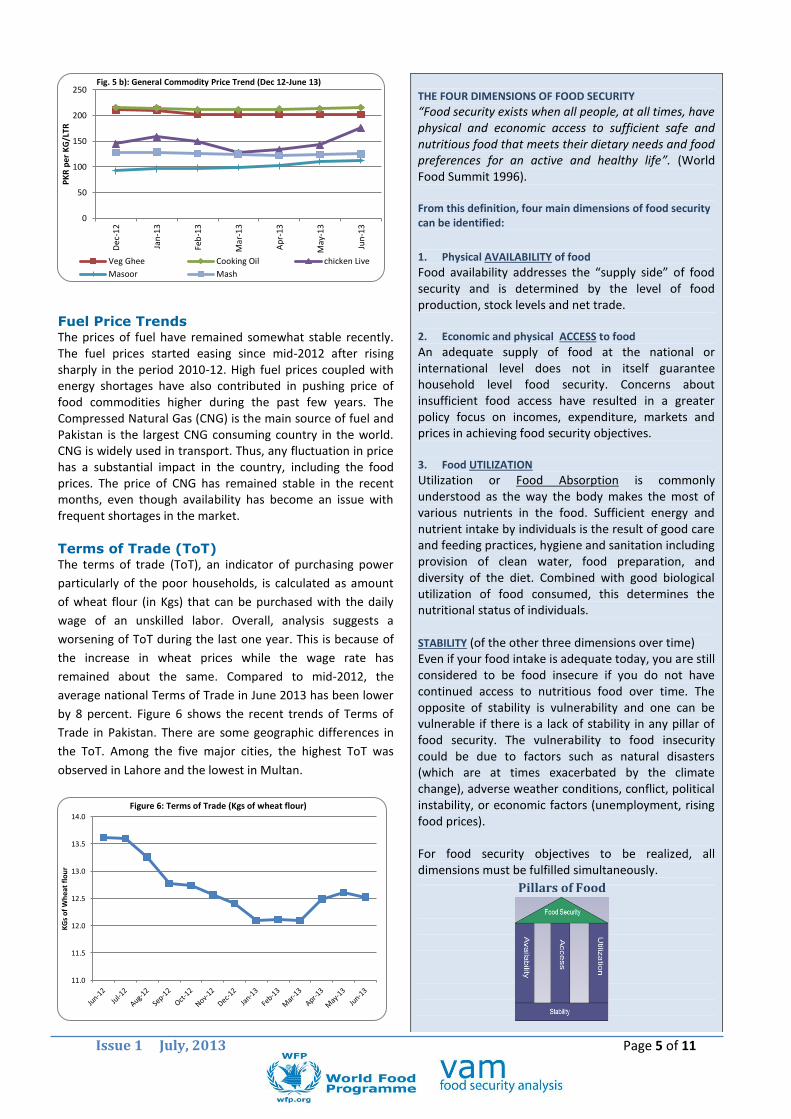
Market and food prices The price of wheat, the main staple cereal, has been rising significantly in Pakistan, even though it remained somewhat stable for few months since March 2013. In November (2012) the Government increased the wheat support price to Rs.1,200 per 40 kg against previous price of Rs. 1,050 per 40 kg. Subsequently, the retail prices of wheat and wheat flour rose further and recorded an all-time high in February-March 2013. After the prices remained stable for a few months, they have again started rising since May. Compared to six months ago, prices of wheat and wheat flour in June 2013 were thus higher by six and nine percent respectively. However, compared to the same time last year, these prices were higher by 18 and 20 percent respectively. Such a significant rise in prices has had an adverse impact on the poor population groups with low income level. On the other hand, most non-cereal essential food commodities have shown marginal to significant fluctuations in prices during the last six months. Compared to December 2012, the prices of lentil (masoor and moong) in June 2013 were higher by 22 and 11 percent respectively, while that of dal Mash declined by a nominal two percent. The prices of poultry products had reached to their highest levels in 2012 due to their growing demand and limited supply. The prices started easing after the government imposed a ban on the export of livestock and poultry products (live animal and meat) to Afghanistan in mid-2012. However, a sharp increase was noticed again towards the end of the last year. Compared to December 2012, the price of eggs in June 2013 was lower by a whopping 36 percent while that of chicken increased by 22 percent during the same period. Figure 5 gives an idea on the recent trends of key commodity prices.
Issue 1 July, 2013 Page 5 of 11
Fuel Price Trends The prices of fuel have remained somewhat stable recently. The fuel prices started easing since mid-2012 after rising sharply in the period 2010-12. High fuel prices coupled with energy shortages have also contributed in pushing price of food commodities higher during the past few years. The Compressed Natural Gas (CNG) is the main source of fuel and Pakistan is the largest CNG consuming country in the world. CNG is widely used in transport. Thus, any fluctuation in price has a substantial impact in the country, including the food prices. The price of CNG has remained stable in the recent months, even though availability has become an issue with frequent shortages in the market.
Terms of Trade (ToT) The terms of trade (ToT), an indicator of purchasing power
particularly of the poor households, is calculated as amount
of wheat flour (in Kgs) that can be purchased with the daily
wage of an unskilled labor. Overall, analysis suggests a
worsening of ToT during the last one year. This is because of
the increase in wheat prices while the wage rate has
remained about the same. Compared to mid-2012, the
average national Terms of Trade in June 2013 has been lower
by 8 percent. Figure 6 shows the recent trends of Terms of
Trade in Pakistan. There are some geographic differences in
the ToT. Among the five major cities, the highest ToT was
observed in Lahore and the lowest in Multan.
THE FOUR DIMENSIONS OF FOOD SECURITY
“Food security exists when all people, at all times, have physical and economic access to sufficient safe and nutritious food that meets their dietary needs and food preferences for an active and healthy life”. (World Food Summit 1996). From this definition, four main dimensions of food security can be identified:
1. Physical AVAILABILITY of food
Food availability addresses the “supply side” of food security and is determined by the level of food production, stock levels and net trade. 2. Economic and physical ACCESS to food
An adequate supply of food at the national or international level does not in itself guarantee household level food security. Concerns about insufficient food access have resulted in a greater policy focus on incomes, expenditure, markets and prices in achieving food security objectives. 3. Food UTILIZATION
Utilization or Food Absorption is commonly understood as the way the body makes the most of various nutrients in the food. Sufficient energy and nutrient intake by individuals is the result of good care and feeding practices, hygiene and sanitation including provision of clean water, food preparation, and diversity of the diet. Combined with good biological utilization of food consumed, this determines the nutritional status of individuals. STABILITY (of the other three dimensions over time) Even if your food intake is adequate today, you are still considered to be food insecure if you do not have continued access to nutritious food over time. The opposite of stability is vulnerability and one can be vulnerable if there is a lack of stability in any pillar of food security. The vulnerability to food insecurity could be due to factors such as natural disasters (which are at times exacerbated by the climate change), adverse weather conditions, conflict, political instability, or economic factors (unemployment, rising food prices). For food security objectives to be realized, all dimensions must be fulfilled simultaneously.
11.0
11.5
12.0
12.5
13.0
13.5
14.0
KG
s o
f W
hea
t fl
ou
r
Figure 6: Terms of Trade (Kgs of wheat flour)
Pillars of Food Security
0
50
100
150
200
250
Dec
-12
Jan
-13
Feb
-13
Mar
-13
Ap
r-1
3
May
-13
Jun
-13
PK
R p
er K
G/L
TR
Fig. 5 b): General Commodity Price Trend (Dec 12-June 13)
Veg Ghee Cooking Oil chicken Live
Masoor Mash
Issue 1 July, 2013 Page 6 of 11
IPD
s C
amp
Ph
oto
: W
FP\A
mja
d J
amal
Recent Assessment on Displaced Populations A significant population in Pakistan is affected by the past and ongoing insecurity in different parts of the country, particularly KP and FATA. These Temporarily Displaced Populations (TDPs) are highly vulnerable and often face high to severe food insecurity. WFP is currently assisting approximately 1.1 million TDPs in Pakistan.
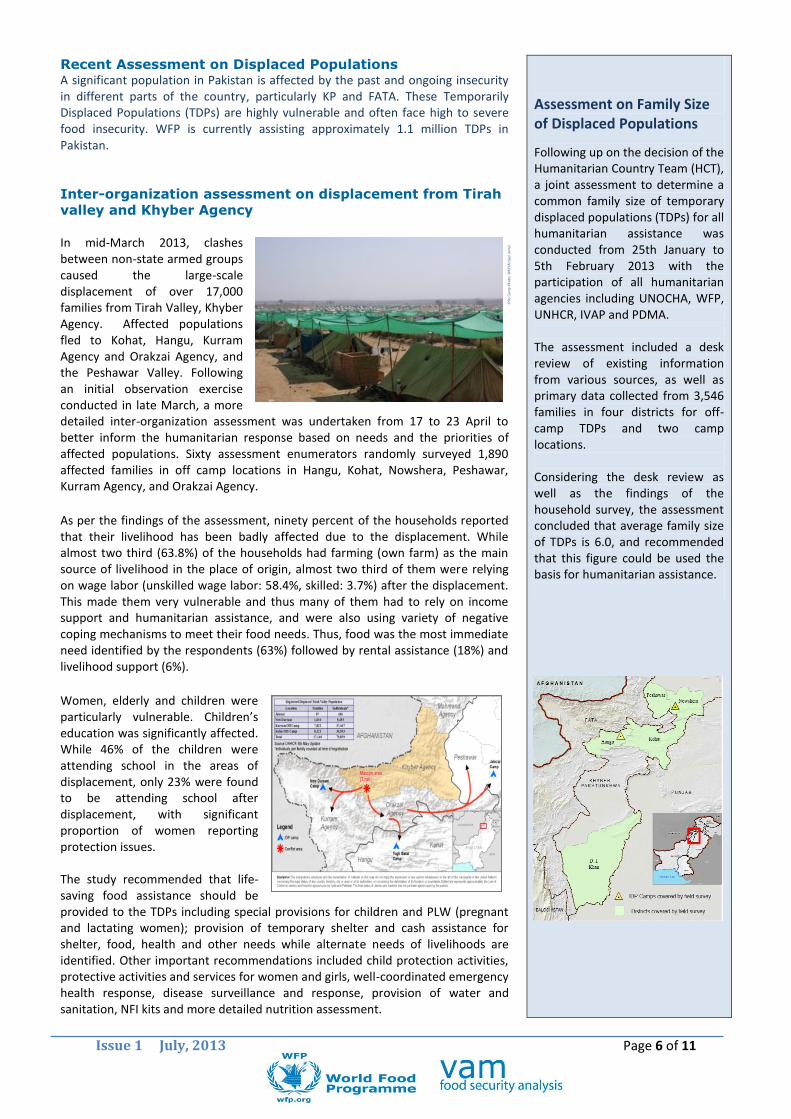
Inter-organization assessment on displacement from Tirah
valley and Khyber Agency
In mid-March 2013, clashes between non-state armed groups caused the large-scale displacement of over 17,000 families from Tirah Valley, Khyber Agency. Affected populations fled to Kohat, Hangu, Kurram Agency and Orakzai Agency, and the Peshawar Valley. Following an initial observation exercise conducted in late March, a more detailed inter-organization assessment was undertaken from 17 to 23 April to better inform the humanitarian response based on needs and the priorities of affected populations. Sixty assessment enumerators randomly surveyed 1,890 affected families in off camp locations in Hangu, Kohat, Nowshera, Peshawar, Kurram Agency, and Orakzai Agency.
As per the findings of the assessment, ninety percent of the households reported that their livelihood has been badly affected due to the displacement. While almost two third (63.8%) of the households had farming (own farm) as the main source of livelihood in the place of origin, almost two third of them were relying on wage labor (unskilled wage labor: 58.4%, skilled: 3.7%) after the displacement. This made them very vulnerable and thus many of them had to rely on income support and humanitarian assistance, and were also using variety of negative coping mechanisms to meet their food needs. Thus, food was the most immediate need identified by the respondents (63%) followed by rental assistance (18%) and livelihood support (6%).
Women, elderly and children were particularly vulnerable. Children’s education was significantly affected. While 46% of the children were attending school in the areas of displacement, only 23% were found to be attending school after displacement, with significant proportion of women reporting protection issues. The study recommended that life-saving food assistance should be provided to the TDPs including special provisions for children and PLW (pregnant and lactating women); provision of temporary shelter and cash assistance for shelter, food, health and other needs while alternate needs of livelihoods are identified. Other important recommendations included child protection activities, protective activities and services for women and girls, well-coordinated emergency health response, disease surveillance and response, provision of water and sanitation, NFI kits and more detailed nutrition assessment.
Assessment on Family Size of Displaced Populations
Following up on the decision of the Humanitarian Country Team (HCT), a joint assessment to determine a common family size of temporary displaced populations (TDPs) for all humanitarian assistance was conducted from 25th January to 5th February 2013 with the participation of all humanitarian agencies including UNOCHA, WFP, UNHCR, IVAP and PDMA. The assessment included a desk review of existing information from various sources, as well as primary data collected from 3,546 families in four districts for off-camp TDPs and two camp locations. Considering the desk review as well as the findings of the household survey, the assessment concluded that average family size of TDPs is 6.0, and recommended that this figure could be used the basis for humanitarian assistance.

Issue 1 July, 2013 Page 7 of 11
Livelihood Recovery Appraisal
FAO and WFP jointly released the publication on Livelihood Recovery Appraisal of Households Affected by Flooding in 2010 and 2011 in Sindh and Balochistan, conducted by the food security cluster. The main objective was to evaluate the extent of recovery of households in terms of livelihoods and food security and to provide recommendations based on the findings. A total of 7,540 households were surveyed in September 2012 in the twenty one districts affected by one or both of these floods.
The findings suggest that households are living in an environment of complex and multi-faceted vulnerability, which has a negative impact on their ability to withstand and recover from major flood events. The most common recovery activities undertaken by households included house repair, participation in community activities, cleaning irrigation channels, cleaning/leveling land and improving flood protection. However, most households have still not recovered from the shock and are still vulnerable.
Only 20.2 percent of the households were found to be with acceptable food consumption. 9.1 percent of the households have poor food consumption, while a great proportion (71 percent) falls under borderline. Compared to June/July 2011 when the Detailed Livelihood Appraisal
(DLA) was conducted, it was found that while the proportion of households with poor food consumption had decreased somewhat, there was significant increase in percentage of households under borderline category (58 to 71 percent), indicating that many households under acceptable group slipped down to the borderline with high risk of vulnerability due to multiple shocks. Households have to depend on markets to meet most of their food needs. Even for wheat (the staple food), households had to rely on markets for almost two thirds of their needs. For other food items like vegetable, pulses and oil, the dependence on market is much higher. Such a high dependence on market can explain the vulnerability of these households to increase in prices. This should be a consideration in designing cash and/or food interventions in addressing food security needs. Food insecurity was significantly higher in the affected areas of Sindh than those in Balochistan. Female-headed households were found to be more food insecure than the male headed houses. In terms of livelihood groups, those dependent on daily wage labor were found to be most food insecure. Analysis based on measurement of Mid-upper Arm circumference (MUAC) showed the serious situation of acute malnutrition. Overall, 18.7% of the children under the age of five were found to be facing moderate to severe acute malnutrition (6.4% with severe and 12.3% under moderate acute malnutrition). Building materials, cash grants and food assistance were widely perceived as the most pressing needs by the surveyed households. For a continued livelihood recovery for communities, action is recommended in five priority support areas: i) increase household access to cash to support basic needs, increase employment and reduce reliance on debt, ii) agriculture sector support to replenish depleted livestock, repair irrigation and increase agricultural production, iii) targeted food and nutrition interventions for vulnerable population groups, iv) support house rebuilding, v) improve livelihood recovery programme delivery and targeting, and vi) increase the resilience of flood-prone communities. The publication in hardcopy is available from FAO or WFP-VAM, and the PDF version can also be downloaded from:
http://www.fao.org/fileadmin/user_upload/emergencie
s/docs/Livelihood%20Recovery%20Appraisal.pdf

Issue 1 July, 2013 Page 8 of 11
Rainfall situation and Outlook According to quarterly predictions for July-September 2013 by the Pakistan Metrological Department (PMD) this year’s Monsoon rains are likely to be Normal (± 10 % of long period average), which means that the overall availability of water in the country from Monsoon rains would be satisfactory. However, it says that erratic spread of Monsoon on temporal and spatial scale is likely to be a prevalent feature. As per the seasonal outlook from the PMD, after the onset of monsoon in the last week of June, the rainfall in July is likely to be below normal and will increase during August over central parts of the country. Also, there is likelihood of more than normal rainfall in September in plain monsoonal areas of Sindh and Punjab. Thus there is a likelihood of floods which could begin sometime in August and could cover larger areas by September with a combination of flash floods in some areas and the accumulation of rains causing floods in low lying areas of Punjab, Sindh and Balochistan.
Food Security Outlook Estimates suggest that total national wheat production is likely to be about 24 MMT in the marketing year 2012-13, which is slightly higher than the 23.2 million MT produced in the previous year. Thus overall, the supply situation is likely to be fairly good. However, there is no indication of any improvement in the food security at the household level, particularly for the poor. With the increase of wheat support price for the new harvest by the Government, wheat price is not likely to decrease. Rather, it is more likely to continue rising after a short period of stable prices right after the harvest. Thus it will put further pressure on the food insecurity of the poor, which should be closely watched vis-à-vis the market price and any change in wage rates. According to the forecast, rainfall is likely to be normal in this monsoon season with increasing rains in August and September. Given the history of floods in recent years, and given that several million populations were affected by floods even in 2012 when the total rainfall was projected to be less than the normal monsoon average, it is likely that floods may occur in August and particularly with more impact in September. Thus situation should be closely monitored for any occurrence of such floods which could suddenly push the affected populations into a very vulnerable situation requiring humanitarian response.
Can food security be achieved by cash and/or vouchers? Feasibility of cash and vouchers assistance to support household food security. A study in eleven districts of Sindh, Balochistan and KP.
WFP recently completed this comprehensive study conducted to assess the feasibility of cash and voucher assistance for addressing household food security. The districts covered by the study include Jaffarabad and Naseerabad in Balochistan province; Jacobabad, Kashmore, Shikarpur, Mirpurkhas, Badin, Tharparkar and Umarkot in Sindh; and Peshawar and Swat in KP. The study involved survey of 2,200 households to understand the household food security situation including the consumption pattern, source of food, use of markets to meet household food demand etc.; traders’ survey to understand the trader’s capacity and market supply and demand situation; and market mapping and profiling to understand the market network and connectivity. The study found that the districts had moderate to high degree of food insecurity and two thirds of the populations facing good insecurity were not consuming both adequate calories and minimum protein requirements. In average, it was found that about 83 percent of the household cereal consumption came from the markets. Markets were generally well integrated with traders able to manage the household demand for food. Thus it was found that overall the conditions were conducive for cash and/or voucher intervention to support household food security. However, there was geographic variation in degree of feasibility between and even within districts depending on the level of food insecurity, market conditions, security situation and the infrastructure for cash/voucher transaction. The full report is available from WFP VAM unit in Pakistan or from the website http://vam.wfp.org.pk
Cas
h f
or
Wo
rk P
ho
to:
WFP
\Am
jad
Jam
al
Issue 1 July, 2013 Page 9 of 11
Update on Report on Food Security and Nutrition 2013
With request from the Ministry of Food Security and Research (MNFSR), WFP and SDPI in collaboration with FAO and UNICEF, have been conducting a study with an aim to produce a Report on Food Security and Nutrition in Pakistan. This is expected to provide a comprehensive analysis of the latest situation of food security and nutrition in Pakistan, which is believed to be important basis for policy and programmes for food security and nutrition in the country. Prior to this, WFP and SDPI had prepared a similar report in 2009, which was also supported by Swiss Development Cooperation (SDC). The preliminary analysis have been made based on secondary data collected from districts and provinces, and the full report is expected to be completed sometime in the year 2013.
Pakistan Education Atlas 2012
Educating children is one of the most effective ways in achieving long term food security in a country. Academy of Educational Planning and Management (AEPAM) of the Ministry of Education and Training and WFP-VAM recently published the Pakistan Education Atlas 2012. The atlas, officially released by Mr. Shiekh Waqas Akram, Honorable Federal Minister for Education and Training on 06 March 2013, contains district wise indicators of education including enrolment rates, gender parity, school infrastructure, etc., and is expected to be important reference material for educational planning in the country. In addition, Prior to this, the first education atlas was published in 2010. Currently work is underway for the education atlas 2013, including updated information on various indicators related to education in the country and also having the information at the sub-district level, possibly at the Union Council level in order to have finer details helpful for planning. The hard copy version of the atlas as well as digital version on CD is available from AEPAM or WFP-VAM, and the online version can be accessed at http://www.atlas.edu.pk
For further information and feedback: Vulnerability Analysis and Mapping Unit
UN World Food Programme, Islamabad, Pakistan. [email protected]

Issue 1 July, 2013 Page 10 of 11
Annex I: Provisional IPC Reference Indicators and Thresholds for Pakistan
Source : IPC workshops held in Bhurban in September 2012 and March 2013.
Pakistan: IPC Reference Indicators and Thresholds Reference indicators Phase 1 Phase 2 Phase 3 Phase 4 Phase 5 Remarks
Generally food secure Moderately/borderline food insecure
Highly food insecure (crisis)
Severely food insecure (emergency)
Humanitarian catastrophe
Availability 1 Crop production situation (2 major crops from wheat, rice, maize, pulse, potato, vegetable)
Normal or up to 10% less than normal
10-30% less than normal
30-60% less than normal
60-80% less than normal
More than 80% less than normal
Normal yield based on 5-year average (or discuss whether it should be per capita)
2 Livestock product (milk and meat)
Same or higher than last year
Up to 10% lower than last year
Up to 10-20% lower than last year
Up to 20-50% lower than last year
Up to 50% lower than last year
3 Overall stock (per capita)
Same or higher than last year
Up to 10% lower than last year
Up to 10-20% lower than last year
Up to 20-50% lower than last year
Up to 50% lower than last year
Food Access 4 Price of wheat Less or up to 5% more than last year
5-20% more than last year
20-30% more than last year
30-50% more than last year
>50% than last year
5 Price of rice Less or up to 5% more than last year
5-20% more than last year
20-30% more than last year
30-50% more than last year
>50% than last year
6 Cash crop (fruits, vegetables, herbs, etc.)
Increasing or Normal or up to 5% less than normal
5-20% less than normal 20-50% less than normal
50-80% less than normal
>80% less than normal
7 Daily wage rate Same or higher than last year
Up to 10% lower than last year
Up to 10-20% lower than last year
Up to 20-50% lower than last year
Up to 50% lower than last year
8 Employment opportunities
Adequate or normal 10-20% less than normal
20-30% less than normal
30-50% less than normal
>50% less than normal
Utilization 9 Percentage of HHs with access to safe drinking water
90% 80 – 90% 60-80% 40-60% < 40%
10 Disease No significant cases of disease
Significant cases of diseases, under control
Epidemic outbreak
Pandemic outbreak
Pandemic outbreak
11 Female school attendance rate
Normal or increase Decreased by up to 10% Decrease by 10-20%
Decrease by 20 – 40%
Decrease by more than 40%
12 Percentage of households with access to toilet
90% 80 – 90% 60-80% 40-60% < 40% May need to change cut off
Vulnerability 13 Out-migration (food security related)
Same or less than last year
Up to 10% higher than last year
10-20% higher than last year
20-50% higher than last year
More than 50% higher than last year
14 Crime rate To be discussed further.
15 Damages due to natural disaster
None or up to 10% loss of food stock and assets
10-30% loss of food stock and assets
30-50% loss of food stock and assets, causing human casualties
>50% loss of food stock and assets, causing human casualties
Large scale devastating natural disasters (eg. Earthquake) causing complete destruction, significant human casualties, displacement
Assets include land, agricultural tools, cattle, houses
16 Conflict/civil unrest: no. of days with strikes and/or security incidences per month
Generally peaceful situation (less than 2 days per month)
Some restriction in movement due to security situation (2-5 days per month)
Movement restricted (5-10 days per month)
Serious restriction in movement (>10 days per month)
High intensity conflict situation, displacement
Nutrition and mortality
17 Immunization Depends on data
18 Wasting/GAM rates
If available (review data needs)
19 IMR/CDR If available
Livelihood change
20 Livestock Holdings per capita
Thresholds to be discussed.
Other desired indicators
21 Food consumption score
WFP VAM ?
22 Household food stock (rural)
More than 2 months 1-2 months 15 days – 1 month
< 15 days No stock at all WFP VAM (in future)
23 Coping strategies Normal coping strategies
Reversible coping strategies (borrowing food, eating less quality food etc)
Some irreversible coping strategies
High level of irreversible coping strategies
No more coping mechanism, displacement, starvation and death
WFP VAM (in future)

Issue 1 July, 2013 Page 11 of 11
Annex II : Summary of districts with high to severe food insecurity (IPC phase 3 and 4)
in March 2013
Source : IPC workshop held in Bhurban in March 2013.
Province District Causes
Districts in Phase 4 (severe food insecurity)
Sindh Jacobabad, Kashmor, Umerkot, Kamber and Tharparkar.
In the desert districts of Umerkot and Tharpakar, the available data suggested acute malnutrition in children under five as high as 47%. There is limited access to safe drinking water and livelihood challenges in these districts. Jacobabad and Kashmor are flood affected districts with damage of livelihood including crops and agriculture, and damage to assets including public and private infrastructure.
FATA North and South Waziristan Populations affected by insecurity in these agencies were found in the highest levels of acute food insecurity situation due to poor food availability, access and/or utilization.
Gilgit/Baltistan Skardu, Ghanche and Astor. Very poor access situation in these remote mountains districts with limited infrastructure and income.
Balochistan Noushki, Chagai, Kharan, Panjgur and Washuk.
Food scarcity due to little availability of water coupled with long drought periods, in an area where a vast majority of population is living below the poverty line with little access to food
Kashmir Neelum At least 43% of the population facing deficit in terms of balanced dietary intake, production, accessibility and basic facilities.
Districts in Phase III (high food insecurity)
Sindh
Ghotki, Kharipur, Qambar Shahdad Kot, Thatta, Badin, Jamshoro, Sanghar, Sukkur, Hyderabad, Shaheed Benazirabad, Naushero Feroze, Dadu, Matiyari, Tando Allahyar, Tando Muhammad Khan, Larkana, & Shikarpur.
High food prices were a major limiting factor for food security of the impoverished populations in these districts. Food utilization situation has also been very poor with a very low percentage (<20%) of the population having access to safe drinking water. This is also the area highly affected by 2010 floods..
Punjab
Dera Ghazi Khan, Rajanpur, Jhang, Layyah, Muzaffargarh and Rahim Yar Khan were under Phase 3.
Populations in these flood affected districts have a low coping capacity due to loss of livelihood assets, and have a poor nutritional status and high mortality. Also, the damages caused by the floods negatively affected food availability.
Gilgit Baltistan Diamer, Gilgit and Ghizer
Very poor access situation in these snow covered hilly terrain where people are impoverished with little income and very low land holding
Balochistan
Jhal Magsi, Dera Bugti, Barkhan, Musa Khel, Sherani, Lasbella, Awaran, Gawadar, Turbat, Naseerabad and Jaffarabad.
Limited access to food with almost 70 % of the population living below the poverty line
KPK Chitral, Upper Dir, Kohistan and Shangla (high hilly areas) .
Limited access to food due to low income and small land holding, poor nutrition situation with high IMR and prevalence of diseases, poor food utilization due to high illiteracy and poor access to safe water and sanitation, holdings.
FATA Bajur, Muhmand, Khyber, Orakzai and Kuram agencies
Poor access to food due to very poor socio-economic conditions, low local production, physical remoteness and insecurity. It is one of the poorest areas of the country. High mortality rates (CMR and IMR)