Embed Size (px)
Citation preview

Paint Industry – India
February 2015

2 PAINT INDUSTRY IN INDIA 2015. PPT
Executive Summary
Market
The paint industry in India was estimated to be valued at around INR x bn and is expected to attain a CAGR of about xx% to reach INR y bn by 2018
In 2013, decorative paints accounted for about aa% of the overall market
The overall decorative paint segment is price sensitive, whereas the industrial paint segment is heavily technology oriented
Drivers & Challenges
Competition
Drivers – Growth in Real-estate Construction – Growth in Automotive Industry – Increase in Disposable Income – Increased Government Expenditure
on Infrastructure – Growth in Industrial Sector – Low Penetration
Challenges
– Increase in input prices
– Stringent environmental regulations
Major Players
Company A Company B Company C
Company D Company E Company F
Color experimentation
Customer participation with value added services
Environment friendly paint
Trends
New trademarks and patents flood the sector
Increasing demand for emulsions
Small size packs

3 PAINT INDUSTRY IN INDIA 2015. PPT
•Macro Economic Indicators
•Introduction
•Market Overview
•Import-Export
•Drivers & Challenges
•Trends
•Competition
•Strategic Recommendations
•Appendix

4
Economic Indicators (-/-)
GDP at Factor Cost: Quarterly
Inflation Rate: Monthly
11
12
13
14
15
INR tn
Q4
c4
d2 c2
b2 a2
Q1
d1 b4
a4
Q3
c3
b3
a3
Q2
c1
b1
a1
2013-14 2012-13 2011-12 2010-11
0.0
0.5
1.0
1.5
2.0
%
Oct 2013 - Nov 2013
t
Sep 2013 - Oct 2013
s
Aug 2013 - Sep 2013
r
Jul 2013 - Aug 2013
q
Jun 2013 - Jul 2013
p
PAINT INDUSTRY IN INDIA 2015. PPT

5 PAINT INDUSTRY IN INDIA 2015. PPT
Indian paints industry has been successful in registering double digit growth figures
Paints Industry India – Overview
Paints Industry India – Market Size Paints Industry India – Segmentation (2013)
0
100
200
300
400
500
600
INR bn
X
2018e
a6
2017e
a5
2016e
a4
2015e
a3
2014e
a2
2013
a1
X
Y
YY XX
• The Indian paints market is poised to grow at a steady CAGR of about xx% during 2013 – 18, wherein the decorative paints segment will continue to dominate the overall market
Currently, about x% of the overall market is dominated by the decorative paints segment, wherein the demand for such paints mainly arises from household paintings, architectural and other display purposes – The demand curve reaches its peak during the festive season in India
The remaining market comprises mainly of the industrial paints, wherein the demand comes mostly from automotive engineering and consumer durable segments
• The overall decorative paint segment is price sensitive, whereas the industrial paint segment is heavily technology oriented

6 PAINT INDUSTRY IN INDIA 2015. PPT
Paint Industry – Supply Chain
• X
Decorative Products: XX
• XX • XX • XX • XX
Major Inputs Major Products End User
• X
• X
Industrial Products:
XX
• XX • XX • XX • XX

7 PAINT INDUSTRY IN INDIA 2015. PPT
Sales and distribution channels that organizations have established towards maximizing revenues
X
Dealers Modern Retail Format
• XX
• XX
• XX
• XX
• XX
• XX
• XX
• XX
• XX
• XX
• XX
• XX
XX
8 PAINT INDUSTRY IN INDIA 2015. PPT
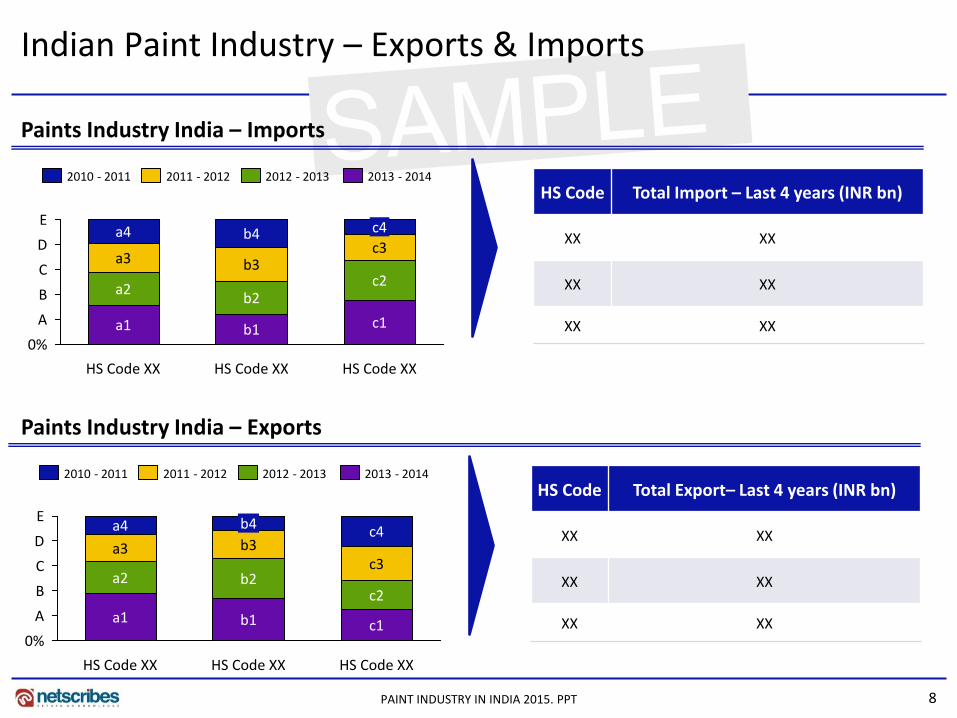
Indian Paint Industry – Exports & Imports
E
D
C
B
A
0%
HS Code XX
c1
c2
c3
c4
HS Code XX
b1
b2
b3
b4
HS Code XX
a1
a2
a3
a4
2013 - 2014 2012 - 2013 2011 - 2012 2010 - 2011
Paints Industry India – Imports
HS Code Total Import – Last 4 years (INR bn)
XX XX
XX XX
XX XX
E
D
C
B
A
0%
HS Code XX
c1
c2
c3
c4
HS Code XX
b1
b2
b3
b4
HS Code XX
a1
a2
a3
a4
2013 - 2014 2012 - 2013 2011 - 2012 2010 - 2011
Paints Industry India – Exports
HS Code Total Export– Last 4 years (INR bn)
XX XX
XX XX
XX XX

9 PAINT INDUSTRY IN INDIA 2015. PPT
Boom in Indian real estate sector, specifically housing, has been a key driver for growth of decorative paint
• XX
• XX
• XX
• XX
• XX
• XX
• XX
Growth in Real - estate Construction Impact
Real - estate Market – Segregation Real - estate Market – Size & Growth
Real-estate
Residential
• XX • XX • XX
Commercial
• XX • XX • XX
C
B
A
0
INR tn
X
2018e
a6
2017e
a5
2016e
a4
2015e
a3
2014e
a2
2013
a1
10
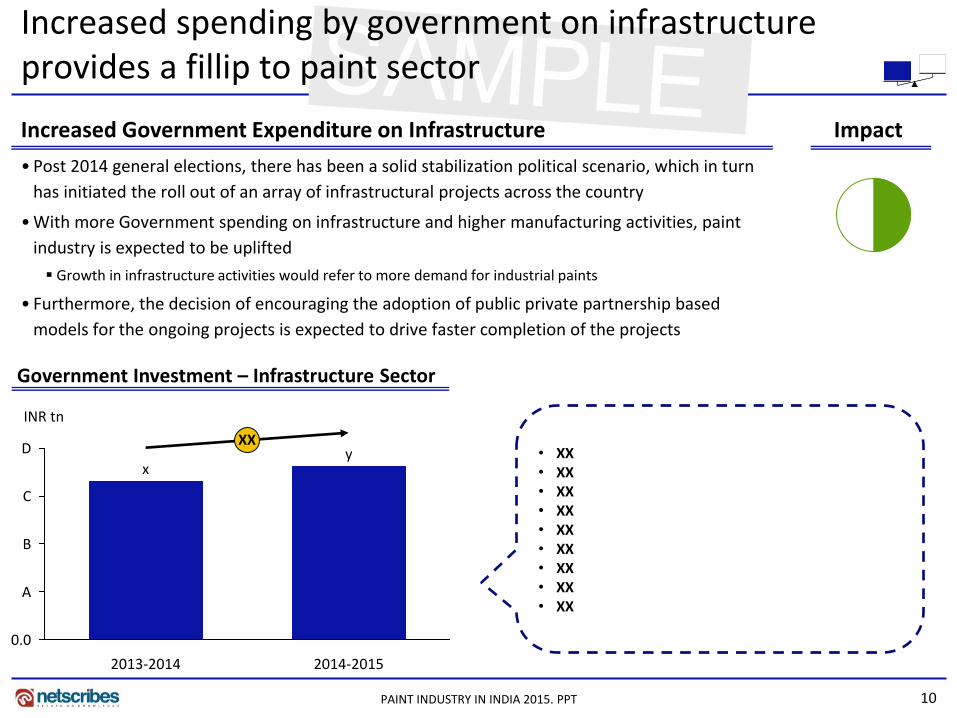
Increased spending by government on infrastructure provides a fillip to paint sector
• Post 2014 general elections, there has been a solid stabilization political scenario, which in turn
has initiated the roll out of an array of infrastructural projects across the country
• With more Government spending on infrastructure and higher manufacturing activities, paint
industry is expected to be uplifted
Growth in infrastructure activities would refer to more demand for industrial paints
• Furthermore, the decision of encouraging the adoption of public private partnership based
models for the ongoing projects is expected to drive faster completion of the projects
Increased Government Expenditure on Infrastructure Impact
PAINT INDUSTRY IN INDIA 2015. PPT
Government Investment – Infrastructure Sector
D
C
B
A
0.0
INR tn
XX
2014-2015
y
2013-2014
x • XX • XX • XX • XX • XX • XX • XX • XX • XX

11
SAMPLE
PAINT INDUSTRY IN INDIA 2015. PPT
• There are certain environmental regulations that govern the paint sector in India
• In India, there are some agencies that conduct standard and quality checks regularly to determine whether standards are being met by the players or not
Some such environmental agencies include the Ministry of Environment and Forests, Central Pollution Control Board, National Referral Centre on Lead Poisoning, and other state government agencies – Various companies in this segment need to comply with the set standards in order to remain in business and be competitive
Stringent Environmental Regulations Impact
Concerns
National Referral Centre for Lead Poisoning in India (NRCLPI)
• X
Bureau of Indian Standards (BIS)
• X
Department of Industrial Promotion and Policy (DIPP)
• X
Environmental regulations pose as a deterrent to this market

12
SAMPLE
PAINT INDUSTRY IN INDIA 2015. PPT
Colour is the most expressive option of personalizing one’s home and giving it an individualized touch
• Consumers look to develop a unique identity and have shown interest in experimenting with colours
This is forcing paint companies to look at new colors and different finishes
• Recent trends show that conservative paints make way for unique preferences
Emulsion paints for interiors are being preferred more than distempers
For exteriors, emulsion based coatings are preferred against conventional cement based coatings
• With continuous lookout for superior quality as well as diversified products, consumers are switching to marginally higher priced emulsions with higher durability and wider range of colors
• Geography, fashion and home architecture primarily determines color preferences in India
Colour experimentation
Exclusivity drives color preferences
• BB
• BB
• BB
XX
• CC
• CC
• CC
XX
• AA
• AA
• AA
XX

13
SAMPLE In a bid to garner high revenues, players are turning towards water based paints
• Major players are seen to shift their focus towards emulsions with a view to expand operating margins in the future
• Demand for emulsions continue to outnumber enamels and distempers as water based paint is not only a high growth category but also generates higher margins compared to solvent based paints
Increasing demand for emulsions
Emulsions to overpower
enamels and primers
X X X
X X X
XX
PAINT INDUSTRY IN INDIA 2015. PPT

14
SAMPLE Porter’s Five Forces Analysis
PAINT INDUSTRY IN INDIA 2015. PPT
Competitive Rivalry • X
Bargaining Power of Suppliers • X
Bargaining Power of Buyers • X
Threat of New Entrants • X
Impact XX
Impact XX
Impact XX
Impact XX
Threat of Substitutes • X
Impact XX

15
SAMPLE Competitive Benchmarking (-/-)
Public Trading Comparables (FY 2014)
Company A Company B Company C
Market Capitalization
(INR mn) XX XX XX
Share Price (INR) XX XX XX
EV/EBITDA (x) XX XX XX
EV/Revenue (x) XX XX XX
PE Ratio XX XX XX
Note: Top 3 Public companies based on the revenue; Market Capitalization and Share Price is as on 27/10/2014; PE Ratio is as on 5/11/2014
PAINT INDUSTRY IN INDIA 2015. PPT

16
SAMPLE Key Ratios of Top 3 Companies – Operational Basis (FY 2014) (1/4)
Competitive Benchmarking (-/-)
0
D
C
B
A
Company C
c3 c2
c1
Company B
b3 b2
b1
Company A
a3 a2
% a1
Net Margin Operating Margin Gross Margin
• XX
• XX
• XX
• XX
PAINT INDUSTRY IN INDIA 2015. PPT

17
SAMPLE
Key People
Products and Services
Corporate Address XX
Tel No. XX
Fax No. XX
Website XX
Year of Incorporation XX
Ticker Symbol XX
Stock Exchange XX
Name Designation
XX XX
XX XX
XX XX
Head Office
Gurgaon
Category Products/Services
XX XX
XX XX
Company Information Offices and Centres – India
PAINT INDUSTRY IN INDIA 2015. PPT
Public: Domestic Company – Company A (1/5)

18
SAMPLE Financial Snapshot Key Ratios
Financial Summary
• The company earned a net profit of INR 1.5 bn in FY 2014, as compared to net profit of INR 2.2 bn in FY 2013
• The company reported total income of INR 26.1 bn in FY 2014, as compared to INR 25 bn in FY 2013
• The company earned an operating margin of 6.01% in FY 2014, a decrease of 0.10 percentage points over FY 2013
Key Financial Performance Indicators
Indicators Value (27/10/2014) Market Capitalization (INR mn) 63,106.2
Total Enterprise Value (INR mn) 56,598.2
EPS (INR)* 36.55
PE Ratio (Absolute)* 35.15
Particulars y-o-y change
(2014-13) 2014 2013 2012 2011
Profitability Ratios
Operating Margin -0.10 6.01% 6.11% 6.43% 9.42%
Net Margin -2.99 5.75% 8.74% 8.89% 13.49%
Profit Before Tax Margin -3.37 7.79% 11.15% 10.85% 16.79%
Return on Equity -2.08 17.72% 19.80% 14.00% 16.18%
Return on Capital Employed 3.83 16.66% 12.83% 9.56% 10.59%
Return on Working Capital 20.46 61.92% 41.45% 15.35% 13.55%
Return on Assets 1.07 7.70% 6.63% 6.61% 8.01%
Return on Fixed Assets -3.75 29.43% 33.18% 39.32% 78.84%
Cost Ratios
Operating costs (% of Sales) 0.37 93.46% 93.10% 92.60% 88.66%
Administration costs (% of Sales)
0.28 25.23% 24.96% 25.48% 29.90%
Interest costs (% of Sales) -0.34 0.02% 0.36% 0.15% 0.07%
Liquidity Ratios
Current Ratio -7.50% 1.23 1.33 2.39 3.42
Cash Ratio -31.02% 0.64 0.93 1.58 2.70
Leverage Ratios
Debt to Equity Ratio N.A. N.A. N.A. N.A. N.A.
Debt to Capital Ratio N.A. N.A. N.A. N.A. N.A.
Interest Coverage Ratio 1269.1% 261.50 19.10 48.63 154.13
Efficiency Ratios
Fixed Asset Turnover -6.33% 4.50 4.81 5.31 6.95
Asset Turnover 22.60% 1.18 0.96 0.89 0.71
Current Asset Turnover 19.05% 1.78 1.49 1.21 0.85
Working Capital Turnover 57.73% 9.47 6.01 2.07 1.19
Capital Employed Turnover 41.37% 2.83 2.00 1.37 1.00
Improved Decline
Net Profit/Loss Total Income
0
3
2
1
30
20
10
0
INR bn INR bn
2014
1.5
26.1
2013
2.2
25.0
2012
2.0
22.7
2011
1.8
13.1
Public: Domestic Company – Company A (2/5)
PAINT INDUSTRY IN INDIA 2015. PPT
*: Data corresponds to 05/11/2014

19
SAMPLE
98% 96% 96% 96%
0%
50%
100%
2014
4%
2013
4%
2012
4%
2011
2%
100% 97% 96% 98%
0%
50%
100%
2014
2%
2013
4%
2012
3%
2011
0%
Outside India India
Business Highlights (1/2)
Description News
Overview
•XX
•XX
•XX
•XX
•XX
Others Coatings
Key Business Segments Key Geographic Segments
Public: Domestic Company – Company A (3/5)
PAINT INDUSTRY IN INDIA 2015. PPT
20
SAMPLE Description News
Product Portfolio •XX
Prior Investors •XX
Current and Pending Subsidiaries/ Investments •XX
Business Highlights (2/2)
Public: Domestic Company – Company A (4/5)
PAINT INDUSTRY IN INDIA 2015. PPT

21
SAMPLE
• XX • XX
• XX • XX
T O
W S Strength Weakness
Opportunity Threat
Public: Domestic Company – Company A (5/5)
PAINT INDUSTRY IN INDIA 2015. PPT

22
SAMPLE Private: Domestic Company – Company B(1/5)
Corporate Address XX
Tel No. XX
Fax No. XX
Website XX
Year of Incorporation XX
Company Information Offices and Centres – India
Head Office
Mumbai
Key People
Products and Services
Name Designation
XX XX
XX XX
XX XX
Category Products/Services
XX XX
XX XX
PAINT INDUSTRY IN INDIA 2015. PPT
23
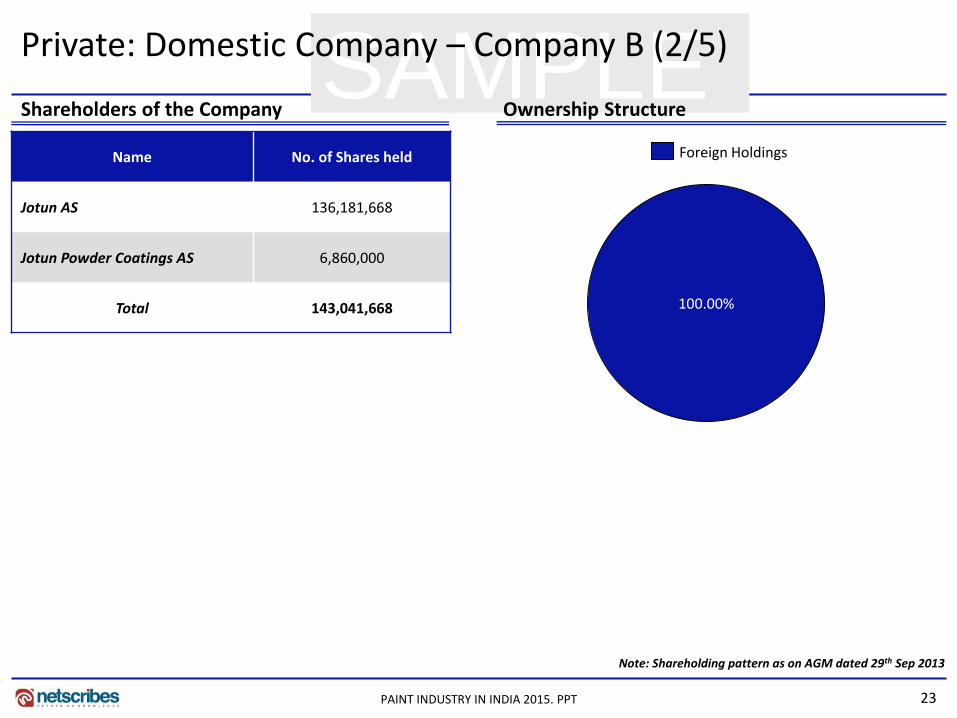
SAMPLE Name No. of Shares held
Jotun AS 136,181,668
Jotun Powder Coatings AS 6,860,000
Total 143,041,668 100.00%
Foreign Holdings
Note: Shareholding pattern as on AGM dated 29th Sep 2013
Private: Domestic Company – Company B (2/5)
Shareholders of the Company Ownership Structure
PAINT INDUSTRY IN INDIA 2015. PPT

24
SAMPLE Private: Domestic Company – Company B (3/5)
Financial Snapshot Key Ratios
Financial Summary
• The company incurred a net profit of negative INR 526.6 mn in FY 2014, as compared to net profit of negative INR 461.9 mn in FY 2013
• The company reported total income of INR 2964 mn in FY 2014, as compared to INR 2929.4 mn in FY 2013
• The company earned an operating margin of negative 10.03% in FY 2014, a decrease of 0.05 percentage points over FY 2013
• The company reported debt to equity ratio of 1.21 in FY 2014, as compared to 2 in FY 2013
Particulars y-o-y change
(2013-12) 2013 2012 2011 2010
Profitability Ratios
Operating Margin -0.05 -10.03% -9.99% -5.46% -1.21%
Net Margin -2.00 -17.77% -15.77% -13.43% -9.27%
Profit Before Tax Margin -2.68 -8.33% -5.65% -5.19% -1.00%
Return on Equity 7.96 -47.79% -55.75% -86.95% -27.04%
Return on Capital Employed -0.46 -12.22% -11.75% -7.68% -1.78%
Return on Working Capital 5.14 -26.10% -31.24% -60.47% -5.55%
Return on Assets -0.19 -9.20% -9.00% -5.47% -1.27%
Return on Fixed Assets 4.70 -36.49% -41.20% -23.25% -4.34%
Cost Ratios
Operating costs (% of Sales) -0.23 110.21% 110.44% 105.48% 101.22%
Administration costs (% of Sales)
N.A. N.A. N.A. N.A. N.A.
Interest costs (% of Sales) N.A. N.A. N.A. N.A. N.A.
Liquidity Ratios
Current Ratio 20.02% 1.93 1.61 1.14 1.48
Cash Ratio 13.87% 0.37 0.32 0.03 0.15
Leverage Ratios
Debt to Equity Ratio -39.67% 1.21 2.00 3.60 0.99
Debt to Capital Ratio -17.96% 0.55 0.67 0.78 0.50
Interest Coverage Ratio N.A. N.A. N.A. N.A. N.A.
Efficiency Ratios
Fixed Asset Turnover -9.41% 3.58 3.95 4.25 3.57
Asset Turnover 4.45% 0.90 0.86 1.00 1.04
Current Asset Turnover 8.84% 1.23 1.13 1.33 1.49
Working Capital Turnover -14.57% 2.56 2.99 11.04 4.57
Capital Employed Turnover -21.83% 2.64 3.38 6.46 2.91
Improved Decline
PAINT INDUSTRY IN INDIA 2015. PPT
Net Profit/Loss Total Income
-200
-400
-600 0
4,000 0
2,000
-410.2
INR mn
2,929.4
2012
3,053.7
-526.6
2,964.0
2011
INR mn
2014 2013
-461.9 -238.4
2,572.6

25
SAMPLE Private: Domestic Company – Company B (4/5)
Business Highlights
PAINT INDUSTRY IN INDIA 2015. PPT
Description News
Overview XX
Extended Product Segments XX
26
SAMPLE
XX XX
XX XX
T O
W S
Private: Domestic Company – Company B (5/5)
Strength Weakness
Opportunity Threat
PAINT INDUSTRY IN INDIA 2015. PPT

27
Thank you for the attention
About Netscribes, Inc. Netscribes, Inc. is a knowledge-consulting and solutions firm with clientele across the globe. The company’s expertise spans areas of investment & business research, business & corporate intelligence, content-management services, and knowledge-software services. At its core lies a true value proposition that draws upon a vast knowledge base. Netscribes, Inc. is a one-stop shop designed to fulfil clients’ profitability and growth objectives.
Paint Industry – India report is part of Netscribes’ Retail and Services Series. For any queries or customized research requirements, contact us at:
Disclaimer: This report is published for general information only. Although high standards have been used in the preparation, “Netscribes” is not responsible for any loss or damage arising from use of this document. This document is the sole property of Netscribes and prior permission is required for guidelines on reproduction.
Phone: +91 22 4098 7600 E-Mail: [email protected]
PAINT INDUSTRY IN INDIA 2015. PPT