Embed Size (px)
Citation preview

Page 1 of 40
The relationship between compulsive buying, obsessive-compulsive tendencies, eating behaviour and body image
Ria Park Supervised by: David Holmes March 2012

Page 2 of 40
The relationship between compulsive buying, obsessive-compulsive tendencies, eating behaviour and body image
ABSTRACT
Compulsive buying disorder presents adverse consequences to an individual’s personal, social, occupational and financial lives, yet the disorder is understudied and continues to rise dramatically. The following study aimed to enhance our understanding of compulsive buying by investigating the behaviour in relation to obsessive-compulsive tendencies, eating behaviour, body image, gender and age. A questionnaire was developed utilising four scales and distributed to a non-clinical sample (N=163). Significant negative relationships were found between compulsive buying, obsessive-compulsive tendencies, body image and age, whilst a positive relationship was demonstrated between compulsive buying and eating behaviour. Gender was presented to be the greatest predictor of compulsive buying, with females demonstrating higher tendencies. Conclusions included the recognition that compulsive buying is related to a number of psychological and biological factors which ought to be considered when assessing the behaviour. Additionally, it is proposed that classifying compulsive buying as an obsessive-compulsive spectrum disorder may not be appropriate due to the negative correlation.
KEY WORDS: COMPULSIVE BUYING
OBSESSIVE-COMPULSIVE TENDENCIES
EATING BEHAVIOUR BODY IMAGE GENDER

Page 3 of 40
Introduction
Shopping is no longer the case of travelling to a nearby city and braving the busy high street, with the introduction of the internet more people are now spending from the comfort of their own home (Mueller, Mitchell et al. 2011). With shopping being made easier and borrowing money becoming more acceptable, the number of people displaying problematic buying behaviour is on the rise (Neuner et al. 2005). The act of shopping may seem pleasurable for the individual but compulsive buying can result in severe consequences. Dittmar (2005) illustrates that compulsive buying involves three main features: ‘the desire to buy is experienced as irresistible, individuals lose control over their buying behaviour, and they continue with excessive buying despite adverse consequences in their personal, social, or occupational lives, and financial debt’ (p.468), demonstrating how compulsive buying can cause damaging effects to an individual’s life.
Despite compulsive buying continuing to increase and presenting adverse consequences, the disorder is somewhat understudied. Little is known about what causes the disorder and there are currently no evidence-based treatment methods (Black, 2007). Furthermore, the classification of compulsive buying remains uncertain, it is not included in the Diagnostic and Statistical Manual of Mental Disorders-Text Revision (American Psychiatric Association, APA, 2000) or the International Statistical Classification of Diseases and Related Health Problems (World Health Organization, 1992). Black et al. (2010) propose that compulsive buying should be included in the future release of the DSM-V (APA, 2010), however disputes continue with how compulsive buying should be catergorised. One of the main debates appears to be whether compulsive buying should be regarded as an impulse control disorder (ICD) or an obsessive-compulsive spectrum disorder (OCSD). Black et al. (2010) argue that compulsive buying should be classified as an ICD as the behaviour is initiated by a lack of impulse control, where as Hollander and Zorah (2004) propose that compulsive buying should be regarded as an OCSD as the behaviour involves both dimensions of compulsiveness and impulsiveness. Storch et al. (2008) argue:
The OCSD model asserts that applicable disorders are located on a compulsivity-impulsivity dimension with the compulsive anchor characterized [sic] by harm avoidance and anxiety reduction, and the impulsive anchor characterized [sic] by pleasure-seeking and gratification behaviors [sic] (p.336).
Compulsive buying involves behaviour similar to this, with motivation based on indulgence, as well as attempting to reduce the anxiety caused by the intrusive thoughts to buy. Lejoyeux et al. (2005) support this assumption, indicating that ‘buying can be seen as an attempt to neutralize [sic] the anxiety and discomfort comparable to compulsions secondary to obsessions’, arguing that ‘the pattern of uncontrolled buying resembles the sequence of thoughts and behaviors [sic] associated with OCD [obsessive-compulsive disorder]’ (p.105). In support of this, Christenson et al. (1994) found that 66.7 per cent of compulsive buyers compared

Page 4 of 40
their behaviour as being similar to OCD, however Christenson et al. argued that compulsive buying is based on gratification which differs considerably to compulsions, therefore the disorder should not be regarded as an OCSD. Black et al. (2010) support this argument by illustrating that compulsive buying is ‘ego-syntonic’ (p.181) where as OCD is rarely regarded as pleasurable with most sufferers striving to get rid of the symptoms.
Despite this important distinction, there still appears to be a strong association between compulsive buying and obsessive-compulsive tendencies. Lejoyeux et al. (2005) demonstrated that compulsive buyers presented more symptoms of OCD than a control group. Furthermore, they found that the prevalence of compulsive buying was 23 per cent in OCD patients, but only 6 per cent in controls, although this study only involved 14 participants, therefore some of the findings were not statistically significant. Du Toit et al. (2001) conducted a similar study, but involving a larger sample (N=85), and found that OCD patients had a 10.6 per cent prevalence rate for compulsive buying, presenting a significant association between compulsive buying and obsessive-compulsive traits, despite a relatively small effect size.
Black et al. (2010) propose that investigating compulsive buying in relation to obsessions and compulsions helps expand knowledge about the disorder, arguing that ‘the OC spectrum concept was quickly embraced by other investigators because it offered a new way to think about the relationship among many neglected disorders, and it potentially offered new treatment options’ (p.175). Several of the previous studies concentrated on the association between compulsive buying and OCD in clinical samples, the present study aims to investigate compulsive buying in relation to obsessive-compulsive tendencies in a non-clinical sample in order to assess how widespread compulsive buying and obsessive-compulsive symptoms are in a general population. Based on the findings of previous literature, the following hypothesis is proposed:
There will be a positive relationship between compulsive buying scores and obsessive-compulsive scores.
If support is found for this, it could be interpreted that compulsive buying should be classified as an OCSD, and treatments ought to acknowledge the relationship with obsessive-compulsive tendencies.
To further expand our understanding of compulsive buying as a disorder, other factors that may contribute to the behaviour will be considered. Dittmar and Drury (2000) propose that compulsive buying plays a significant psychological role for a person’s self-image, claiming that individuals compulsively buy to increase their self-worth. Furthermore, Faber et al. (1995) found that compulsive buyers demonstrated negative attitudes towards their appearance, suggesting that body image plays a crucial role in compulsive buying, however this study can be criticised for only involving 48 participants, 91.7 per cent of which were female. Females have been demonstrated to value image-related buying more than males (Dittmar et al. 2004), hence why Faber et al. may have found an association between body image and

Page 5 of 40
compulsive buying. In order to sufficiently assess this association, the present study will investigate compulsive buying in relation to body image in a larger sample (N=163), consisting of both male and females.
Following on from Faber et al. (1995), it is proposed that:
There will be a negative relationship between compulsive buying scores and body image scores.
In addition to body image, Faber et al. (1995) examined the relationship between compulsive buying and eating disorders. They established that compulsive buyers were more likely to display eating disorder symptoms, implying that both body image and eating behaviour influence compulsive buying. Claes et al. (2011) similarly found a positive association between compulsive buying and eating behaviour, claiming that those suffering from compulsive buying were significantly more likely to suffer from eating disorder symptoms, as measured by the Eating Disorder Inventory (Garner et al. 1983), however this study can be similarly criticised to that of Faber et al. (1995), for only involving female participants. In order to overcome this limitation, the present research aims to assess eating behaviour in relation to compulsive buying in a sample of both male and female participants. Unlike Claes et al. (2011), the Eating Attitudes Test (Garner et al. 1982) will be adopted in order to examine problematic eating behaviour, rather than eating disorders, which is appropriate for the intended sample of non-clinical participants. Based on previous literature, the following hypothesis is proposed:
There will be a positive relationship between compulsive buying scores and eating scores.
If eating behaviour and body image are found to be significantly related to compulsive buying, it could be interpreted that treatment methods for compulsive buying should take into account these factors, for instance, treatments may need to focus on reducing problematic eating behaviour and negative self-esteem in order to reduce compulsive buying behaviour.
In addition to this, the demographic factors of age and gender will be investigated in relation to compulsive buying. Previous studies have found that women suffer from compulsive buying more than men (Black, 2001; Dittmar, 2005; Mueller, Claes et al. 2011) whilst studies investigating the factor of age have demonstrated that younger individuals (aged 35 or under) are more likely to compulsively buy (Dittmar, 2005; Dittmar et al. 2007). The current study aims to investigate whether there are significant relationships between compulsive buying, age, and gender. Following on from previous studies, it is proposed that:
Females will score more highly on compulsive buying than males.
There will be a negative correlation between age and compulsive buying.

Page 6 of 40
To further investigate compulsive buying, the study will examine which of the five measured factors is the greatest predictor of compulsive buying behaviour in order to identify possible contributing factors. Based on the large number of studies claiming that gender is a significant factor of compulsive buying, it is proposed that:
Gender will be the greatest predictor of compulsive buying behaviour.
The current study aims to supplement previous research investigating compulsive buying by assessing several psychological and biological factors that may contribute towards compulsive buying behaviour. It is hoped that by identifying factors that relate to compulsive buying a greater insight will be gained into the aetiology and phenomenology of the disorder, whilst the recognition of possible risk factors can facilitate towards preventative measures and treatments.

Page 7 of 40
Method
Design
A questionnaire design was employed in order to examine compulsive buying (dependent variable) in relation to obsessive-compulsive tendencies, eating behaviour, and body image (independent variables), in addition to age and gender (demographic variables). A correlational design was implemented rather than experimental as variables were not manipulated, only measured.
Justification of Method
A questionnaire method was adopted to ensure that the measured variables produced quantitative data which could be statistically analysed for correlations. In relation to the dependent variable, Dittmar (2005) proposed that ‘questionnaire-based scales are ideally suited to measuring the relative strength of compulsive buying tendencies’ (p.468), which is suitable for the research. Furthermore, a questionnaire was deemed the most adequate method to collect a large amount of data, representing the general population, with relative ease and within a short time period (Coolican, 2009).
Pilot Study
Ten participants from the target population, obtained via opportunity sampling, completed the intended questionnaire (appendix two), alongside a pilot study cover sheet and feedback sheet (appendix five). The pilot study aimed to ensure that the questionnaire contained no ambiguity, did not cause any upset or embarrassment, was sufficient in length, and was suitable for the research. Response scores were inputted into SPSS to ensure that the scales produced an adequate range of scores which could be investigated on a larger scale (appendix six).
Feedback demonstrated that the questionnaire needed modification in relation to the obsessive-compulsive scale (the Padua Inventory-Washington State University Revision, PI-WSUR). The majority of participants (90 per cent) found the items relating to obsessional thoughts and impulses to harm self or others, offensive or upsetting, as well as being too extreme for a general population. To ensure that the questionnaire was appropriate for the research, and caused no upset, the 16 items relating to obsessional thoughts and impulses to harm self or others, were removed. The PI-WSUR was reduced from 39 items, to 23, resulting in the range of possible scores decreasing from 0-156, to 0-92. This did not influence the assessment of obsessive-compulsive traits as measurement was based on higher scores indicating higher tendencies.
Additional feedback indicated that 80 per cent of participants felt that the questionnaire was too long, suggesting possible fatigue effects and fixed responses. This was rectified by the removal of the 16 items from the PI-WSUR, reducing the questionnaire from 84 items, to 68. Furthermore, the pilot study demonstrated that some participants did not understand the term ‘buying binge’ which may have resulted in unreliable responses. To overcome this, a definition of the term was provided on the cover sheet.

Page 8 of 40
Second Pilot Study
The revised questionnaire (appendix three) was presented to the same sample. After completion, participants were presented with eight feedback items (appendix five) to assess whether the issues raised in the first pilot study had been resolved. Feedback indicated that 100 per cent felt that the modified questionnaire was appropriate for the intended research, caused no upset, and was adequate in length, with completion times reduced by an average of 1 minute, 36 seconds (appendix six).
Materials
The questionnaire was developed using four pre-existing scales:
Compulsive buying was measured using the Compulsive Buying Scale (CBS, Edwards, 1993) which consists of 13 items. The CBS was selected as it illustrates high reliability, measured by a Cronbach’s alpha of .91, and has been successfully utilised on non-clinical samples, suitable for the research. Additionally, the Compulsive Buying Continuum (Edwards, 1992) was adopted to identify the severity of compulsive buying. Other scales were considered, such as Faber and O’Guinn’s Clinical Screener (1992), however Manolis and Roberts (2008) argued that ‘using the Faber and O’Guinn scale may prove overly restrictive in a normal consumer population’, proposing that ‘those interested in understanding and/or estimating the compulsive buying phenomenon among the general consumer population would do well to the [sic] use the Edwards scale’ (p.571). More recent scales were contemplated, such as the Compulsive Buying Index (Ridgway et al. 2008), but despite being a modern scale it only consists of six items, measuring no more than two factors into compulsive buying, and is not as internally consistent as the CBS.
Obsessive-compulsive tendencies were measured using the PI-WSUR (Burns et al. 1996) which comprises of 39 items, however, this was reduced to 23, as discussed. Despite being a dated scale, the PI-WSUR has high internal consistency, as measured by Cronbach’s alpha (.92) and can be adopted to assess obsessive-compulsive symptoms in a general population.
Eating behaviour was assessed using the Eating Attitudes Test (EAT-26) by Garner et al. (1982) which consists of 26 items. The EAT-26 illustrates high reliability, measured by a Cronbach’s alpha of .83, and has been demonstrated to be an effective measure of disordered eating in non-clinical samples (Mintz & O’Halloran, 2000).
Body image was examined using the Body Image States Scale (BISS) by Cash et al. (2002) which contains six items. The BISS presents high reliability, with a Cronbach’s alpha of .77, and is an effective measure of body image (Rudiger et al. 2007).
The CBS, EAT-26 and BISS consisted of reversed items to help avoid fatigue effects and response bias. To reduce order effects, the order of the items on the

Page 9 of 40
questionnaire were counterbalanced (Marsden & Wright, 2010), and presented to 50 per cent of participants in one of two orders:
Order One Demographic Information 1-13 (CBS) 14-36 (PI-WSUR) 37-62 (EAT-26) 63-68 (BISS)
Order Two: Demographic Information 1-23 (PI-WSUR) 24-36 (CBS) 37-42 (BISS) 43-68 (EAT-26)
As the questionnaire contained four scales, it was possible to adopt four orders, however only two were developed to ensure no sensitive items were at the beginning of the questionnaire to avoid completion failures, as argued by Clark-Carter (2010), ‘it is generally advised to put more sensitive questions later in the questionnaire so that respondents are not put off straight away’ (p.78).
A cover sheet was presented before the questionnaire which included research information, instructions, ethical considerations, a consent form, and the researcher’s contact details, followed by a debrief sheet with additional information and references (appendix three). In order to score each questionnaire accurately and with relative ease, two researcher’s copies of the questionnaire (one for each order) were constructed which included response scores and indication of reverse scored items (appendix four).
Participants
The sample consisted of male and female participants, with the only selection criteria being to be over the age of 18 for ethical reasons. Participants were obtained via opportunity and snowball sampling to ensure the questionnaire was distributed amongst a general population that varied in age and gender. The questionnaire was distributed to 200 participants, with the aim that a large sample would reduce the likelihood of sampling errors (Stopher, 2012), however only 163 participants were employed in the study as 37 questionnaires were returned incomplete. This was deemed an adequate sample size for significant statistical power, with a medium effect size, based on the assumptions by Cohen (1992).
Procedure
The questionnaire was distributed over a 20 week period between August and December 2011. Participants were presented with the questionnaire in their own environment to ensure a comfortable atmosphere, and asked to complete it with no time limit. A face to face method was employed where the researcher was close by in order to answer any queries and ensure a high response rate. Additionally, the questionnaire was obtainable via email to participants that were difficult to access. Once completed, all response scores were inputted into SPSS and statistical analysis was performed.

Page 10 of 40
Ethical Considerations
Ethical concerns were acknowledged by the completion of an Ethics Check Form and an Application for Ethics Approval Form before data collection (appendix one). The research did not involve any vulnerable participants as all participants were over the age of 18 and were fully able to give informed consent. Participants remained anonymous and were only assigned a number for the purpose of data collection, however they were made aware that responses could not be confidential as they will be discussed with the project supervisor and will be reported in the research write up. The research involved no deception as participants were presented with the research aims on the cover sheet and were given additional information on the debrief sheet. Participants were informed that they have a right to withdraw at anytime. Abiding to the Data Protection Act (1998), all personal information was processed fairly and lawfully, and remained accurate, secure and accessible. Participants were given the researcher’s email address in order to access their personal information, withdraw from the study, or if they had any queries about the research, including finding out the results. Throughout the research the British Psychological Society Code of Ethics and Conduct (2009) was adhered to.

Page 11 of 40
Results
Justification of Analysis
The data obtained consisted of pseudo-continuous and dichotomous data which can be analysed using parametric tests, however in order to adopt parametric tests the data must conform to the following assumptions (Field, 2008):
• Independent data • Data measured at interval level • Homogeneity of variance • Normally distributed data
Independent data can be assumed as participants completed the questionnaire individually. Additionally, data was measured at interval level as distances between points of each scale were equal at all parts (Coolican, 2009), which is assumed in most questionnaires. As data was acquired from the same population, homogeneity of variance can be presumed. The last requirement is to have normally distributed data, specifically, parametric tests assume that the sampling distribution is normal, however as we do not have access to this, the data is examined for normal distribution in order to infer a normal sampling distribution. The following histograms have been produced with a normal curve superimposed to assess this. As age and gender are subject variables, it is not essential for them to conform to parametric assumptions as they are from an established normal population of scores.
Figure 1.0. Histogram presenting distribution of CB (compulsive buying) scores.

Page 12 of 40
Figure 1.1. Histogram presenting distribution of OC (obsessive-compulsive) scores.
Figure 1.2. Histogram presenting distribution of EB (eating behaviour) scores.

Page 13 of 40
Figure 1.3. Histogram presenting distribution of BISS (Body Image State Scale) scores. The histograms illustrate a relatively normal distribution for BISS scores, yet CB presents a bimodal distribution, whilst OC and EB demonstrate slight positive skews, however, histograms do not always present clear descriptions of data (Crawley, 2005; Howell, 2010), therefore the values of skewness and kurtosis were also considered, and the Kolmogorov-Smirnov (K-S) test was conducted.
Table 1.0. Values of skewness and kurtosis.
Skew-ness
Std. Error of
Skewness z-score of Skewness* Kurtosis Std. Error
of Kurtosis z-score of Kurtosis*
CB -.17 .19 -.88 -1.31 .38 -3.45
OC .66 .19 3.46 -.59 .38 -1.56
EB .91 .19 4.77 -.27 .38 -.70
BISS .09 .19 .45 -1.16 .38 -3.06
*Calculated by subtracting zero and dividing by standard error (Field, 2008).
OC and EB present a slight departure from normality, as the skewness values are more than twice the standard errors (SPSS, 2010). This is further confirmed when examining z-scores. OC and EB present significant positive skews (p<.001) as the z-scores are greater than 3.29, whereas CB and BISS are not significantly skewed as the z-scores are less than 1.96 (Field, 2009), however it must be acknowledged that large samples

Page 14 of 40
can give rise to small standard errors, therefore significant values can arise from small deviations from normality (Field, 2008).
Table 1.1. K-S test.
Kolmogorov-Smirnov
Statistic df Sig.
CB .15 163 .000*
OC .13 163 .000*
EB .16 163 .000*
BISS .09 163 .001*
*Exponential notations: CB=3.882589189314949E-9, OC=3.80955253980414E-7, EB=1.506066447182189E-10, BISS=0.0013228662345895756.
For all variables, the K-S test was significant (p<.01), indicating non-normal distributions, however, Howell (2010) criticises the K-S test for commonly rejecting the hypothesis of normality with large samples, even though, ‘minor deviations from normality will not be a problem’ (p.79), therefore in order to adequately examine the extent of non-normality the plotted data was assessed. As already discussed, histograms can give weak representations of data, therefore quantile-quantile plots were examined alongside these. The following Q-Q plots present the data (circles) against a normal distribution line:

Page 15 of 40
Figure 1.4. Q-Q plot of CB scores.
Figure 1.5. Q-Q plot of OC scores.

Page 16 of 40
Figure 1.6. Q-Q plot of EB scores.
Figure 1.7. Q-Q plot of BISS scores.
The Q-Q plots demonstrate that the majority of the data falls closely to the normal distribution line, with slight ‘S’ shapes presenting minor fluctuations of skewness, which are relatively common in data (Howell, 2010).
Page 17 of 40
Although some of the tests conducted have indicated a slight non-normal distribution, it is concluded that overall the data is moderately normally distributed, and is likely to have come from a normally distributed population, therefore it was deemed reasonable to adopt parametric tests. Furthermore, parametric tests are considered robust enough to contain minor violations of parametric assumptions without them influencing the use of the tests or the outcomes (Coolican, 2009), however the slight deviations were taken into consideration throughout the interpretation of the results.
Descriptive Statistics
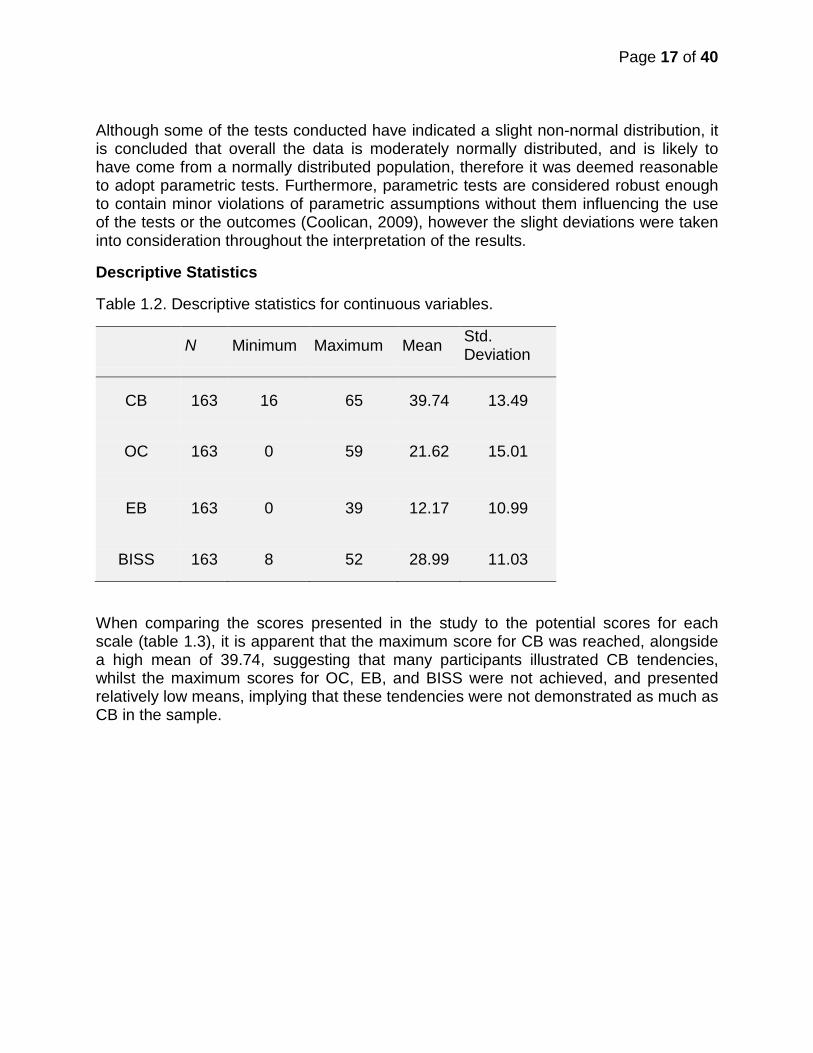
Table 1.2. Descriptive statistics for continuous variables.
N Minimum Maximum Mean Std. Deviation
CB 163 16 65 39.74 13.49
OC 163 0 59 21.62 15.01
EB 163 0 39 12.17 10.99
BISS 163 8 52 28.99 11.03
When comparing the scores presented in the study to the potential scores for each scale (table 1.3), it is apparent that the maximum score for CB was reached, alongside a high mean of 39.74, suggesting that many participants illustrated CB tendencies, whilst the maximum scores for OC, EB, and BISS were not achieved, and presented relatively low means, implying that these tendencies were not demonstrated as much as CB in the sample.

Page 18 of 40
Table 1.3. Potential minimum and maximum scores for each scale.
Scales Minimum Score Maximum Score
CB 13 65
OC 0 92
EB 0 78
BISS 6 54
Table 1.4. Descriptive statistics for variable of age.
The sample consisted of an age range between 18-69, however the mean age was 26.
Figure 1.8. Bar graph presenting age distribution.
N Minimum Maximum Mean Std. Deviation
Age 163 18 69 26.13 10.25

Page 19 of 40
The bar graph further demonstrates how the majority of participants were between the ages of 18-24, in particular 47 per cent were aged 21, illustrating a sampling bias, although this is not reflective of the population.
Table 1.5. Descriptive statistics for dichotomous variable of gender.
Frequency Percent Valid Percent
Cumulative Percent
Male 66 40.49 40.49 40.49
Female 97 59.51 59.51 100.0
Total 163 100.0 100.0
The sample consisted of 40 per cent males and 60 per cent females, indicating a slight female bias which is presented in the pie chart:
Figure 1.9. Pie chart illustrating gender frequency in sample.

Page 20 of 40
Statistical Analyses by Hypotheses
For clarification, each hypothesis is presented prior to the corresponding analysis:
H1: There will be a positive relationship between CB scores and OB scores.
H2: There will be a negative relationship between CB scores and BISS scores.
H3: There will be a positive relationship between CB scores and EB scores.
H5: There will be a negative correlation between age and CB.
These hypotheses have been grouped together as they assess bivariate correlations between two variables. Pearson’s product moment correlation coefficient (one-tailed) was conducted in order to assess these. Scatterplots were produced before the analysis to examine general trends.
Figure 2.0. Scatterplot of CB and OC scores.

Page 21 of 40
Figure 2.1. Scatterplot of CB and EB scores.
Figure 2.2. Scatterplot of CB and BISS scores.

Page 22 of 40
Figure 2.3. Scatterplot of CB scores and age.
By examining the scatterplots, there appears to be a positive relationship between CB and EB, and a negative relationship between CB and BISS, however there doesn’t seem to be a visible linear relationship between CB and OC, or, CB and age. Pearson’s correlation further assessed this.

Page 23 of 40
Table 1.6. Matrix of correlation coefficients.
CB OC EB BISS Age
CB Pearson Correlation 1 -.37** .78** -.81** -.26**
Sig. (1-tailed) .000 .000 .000 .000
OC Pearson Correlation -.37** 1 -.16* .43** .14*
Sig. (1-tailed) .000 .019 .000 .039
EB Pearson Correlation .78** -.16* 1 -.74** -.19*
Sig. (1-tailed) .000 .019 .000 .012
BISS Pearson Correlation -.81** .43** -.74** 1 .16*
Sig. (1-tailed) .000 .000 .000 .020
Age Pearson Correlation -.26** .14* -.19* .16* 1
Sig. (1-tailed) .000 .039 .012 .020
*Significant at 0.05 (1-tailed). **Significant at 0.001(1-tailed).
Pearson’s correlation presents a significant negative relationship between CB and OC (r =-.37, p<.001), CB and BISS (r =-.81, p<.001), and, CB and age (r =-.26, p<.001), whilst CB and EB are significantly positively related (r =.78, p<.001), although when examining the coefficients of determination (table 1.7), it is apparent that OC only accounts for approximately 14 per cent of the variability in CB, and age accounts for roughly 7 per cent, presenting small effect sizes. On the other hand EB and BISS account for approximately 60 and 65 per cent (respectively), presenting large effect sizes, suggesting that the relationships between CB and EB, and CB and BISS were greater.

Page 24 of 40
Table 1.7. R² values. Coefficient of determination (R²)*
CB and OC .14
CB and EB .60
CB and BISS .65
CB and age .07 *Calculated by squaring the coefficient (Field, 2009). H4: Females will score more highly on CB than males.
An independent t-test (one-tailed) was conducted in order to assess whether there was a significant difference between male and female mean CB scores.
Table 1.8. Statistics for variable of gender.
Gender N Mean Std. Deviation
Std. Error Mean
CB
Male
66
28.97
10.17
1.25
Female
97
47.06
10.15
1.03
Table 1.9. Independent t-test for gender.
Levene's Test for Equality of Variances
t-test for Equality of Means
F Sig. t df Sig. (2-tailed)
Mean Difference
Std. Error Difference
Equal variances assumed
.33 .57 -11.16 161 .000 -18.09 1.62
Equal variances not assumed -11.16 139.47 .000 -18.09 1.62

Page 25 of 40
As Levene’s test was non-significant (p=.57), equal variances were assumed. On average, females scored more highly on CB (M=47, SE=1.03) than males (M=29, SE=1.25). This difference is significant, t(161)=-11.16, p<.001 (one-tailed), presenting a large effect size (.66). The following equation was used to calculate the effect size (Rosenthal, 1991; Rosnow & Rosenthal, 2005):
𝑟 = �𝑡²
𝑡² + 𝑑𝑓
H6: Gender will be the greatest predictor of CB behaviour.
A hierarchical multiple regression analysis was conducted in order to further assess the relationships between the variables and discover which variable is the greatest predictor of CB. Pearson’s correlation illustrated that each variable is significantly individually correlated to CB, however this does not necessarily mean that all variables collectively better predict the outcome of CB, conducting a multiple regression analysis examined this.
Table 2.0. Model summaryc.
Model R R² Adj. R²
Std. Error of Est.
R² Change F Change Sig. F
Change D-W
1* .66a .44 .43 10.16 .44 124.63 .000
2* .89b .81 .80 5.99 .37 76.13 .000 1.66
a.Predictors:(Constant), Gender. b.Predictors:(Constant), Gender, Age, OC, EB, BISS. c.Dependent Variable:CB. *Exponential notations:1=8.54331881007141E-22, 2=9.157024369024338E-36. Model 1 indicates that gender accounts for approximately 44 per cent of the variance in CB scores (R²=.44), however when the other predictors were included (model 2) the R² value increased to .81, accounting for approximately 81 per cent of the variability, indicating that age, OC, EB and BISS account for an additional 37 per cent of the variance. Notably, the difference between the R² and adjusted R² values for both models are .003 and .006 (respectively), suggesting that if they were derived from the population rather than a sample, they would account for roughly .3 and .6 per cent less variance, indicating good cross-validity.
Page 26 of 40
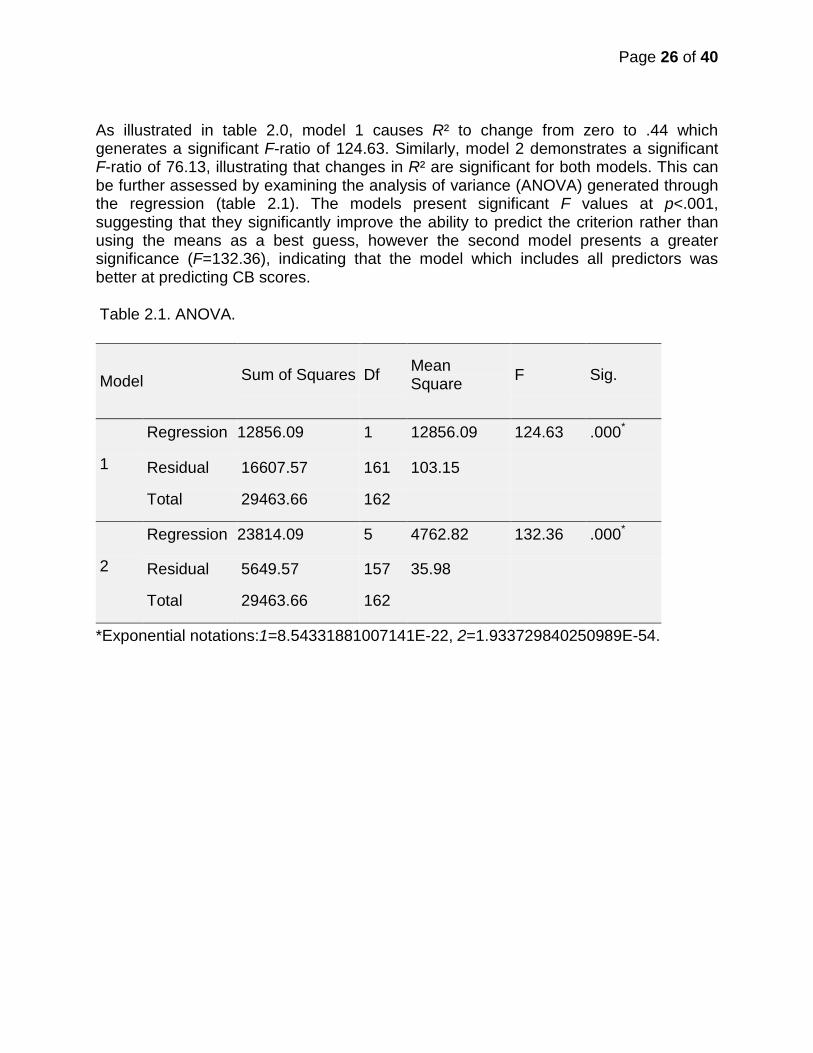
As illustrated in table 2.0, model 1 causes R² to change from zero to .44 which generates a significant F-ratio of 124.63. Similarly, model 2 demonstrates a significant F-ratio of 76.13, illustrating that changes in R² are significant for both models. This can be further assessed by examining the analysis of variance (ANOVA) generated through the regression (table 2.1). The models present significant F values at p<.001, suggesting that they significantly improve the ability to predict the criterion rather than using the means as a best guess, however the second model presents a greater significance (F=132.36), indicating that the model which includes all predictors was better at predicting CB scores.
Table 2.1. ANOVA.
*Exponential notations:1=8.54331881007141E-22, 2=1.933729840250989E-54.
Model Sum of Squares Df Mean Square F Sig.
1
Regression 12856.09 1 12856.09 124.63 .000*
Residual 16607.57 161 103.15
Total 29463.66 162
2
Regression 23814.09 5 4762.82 132.36 .000*
Residual 5649.57 157 35.98
Total 29463.66 162

Page 27 of 40
Table 2.2. Coefficients.
B Std. Error Beta t Sig. Lower
Bound Upper Bound
1 (Constant) 28.97 1.25 23.17 .000 26.50 31.44
Gender 18.09 1.62 .66 11.16 .000 14.89 21.29
2 (Constant) 46.06 3.08 14.95 .000 39.98 52.15
Gender 8.38 1.13 .31 7.42 .000* 6.15 10.62
Age -.13 .05 -.09 -2.73 .007* -.22 -.04
OC -.12 .04 -.13 -3.17 .002* -.19 -.04
EB .45 .07 .37 6.67 .000* .32 .58
BISS -.38 .08 -.31 -5.01 .000* -.53 -.23
*Exponential notations:Gender=6.936536903421613E-12, Age=0.006981463344035136, OC=0.0018409405476832578, EB=4.226536502316864E-10, BISS=1.4780078723789014E-6. The B-values indicate the degree in which each predictor influences the outcome, if the effects of all predictors are held constant (Field, 2009), for instance, EB has a B-value of .45, indicating that as EB increased by one score, CB increased by .45. The beta (β) values can be similarly applied, and are arguably easier to interpret as they are standardised, therefore they are not dependent on units of measurement (Field, 2009). Using the same example as before, EB has a β-value of .37 implying that as EB score increased by 1 standard deviation (SD), CB score increased by .37 SD. Notably, all predictors present small confidence intervals, suggesting that the B-values in the sample are representative of the population.
All variables significantly account for the variance in CB (p<.01), however gender is the greatest predictor as it has the largest value of t, alongside a small significance value (Field, 2009), t(157)=7.42, p<.001. Before it can be concluded that gender is the greatest predictor of CB, the model must conform to a number of regression assumptions to ensure it can be generalised to the population (Berry, 1993). The assumptions of independent errors, multicollinearity, homoscedasticity and normally distributed errors are discussed below.

Page 28 of 40
The Durbin-Watson (D-W) test (1951) was presented in table 2.0 and was employed to identify whether the residuals were independent. As the D-W statistic is quite close to 2 (1.66), we can conclude that the residuals were uncorrelated (Berry, 1993).
Table 2.3. Collinearity Statistics
Model Tolerance VIF
1 (Constant)
Gender 1.00 1.00
2
(Constant)
Gender .72 1.39
Age .96 1.05
OC .75 1.33
EB .41 2.47
BISS .32 3.11
Table 2.3 demonstrates that both models conform to the assumption of no multicollinearity as all VIF values are below 10 and the average (1.87) is not much greater than 1 (Bowerman & O’Connell, 1990). Furthermore, the tolerance values are above .2 indicating that there was no collinearity within the data (Menard, 1995).

Page 29 of 40
Table 2.4. Residual statistics.
Case Number Std. Residual CB
Predicted Value Residual
3 2.94 49 31.38 17.62
5 3.81 44 21.18 22.82
9 -2.89 20 37.31 -17.31
13 2.94 48 30.34 17.66
133 -2.74 36 52.42 -16.42
134 2.94 58 40.37 17.63
In an ordinary sample 5 per cent of cases are expected to have standardised residuals less than -2, or greater than 2 (Field, 2009). In the study, there were 6 cases, which is 3.68 per cent of the sample, indicating conformity to an accurate model. Furthermore, figure 2.4 indicates that residuals were fairly normally distributed:
Figure 2.4. Normal probability plot of standardised residuals.

Page 30 of 40
Figure 2.5. Plot of standardised residuals against standardised predicted values.
Figure 2.5 illustrates that the assumptions of homoscedasticity and linearity have been met as the plots are evenly dispersed around zero.
It has therefore been demonstrated that the model conforms to the regression assumptions and can be generalised to the population.
(See appendix six for SPSS outputs and raw data).

Page 31 of 40
Discussion
The current research indicates that compulsive buying is significantly positively related to eating behaviour, whilst negatively related to body image and age, supporting H2, H3, and H5, however a negative relationship was found between compulsive buying and obsessive-compulsive tendencies, contradicting H1. On average, females were found to score more highly on compulsive buying (H4), whilst gender was demonstrated to be the greatest predictor of compulsive buying behaviour (H6).
The finding that compulsive buying is significantly correlated to eating behaviour is reflective of previous literature (Claes et al. 2011; Faber et al. 1995). Similar to Claes et al. (2011), a positive association was presented between compulsive buying and eating behaviour, implying that those who compulsively buy are more likely to suffer from eating problems. This association could be related to the psychological factor of self-esteem, as proposed by Dittmar and Drury (2000), individuals compulsively buy as an attempt to increase their self-image and self-confidence, likewise, it could be interpreted that those who compulsively buy may suffer from eating problems, due to their poor self-esteem (Dada et al. 2012; Paterson et al. 2011; Verplanken & Tangelder, 2011).
A negative relationship was found between compulsive buying and body image, supporting previous research (Dittmar & Drury, 2000; Faber et al. 1995). The study illustrated that those who presented high compulsive buying tendencies demonstrated negative attitudes towards their appearance, suggesting that motivation to buy was based on the intention to gain a greater self-worth. This assumption is supported by Davenport et al. (2011), who proposed that low self-esteem, combined with anxiety, impulsivity, social desirability, and reward sensitivity, results in compulsive buying behaviour, suggesting a ‘destructive model’ (p.3) of influential factors. Notably, the model implies that those who compulsively buy may have a reward sensitivity personality whereby they are more sensitive to rewards from their buying behaviour due to increased dopamine levels (Pickering & Gray, 1999), this could explain why individuals who suffer from compulsive buying struggle to reduce their excessive spending. It would be beneficial to further assess how psychological factors, such as those measured in the study, alongside personality constructs, such as reward sensitivity, can collectively contribute towards compulsive buying to facilitate towards the development of effective treatments, for instance, therapeutic interventions could focus on increasing self-esteem and reducing reward sensitivity personality traits, whilst pharmacological treatments could be employed to reduce dopamine levels (Davenport et al. 2011). Support has been found for this with the use of Fluvoxamine (a selective serotonin reuptake inhibitor) to reduce dopamine levels, with compulsive buyers reporting less impulses to buy (Black et al. 1997), however it is debatable as to whether it is the Fluvoxamine itself that eases the symptoms, or the therapy provided alongside it (Black et al. 2000; Ninan et al. 2010).

Page 32 of 40
Consistent with previous findings (Black, 2001; Dittmar, 2005; Mueller, Claes et al. 2011), females demonstrated more compulsive buying tendencies than males. Dittmar et al. (2004) proposed that this is because women value emotional and identity-related features of compulsive buying more than men, relating to the finding that body image is closely associated with compulsive buying. Moreover, Dittmar (2005) proposed that the gender differences are related to attitudes towards shopping, arguing that women present positive attitudes, associating buying with a ‘leisure frame’, where as men demonstrate negative attitudes, interpreting shopping in a ‘work frame’, in which they want to complete with ‘minimum input of time and effort’ (p.470). To further investigate the gender differences of compulsive buying, it would be useful to consider how it is defined by men and women. It may be the case that males do compulsively buy, but associate the behaviour as a feminine concept, relating to feminine goods, therefore they do not admit to the behaviour to maintain their masculine identity, as argued by Bakewell and Mitchell (2004), ‘shopping is perceived as a feminine activity...and some men will go to great lengths to avoid it because of their need to preserve their sense of masculinity’ (p.226). The current study could be replicated with additional items referring to types of goods, to assess whether men would report compulsive buying more with ‘masculine goods’. Dittmar (2005) proposed that if types of goods were considered, the tendency for women to compulsively buy more than men may become ‘less strong or even reversed’ (p.470). In addition to demonstrating further support for the assumption that females compulsively buy more than males, the study illustrates that gender is the greatest predictor of compulsive buying, indicating the importance of further research.
In line with earlier findings, compulsive buying is presented to be negatively correlated to age (Dittmar, 2005; Dittmar et al. 2007), suggesting that compulsive buying is reported more by younger individuals, although it must be noted that the majority of the sample (71 per cent) were students, aged 18-24, therefore it was probable that compulsive buying would be presented more by younger participants. Furthermore, it is arguable that as the majority of participants were students, the sample may not be a reliable representation of the general population. In order to overcome these limitations, a wider variation of ages, and occupations, should be included to ensure a more generalisable sample. Notably, the finding that age is negatively related to compulsive buying demonstrates a relatively small effect size, suggesting that other factors may contribute towards the relationship, for example, Dittmar (2005) found that ‘age-related differences in compulsive buying were significantly mediated by stronger materialistic value endorsement among younger consumers’ (p.487). In order to assess this, a measure of materialistic values could be included in a future replication of the current study, such as the Materialistic Values Scale (Richins, 2004).
Unexpectedly, a negative correlation was demonstrated between compulsive buying and obsessive-compulsive tendencies which contradicts previous literature (Du Toit et al. 2001; Lejoyeux et al. 2005). This negative relationship could be explained by findings by Frost et al. (2002) who found that compulsive buying was positively related to obsessive-compulsive tendencies, however they argued that this relationship was

Page 33 of 40
strongly determined by the factor of hoarding more than other obsessive-compulsive domains. Frost et al. (2002) proposed that ‘if compulsive buying is associated with hoarding but no other OCD symptom, it may appear to be related to OCD in some studies but not others, depending on whether hoarding is assessed’ (p.203). This could explain the current finding as the scale adopted to measure obsessive-compulsive tendencies (PI-WSUR), did not include any measurement of hoarding, therefore, according to Frost et al. (2002), a positive relationship would not have been presented. Further support for this can be demonstrated by the findings by Lejoyeux et al. (2005) who reported a relationship between compulsive buying and OCD, however, OCD was assessed using the Yale-Brown Obsessive Compulsive Scale (Goodman et al. 1989) which includes a measurement of hoarding, suggesting that the inclusion of hoarding was accountable for the relationship. In order to establish whether this assumption is accurate, a second study which includes a measurement of hoarding, for instance, the Saving Inventory-Revised (Frost et al. 2004), would be required. As there is a vast amount of literature demonstrating an association between hoarding and compulsive buying (e.g. Mueller et al. 2009), it would be reasonable to predict further support for Frost et al. (2002).
The present research has attempted to gain a greater insight into compulsive buying as a specific disorder. As the study demonstrates a negative relationship between compulsive buying and obsessive-compulsive tendencies, it is arguable that it may not be appropriate to classify compulsive buying as an OCSD and therefore may be more reasonable to interpret it as an ICD, supporting previous literature (Black et al. 2010; Dell’Osso et al. 2006), however as impulsivity was not measured in the current study, this cannot be entirely concluded. It is debatable that until the future release of the DSM-V, the classification of compulsive buying will remain uncertain, and without this clarification, research will continue to struggle to reach clear conclusions concerning the disorder.
Alongside the discussed recommendations for future replications, there are a number of methodological limitations which ought to be considered. Although the questionnaire was reduced in length through the pilot studies, some participants still felt it was slightly too long. This is apparent through the number of incomplete questionnaires returned (18.5 per cent), suggesting possible fatigue effects and fixed responses. Furthermore, it is important to consider the period in which data was collected (between August and December), which may have had an influence on the reporting of compulsive buying, with possible enhanced spending during the last month of summer and Christmas. Additionally, as the majority of participants were students it is worth considering that many questionnaires were completed during the first couple of months of the university term, when student loans are credited into accounts, implying a greater opportunity to excessively buy. It is important to recognise that although the research has demonstrated significant relationships between compulsive buying and the measured variables, we cannot propose causal inferences (Field, 2009), as there is the possibility of third variables, especially when there are small effect sizes. We can only conclude

Page 34 of 40
that there are significant associations between the variables. Taking into account the discussed limitations and recommendations, a future replication of the present study would involve a sample consisting of various ages and occupations, whilst considering the additional independent variables of materialism, impulsivity, hoarding, and types of goods.
The current research has demonstrated the importance of recognising that compulsive buying is related to a number of psychological and biological factors, which ought to be considered when assessing the disorder. It is proposed that identifying factors which may contribute towards compulsive buying will help towards the development of preventative measures and effective treatment methods. It is evident, however, that further research is still required to gain a greater insight into the aetiology and phenomenology of the disorder, and thus facilitate towards the reduction of the rising prevalence of compulsive buying, and its problematic consequences.
Page 35 of 40
References
American Psychiatric Association. (2000). Diagnostic and statistical manual of mental disorders (4th edn., text revision). Washington, DC: American Psychiatric Association.
American Psychiatric Association. (2010). DSM-5: The future of psychiatric diagnosis. Retrieved 19 September 2011 from: www.dsm5.org/Pages/Default.aspx.
Bakewell, C. & Mitchell, V. W. (2004). Male consumer decision-making styles. The international review of retail, distribution and consumer research, 14(2), 223-240.
Berry, W. D. (1993). Understanding regression assumptions. Sage university paper series on quantitative applications in the social sciences, 07-092. Newbury Park, California: Sage Publications.
Black, D. W. (2007). A review of compulsive buying disorder. World Psychiatry, 6(1), 14-18.
Black, D. W. (2001). Compulsive buying disorder: Definition, assessment, epidemiology and clinical management. CNS Drugs, 15(1), 17-27.
Black, D. W., Gabel, J., Hansen, J. & Schlosser, S. (2000). A double-blind comparison of fluvoxamine versus placebo in the treatment of subjects with compulsive buying disorder. Annals of Clinical Psychiatry, 12(4), 205-211.
Black, D. W., Monahan, P. & Gabel, J. (1997). Fluvoxamine in the treatment of compulsive buying. Journal of Clinical Psychiatry, 58(4), 159-163.
Black, D. W., Shaw, M. & Blum, N. (2010). Pathological gambling and compulsive buying: Do they fall within an obsessive-compulsive spectrum? Dialogues in Clinical Neuroscience, 12(2), 175-185.
Bowerman, B. L. & O’Connell, R. T. (1990). Linear statistical models: An applied approach (2nd edn). Belmont, California: Duxbury.
Burns, L. G., Keortge, S. G., Formea, G. M. & Sternberger, L. G. (1996). Revision of the Padua Inventory of obsessive compulsive disorder symptoms: Distinctions between worry, obsessions, and compulsions. Behaviou r Research and Therapy, 34(2), 163-173.
Cash, T. F., Fleming, E. C., Alindogan, J., Steadman, L. & Whitehead, A. (2002). Beyond body image as a trait: The development and validation of the Body Image States Scale. Eating Disorders: The Journal of Treatment and Prevention, 10(2), 103-113.

Page 36 of 40
Christenson, G. A., Faber, R. J., de Zwaan, M., Raymond, N. C., Specker, S. M., Ekern, M. D. et al. (1994). Compulsive buying: Descriptive characteristics and psychiatric comorbidity. Journal of Clinical Psychiatry, 55(1), 5-11.
Claes, L., Bijttebier, P., Mitchell, J. E., de Zwaan, M. & Mueller, A. (2011). The relationship between compulsive buying, eating disorder symptoms, and temperament in a sample of female students. Comprehensive Psychiatry, 52(1), 50-55.
Clark-Carter, D. (2010). Quantitative psychological research: The complete student’s companion (3rd edn). East Sussex: Psychology Press.
Cohen, J. (1992). Quantitative methods in psychology: A power primer. Psychological Bulletin, 112(1), 155-159.
Coolican, H. (2009). Research methods and statistics in psychology. London: Hodder Education.
Crawley, M. J. (2005). Statistics: An introduction using R. West Sussex: John Wiley & Sons Ltd.
Dada, G., Feixas, G., Compan, V. & Montesano, A. (2012). Self-construction, cognitive conflicts, and disordered eating attitudes in young women. Journal of Constructivist Psychology, 25(1), 70-89.
Data Protection Act (1998). [Electronic Version]. London: The Stationery Office. Retrieved May 5 2011 from: www.legislation.gov.uk/ukpga/1998/29/contents.
Davenport, K., Houston, J. E. & Griffiths, M. D. (2011, May 24). Excessive eating and compulsive buying behaviours in women: An empirical pilot study examining reward sensitivity, anxiety, impulsivity, self-esteem and social desirability. International Journal of Mental Health Addiction, 1-16. Retrieved 19 February 2012 from: www.springerlink.com/content/n5h20478xt65k821/.
Dell’Osso, B., Altamura, A. C., Allen, A., Marazziti, D. & Hollander, E. (2006). Epidemiologic and clinical updates on impulse control disorders: A critical review. European Archives of Psychiatry and Clinical Neuroscience, 256(8), 464-475.
Dittmar, H. (2005). Compulsive buying – A growing concern? An examination of gender, age, and endorsement of materialistic values as predictors. British Journal of Psychology, 96(4), 467-491.
Dittmar, H. & Drury, J. (2000). Self-Image – is it in the bag? A qualitative comparison between “ordinary” and “excessive” consumers. Journal of Economic Psychology, 21(2), 109-142.
Page 37 of 40
Dittmar, H., Long, K. & Bond, R. (2007). When a better self is only a button click away: Associations between materialistic values, emotional and identity-related buying motives, and compulsive buying tendency online. Journal of Social and Clinical Psychology, 26(3), 334-361.
Dittmar, H., Long, K. & Meek, R. (2004). Buying on the internet: Gender differences in online and conventional buying motivations. Sex Roles, 50(5-6), 423-444.
Durbin, J. & Watson, G. S. (1951). Testing for serial correlation in least squares regression, II. Biometrika, 38, 159-179.
Du Toit, P. L., van Kradenburg, J., Niehaus, D. & Stein, D. J. (2001). Comparison of obsessive-compulsive disorder patients with and without comorbid putative obsessive-compulsive spectrum disorders using a structured clinical interview. Comprehensive Psychiatry, 42(4), 291-300.
Edwards, E. A. (1993). Development of a new scale for measuring compulsive buying behaviour. Financial Counseling and Planning, 4, 67-84.
Edwards, E. A. (1992). The measurement and modeling of compulsive consumer buying behaviour. Published Dissertation. The University of Michigan: University Microfilms.
Faber, R. J., Christenson, G. A., de Zwaan, M. & Mitchell, J. (1995). Two forms of compulsive consumption: Comorbidity of compulsive buying and binge eating. Journal of Consumer Research, 22(3), 296-304.
Faber, R. J. & O’Guinn, T. C. (1992). A clinical screener for compulsive buying. Journal of Consumer Research, 19(3), 459-469.
Field, A. P. (2009). Discovering statistics using SPSS (3rd edn). London: Sage Publications.
Field, A. P. (2008). Exploring data. [Electronic version]. Retrieved 3 February 2012 from: www.statisticshell.com/docs/exploringdata.pdf.
Frost, R. O., Steketee, G. & Grisham, J. (2004). Measurement of compulsive hoarding: Saving inventory-revised. Behaviour Research and Therapy, 42(10), 1163-1182.
Frost, R. O., Steketee, G. & Williams, L. (2002). Compulsive buying, compulsive hoarding, and obsessive-compulsive disorder. Behavior Therapy, 33(2), 201-214.
Garner, D. M., Olmsted, M. P., Bohr, Y. & Garfinkel, P. E. (1982). The Eating Attitudes Test: Psychometric features and clinical correlations. Psychological Medicine, 12, 871-878.
Page 38 of 40
Garner, D. M., Olmstead, M. P. & Polivy, J. (1983). Development and validation of a multidimensional eating disorder inventory for anorexia nervosa and bulimia. International Journal of Eating Disorders, 2(2), 15-34.
Goodman, W. K., Price, L. H., Rasmussen, S. A., Mazure, C., Fleischmann, R. L., Hill, C. L. et al. (1989). The Yale-Brown Obsessive Compulsive Scale. I. Development, use, and reliability. Archives of General Psychiatry, 46(11), 1006- 1011.
Hollander, E. & Zohar, J. (2004). Beyond refractory obsessions and anxiety states: Toward remission. Journal of Clinical Psychiatry, 65(14), 3-5.
Howell, D. C. (2010). Statistical methods for psychology (7th edn). Belmont, California: Wadsworth, Cengage Learning.
Lejoyeux, M., Bailly, F., Moula, H., Loi, S. & Ades, J. (2005). Study of compulsive buying in patients presenting obsessive-compulsive disorder. Comprehensive Psychiatry, 46(2), 105-110.
Manolis, C. & Roberts, J. A. (2008). Compulsive buying: Does it matter how it’s measured? Journal of Economic Psychology, 29(4), 555-576.
Marsden, P. V. & Wright, J. D. (2010). Handbook of survey research (2nd edn). Bigley, UK: Emerald Group Publishing Limited.
Menard, S. (1995). Applied logistic regression analysis. Sage university paper series on quantitative applications in the social sciences, 07-106. Thousand Oaks, California: Sage Publications.
Mintz, L. B. & O’Halloran, M. S. (2000). The Eating Attitudes Test: Validation with DSM IV eating disorder criteria. Journal of Personality Assessment, 74(3), 489- 504.
Mueller, A., Claes, L., Mitchell, J. E., Faber, R. J., Fischer, J. & de Zwaan, M. (2011). Does compulsive buying differ between male and female students? Personality and Individual Differences, 50(8), 1309-1312.
Mueller, A., Mitchell, J. E., Crosby, R. D., Glaesmer, H. & de Zwaan, M. (2009). The prevalence of compulsive hoarding and its association with compulsive buying in a German population based sample. Behaviour Research and Therapy, 47(8), 705- 709.
Mueller, A., Mitchell, J. E., Peterson, L. A., Faber, R. J., Steffen, K. J., Crosby, R. D. et al. (2011). Depression, materialism, and excessive internet use in relation to compulsive buying. Comprehensive Psychiatry, 52(4), 420-424.
Neuner, M., Raab, G. & Reisch, L. A. (2005). Compulsive buying in maturing consumer societies: An empirical re-inquiry. Journal of Economic Psychology, 26(4), 509-522.

Page 39 of 40
Ninan, P. T., McElroy, S. L., Kane, C. P., Knight, B., Casuto, L., Rose, S. et al. (2000). Placebo controlled study of fluvoxamine in the treatment of patients with compulsive buying. Journal of Clinical Psychopharmacology, 20(3), 362-366.
Paterson, G., Power, K., Collin, P., Greirson, D., Yellowlees, A. & Park, K. (2011). A mediational model of self-esteem and social problem-solving in anorexia nervosa. European Eating Disorders Review, 19(2), 112-120.
Pickering, A. D. & Gray, J. A. (1999). The neuroscience of personality. In L. A. Pervin & O. P. John (Eds.) Handbook of personality: Theory and research (2nd ed., pp. 277-299). New York: Guilford Press.
Richins, M. (2004). The Material Values Scale: Measurement properties and development of a short form. Journal of Consumer Research, 31(1), 209-219.
Ridgway, N. M., Kukar‐Kinney, M. & Monroe, K. B. (2008). An expanded conceptualization and a new measure of compulsive buying. Journal of Consumer Research, 35(4), 622-639.
Rosenthal, R. (1991). Meta-analytic procedures for social research (revised edn). Newbury Park, California: Sage Publications.
Rosnow, R. L. & Rosenthal, R. (2005). Beginning behavioural research: A conceptual primer (5th edn). Englewood Cliffs, New Jersey: Prentice Hall.
Rudiger, J. A., Cash, T. F., Roehrig, M. & Thompson, J. K. (2007). Day-to-day body- image states: Prospective predictors of intra-individual level and variability. Body Image, 4(1), 1-9.
SPSS, (2010). Statistics for Windows. Release 19.0.0. Chicago: SPSS Inc. (IBM).
Stopher, P. (2012). Collecting, managing and assessing data using sample surveys: A primer. Cambridge: Cambridge University Press.
Storch, E. A., Abramowitz, J. & Goodman, W. K. (2008). Where does obsessive- compulsive disorder belong in the DSM-V? Depression and Anxiety, 25, 336-347.
The British Psychology Society. Code of Ethics and Conduct (2009). [Electronic Version]. Retrieved 1 May 2011 from: www.bps.org.uk/sites/default/files/documents/code_of_ethics_and_conduct.pdf.
Verplanken, B. & Tangelder, Y. (2011). No body is perfect: The significance of habitual negative thinking about appearance for body dissatisfaction, eating disorder propensity, self-esteem and snacking. Psychology and Health, 26(6), 685-701.

Page 40 of 40
World Health Organization. (1992). The ICD-10: Classification of mental and behavioural disorders: Clinical descriptions and diagnostic guidelines. Geneva: World Health Organization.

![The Space Between [Portfolio: The Space Between] · Title: The Space Between [Portfolio: The Space Between] Created Date: 6/25/2006 3:31:40 PM](https://img.dokumen.tips/doc/110x75/5e691ecb3541a51e81012300/the-space-between-portfolio-the-space-between-title-the-space-between-portfolio.jpg)