Embed Size (px)
Citation preview

1
Chronic reduction of GIP secretion alleviates obesity and insulin resistance under high fat diet
condition
Running title: GIP reduction alleviates obesity
Daniela Nasteska1, Norio Harada
1, Kazuyo Suzuki
1, Shunsuke Yamane
1, Akihiro Hamasaki
1,
Erina Joo1, Kanako Iwasaki
1, Kimitaka Shibue
1, Takanari Harada
1, Nobuya Inagaki
1
1Department of Diabetes, Endocrinology and Nutrition, Graduate School of Medicine, Kyoto
University, Kyoto, Japan
Corresponding author: Nobuya Inagaki, Department of Diabetes, Endocrinology and Nutrition,
Graduate School of Medicine, Kyoto University, 54 Kawahara-cho, Shogoin, Sakyo-ku, Kyoto
606-8507, Japan. Tel: +81 75 751 3562, fax: +81 75 771 6601, e-mail:
Abstract word count: 195
Main text word count: 4984
Tables: 1
Figures: 5
Supplementary figures: 1
Page 1 of 33 Diabetes
Diabetes Publish Ahead of Print, published online February 28, 2014

2
Abstract:
Gastric inhibitory polypeptide (GIP) exhibits potent insulinotropic effects on β-cells and anabolic
effects on bone formation and fat accumulation. We explored the impact of reduced GIP levels in
vivo on glucose homeostasis, bone formation, and fat accumulation in a novel GIP-GFP knock-in
(KI) mouse. We generated GIP-GFP KI mice with a truncated prepro-GIP gene. The phenotype
was assessed in heterozygous and homozygous state in mice on control fat diet (CFD) and high
fat diet (HFD) in vivo and in vitro. Heterozygous GIP-GFP KI mice (GIP-reduced mice: GIPgfp/+
)
exhibited reduced GIP secretion; in homozygous state (GIP-lacking mice: GIPgfp/gfp
), GIP
secretion was undetectable. When fed standard chow, GIPgfp/+
and GIPgfp/gfp
showed mild glucose
intolerance with decreased insulin levels; bone volume was decreased in GIPgfp/gfp
and preserved
in GIPgfp/+
. Under HFD, glucose levels during OGTT were similar in WT, GIPgfp/+
, and
GIP
gfp/gfp,
while insulin secretion remained lower. GIPgfp/+
and GIP
gfp/gfp showed reduced obesity and
reduced insulin resistance, accompanied by higher fat oxidation and energy expenditure. GIP-
reduced mice demonstrate that partial reduction of GIP does not alter extensively glucose
tolerance, but it alleviates obesity and lessens the degree of insulin resistance under HFD
condition, suggesting a potential therapeutic value.
Page 2 of 33Diabetes

3
Keywords: GIP, incretin, bone volume, obesity, insulin resistance
Abbreviations:
GIP gastric inhibitory polypeptide
GLP-1 glucagon-like polypeptide-1
GIPR GIP receptor
GIPRKO GIP receptor knockout
GIP-GFP KI gastric inhibitory polypeptide-green fluorescent protein knock-in
CFD control fat diet
HFD high fat diet
GIPgfp/+
heterozygous GIP-GFP KI
GIPgfp/gfp
homozygous GIP-GFP KI
Page 3 of 33 Diabetes

4
Gastric inhibitory polypeptide (GIP) is a 42-amino acid polypeptide produced by
enteroendocrine K-cells, which are located mainly in the upper parts of the small intestine. Its
main secretagogues are glucose and, even more intensely, fats that reach the intestinal lumen
soon after food intake (1). Following secretion, the hormone exerts its effects through specific, G
protein-coupled receptors located mainly in the stomach, pancreas, central nervous system, bone
and adipose tissue (2, 3). Apart from its role in the inhibition of gastric acid secretion (4), GIP
exhibits potent glucose-dependent insulinotropic action (5, 6), and, therefore, it is classified as an
incretin (3). In addition to its insulinotropic effect, in the absence of which glucose intolerance
develops (7), GIP stimulates islet growth (8) and proliferation of β-cells (9) and reduces β-cell
apoptosis (10, 11). Studies of GIP receptor knockout (GIPRKO) mice (7) describe GIP as an
obesity-promoting factor in high fat diet (HFD) conditions, and show that deletion of GIP
receptor (GIPR) signaling causes resistance to obesity (12) but leads to osteoporosis (13),
revealing an important role of GIP in bone metabolism. However, in these studies, as well in a
model of GIP receptor antagonism (14), the reported changes were focused on disrupted or
blocked GIPR signaling. The condition of reduced GIP secretion and how it affects the
pancreatic and extrapancreatic effects of GIP remain unclear.
The aim of the present study is to explore the potential of reduced GIP levels in vivo and to
define the impact on glucose homeostasis, bone formation, and fat accumulation in a novel GIP-
GFP knock-in (KI) mouse model characterized by truncation of the prepro-GIP gene and
insertion of a Green Fluorescent Protein (GFP) sequence (15). The model was developed for the
purpose of visualization and identification of K-cells, and exhibits reduced or absent GIP
secretion in heterozygous GIP-reduced mice and homozygous or GIP-lacking mice, respectively.
Page 4 of 33Diabetes

5
Establishing the phenotype of the heterozygous, GIP-reduced mouse is important to understand
the possible benefits of limited reduction of GIP secretion.
Research design and methods
Animals. Male GIP-GFP KI mice and wild-type littermates (WT) were used in all experiments.
GIP-GFP KI mice were generated as described previously (15). The animals were maintained in
conditions of 12 h of light cycle and 12 h of dark cycle, with free access to water and food,
unless indicated otherwise. Starting from 7 weeks of age, the mice were divided into two groups:
control fat diet (CFD) group, receiving food with 10% of fat and energy density of 3.8 kcal/g
(Research Diets Inc. New Brunswick, NJ, USA; cat.no.D12450B), and high fat diet (HFD) group,
receiving food with 60% of fat and energy density of 5.2 kcal/g (Research Diets Inc. New
Brunswick, NJ, USA; cat.no.D12492). In total, 6 groups of mice (5-6 mice per group) were used
throughout the study: WT on CFD, heterozygous GIP-GFP KI mice (GIPgfp/+
) on CFD,
homozygous GIP-GFP KI mice (GIPgfp/gfp
) on CFD, WT on HFD, heterozygous GIP-GFP KI
mice (GIPgfp/+
) on HFD and homozygous GIP-GFP KI mice (GIPgfp/gfp
) on HFD. After 8 weeks
of control fat or high fat feeding, the animals were used in the experiments listed below.
Maintenance of the mice and all experimental procedures were approved by Kyoto University
Animal Care Committee.
Expression levels of GIP receptor (GIPR) mRNA. After standard chow feeding or at least 8
weeks of CFD and HFD, mice were sacrificed by cervical dislocation, and pancreas and white
(visceral) adipose tissue were harvested. The white adipose tissue was frozen immediately in
liquid nitrogen and stored at -80⁰C until further use; pancreas was digested using collagenase
method and islets were obtained. Islet mRNA (RNeasy Mini Kit, Qiagen, Hilden, Germany) and
adipose tissue mRNA (RNeasy Lipid Tissue Mini Kit, Qiagen, Hilden, Germany) were extracted
Page 5 of 33 Diabetes

6
and cDNA (complementary DNA) was synthesized by reverse transcription (SuperScript II,
Invitrogen, NY, USA). GIPR mRNA expression levels were quantified by semi-quantitative real-
time polymerase chain reaction (RT-PCR) (Applied Biosystems, AB StepOne Plus Real Time
PCR, Foster City, CA, USA) using GIPR forward and reverse primer with the following
sequence: 5’-CCTCCACTGGGTCCCTACAC-3’(forward primer) and 5’-
GATAAACACCCTCCACCAGTAG-3’ (reverse primer). GAPDH mRNA was used as an
internal control. The sequences of GAPDH forward and reverse primer are as follows: 5’-
AAATGGTGAAGGTCGGTGTG-3’ for the forward primer and 5’-
TCGTTGATGGCAACAATCTC-3’ for the reverse primer.
Measurement of GIP content and protein content. Mice at the age of 6 weeks were sacrificed
by cervical dislocation, intestine samples were taken and washed in phosphate buffer saline
(PBS), weight was measured and, after overnight extraction with 5 ml/g acid ethanol (at 4⁰C),
GIP content was measured by ELISA (Millipore Corp, Bilerica, MA, USA). Protein content was
measured using Bradford Protein Assay (Bio-Rad, Hercules, CA, USA). In brief, dye reagent
was diluted and protein (albumin) standards were made in duplicate. Standards and intestine
samples were loaded on a micro titer plate, incubated at room temperature for 5 min and
absorbance was read at 595 nm. GIP content was expressed as GIP content per protein content.
Bone histomorphometry. Mice at the age of 6 weeks kept on standard chow were prepared for
bone histomorphometry measurement by injecting subcutaneously 25 mg/kg of tetracycline
hydrochloride (Sigma-Aldrich, St.Louis, MO, USA) 4 days before sacrifice and 10 mg/kg of
calcein (Dojindo, Kumamamoto, Japan) 2 days before sacrifice. Animals were sacrificed by
cervical dislocation and tibiae were removed and fixed with 70% ethanol. Further processing of
tibiae samples (muscle removing, dehydration in graded concentration of ethanol, Villanueva
Page 6 of 33Diabetes

7
bone staining and embedding in methyl-metacrylate), preparation of frontal plane sections of
tibiae and bone histomorphometry measurement using semiautomatic image analyzing system
(System Supply, Nagano, Japan) were done by Niigata Bone Science Institute, Niigata, Japan.
Oral glucose tolerance test (OGTT) and measurement of hormones. Following 8 weeks of CFD
and HFD, the mice underwent oral glucose tolerance test (OGTT). The fasting period (overnight
fasting) was begun 19 h prior to the experiment. During the test, blood samples were taken by
heparinized micro-capillary tubes from the orbital sinus of the mice at the following time
intervals: 0 min (fasting levels), 15, 30, 60, and 120 min after glucose administration. Glucose (2
g/kg in mice on standard chow and 1 g/kg in mice on HFD) was given orally, using gavage tube.
Blood glucose levels were measured by glucose oxidase method (Sanwa Kagaku Kenkyusho CO.
LTD., Nagoya, Japan). After collecting the blood samples, they were kept on ice, and then
centrifuged (3000 rpm/10 min/4⁰C) and serum was separated. The serum samples were used
fresh or kept at -80⁰C until further processing. Insulin, total GIP, and total GLP-1 levels were
measured by ELISA as follows: insulin kit (Shibayagi, Gumma, Japan), total GIP kit (Millipore
Corp, Bilerica, MA, USA), and total GLP-1 kit (MSD, Meso Scale Discovery, Rockville, MD,
USA).
Insulin tolerance test (ITT). The mice were fasted 4-6 h before the start of the experiment.
Blood samples were drawn from the orbital sinus using heparinized micro-capillary tubes at the
following time intervals: 0 min (fasting levels), 15, 30, 60, and 120 min after insulin
administration. Human insulin (100 U/ml, Eli Lilly and Co, Indianapolis, IN, USA) was
administered intraperitoneally in a dose of 0.5 U/kg. Blood glucose levels were measured by
glucose oxidase method (Sanwa Kagaku Kenkyusho CO. LTD., Nagoya, Japan).
Page 7 of 33 Diabetes

8
Measurement of body fat composition (measurement of subcutaneous and visceral fat). In
young mice at the age of 7 weeks, or after 8 weeks of CFD or HFD, body fat was measured by
computerized tomography (CT) scan (A La Theta LCT-100, Aloka, Tokyo, Japan). The mice
were anesthetized with intraperitoneal injection of sodium pentobarbital and placed in a
measurement chamber of the CT scanner in supine position. The scanned area of the body was
flanked by xiphisternum and sacrum; the width of scanned slices was 2 mm. Obtained images
were analyzed using A La Theta software, version 1.00 and values of body fat, both
subcutaneous and visceral, were quantified in grams (g).
Indirect calorimetry and mice activity. Mice were kept 6-7 weeks on CFD or HFD and,
afterwards, indirect calorimetry was performed and activity of the mice was measured (ARCO
2000 Mass spectrometer-ARCOSYSTEM Inc, Chiba, Japan). Each mouse was placed in an
individual chamber with free access to water and CFD or HFD. Respiratory quotient (RQ),
energy expenditure (cal/min/kg), fat oxidation (mg/min/kg), and mice activity (counts/min) were
measured every 5 min during 48 h.
In vitro insulin secretion. For measurement of glucose-stimulated insulin secretion (GSIS) in
vitro, islets from mice on CFD and HFD were isolated using collagenase digestion method. In
brief, mice were sacrificed by cervical dislocation; 0.5 mg/ml collagenase dissolved in Hanks
balanced salt solution (HBSS) was injected through the bile duct into the pancreas and, after its
expansion, it was manually isolated and incubated in Krebs-Ringer bicarbonate buffer (KRBB;
120 mM NaCl, 4.7 mM KCl, 1.2 mM MgSO4, 1.2 mM KH2PO4, 2.4 mM CaCl2, 20 mM
NaHCO3) at 37⁰C during 21 min. After homogenizing the pancreas with KRBB, the islets were
separated by centrifugation in ficoll gradient. Separated islets were resuspended in KRBB on a
dish and handpicked under light microscope. For GSIS assessment, three batches of different
Page 8 of 33Diabetes

9
glucose concentrations were prepared: 5.5 mM glucose, 11.1 mM glucose, and 11.1 mM glucose
+ 100 nM GIP-human (Peptide Institute Inc., Osaka, Japan). For each sample containing 500 µl
of incubation medium (KRBB; 2M 4-(2-hydroxyethyl)-1-piperazine ethane sulfonic acid
(HEPES) pH 7.4; 0.2% Bovine Serum Albumin), 10 islets were handpicked in a volume of 200
µl of KRBB and incubated at 37⁰C during 30 min (following pre-incubation in same conditions).
For measurement of insulin content in islets of HFD-fed mice, samples were incubated overnight
with 5 ml/g acid ethanol (at 4⁰C). Insulin concentration and insulin content were measured using
radioimmunoassay (RIA) (Aloka Accuflex γ 7000, Hitachi, Tokyo, Japan).
Measurement of β-cell area. Whole pancreas was isolated manually from mice kept on CFD
and HFD for 8 weeks. All isolated organs were fixed in Bouin’s solution, afterwards washed
with 50% ethanol once per day during 1 week and finally, embedded in paraffin. Every fifth
section of the pancreas was used for analysis. In total, three sections (slides) per pancreas (per
mouse) were analyzed. The paraffin slides were deparaffinized with lemosol, rehydrated with
100% and 70% ethanol, blocked by 3% peroxidase and incubated overnight (at 4⁰C) in a
humidified chamber with polyclonal rabbit anti-insulin antibody (Santa Cruz Biotechnology,
Santa Cruz, USA) and conjugated with fluorescent secondary antibody the next day. After
immunostaining, all slides were analyzed by immunofluorescent microscope (Keyence Corp.,
Osaka, Japan) using BZ Analyzer software. The area of the whole pancreas and the area of
insulin-immunopositive cells were measured at the same time. The β-cell area was expressed as
β-cell area/total pancreas area in all analyzed slides.
Statistics. All results are expressed as mean ± SE. Statistical analyses were performed using
ANOVA with Tukey’s test and P values <0.05 were considered statistically significant.
Page 9 of 33 Diabetes

10
Results
1. GIP reduction in GIP-GFP KI mice
The main genetic trait of GIP-GFP KI mice is alteration (truncation) of the prepro-GIP gene
coupled with insertion of GFP coding sequence (15). In mice kept on standard chow, assessment
of GIP mRNA levels in the small intestine showed reduced levels in heterozygous GIP-GFP KI
mice (GIPgfp/+
) (p<0.05), while in homozygous mice (GIPgfp/gfp
), GIP mRNA could not be
detected (p<0.05, p<0.01) (Fig.1A). Small-intestinal GIP content was reduced in GIPgfp/+
(p<0.05) and was undetectable in GIPgfp/gfp
(p<0.01) when compared to wild-type mice (WT).
Total GIP levels during OGTT (Fig.1B) as well as GIP secretion (as shown by area under the
curve of GIP (AUC-GIP)) (Fig.1C) were reduced by ~50% in GIPgfp/+
(p<0.01) and were below
the lower limit of detection in GIP gfp/gfp
(p<0.001) in comparison to control (WT) (the lower
detection limit of ELISA total GIP levels kit was 8.2 pg/ml).
2. Body weight progression, glucose tolerance, and β-cell profile following GIP reduction
in standard chow-fed mice
Starting from 4 weeks of age, the body weight of weaning mice fed standard chow
(containing 10% of fat) was recorded and it showed no changes among WT, GIPgfp/+
, and
GIPgfp/gfp
(Fig. 2A). Measurement of body fat composition (body fat) in the 7th
week of age (just
before placing the mice on HFD) revealed similar amount of body fat in all mice (Fig.2B).
During OGTT, blood glucose levels were higher in GIPgfp/+
than those in WT at 30 min (p<0.05),
whereas in GIPgfp/gfp
glucose elevation persisted at 30 and 60 min (p<0.05) (Fig.2C). Meanwhile,
insulin levels in both GIPgfp/+
and GIPgfp/gfp
remained lower in comparison to WT, especially at
15 and 30 min after glucose load (p<0.05) (Fig.2D). In vitro measurement of insulin secretion
(Fig.2E) showed a similar pattern of secretion in all types of mice at 5.5 mM glucose, as well as
Page 10 of 33Diabetes

11
at 11.1 mM glucose. When challenged with 100 nM of human GIP peptide together with 11.1
mM glucose, the islets of GIP-GFP KI mice, both GIPgfp/+
and GIPgfp/gfp
, exhibited a similar
insulin response to that of WT. GIP receptor mRNA levels in β-cells remained unchanged in
GIP-GFP KI mice when compared to control (Fig.2F). mRNA expression of preproglucagon,
peptide YY, cholecystokinin, somatostatin, and secretin in the small intestine showed no
differences in GIP-GFP KI mice in comparison to WT (data not shown). Plasma GLP-1 levels
during OGTT did not differ among the three types of mice (WT = 15.54 + 6.8 pg/ml, GIPgfp/+
=
11.83 + 4.97 pg/ml, GIPgfp/gfp
= 18.54 + 3.96 pg/ml at 15 min after OGTT).
Body weight follow-up of mice on CFD in a period of 8 weeks (starting at the age of 7
weeks) showed that the body weight progression did not differ among all three groups of mice
(Supplementary figure 1A). The overall glucose response to 0.5 U/kg of human insulin (ITT
data) was similar in WT, GIPgfp/+
, and GIPgfp/gfp
at almost all time points of the experiment (at 60
min of ITT GIPgfp/gfp
mice had lower blood glucose when compared to WT) (Supplementary
figure 1B).
3. Bone formation in conditions of standard chow feeding
Following GIP reduction, the bone volume in GIPgfp/+
was similar to that in WT, whereas
GIPgfp/gfp
had reduced bone volume (p<0.05) (Fig.3A). Furthermore, the number of trabeculae in
GIPgfp/+
showed no changes when compared to WT, while GIPgfp/gfp
exhibited a decrease
(p<0.05) (Fig.3C), as demonstrated by the images of proximal tibial sections (Fig.3B). Although
osteoblast surface was decreased in GIPgfp/+
in comparison to WT (p<0.05) (Fig.3D), the bone
formation rate (Fig.3F) remained unchanged in these mice. Osteoclast surface was increased in
GIPgfp/gfp
(p<0.05) when compared to WT, while in GIPgfp/+
it remained similar to WT (Fig.3E).
4. Induction of metabolic stress by HFD
Page 11 of 33 Diabetes

12
Figures 4 and 5 describe the phenotype changes induced by HFD feeding for 8 weeks (56
days). Starting from the second week of HFD, WT mice steadily increased their body weight
(p<0.001) in comparison to the lean control (Fig.4A), while within the HFD group, GIPgfp/+
showed lesser body weight gain (p<0.01 at 2nd
week; p<0.001 at 8th
week) than WT; GIPgfp/gfp
exhibited lowest body weight gain (p<0.001 at 2nd
week; p<0.001 at 8th
week vs. WT HFD). Ad
libitum glucose levels were measured at the same time, once per week, and the overall glucose
levels in all mice remained similar (Fig.4B). Food and water intake were similar in all groups of
mice (data not shown).
During OGTT, total GIP levels and GIP secretion were increased 2-fold in WT on HFD
(p<0.001) as compared to the lean control; in HFD-fed mice, GIPgfp/+
exhibited decreased levels
(p<0.05), while GIPgfp/gfp
showed an absence of GIP (p<0.001) (Fig.4C and 4D). Fasting glucose
levels in WT on HFD were higher (p<0.01) when compared to their lean littermates; on HFD
background, glucose levels remained similar in all mice (Fig.4E). The overall insulin response
(Fig.4F) in WT on HFD was more intense than that of the control mice, and, within the HFD
group, the insulin levels of GIPgfp/+
remained lower in comparison to WT (p<0.05), while
GIPgfp/gfp
showed the lowest insulin levels (p<0.01, p<0.001). Insulin secretion in vitro (Fig.4G)
was similar among all mice on CFD and HFD in the presence of 5.5 mM glucose. In response to
11.1 mM glucose, WT on HFD had higher insulin secretion compared to WT on CFD, whereas
in the HFD group similar levels were found in WT and GIPgfp/+
, coupled with lower insulin in
GIPgfp/gfp
(p<0.05 vs. WT HFD, p<0.01 vs. GIPgfp/+
). When 100 nM of human GIP peptide were
added to 11.1 mM glucose, insulin secretion remained lower in GIPgfp/gfp
on HFD (p<0.01).
Measurement of β-cell area, as expressed by the ratio of β-cell area/total pancreas area, showed
tendency to an increase observed in HFD-fed mice, relative to the lean mice, although the
Page 12 of 33Diabetes
13
difference was not statistically significant. However, within HFD group, β-cell area remained
similar in WT and GIPgfp/+
, while GIPgfp/gfp
exhibited decreased β-cell area (p<0.05) (Fig.4H).
The expression levels of GIP receptor (GIPR) mRNA in the islets were similar in WT mice on
CFD and HFD, as well as in GIPgfp/+
on HFD, while in GIPgfp/gfp
they were reduced (p<0.01 vs.
GIPgfp/+
) (Fig.4I).
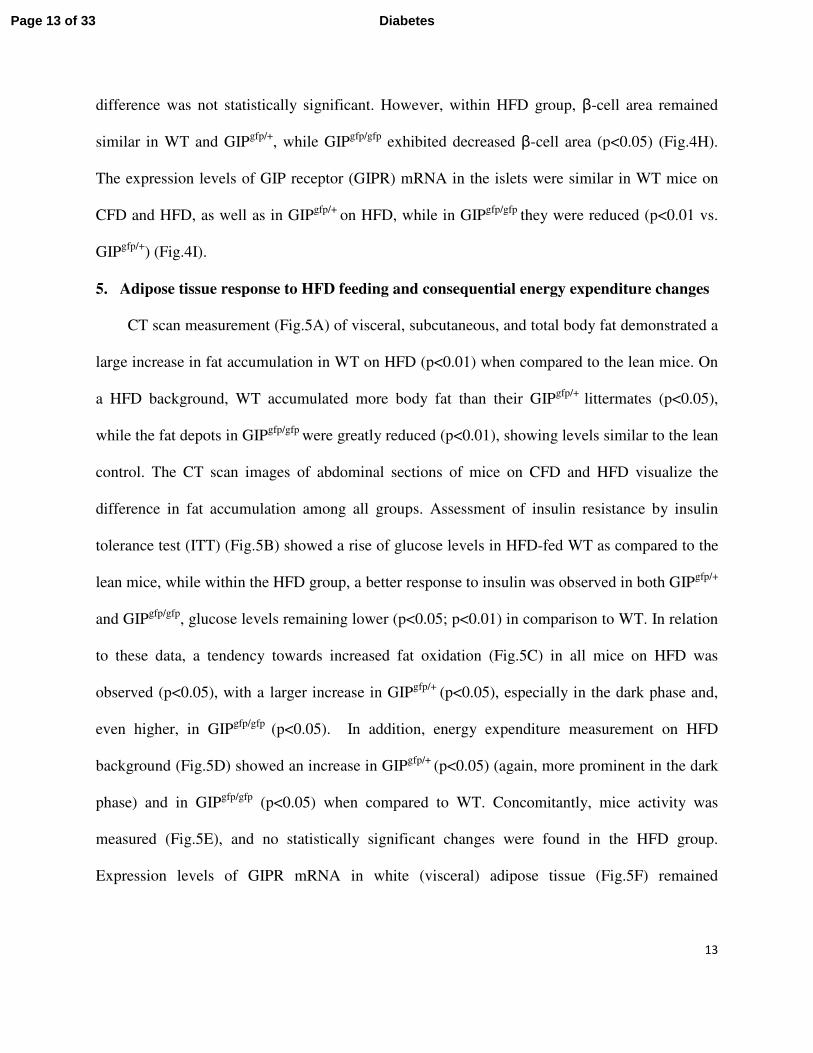
5. Adipose tissue response to HFD feeding and consequential energy expenditure changes
CT scan measurement (Fig.5A) of visceral, subcutaneous, and total body fat demonstrated a
large increase in fat accumulation in WT on HFD (p<0.01) when compared to the lean mice. On
a HFD background, WT accumulated more body fat than their GIPgfp/+
littermates (p<0.05),
while the fat depots in GIPgfp/gfp
were greatly reduced (p<0.01), showing levels similar to the lean
control. The CT scan images of abdominal sections of mice on CFD and HFD visualize the
difference in fat accumulation among all groups. Assessment of insulin resistance by insulin
tolerance test (ITT) (Fig.5B) showed a rise of glucose levels in HFD-fed WT as compared to the
lean mice, while within the HFD group, a better response to insulin was observed in both GIPgfp/+
and GIPgfp/gfp
, glucose levels remaining lower (p<0.05; p<0.01) in comparison to WT. In relation
to these data, a tendency towards increased fat oxidation (Fig.5C) in all mice on HFD was
observed (p<0.05), with a larger increase in GIPgfp/+
(p<0.05), especially in the dark phase and,
even higher, in GIPgfp/gfp
(p<0.05). In addition, energy expenditure measurement on HFD
background (Fig.5D) showed an increase in GIPgfp/+
(p<0.05) (again, more prominent in the dark
phase) and in GIPgfp/gfp
(p<0.05) when compared to WT. Concomitantly, mice activity was
measured (Fig.5E), and no statistically significant changes were found in the HFD group.
Expression levels of GIPR mRNA in white (visceral) adipose tissue (Fig.5F) remained
Page 13 of 33 Diabetes

14
unchanged in all animals on CFD and HFD, except for GIP gfp/gfp
, in which the levels were
elevated (p<0.05).
Discussion
Studies in single and double incretin receptor knock-out mice (DIRKO) (16) have shown
that although secretion of GIP and GLP-1 is triggered by different factors, they have an additive
stimulating effect on β-cells with regard to insulin secretion, with GIP accounting for the larger
portion of the total incretin effect in male mice. Furthermore, human data demonstrated that after
oral glucose load of 75 g and after mixed meal load (17, 18), secretion of GIP is more
pronounced than GLP-1 secretion, suggesting that GIP may play a more potent role in regulation
of postprandial insulin secretion in non-diabetic conditions. We have generated GIP-GFP KI
mice characterized by truncation of the prepro-GIP gene and insertion of GFP coding sequence
that leads to reduced GIP production in heterozygous state and absence of GIP production in
homozygous state. GIPgfp/gfp
exhibit a phenotype similar to GIPRKO mice regarding glucose
tolerance, bone formation, and adipose tissue expansion (Table 1). However, GIPgfp/+
represent a
novel mouse model in which GIP, despite its secretion being reduced by half, maintains glucose
levels similar to controls (Fig. 4B and Fig.4E) and lessens insulin resistance in high fat diet-
induced obesity (Fig.4F and Fig.5B).
When fed standard chow, GIP-lacking mice (GIPgfp/gfp
), similarly to GIPRKO mice, had
higher glucose excursions accompanied with insufficient production of insulin during OGTT
(Table 1). In spite of having reduced, but still present GIP secretion, GIP-reduced mice (GIPgfp/+
)
also showed mild glucose intolerance and lower insulin secretion, confirming the potent
insulinotropic effect of GIP (Fig.2C, Fig. 2D, and Table 1). Furthermore, insulin secretion tests
in vitro demonstrated a similar pattern of secretion in all groups of mice. Measurement of mRNA
Page 14 of 33Diabetes

15
expression levels of GIPR in the islets showed no changes among all groups of mice, indicating
the presence of functional GIP receptors.
Similarly to GIP-lacking and GIP-reduced mice, rat GIP promoter-diphtheria toxin A
chain transgenic mice (GIP/DT) exhibit glucose intolerance, in their case very profound, with
complete abolition of the incretin effect, and show similarities in phenotype under high fat diet
conditions (19). In this mouse model (GIP/DT), forced expression of attenuated diphtheria toxin
was established under rat GIP promoter, leading to isolated ablation of GIP-producing cells and,
subsequently, absence of GIP mRNA transcripts and absence of circulating GIP levels. However,
there are reports confirming the existence of double incretin-positive cells (K/L cells) in the
intestine (20) and an existence of populations of K-cells that co-express not only GIP but also
glucagon, somatostatin, secretin and, to a smaller extent, some other hormones as well (21, 22).
Therefore, ablation of K-cells might affect the number and/or distribution of these cell
populations and could influence the accurate assessment of secretion of various intestinal
hormones. In the case of GIP-GFP KI mice, the truncation of the prepro-GIP gene and
expression of GIP-GFP fusion protein were driven by native GIP promoter, enabling selective
changes in K-cells that affect only GIP secretion and, even more importantly, control of the
levels of GIP production. The expression levels of mRNA of the intestinal hormones
preproglucagon, peptide YY, cholecystokinin, somatostatin and secretin were not changed,
confirming that GIP reduction did not interfere with their gene expression.
There are reports demonstrating that GIP induces GLP-1 secretion (23, 24). Previously
conducted studies of disrupted or blocked GIPR signaling (7, 16, and 19) did not show
information regarding the secretion of GLP-1. In our study, plasma GLP-1 levels remained
unchanged in GIP-GFP KI mice, as reported earlier in a model of GIPR antagonism (14),
Page 15 of 33 Diabetes

16
indicating that reduction of GIP secretion does not affect GLP-1 secretion. Overall, GIP-reduced
mice kept on standard chow after birth did not exhibit visible abnormalities regarding mating
potential, pregnancy, offspring viability, growth, organ composition, and feeding behavior (data
not shown). Measurement of their body weight from the beginning of the weaning period
(Fig.2A) until just before the shift to high fat diet (HFD), as well as longer term measurement
(Supplementary figure 1A), showed that they are not different from their wild type littermates
when fed standard diet. Body fat measured before the start of the HFD was similar between WT
and GIP-GFP KI mice. Insulin tolerance test showed that their insulin sensitivity remained
similar to the WT mice (Supplementary figure 1B).
In addition to its insulinotropic role, GIP is involved in modulation of bone formation. There are
GIP-specific receptors located on osteoblasts (25) and osteoclasts (26). GIP operates as an
anabolic hormone in the bone, where it stimulates incorporation of meal-derived Ca2+
into bone
and bone building (13) and reduces bone absorption by inhibiting osteoclastic activity. Studies in
GIPRKO mice have shown that the absence of GIPR signaling leads to significant osteoporosis
due to lower osteoblast and higher osteoclast action (13). Similarly to GIPRKO mice, GIP-
lacking mice also showed signs of osteoporosis, manifested by reduced bone volume, reduced
number of trabeculae and increased osteoclast surface. On the other hand, GIP-reduced mice
maintained normal bone volume and bone trabeculae, and, despite the exhibited reduction of
osteoblast surface, no increased osteoclast activity was observed. More importantly, the bone
formation rate remained normal, indicating that reduction of GIP by ~50% does not significantly
impair the beneficial role of GIP in bone formation. Considering the glucose intolerance of these
mice, it appears that reduction of GIP secretion more profoundly affects the insulin-potentiating
Page 16 of 33Diabetes

17
role of GIP, indicating differing regulatory mechanisms of GIP action in β-cells and in bone
(Table 1).
To better understand the extent of the phenotypic consequences following GIP reduction,
we induced chronic metabolic stress by feeding the mice with high fat diet (HFD). Previous
reports indicate a strong connection between GIP secretion and obesity in high fat diet-feeding
conditions (27). High caloric intake causes hypersecretion of GIP (12, 28, and 29) due to
hyperexpression of the GIP gene (15) and a subsequent rise in insulin secretion (30), leading to
increased fat deposition in the adipose tissue and expansion of fat depots (31, 32). GIP increases
the adipose tissue volume directly (33, 34) by binding to its receptors located on the adipocytes
and indirectly by potentiating β-cell secretion of insulin, which is known to be involved in
adipocyte fat deposition (35). In our study, HFD-feeding for at least 8 weeks resulted in absence
of circulating GIP levels in GIP-lacking mice (consistent with data from standard chow-fed
mice), while in GIP-reduced mice, reduction of GIP was similar to the levels observed in lean
WT and was lower when compared to WT on HFD. The most obvious consequence of HFD was
a change in body weight and fat mass in WT and GIP-GFP KI mice (Fig.4A, Fig.5A, and Table
1). While WT showed overt obesity, GIP-lacking mice retained their body weight and fat mass
at levels similar to those of their lean littermates, as previously reported in GIPRKO mice, in
mice with K-cell ablation (19), and in mice with chemical inhibition of GIPR signaling (14).
GIP-reduced mice also maintained lower body weight throughout the experiment period of 56
days, indicating that while the lack of body weight gain and fat mass was not as evident as it was
in GIP-lacking mice, the reduced obesity was nevertheless important. Moreover, the glucose
response to insulin during ITT showed lower levels in both GIP-reduced and GIP-lacking mice
fed HFD, indicating that not only complete, but also partial reduction of GIP alleviates insulin
Page 17 of 33 Diabetes

18
resistance while reducing obesity. Thus, a reduction of GIP secretion as shown in GIP-reduced
mice mitigates both direct and indirect actions of GIP on adipose tissue and leads to reduced
diet-induced obesity.
Glucose levels measured ad libitum throughout most of the experiment period were similar
in WT mice and GIP-GFP KI mice, and glucose excursions during OGTT remained similar as
well in all mice under HFD condition. However, all HFD-fed mice had higher OGTT glucose
levels when compared to the lean controls, suggesting that when metabolic stress was introduced,
glucoregulation was similarly achieved in conditions of normal and reduced GIP production. At
the same time, the circulating insulin levels were lower in GIP-lacking and GIP-reduced mice
than those of WT on HFD, accompanied by decreased insulin resistance (Fig.5B and Table 1).
This data is in line with a previous study examining the role of insulin in obesity and showing
that on an obese background, reduction of insulin not necessarily causes severe disturbance in
blood glucose levels (36). The origins of the reduced insulin secretion are associated not only
with reduced GIP signaling in β-cells, but with changes in their area as well. While GIP-reduced
mice had similar β-cell area to their WT counterparts on HFD, GIP-lacking mice had clearly less
β-cells. Furthermore, in vitro islet studies found that the responsiveness of β-cells to glucose in
GIP-reduced mice was similar to that in WT on HFD and was higher than that of the control
mice. On the other hand, GIP-lacking mice had reduced insulin response to glucose, suggesting
that reduction of GIP secretion might affect the ability of β-cells to respond adequately to GIP,
but not as profoundly as in cases of complete absence of GIP secretion or GIPR signaling.
Measurement of GIPR mRNA levels in the islets revealed similar values in WT and GIP-reduced
mice, while GIP-lacking mice exhibited decreased expression of GIPR mRNA. GIPR mRNA
expression levels in the adipose tissue did not show changes in WT and GIP-reduced mice but,
Page 18 of 33Diabetes

19
interestingly, they were increased in GIP-lacking mice, which is inconsistent with the islet data.
Although previous studies have extensively addressed disruption of GIPR signaling, our GIP-
lacking mice show for the first time a condition of complete lack of GIP secretion from intact K-
cells and might be useful in further studies.
We have investigated the mechanism of regulation of glucose homeostasis and reduced
obesity in GIP-GFP KI on HFD. Previously, we reported an increase in fat oxidation and energy
expenditure in GIPRKO mice fed HFD for a short period (37) and in GIPRKO mice with
diminished insulin signaling (insulin receptor substrate 1 (IRS1) KO/GIPRKO mice) (38),
indicating that increased fat oxidation accounts for the reduction of obesity in the absence of
GIPR signaling. The present study has demonstrated increased fat oxidation in GIP-reduced, and,
even more intensely, in GIP-lacking mice. This phenomenon might occur due to increased
adiponectin levels via peroxisome proliferator-activated receptor alpha (PPARα) levels in the
adipose tissue (37) or due to increased activity of the enzymes involved in beta oxidation in liver,
such as cluster of differentiation 36 (CD36) and mitochondrial uncoupling protein 2 (UCP2)
(38).GIP-lacking and GIP-reduced mice also exhibited higher energy expenditure on HFD. There
are reports showing that increased energy expenditure is coupled with increased locomotor
activity; disruption of GIPR signaling increases mice activity not only in high fat diet conditions,
as in mice treated with GIPR antagonist (14) and GIPRKO mice (12), but leads to increased
spontaneous activity even during standard diet feeding, as described in DIRKO mice (29) and in
adult or aged GIPRKO mice (39, 40). Consistent with these data, GIP-lacking and GIP-reduced
mice also exhibited a tendency toward increased mice activity, especially in the dark phase,
although without statistically significant difference.
Page 19 of 33 Diabetes

20
In conclusion, our data suggest that reduction of GIP secretion in vivo confirms the potent
role of GIP in insulin secretion and leads to reduced obesity and reduced insulin resistance in
high fat diet conditions without severely impairing glucose homeostasis and without disrupting
the role of GIP in bone formation. These findings are potentially promising of a new therapeutic
approach to obesity and type 2 diabetes mellitus.
Acknowledgements
The authors thank Mr. Shoichi Asano and Dr. Xibao Liu from the Department of Diabetes,
Endocrinology and Nutrition, Graduate School of Medicine, Kyoto University, for their technical
support regarding the study. This study was supported by Scientific Research Grants from the
Ministry of Education, Culture, Sports, Science, and Technology, Japan, and from the Ministry
of Health, Labor, and Welfare, Japan.
D.N., N.H., K.Su., S.Y., A.H., E.J., K.I., K.Sh., and T.H. have no conflict of interest to disclose.
N.I. served as a medical advisor for Takeda, Taisho Pharmaceutical, GlaxoSmithKline,
Mitsubishi Tanabe Pharma, he lectured for MSD, Sanofi, Novartis Pharma, Dainippon
Sumitomo Pharma, Kyowa Kirin, and Mitsubishi Tanabe Pharma, and received payment for his
services. N.I. also received a clinical commissioned/joint research grant from MSD, Eli Lilly
Japan, Shiratori Pharmaceutical, Roche Diagnostics, and the Japan Diabetes Foundation, and
also received a scholarship grant from MSD, JT, Nippon Boehringer Ingelheim, Takeda,
Dainippon Sumitomo Pharma, Astellas Pharma, Daiichi-Sankyo, and Mitsubishi Tanabe Pharma.
D.N. researched the data, contributed to discussion, wrote, reviewed and edited the manuscript.
N.H. contributed to discussion, reviewed and edited the manuscript. K.Su., S.Y., A.H., E.J., K.I.,
K.Sh., and T.H. contributed to discussion. N.I contributed to discussion, reviewed and edited the
manuscript.
Page 20 of 33Diabetes

21
N.I. is the guarantor of this work and, as such, had full access to all the data in the study and
takes responsibility for the integrity of the data and the accuracy of the data analysis.
Parts of the study were presented in an abstract form at the 47th
Annual Meeting of the European
Association for the study of Diabetes in Lisbon, Portugal, 12-16 September 2011, at the 48th
Annual Meeting of the European Association for the study of Diabetes in Berlin, Germany, 1-5
October 2012, and at the 73rd
Scientific Sessions of the American Diabetes Association in
Chicago, Illinois, 21-25 June 2013.
References:
1. Krarup T, Holst JJ, Lindorf Larsen K. Responses and molecular heterogeneity of IR-GIP
after intraduodenal glucose and fat. Am J Physiol. 1985; 249 (2 Pt 1): E195-E200.
2. Flatt PR. Dorothy Hodgkin Lecture 2008 Gastric inhibitory polypeptide (GIP) revisited: a
new therapeutic target for obesity–diabetes? Diabetic Med. 2008; 25 (7): 759-764.
3. Baggio LL, Drucker DJ. Biology of incretins: GLP-1 and GIP. Gastroenterology. 2007;
132 (6): 2131-2157.
4. Pederson RA, Brown JC. Inhibition of histamine-, pentagastrin-, and insulin-stimulated
canine gastric secretion by pure "gastric inhibitory polypeptide”. Gastroenterology. 1972;
62 (3): 393-400.
5. Dupre J, Ross SA, Watson D, Brown JC. Stimulation of insulin secretion by gastric
inhibitory polypeptide in man. J Clin Endocrinol Metab. 1973; 37 (5): 826-828.
6. Yamada Y, Miyawaki K,Tsukiyama K, Harada N, Yamada C, Seino Y. Pancreatic and
extrapancreatic effects of gastric inhibitory polypeptide. Diabetes. 2006; 55, Supplement
2, S86-S91.
7. Miyawaki K, Yamada Y, Yano H et al. Glucose intolerance caused by a defect in the
entero-insular axis: A study in gastric inhibitory polypeptide receptor knockout mice. P
Natl Acad Sci USA. 1999; 96 (26): 14843-14847.
8. Herbach N, Bergmayr M, Göke B, Wolf E, Wanke R. Postnatal development of numbers
and mean sizes of pancreatic islets and beta-cells in healthy mice and GIPRdn
transgenic
diabetic mice. PLos ONE. 2011; 6 (7): e22814.
9. Renner S, Fehlings C, Herbach N et al. Glucose intolerance and reduced proliferation of
pancreatic β-cells in transgenic pigs with impaired glucose-dependent insulinotropic
peptide function. Diabetes. 2010; 59 (5): 1228-1238.
10. Kim SJ, Winter K, Nian C, Tsuneoka M, Koda Y, McIntosh CH. Glucose-dependent
insulinotropic polypeptide (GIP) stimulation of pancreatic β-cell survival is dependent
upon phosphatidylinositol 4-kinase (PI3K)/protein kinase B (PKB) signaling, inactivation
of the forkhead transcription factor Foxo1, and downregulation of bax expression. J Biol
Chem. 2005; 280 (23): 22297-22307.
Page 21 of 33 Diabetes

22
11. Widenmaier SB, Kim SJ, Yang GK et al. A GIP receptor agonist exhibits β-cell anti-
apoptotic actions in rat models of diabetes resulting in improved β-cell function and
glycemic control. PLoS One. 2010; 5 (3): e9590.
12. Miyawaki K, Yamada Y, Ban N et al. Inhibition of gastric inhibitory polypeptide
signaling prevents obesity. Nat Med. 2002; 8 (7): 738-742.
13. Tsukiyama K, Yamada Y, Yamada C et al. Gastric inhibitory polypeptide as an
endogenous factor promoting new bone formation after food ingestion. Mol Endocrinol.
2006; 20 (7): 1644-1651.
14. McClean PL, Irwin N, Cassidy RS, Holst JJ, Gault VA, Flatt PR. GIP receptor
antagonism reverses obesity, insulin resistance, and associated metabolic disturbances
induced in mice by prolonged consumption of high-fat diet. Am J Physiol Endocrinol
Metab. 2007; 293 (6): E1746-E1755.
15. Suzuki K, Harada N, Yamane S et al. Transcriptional regulatory factor X6 (Rfx6)
increases gastric inhibitory polypeptide (GIP) expression in enteroendocrine K-cells and
is involved in GIP hypersecretion in high fat diet-induced obesity. J Biol Chem. 2013;
288 (3): 1929-1938.
16. Preitner F, Ibberson M, Franklin I et al. Gluco-incretins control insulin secretion at
multiple levels as revealed in mice lacking GLP-1 and GIP receptors. J Clin Invest. 2004;
113 (4): 635-645.
17. Yamane S, Harada N, Hamasaki A et al. Effects of glucose and meal ingestion on incretin
secretion in Japanese subjects with normal glucose tolerance. J Diabetes Invest. 2012; 3
(1) 80-85.
18. Vollmer K, Holst JJ, Baller B et al. Predictors of incretin concentrations in subjects with
normal, impaired, and diabetic glucose tolerance. Diabetes. 2008; 57 (3): 678-687.
19. Althage MC, Ford EL, Wang S, Tso P, Polonsky KS, Wice BM. Targeted ablation of
glucose-dependent insulinotropic polypeptide-producing cells in transgenic mice reduces
obesity and insulin resistance induced by high fat diet. J Biol Chem. 2008; 283 (26):
18365-18376.
20. Fujita Y, Chui JWY, King DS et al. Pax6 and Pdx1 are required for production of
glucose-dependent insulinotropic polypeptide in proglucagon-expressing L cells. Am J
Physiol Endocrinol Metab. 2008; 295 (3): E648-E657.
21. Parker HE, Habib AM, Rogers GJ, Gribble F, Reimann F. Nutrient-dependent secretion
of glucose-dependent insulinotropic polypeptide from primary murine K cells.
Diabetologia. 2009; 52 (2): 289-298.
22. Habib AM, Richards P, Cairns LS et al. Overlap of endocrine hormone expression in the
mouse intestine revealed by transcriptional profiling and flow cytometry. Endocrinology.
2012; 153 (7): 3054-3065.
23. Brubaker PL. Regulation of intestinal proglucagon-derived peptide secretion by intestinal
regulatory peptides. Endocronology. 1991; 128 (6): 3175-3182.
24. Roberge JN, Brubaker PL. Regulation of proglucagon-derived peptide secretion by
glucose-dependent insulinotropic peptide in a novel enteroendocrine loop. Endocrinology.
1992; 133 (1): 233-240.
25. Pacheco-Pantoja EL, Ranganath LR, Gallager JA, Wilson PJM, Fraser WD. Receptors
and effects of gut hormones in three osteoblastic cell lines. BMC Physiol. 2011; 11:12 1-
14.
Page 22 of 33Diabetes

23
26. Zhong Q, Itokawa T, Sridhar S et al. Effects of glucose-dependent insulinotropic peptide
on osteoclast function. Am J Physiol Endocrinol Metab. 2007; 292 (2): E543-E548.
27. Kieffer TJ. GIP or not GIP? That is the question. Trends Pharmacol Sci 2003; 24(3):110-
2.
28. Creutzfeldt W, Ebert R, Willms B et al. Gastric inhibitory polypeptide (GIP) and insulin
in obesity: increased response to stimulation and defective feedback control of serum
levels. Diabetologia. 1978; 14 (1): 15-24.
29. Hansotia T, Maida A, Flock G et al. Extrapancreatic incretin receptors modulate glucose
homeostasis, body weight, and energy expenditure. J Clin Invest. 2007; 117 (1): 143-152.
30. Harada N, Yamada Y, Tsukiyama K et al. A novel GIP receptor splice variant influences
GIP sensitivity of pancreatic beta-cells in obese mice. Am J Physiol Endocrinol Metab.
2008; 294 (1): E61-E68.
31. Harada N, Hamasaki A, Yamane S et al. Plasma gastric inhibitory polypeptide and
glucagon-like peptide-1 levels after glucose loading are associated with different factors
in Japanese subjects. J Diabetes Invest. 2011; 2 (3): 193-199.
32. Seino Y, Yabe D. Glucose-dependent insulinotropic polypeptide and glucagon-like
peptide-1: Incretin actions beyond the pancreas. J Diabetes Invest. 2013; 4 (2): 108-130.
33. Knapper JME, Puddicombe SM, Morgan LM, Fletcher JM. Investigations into the actions
of glucose-dependent insulinotropic polypeptide and glucagon-like peptide-1 (7-36) on
lipoprotein lipase activity in explants of rat adipose tissue. J Nutr. 1995; 125: 183-188.
34. Song DH, Getty-Kaushik L, Tseng E, Simon J, Corkey BE, Wolfe MM. Glucose-
dependent insulinotropic polypeptide enhances adipocytes development and glucose
uptake in part through Akt activation. Gastroenterology. 2007; 133 (6): 1796-1805.
35. Parkin SM, Walker K, Ashby P, Robinson DS. Effects of glucose and insulin on the
activation of lipoprotein lipase and on protein synthesis in rat adipose tissue. Biochem J.
1980; 188 (1): 193-199.
36. Mehran AE, Templeman NM, Brigidi GS et al. Hyperinsulinemia drives diet-induced
obesity independently of brain insulin production. Cell Metab 2012; 16(6):723-37.
37. Naitoh R, Miyawaki K, Harada N et al. Inhibition of GIP signaling modulates
adiponectin levels under high-fat diet in mice. Biochem Biophys Res Commun. 2008;
376 (1): 21-25.
38. Zhou H, Yamada Y, Tsukiyama K et al. Gastric inhibitory polypeptide modulates
adiposity and fat oxidation under diminished insulin action. Biochem Biophys Res
Commun. 2005; 335 (3): 937-942.
39. Faivre E, Gault VA, Thorens B, Hölscher C. Glucose-dependent insulinotropic
polypeptide receptor knockout mice are impaired in learning, synaptic plasticity and
neurogenesis. J Neurophysiol. 2011; 105 (4): 1574-1580.
40. Yamada C, Yamada Y, Tsukiyama K et al. Genetic inactivation of GIP signaling reverses
aging-associated insulin resistance through body composition changes. Biochem Biophys
Res Commun. 2007; 364 (1): 175-180.
Page 23 of 33 Diabetes

24
Figure legends:
Figure 1. GIP reduction in GIP-GFP KI mice. Following measurements were conducted in
small intestine of WT, GIPgfp/+
and GIPgfp/gfp
mice: assessment of GIP mRNA levels (expressed
as GIPR mRNA/GAPDH mRNA) and GIP content (expressed as GIP/protein content) (A). Total
GIP levels (B) and GIP secretion (AUC-GIP) (C) were measured during OGTT (glucose 2g/kg
of body weight). n=5-6 per group. WT mice are represented by white bars and white circles,
GIPgfp/+
mice by black bars and black squares, and GIPgfp/gfp
mice by gray bars and gray triangles.
*p<0.05, **p<0.01, ***p<0.001.
Figure 2. Body weight, glucose tolerance and β-cell profile following GIP reduction in
standard chow-fed mice
Body weight (A) of weaning mice (4 weeks-old) was measured starting from the beginning of
the weaning period until the age of 8 weeks (body weight in the 7th
week of age was not
measured due to CT scan measurement and post-anesthesia recovery period). Body fat (B) was
measured by CT scan in the 7th
week of age. Glucose (C) and insulin levels (D) were measured
during OGTT (glucose load of 2g/kg of body weight). In vitro insulin secretion from isolated
islets (E) was measured in conditions of 5.5 mM glucose, 11.1 mM glucose, and 11.1 mM
glucose + 100 nM human GIP peptide. GIP receptor mRNA levels in islets (F) were expressed as
GIPR mRNA/GAPDH mRNA. n= 5-6 mice or samples per group; 10 islets per sample. WT mice
are represented by white circles and white bars, GIPgfp/+
mice by black squares and black bars,
and GIPgfp/gfp
mice by gray triangles and gray bars. *p<0.05, **p<0.01 vs. WT; #p<0.05 vs.
GIPgfp/+
mice.
Figure 3. Bone formation in conditions of standard chow feeding. Following parameters were
measured by bone histomorphometry: bone volume (expressed as bone volume %) (A),
Page 24 of 33Diabetes

25
trabeculae number (expressed as number/mm) (C), osteoblast surface (%) (D), osteoclast surface
(%) (E), and bone formation rate (%/year) (F). Images display trabeculae of proximal tibial
sections (B) taken from 6 weeks-old mice. n=5-6 per group. WT mice are represented by white
bars, GIPgfp/+
mice by black bars, and GIPgfp/gfp
mice by gray bars. *p<0.05 vs. WT. Absence of
asterisk above the horizontal brackets in Fig. 3A, 3C, 3D and 3E indicates no statistical
significance.
Figure 4. Induction of metabolic stress by HFD. Body weight (A) and ad libitum glucose
levels (B) in WT CFD, WT HFD, GIPgfp/+
HFD and GIPgfp/gfp
HFD mice were measured once per
week during 8 weeks (56 days) of CFD (10% of fat) or HFD (60% of fat). Total GIP levels (C),
GIP secretion (GIP-AUC) (D), glucose levels (E), and insulin levels (F) were measured during
OGTT (glucose load of 1g/kg of body weight) conducted after 8 weeks (56 days) of CFD or
HFD. In vitro insulin secretion from isolated islets (G) was measured in conditions of 5.5 mM
glucose, 11.1 mM glucose and 11.1 mM glucose + 100 nM human GIP peptide. Results were
expressed as insulin secretion (% insulin content). β-cell area (H) was measured by
immunohistochemistry of pancreas sections and subsequent analysis using BZ Analyzer software.
Results are expressed as β-cell area/total pancreas area. GIP receptor mRNA levels in islets (I)
were expressed as GIPR mRNA/GAPDH mRNA. n= 5-6 mice or samples per group; 10 islets
per sample. WT CFD mice are represented by white circles with square dot dash and white bars
with square dot border, WT HFD mice by white circles with solid dash and white bars with solid
border, GIPgfp/+
mice by black squares and black bars, and GIPgfp/gfp
mice by gray triangles and
gray bars. P values are expressed as follows: Fig.4A, 4C, 4D, 4E, 4F:*p<0.05, **p<0.01,
***p<0.001 vs. WT HFD. Fig.4B: *p<0.05 WT CFD vs. WT HFD and #p<0.05 GIP
gfp/+ HFD vs.
Page 25 of 33 Diabetes

26
WT HFD. Fig.4G, 4H and 4I:*p<0.05, **p<0.01, ***p<0.001. Absence of asterisk above the
horizontal brackets in Fig. 4G, 4H and 4I indicates no statistical significance.
Figure 5. Adipose tissue response to HFD feeding and consequential energy expenditure
changes. Visceral, subcutaneous and total fat (expressed in g) in WT CFD, WT HFD,
GIPgfp/+
HFD and GIPgfp/gfp
HFD mice (A) were measured, and CT images of transversal
abdominal sections were taken after 8 weeks of CFD (10% of fat) or HFD (60% of fat). ITT
(insulin 0.5 U/kg of body weight) was conducted after 8 weeks of CFD or HFD (B). Fat
oxidation (mg/min/kg) (C), energy expenditure (cal/min/kg) (D) and mice activity (counts/min)
(E) were measured after 6-7 weeks of CFD or HFD. GIP receptor mRNA levels in white
(visceral) adipose tissue (F) were expressed as GIPR mRNA/GAPDH mRNA. n= 5-6 mice or
samples per group. WT CFD mice are represented by white bars with square dot border and
white circles with square dot dash, WT HFD mice by white bars with solid border and white
circles with solid dash, GIPgfp/+
HFD mice by black bars and black squares, and GIPgfp/gfp
HFD
mice by gray bars and gray triangles. P values are expressed as follows: Fig.5B *p<0.05,
**p<0.01, ***p<0.001 vs. WT HFD; Fig. 5A, 5C, 5D, and 5F *p<0.05, **p<0.01. Absence of
asterisk above the horizontal brackets in Fig. 5A, 5C, 5D, and 5F indicates no statistical
significance.
Supplementary figure 1. Body weight progression and insulin sensitivity in standard chow-
fed mice. Body weight (A) of WT, GIPgfp/+
, and GIPgfp/gfp
mice on CFD was measured once per
week during 8 weeks (56 days), starting from 7 weeks of age. ITT (insulin 0.5 U/kg of body
weight) was conducted after 8 weeks of standard diet feeding (B). n=5-6 mice per group. WT
mice are represented by white circles with solid dash, GIPgfp/+
mice by black squares, and
GIPgfp/gfp
mice by gray triangles. *p<0.05 GIPgfp/gfp
vs WT.
Page 26 of 33Diabetes

27
Table 1
Phenotype comparison of GIP-GFP KI mice and GIPRKO mice
Genotype/
Phenotype
WT GIPgfp/+
GIPgfp/gfp
GIPRKO7,13
Standard chow feeding
GIP secretion ↓ (~50%) absent ↑
Glucose tolerance impaired impaired impaired
Bone volume ↔ ↓ ↓
High fat diet feeding
WT HFD GIPgfp/+
HFD GIPgfp/gfp
HFD GIPRKO HFD6,12,29
Glucose tolerance ↔ ↔ impaired
Body weight ↓ ↓↓ ↓↓
Fat mass ↓ ↓↓ ↓↓
Insulin sensitivity ↑ ↑↑ ↑↑
Standard chow feeding data are relative to WT; high fat diet feeding data are relative to WT
HFD.
Symbols: “↔”: no changes; “↓”: decreased; “↓↓”: highly decreased; “↑”: increased; “↑↑”: highly
increased. Numbers shown in superscript indicate the corresponding articles listed in References.
Page 27 of 33 Diabetes

A
0
0.5
1
WT GIPgfp /+
GIPgfp/gfpGI
P m
RNA/
GAPD
H m
RNA
***
*
0
10
20
30
WT GIPgfp/+
GIPgfp/gfp
(pg/
ml min×10 )
.
3
***** ***
GIP
secr
e�on
0
5
10
15
20
GIP
/pro
tein
con
tent
( ×10 )3
***
*
WT GIPgfp /+
GIPgfp/gfp
******
Time (min)120
B
0
100
200
300
400
500
600
0 30 60 90
GIP
(pg/
ml)
* *
* **** *** ***
C
Page 28 of 33Diabetes

A
0
2
4
GIPR
mRN
A /G
APDH
mRN
A
WT GIPgfp/+ GIPgfp/gfp
E
0
100
200
300
400
500
0 30 60 90 120Time (min)
Glu
cose
(mg/
dl)
**
*#
0
500
1000
1500
2000
2500
**
*
*
*
0 30 60 90 120Time (min)
Insu
lin (p
g/m
l)C D
10
15
20
25
30
4 5 6 7 8Age (weeks)
0
0.5
1
1.5
5.5 mM G 11.1 mM G 11.1 mM GInsu
lin se
cret
ion
(ng/
ml)
+GIP
Body
wei
ght (
g)
F
B
0
1
2
Visceral fat Subcutaneous fat Total fatBo
dy fa
t (g)
Page 29 of 33 Diabetes

A
0
5
10
15Bo
ne v
olum
e (%
)
0
10
20
30
40O
steo
blas
t sur
face
(%)
0
1
2
3
4
5
Ost
eocl
ast s
urfa
ce (%
)0
500
1000
2500
Bone
form
atio
n ra
te
WT GIPgfp/gfpGIPgfp /+B
C D E
*
2000
1500
(% y
ear)
WT GIPgfp/gfp
GIPgfp /+
WT GIPgfp/gfp
GIPgfp /+
Trab
ecul
ae n
umbe
r
0
1
2
3
4
5
(N/m
m)
F
WT GIPgfp/gfp
GIPgfp /+ WT GIP
gfp/gfpGIP
gfp /+WT GIP
gfp/gfpGIP
gfp /+
* **
Page 30 of 33Diabetes

**50
100
150
200
250
300
0 7 14 21 28 35 42 49 560
250
500
750
0 30 60 90 120
GIP
(pg/
ml)
Body
wei
ght (
g)
Glu
cose
(mg/
dl)
A B C
Time (min)Days Days
0
1
2
WT GIPgfp /+
GIPgfp/gfp
CFD HFDGIPR
mRN
A / G
APDH
mRN
A
D E
I
Insu
lin (p
g/m
l)0
100
200
300
400
500
0 30 60 90 120
Glu
cose
(mg/
dl)
Time (min)
5000
G
20
25
30
35
40
45
0 7 14 21 28 35 42 49 56
************
******
** ************
*********
*********
***
******
****
#
** ** *** *** ******
*
*
*
***
*
Insu
lin se
cret
ion
(% c
onte
nt×10
)
0
1000
2000
3000
4000
0 30 60 90 120Time (min)
0
10
20
30
GIP
secr
e�on
(pg/
ml min×10 )
.
3
40
50
WT GIPgfp /+
GIPgfp/gfp
CFD HFD
********* *
**
**
**
*
***
****
****
******
*********
10
5
0
***
***
***
* *
F
*
-3
5.5 mM G 11.1 mM G 11.1 mM G+GIP
H
0
0.03
0.06
WT GIPgfp /+
GIPgfp/gfp
CFD HFDβ-ce
ll ar
ea/t
otal
pan
ceas
are
a **
Page 31 of 33 Diabetes

0
10
20
30
20
0
10
Visceralfat
Subcutaneousfat
Totalfat
Body
fat (
g)A B
C
E
Mou
se a
c�vi
ty (c
ount
/min
)
WT HFDWT CFD
GIP HFDgfp /+
GIP HFDgfp/gfp
** * *
*
*
* **
*
Lean massSubcutaneous fatViseral fat0
100
200
300
400
0 30 60 90 120
Glu
cose
(mg/
dl)
Time (min)
**
*******
****
********
**
*
F
0
20
40
60
80
100
Ener
gy e
xpen
ditu
re
0
10
20
30
Fat o
xida
�on
(mg/
min
/kg)
D
**
* ** *
Light phase Dark phase Total Light phase Dark phase Total
* ***
***
***
*
Light phase Dark phase Total0
2
4
WT GIPgfp /+
GIPgfp/gfp
CFD HFDGIPR
mRN
A / G
APDH
mRN
A **
(cal
/min
/kg)
Page 32 of 33Diabetes

A B
WT HFD
GIP HFDgfp/gfp
Glu
cose
(mg/
dl)
Time (min)
0
50
100
150
200
250
300
0 30 60 90 120
Body
wei
ght (
g)
Days
15
20
25
30
35
0 7 14 21 28 35 42 49 56
*
Page 33 of 33 Diabetes