Embed Size (px)
Citation preview

Package ‘psd’August 29, 2016
Type Package
Title Adaptive, Sine-Multitaper Power Spectral Density Estimation
Version 1.0-1
Date 2015-03-19
Author Andrew J. Barbour and Robert L. Parker, with contributions from DavidMyer
Maintainer Andrew J. Barbour <[email protected]>
Description Produces power spectral density estimates through iterativerefinement of the optimal number of sine-tapers at each frequency. Thisoptimization procedure is based on the method of Riedel and Sidorenko(1995), which minimizes the Mean Square Error (sum of variance and bias)at each frequency, but modified for computational stability.
License GPL (>= 2)
URL https://github.com/abarbour/psd, Barbour and Parker (2014):
http://dx.doi.org/10.1016/j.cageo.2013.09.015, Riedel andSidorenko (1995): http://dx.doi.org/10.1109/78.365298
BugReports https://github.com/abarbour/psd/issues
Depends R (>= 2.14.1), utils, stats, graphics, grDevices
Imports Rcpp (>= 0.11.5), RColorBrewer, signal, zoo
Suggests bspec, fftw (>= 1.0.3), ggplot2 (>= 0.9), knitr, multitaper,plyr, RSEIS, rbenchmark, reshape2, testthat
VignetteBuilder knitr
LinkingTo Rcpp, RcppArmadillo
NeedsCompilation yes
Repository CRAN
Date/Publication 2015-03-22 18:37:50
1

2 psd-package
R topics documented:psd-package . . . . . . . . . . . . . . . . . . . . . . . . . . . . . . . . . . . . . . . . . 2as.tapers . . . . . . . . . . . . . . . . . . . . . . . . . . . . . . . . . . . . . . . . . . . 4ctap_loess . . . . . . . . . . . . . . . . . . . . . . . . . . . . . . . . . . . . . . . . . . 5ctap_simple_rcpp . . . . . . . . . . . . . . . . . . . . . . . . . . . . . . . . . . . . . . 6hfsnm . . . . . . . . . . . . . . . . . . . . . . . . . . . . . . . . . . . . . . . . . . . . 8magnet . . . . . . . . . . . . . . . . . . . . . . . . . . . . . . . . . . . . . . . . . . . . 9modulo_floor . . . . . . . . . . . . . . . . . . . . . . . . . . . . . . . . . . . . . . . . 10parabolic_weights_rcpp . . . . . . . . . . . . . . . . . . . . . . . . . . . . . . . . . . . 11pgram_compare . . . . . . . . . . . . . . . . . . . . . . . . . . . . . . . . . . . . . . . 13pilot_spec . . . . . . . . . . . . . . . . . . . . . . . . . . . . . . . . . . . . . . . . . . 14prewhiten . . . . . . . . . . . . . . . . . . . . . . . . . . . . . . . . . . . . . . . . . . 16psd-environment . . . . . . . . . . . . . . . . . . . . . . . . . . . . . . . . . . . . . . 18psd-normalization . . . . . . . . . . . . . . . . . . . . . . . . . . . . . . . . . . . . . . 21psd-utilities . . . . . . . . . . . . . . . . . . . . . . . . . . . . . . . . . . . . . . . . . 24psdcore . . . . . . . . . . . . . . . . . . . . . . . . . . . . . . . . . . . . . . . . . . . 27pspectrum . . . . . . . . . . . . . . . . . . . . . . . . . . . . . . . . . . . . . . . . . . 29rcpp_ctap_simple . . . . . . . . . . . . . . . . . . . . . . . . . . . . . . . . . . . . . . 31resample_fft_rcpp . . . . . . . . . . . . . . . . . . . . . . . . . . . . . . . . . . . . . . 32riedsid . . . . . . . . . . . . . . . . . . . . . . . . . . . . . . . . . . . . . . . . . . . . 33spec-methods . . . . . . . . . . . . . . . . . . . . . . . . . . . . . . . . . . . . . . . . 35spectral_properties . . . . . . . . . . . . . . . . . . . . . . . . . . . . . . . . . . . . . 37spec_confint . . . . . . . . . . . . . . . . . . . . . . . . . . . . . . . . . . . . . . . . . 40splineGrad . . . . . . . . . . . . . . . . . . . . . . . . . . . . . . . . . . . . . . . . . . 42tapers-constraints . . . . . . . . . . . . . . . . . . . . . . . . . . . . . . . . . . . . . . 43tapers-methods . . . . . . . . . . . . . . . . . . . . . . . . . . . . . . . . . . . . . . . 46Tohoku . . . . . . . . . . . . . . . . . . . . . . . . . . . . . . . . . . . . . . . . . . . 47
Index 49
psd-package Adaptive power spectral density estimation using optimal sine multi-tapers
Description
Estimate the power spectral density (PSD) of a timeseries using the sine multitapers, adaptively; thenumber of tapers (and hence the resolution and uncertainty) vary according to spectral shape. Themain function to be used is pspectrum.
Details
In frequency ranges where the spectrum (S) is relatively flat, more tapers are taken and so a higheraccuracy is attained at the expense of lower frequency resolution. The program makes a pilotestimate of the spectrum, then uses Riedel and Sidorenko’s (1995) estimate of the MSE (minimumsquare error), which is based on an estimate of the second derivative of the PSD (S′′). The processis repeated niter times; further iteration may be necessary to reach convergence, or an acceptably

psd-package 3
low spectral variance. In this context the term "acceptable" is rather subjective: one can usuallydetect an unconverged state by a rather jagged appearence of the spectrum, but this is uncommon inour experience.
Adaptive estimation: The adaptive process used is as follows. A quadratic fit to the logarithmof the PSD within an adaptively determined frequency band is used to find an estimate of thelocal second derivative of the spectrum. This is used in an equation like R-S equation (13) for theMSE taper number, with the difference that a parabolic weighting is applied with increasing taperorder. Because the FFTs of the tapered series can be found by resampling the FFT of the originaltime series (doubled in length and padded with zeros) only one FFT is required per series, nomatter how many tapers are used. The spectra associated with the sine tapers are weighted beforeaveraging with a parabolically varying weight. The expression for the optimal number of tapersgiven by R-S must be modified since it gives an unbounded result near points where S′′ vanishes,which happens at many points in most spectra. This program restricts the rate of growth of thenumber of tapers so that a neighboring covering interval estimate is never completely containedin the next such interval.
Resolution and uncertainty: The sine multitaper adaptive process introduces a variable resolu-tion and error in the frequency domain. See documentation for spectral_properties details onhow these are computed.
Author(s)
Andrew J. Barbour <[email protected]> and Robert L. Parker
References
Barbour, A. J. and R. L. Parker, (2014), psd: Adaptive, sine multitaper power spectral densityestimation for R, Computers and Geosciences, 63, 1–8, http://dx.doi.org/10.1016/j.cageo.2013.09.015
Percival, D. B., and A.T. Walden (1993), Spectral analysis for physical applications, CambridgeUniversity Press
Prieto, G. A., R. L. Parker, D. J. Thomson, F. L. Vernon, and R. L. Graham (2007), Reducingthe bias of multitaper spectrum estimates, Geophysical Journal International, 171, 1269–1281,http://gji.oxfordjournals.org/content/171/3/1269
Riedel, K. S., & Sidorenko, A. (1995), Minimum bias multiple taper spectral estimation, SignalProcessing, IEEE Transactions on, 43(1), 188–195.
See Also
psdcore and riedsid

4 as.tapers
as.tapers Coerce an object into a ’tapers’ object.
Description
In a tapered spectrum estimation algorithm, it is necessary to enforce rules on the number of tapersthat may be applied.
Usage
as.tapers(x, min_taper = 1, max_taper = NULL, setspan = FALSE,record.last = FALSE)
tapers(x, min_taper = 1, max_taper = NULL, setspan = FALSE,record.last = FALSE)
Arguments
x An object to set
min_taper Set all values less than this to this.
max_taper Set all values greater than this to this.
setspan logical; should the tapers object be passed through minspan before being re-turned?
record.last logical; should the x be saved to the psd-environment before coercion?
Details
Formal requirements enforced by this function are:
• Non-zero.
• Integer values.
• Fewer than the half-length of the spectrum.
For example, we cannot apply zero tapers (the result would be a raw periodogram) or one million ta-pers (that would be absurd, and violate orthogonality conditions for any series less than two millionterms long!).
An object with S3 class 'tapers' is created; this will have a minimum number of tapers in eachposition set by min_taper, and a maximum number of tapers in each position set by max_taper. Ifminspan=TRUE, the bounded taper is fed through minspan which will restrict the maximum tapersto less than or equal to the half-length of the spectrum.
Various classes can be coerced into a 'tapers' object; those tested sofar include: scalar, vector,matrix, data.frame, and list.
Multiple objects are concatenated into a single vector dimension.
Enabling setspan will only override max_taper should it be larger than the half-width of the series.

ctap_loess 5
Value
An object with class 'taper'
Note
No support (yet) for use of min_taper,max_taper as vectors, although this could be quite desir-able.
Author(s)
A.J. Barbour
See Also
is.tapers
Examples
## Not run: #REXlibrary(psd)
#### Objects with class 'tapers'##is.tapers(as.tapers(1))is.tapers(as.tapers(1:10))
# note dimensionsas.tapers(matrix(1:10,ncol=1))as.tapers(list(x=1:10,y=1:30))as.tapers( x <- data.frame(x=1:10,y=10:19) )
# change constraintsas.tapers(x, min_taper=3, max_taper=10)
# class 'character' is in-coercible; raise errortry(as.tapers(c("a","b")), silent=TRUE)
## End(Not run)#REX
ctap_loess Taper constraints using loess smoothing
Description
Taper constraints using loess smoothing

6 ctap_simple_rcpp
Usage
ctap_loess(tapvec, ...)
## S3 method for class 'tapers'ctap_loess(tapvec, ...)
## Default S3 method:ctap_loess(tapvec, tapseq = NULL, loess.span = 0.3,loess.degree = 1, verbose = TRUE, ...)
Arguments
tapvec integer; the number of tapers at each frequency (can be a vector)
... additional arguments
tapseq vector; positions to evaluate derivatives (unused here, but necessary for smoothermethods)
loess.span scalar; the span used in loess
loess.degree scalar; the polynomial degree
verbose logical; should warnings and messages be given?
See Also
constrain_tapers, ctap_simple_rcpp
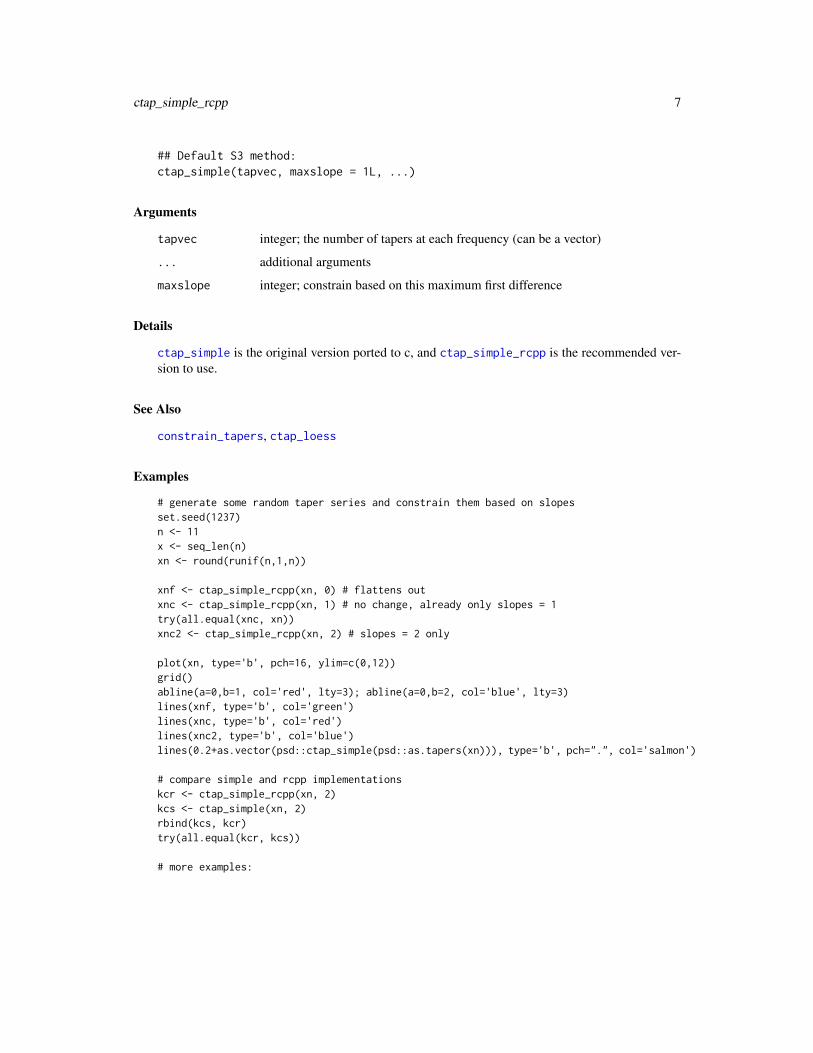
ctap_simple_rcpp Taper constraints using simple derivatives
Description
Taper constraints using simple derivatives
Usage
ctap_simple_rcpp(tapvec, ...)
## S3 method for class 'tapers'ctap_simple_rcpp(tapvec, ...)
## Default S3 method:ctap_simple_rcpp(tapvec, maxslope = 1L, ...)
ctap_simple(tapvec, ...)
## S3 method for class 'tapers'ctap_simple(tapvec, ...)
ctap_simple_rcpp 7
## Default S3 method:ctap_simple(tapvec, maxslope = 1L, ...)
Arguments
tapvec integer; the number of tapers at each frequency (can be a vector)
... additional arguments
maxslope integer; constrain based on this maximum first difference
Details
ctap_simple is the original version ported to c, and ctap_simple_rcpp is the recommended ver-sion to use.
See Also
constrain_tapers, ctap_loess
Examples
# generate some random taper series and constrain them based on slopesset.seed(1237)n <- 11x <- seq_len(n)xn <- round(runif(n,1,n))
xnf <- ctap_simple_rcpp(xn, 0) # flattens outxnc <- ctap_simple_rcpp(xn, 1) # no change, already only slopes = 1try(all.equal(xnc, xn))xnc2 <- ctap_simple_rcpp(xn, 2) # slopes = 2 only
plot(xn, type='b', pch=16, ylim=c(0,12))grid()abline(a=0,b=1, col='red', lty=3); abline(a=0,b=2, col='blue', lty=3)lines(xnf, type='b', col='green')lines(xnc, type='b', col='red')lines(xnc2, type='b', col='blue')lines(0.2+as.vector(psd::ctap_simple(psd::as.tapers(xn))), type='b', pch=".", col='salmon')
# compare simple and rcpp implementationskcr <- ctap_simple_rcpp(xn, 2)kcs <- ctap_simple(xn, 2)rbind(kcs, kcr)try(all.equal(kcr, kcs))
# more examples:

8 hfsnm
hfsnm Noise levels found in PBO strainmeter data at seismic frequencies.
Description
These values represent noise levels in high frequency data (10−3 − 10 Hz) from 2009, averagedover all stations in the Anza cluster of the Plate Boundary Observatory (PBO) borehole strainmeternetwork, and the UCSD-style longbase laser strainmeters.
Format
A dataframe with 141 observations on the following 4 variables:
freq Frequencies, in Hertz.
P50 The 50th percentile (median) noise levels in decibels relative to 1ε2/ Hz.
P10 The 10th percentile noise levels also in decibels.
meter.type The strainmeter design type.
and 2 attributes:
source.doi The DOI number of the source publication.
generator The structure of a function which will refresh the values from the supplemental files ofthe original publication.
Details
NA values in the series highlight frequency bands where the noise levels are unreliable, due to ainstrumental artifact.
Source
Barbour, A. J., and Agnew, D. C. (2011), Noise Levels on Plate Boundary Observatory BoreholeStrainmeters in Southern California, Bulletin of the Seismological Society of America, 101(5), 2453-2466, doi:10.1785/0120110062
See Also
pspectrum, Tohoku, magnet
Examples
data(hfsnm)str(hfsnm)FUN <- attr(hfsnm, "generator")try(dat <- FUN(molten=FALSE)) # may fail without library-access to BSSAtry(all.equal(dat[,1:4], hfsnm[,1:4]))

magnet 9
magnet A single line of Project MAGNET horizontal field intensity
Description
The Project MAGNET mission provided a wealth of airborne-magnetometer data spanning theglobe (Coleman, 1992). This dataset represents a single track of horizontal field intensities (a verysmall subset of the full collection!).
Format
A dataframe with 2048 observations on the following 4 variables.
km Relative along-track distance, in kilometers. The first observation is at zero kilometers.
raw Raw intensities, in nanotesla.
clean Edited raw intensites, in nanotesla
mdiff The difference between clean and raw intensities, in nanotesla.
Details
Raw and Clean Sets: There are non-real data points in raw MAGNET series; these are instru-mental artefacts, and can severely affect power spectral density (PSD) estimates. A clean serieshas been included so that a comparison of PSDs may be made.Some command like subset(magnet, abs(mdiff) > 0) can be used to identify the rows whereedits have been made.
Source
Project MAGNET page: http://www.ngdc.noaa.gov/geomag/proj_mag.shtml
References
Coleman, R. J. (1992), Project Magnet high-level vector survey data reduction. In Types and Char-acteristics of Data for Geomagnetic Field Modeling, 3153, pp. 215-248.
See Also
pspectrum, Tohoku, hfsnm
Examples
data(magnet)summary(magnet)

10 modulo_floor
modulo_floor Nearest value below
Description
Returns the nearest m-length value (downwards from n).
Usage
modulo_floor(n, m = 2L)
Arguments
n integer; the number of terms (can be a vector)
m integer; the modulo term (cannot be zero)
Details
This function is different from nextn in that the value is floored. For example: 10 is the result forn=11,m=2 whereas nextn would give 12.
Author(s)
A.J. Barbour
See Also
psd-utilities; psdcore uses this to truncate series to their nearest even length (i.e., m=2).
Examples
n <- 11nextn(n) # 12modulo_floor(n) # 10
# works on vectors too:# defaults to m=2modulo_floor(seq_len(n))#[1] 0 2 2 4 4 6 6 8 8 10 10
# change the floor factormodulo_floor(seq_len(n), 3)#[1] 0 0 3 3 3 6 6 6 9 9 9
# zeros are not allowed for mtry(modulo_floor(n, 0))
parabolic_weights_rcpp 11
parabolic_weights_rcpp
Calculate parabolic weighting factors.
Description
The resampled spectrum involves summing weighted tapers; this produces the weighting factors.parabolic_weights_rcpp is the fastest implementation, used by resample_fft_rcpp, but it takesonly a single value. parabolic_weights calls parabolic_weights_fast for vectors.
Usage
parabolic_weights_rcpp(ntap = 1L)
parabolic_weights(tapvec, tap.index = 1L)
## S3 method for class 'tapers'parabolic_weights(tapvec, tap.index = 1L)
parabolic_weights_fast(ntap = 1L)
Arguments
ntap integer; the number of tapers to provide weightings for.
tapvec 'tapers' object; the number of tapers at each frequency
tap.index integer; the index of tapvec from which to produce a sequence of weights for
Details
If one has a tapers object, specify the taper.index to produce a sequence of weights up to thevalue at that index; the user is likely to never need to use this function though.
Weighting factors, W , are calculated as follows:
W ≡ 6(n2 −K2)
n(4 ∗ n− 1)(n+ 1)
where n is the total number of tapers, and K is the integer sequence [0, n− 1].
The sum of tapers should equal 1, within machine precision, when n > 0.
Value
A list with the number of tapers, indices of the taper sequence, and the weights WN .
Author(s)
A.J. Barbour adapted the original algorithm (R.L. Parker), and authored the optimized versions.

12 parabolic_weights_rcpp
See Also
resample_fft_rcpp, psdcore, riedsid
Examples
## Not run: #REXlibrary(psd)library(grDevices)library(RColorBrewer)
#### Show parabolic weighting factors as a function of maximum tapers##
# maximum number of tapersmaxx <- 1e3# sequence in logspacexseq <- seq(from=1,to=2.8,by=0.2)
# plot palettepal <- "Spectral"npal <- switch(pal, RdYlBu=11, Spectral=11, Blues=9)pal.col <- RColorBrewer::brewer.pal(npal, pal)cols <- rev(grDevices::colorRampPalette(pal.col)(maxx))
to_df <- function(W){# convert parabolic results to data.framewith(W, data.frame(taper_seq=as.vector(taper_seq), taper_weights=as.vector(taper_weights)))
}
## a roundabout way of bootstrapping y-axis limits:# upperWgtsU <- parabolic_weights_fast(5)DfU <- to_df(WgtsU)# lowerWgtsL <- parabolic_weights_fast(maxx)DfL <- to_df(WgtsL)
ylims <- range(pretty(dB(c(DfL$taper_weights, DfU$taper_weights)))) + c(-2,5)
# function for plotting textTFUN <- function(Df.){
tx <- max(Df.$taper_seq)ty <- mean(Df.$taper_weights)text(log10(tx)+0.1, dB(ty), sprintf("%i", tx), col=cols[tx])
}
# function for weighting factors and plottingWFUN <- function(x){
message(x)Wgts <- parabolic_weights_fast(x)Df <- to_df(Wgts)

pgram_compare 13
lcol <- cols[x]lines(dB(taper_weights) ~ log10(taper_seq), Df, type="s", lwd=2, col=lcol)TFUN(Df)
}
## Plot parabolic weighting, in dB, colored by maximum num tapersplot(dB(taper_weights) ~ log10(taper_seq), DfU, type="s",
xlim=c(0, log10(maxx)+0.2),ylim=ylims, yaxs="i",col=cols[5], lwd=2,main="Multitaper weighting factors by maximum tapers applied",xlab="log10 taper sequence",ylab="dB")
TFUN(DfU)invisible(lapply(round(10**xseq), FUN=WFUN))WFUN(maxx)
##
## End(Not run)#REX
pgram_compare Compare multitaper spectrum with cosine-tapered periodogram
Description
Plot the results of psdcore against the results of spec.pgram
Usage
pgram_compare(x, ...)
## S3 method for class 'amt'pgram_compare(x, f = NULL, X = NULL, log.freq = TRUE,db.spec = TRUE, taper = 0.2, ...)
Arguments
x a single psdcore object... additional parameters (currently unused)f numeric; the frequency range to plot; optional: if not given the program will
show the entire band.X object used to create x; optional: if not given the program will try and access the
last copy in the environment. An attempt is made to coerce to an object of class'ts'.
log.freq logical; should frequencies be transformed with log10? Note that if f is given,the values should not already be transformed.
db.spec logical; should the spectrum estimates be converted to decibels with dB?taper numeric; specifies the proportion of data to taper for the cosine periodogram.

14 pilot_spec
Value
A list with the cosine-tapered estimates and the adaptive estimates, invisibly.
Examples
set.seed(1234)X <- rnorm(1e3)
# multitaper spectrump <- psdcore(X, ntaper=10)
# how does it compare to a single-cosine tapered spectrum?pgram_compare(p)
# or in a certain bandpgram_compare(p, c(0.1,0.4))
# linear frequenciespgram_compare(p, c(0.1,0.4), log.freq = FALSE)
pilot_spec Calculate inital power spectral density estimates
Description
This PSD is used as the starting point – the pilot spectrum – for the adaptive estimation routine.
Usage
pilot_spec(x, ...)
## S3 method for class 'ts'pilot_spec(x, ...)
## Default S3 method:pilot_spec(x, x.frequency = NULL, ntap = NULL,remove.AR = NULL, plot = FALSE, verbose = FALSE, ...)
Arguments
x vector; the data series to find a pilot spectrum for
... additional parameters passed to psdcore
x.frequency scalar; the sampling frequency (e.g. Hz) of the series
ntap scalar; the number of tapers to apply during spectrum estimation
remove.AR scalar; the max AR model to be removed from the data.
plot logical; should a plot be created?
verbose logical; should messages be given?

pilot_spec 15
Details
A fixed number of tapers is applied across all frequencies using psdcore, and subsequent taper-refinements are based on the spectral derivatives of this spectrum; hence, changes in the number oftapers can affect how many adaptive stages may be needed (though there are no formal convergencecriteria to speak of).
The taper series of the returned spectrum is constrained using as.tapers(..., minspan=TRUE).
The default behaviour (remove.AR <= 0) is to remove the standard linear model [f(x) = αx+ β]from the data; however, the user can model the effect of an autoregressive process by specifiyingremove.AR.
Value
An object with class ’spec’, invisibly, and "pilot_psd" in the working environment.
Removing an AR effect from the spectrum
If remove.AR > 0 the argument is used as AR.max in prewhiten, from which an AR-responsespectrum is calculated using the best fitting model.
If the value of remove.AR is too low the spectrum could become distorted, so use with care. Note,however, that the value of remove.AR will be restricted to within the range [1, 100]. If the AR orderis much larger than this, it’s unclear how prewhiten will perform and whether the AR model isappropriate.
Note that this function does not produce a parametric spectrum estimation; rather, it will return theamplitude response of the best-fitting AR model as spec.ar would. Interpret these results withcaution, as an AR response spectrum can be misleading.
Author(s)
A.J. Barbour
See Also
psdcore, prewhiten, spec.ar
Examples
## Not run: #REXlibrary(psd)
#### Pilot spectrum##
data(magnet)
## simply calculate the pilot spectrum with a few tapersplot(pilot_spec(xc <- magnet$clean), log="dB",
main="Pilot PSDs for MAGNET and its AR-innovations (red)")

16 prewhiten
## remove the effect of an AR model# note: remove.AR -- the max AR model to be removed from the dataplot(pilot_spec(xc, remove.AR=10), log="dB", add=TRUE, col="red")
## End(Not run)#REX
prewhiten Prepare a series for spectral estimation
Description
Remove (optionally) mean, trend, and Auto Regressive (AR) model from the original series.
Usage
prewhiten(tser, ...)
## Default S3 method:prewhiten(tser, x.fsamp = 1, x.start = c(1, 1), ...)
## S3 method for class 'ts'prewhiten(tser, AR.max = 0L, detrend = TRUE, demean = TRUE,impute = TRUE, plot = TRUE, verbose = TRUE, ...)
Arguments
tser vector; An object to prewhiten.
... variables passed to prewhiten.ts (for non ts objects)
x.fsamp sampling frequency (for non ts objects)
x.start start time of observations (for non ts objects)
AR.max numeric; the maximum AR order to fit.
detrend logical; Should a trend (and mean) be removed?
demean logical; Should a mean value be removed?
impute logical; Should NA values be imputed?
plot logical; Should the results be plotted?
verbose logical; Should messages be printed?
Details
The R-S multitapers do not exhibit the remarkable spectral-leakage suppression properties of theThomson prolate tapers, so that in spectra with large dynamic range, power bleeds from the strongpeaks into neighboring frequency bands of low amplitude – spectral leakage. Prewhitening canameliorate the problem, at least for red spectra [see Chapter 9, Percival and Walden (1993)].
The value of the AR.max argument is made absolute, after which this function has essentially twomodes of operation (detailed below):

prewhiten 17
AR.max == 0 Remove (optionally) a mean and/or linear trend.AR.max > 0 Remove an autoregressive model
In the second case, the time series is filtered in the time domain with a finite-impluse-response filterof AR.max terms. The filter is found by solving the Yule-Walker equations for which it is assumedthe series was generated by an autoregressive process, up to order AR.max.
Mean and trend (AR.max == 0):Power spectral density estimates can become badly biased (especially at lower frequencies) if asignal of the form f(x) = Ax + B is not removed from the series. If detrend=TRUE a modelof this form is removed over the entire series using a linear least-squares estimator; in this case amean value is removed regardless of the logical state of demean. To remove only a mean value,set detrend=FALSE and (obviously) demean=TRUE.
Auto Regressive (AR) innovations (AR.max > 0):When an autoregressive model is removed from a non-stationary series, the residuals are knownas ’innovations’, and may be stationary (or very-nearly stationary). This function fits an ARmodel [order at least 1, but up to and including AR(AR.max)] to the series by solving the Yule-Walker equations; however, AIC is used to estimate the highest significant order, which meansthat higher-order components may not necessarily be fit. The resulting innovations can be usedto better estimate the stationary component of the original signal, and possibly in an interactiveediting method.Note that the method used here–solving the Yule-Walker equations–is not a true maximum like-lihood estimator; hence the AIC is calculated based on the variance estimate (no determinant).From ?ar: In ar.yw the variance matrix of the innovations is computed from the fitted coefficientsand the autocovariance of x.A quick way to determine whether this may be needed for the series is to run acf on the series,and see if significant non-zero lag correlations are found. A warning is produced if the fit returnsan AR(0) fit, indicating that AR prewhitening most likely inappropriate for the series, which isapparently stationary (or very nearly so). (The innovations could end up having higher variancethan the input series in such a case.)Note that AR.max is restricted to the range [1, N − 1] where N is the series length.
Value
A list with the model fits (lm and ar objects), the linear and AR prewhitened series (ts objects), anda logical flag indicating whether the I/O has been imputed. This list includes: "lmdfit", "ardfit","prew_lm", "prew_ar", and "imputed"
Note that if AR.max=0 the AR information will exist as NULL.
NA values
NA values are allowed. If present, and impute=TRUE, the na.locf function in the package zoois used twice (with and without fromLast so that lead and trailing NA values are also imputed).The function name is an acronym for "Last Observation Carried Forward", a very crude method ofimputation.
Author(s)
A.J. Barbour and Robert L. Parker

18 psd-environment
See Also
psdcore, pspectrum
Examples
## Not run: #REXlibrary(psd)
#### Using prewhiten to improve spectral estimates##
data(magnet)mts <- ts(magnet$clean)# add a slopemts.slope <- mts + seq_along(mts)
# Prewhiten by removing mean+trend, and# AR model; fit truncates the series by# a few terms, so zero padmts <- prewhiten(mts.slope, AR.max=10, zero.pad="rear")mts.p <- mts[['prew_lm']]mts.par <- mts[['prew_ar']]
# uniformly-tapered spectral estimatesPSD <- psdcore(mts.p, ntaper=20)PSD.ar <- psdcore(mts.par, ntaper=20)
# remove the effect of AR modelPSD.ar[['spec']] <- PSD.ar[['spec']] / mean(PSD.ar[['spec']])PSD[['spec']] <- PSD[['spec']] / PSD.ar[['spec']]
plot(PSD, log='dB', lwd=2, ylim=c(-5,35))plot(PSD, log='dB', add=TRUE, lwd=2, col="red")plot(PSD.ar, log='dB', add=TRUE, col="blue", lwd=2)
## End(Not run)#REX
psd-environment Various environment manipulation functions.
Description
The computation of adaptive power spectral density estimates requires bookkeeping and non-destructivemanipulation of variables. The functions here are mainly convenience wrappers designed to main-tain variable separation from the .GlobalEnv environment so that no innocent variable is destroyedin the process of iteratively computing spectra. The user should generally not be using the setterseven though all functions exist in the namespace.

psd-environment 19
get_psd_env_pointer is a convenience wrapper to get the environment pointer.
get_psd_env_name is a convenience wrapper to get the environment name.
psd_envRefresh will clear any variables in the enviroment and reset the initialization stamp.
psd_envClear clears the contents of the environment.
psd_envStatus returns a list of some information regarding the status of the environment.
psd_envList returns a listing of any assignments.
psd_envGet returns the value of variable.
psd_envAssign assigns value to variable, but does not return it.
psd_envAssignGet both assigns and returns a value.
update_adapt_history updates the adaptive estimation history list.
new_adapt_history initializes a nested-list object to store the data from each iteration.
Usage
get_psd_env_pointer()
get_psd_env_name()
psd_envRefresh(verbose = TRUE)
psd_envClear()
psd_envStatus()
psd_envList()
psd_envGet(variable)
psd_envAssign(variable, value)
psd_envAssignGet(variable, value)
get_adapt_history()
last_psd()
update_adapt_history(PSD, stage, ...)
## S3 method for class 'spec'update_adapt_history(PSD, stage, ...)
## Default S3 method:update_adapt_history(PSD, stage, ntap = NA, freq = NULL,...)
new_adapt_history(adapt_stages)

20 psd-environment
Arguments
verbose logical; should messages be given?variable character; the name of the variable to get or assignvalue character; the name of the variable to assignPSD vector or object with class 'spec'; the power spectral density estimatesstage scalar; the current stage of the adaptive estimation procedure... additional argumentsntap vector; the tapersfreq vector; the frequenciesadapt_stages scalar; The number of adaptive iterations to save (excluding pilot spectrum).
Defaults and Initialization
One can use get_psd_env_pointer() and get_psd_env_name() to access the pointer and nameof the environment, if needed.
psd_envRefresh should be used when a fresh environment is desired: typically only if, for exam-ple, psdcore is used rather than pspectrum.
Assigning and Retieving
psd_envAssign and psd_envGet perform the assignments and retrieval of objects in the environ-ment. A convenience function, psd_envAssignGet, is included so that both assignment and re-trieval may be performed at the same time. This ensures the assignment has succeeded, and thereturned value is not from some other frame.
Getters and Setters
The functions here can be classified whether the get, or set variables in the environment; some doboth. Others make no modifications to the environment.
Getter:• get_adapt_history
• get_psd_env_name
• get_psd_env_pointer
• psd_envGet
• psd_envList
• psd_envStatus
Setter:• new_adapt_history
• psd_envAssign
Getter and Setter:• psd_envAssignGet
• psd_envClear
• psd_envRefresh
• update_adapt_history

psd-normalization 21
Adaptive History
The list object for historical adapt-data may be accessed with get_adapt_history. The top namesof the returned list are
stg_kopt Sequential taper vectors.
stg_psd Sequential power spectral density vectors.
freq The frequencies for each set of stg_kopt and stg_psd.
Note
psd_envClear does not remove the environment–simply the assignments within it.
See Also
psd-utilities, pspectrum
Examples
## Not run: #REXlibrary(psd)
#### psd working environment##
# Get some status information about the psd working environmentpsd_envStatus()
# Get a list of all variablespsd_envList()
# Pull the variable "init" into .GlobalEnvprint(x <- psd_envGet("init"))
# Pull the adaptive history into .GlobalEnvset.seed(1234)X <- rnorm(1e3)pspectrum(X)get_adapt_history()
## End(Not run)#REX
psd-normalization Normalization of power spectral density estimates.
Description
Normalize power spectral densities from various estimators into single-sided spectra.

22 psd-normalization
Usage
normalize(Spec, ...)
## S3 method for class 'list'normalize(Spec, ...)
## S3 method for class 'spec'normalize(Spec, Fsamp = 1, src = c("spectrum","double.sided", "psd", "single.sided"), verbose = TRUE, ...)
## S3 method for class 'amt'normalize(Spec, ...)
Arguments
Spec spectrum to normalize... (unused) additional parametersFsamp sampling frequencysrc character string; the source of the spectrum estimatorverbose logical; should messages be given?
Details
Normalizations commonly encountered for power spectra depend on it’s assumed sidedness: whetherthe spectrum is either single- or double-sided. The normalizations performed here enforce single-sidedness, and correct as necessary.
Frequencies are assumed to be based on the Nyquist frequency (half the sampling rate). For exam-ple: If a series X has sampling frequency FS , then the PSD frequencies will span [0, FS/2].
For amplitudes, improper normalization can can introduce errant factors of either 1/2 or FS into theestimates, depending on the assumed sidedness. These factors can be accounted for with the srcargument, which defaults to normalizing a double-sided spectrum.
Value
An object with its spectral values normalized accordingly.
Spectrum sidedness and the src argument
"double.sided" or "spectrum":These spectra assume frequency range of [−FS/2, FS/2], and so are normalized by scaling by afactor of two upwards. Some estimators producing double-sided spectra:
• stats::spectrum
• RSEIS::mtapspec
"single.sided" or "psd": As mentioned before, these spectra assume frequency range of[0, FS/2] and are scaled only by the inverse of the sampling rate. Some estimators producingsingle-sided spectra:
• psdcore
psd-normalization 23
Author(s)
A.J. Barbour
See Also
psdcore, spectral_properties
Examples
## Not run: #REXlibrary(psd)
#### Normalization##
# timeseries with sampling frequency **not** equal to 1:set.seed(1234)X <- ts(rnorm(1e3), frequency=20)
# spec.pgram: double sidedpgram <- spectrum(X)
# psdcore: single sidedPSD <- psdcore(X)
# note the normalization differences:plot(pgram, log="dB", ylim=c(-40,10))plot(PSD, add=TRUE, col="red", log="dB")
# A crude representation of integrated spectrum:# should equal variance of white noise series (~= 1)mean(pgram[['spec']]) * max(pgram[['freq']])mean(PSD[['spec']]) * max(PSD[['freq']])
# normalizepgram <- normalize(pgram, src="spectrum")PSD <- normalize(pgram, src="psd")# replot themplot(pgram, log="dB", ylim=c(-40,10))plot(PSD, add=TRUE, col="red", log="dB")
# Again, integrated spectrum should be ~= 1:mean(pgram[['spec']]) * max(pgram[['freq']])mean(PSD[['spec']]) * max(PSD[['freq']])
## End(Not run)#REX

24 psd-utilities
psd-utilities Various utility functions.
Description
The various utility functions are:
vardiff returns the variance of the first (or second) difference of the series. varddiff is a conve-nience wrapper to return variance for the second difference.
create_poly generates an x-y sequence compatible for use with polygon
dB returns an object converted to decibels.
vector_reshape reshapes a vector into another vector.
colvec returns the object as a vertically long vector; whereas rowvec returns the object as a hori-zontally long vector.
is.spec and is.amt report whether an object has class 'spec' or 'amt', as would one returnedby, for example, spectrum or psdcore.
is.tapers reports whether an object has class 'tapers', as would one returned by, for example,as.tapers.
na_mat populates a matrix of specified dimensions with NA values.
zeros populate a column-wise matrix with zeros; whereas, ones populates a column-wise matrixwith ones. Note that n is enforced to be at least 1 for both functions.
mod finds the modulo division of two values
Usage
vardiff(x, double.diff = FALSE)
varddiff(x)
## S3 method for class 'spec'varddiff(x)
## Default S3 method:varddiff(x)
create_poly(x, y, dy, from.lower = FALSE)
dB(Rat, invert = FALSE, pos.only = TRUE, is.power = FALSE)
vector_reshape(x, vec.shape = c("horizontal", "vertical"))
colvec(x)
rowvec(x)

psd-utilities 25
is.spec(Obj)
is.amt(Obj)
is.tapers(Obj)
na_mat(nrow, ncol = 1)
zeros(nrow)
ones(nrow)
mod(x, y)
Arguments
x,y objects; in create_poly these are the vectors used to create a polygon-compatiblesequence (x is sorted by default); in mod these are the "numerator" and "denom-inator", respectively.
double.diff logical; should the double difference be used instead?
dy numeric; the distance from y to the top and bottom of the polygonal surfaces;see from.lower
from.lower logical; should the bottom be y instead of y+dy, so that dy represents the distancefrom the lower surface?
Rat numeric; the values – ratios – to convert to decibels (dB).
invert logical; assumes Rat is already in decibels, so return ratio
pos.only logical; if invert=FALSE, sets negative or zero values to NA
is.power logical; should the factor of 2 be included in the decibel calculation?
vec.shape choice between horizontally-long or vertically-long vector.
Obj An object to test for class inheritance.
nrow,ncol integer; the number of rows and/or columns to create
Details
Decibels are defined as 10 log 10X1
X2, unless is.power=TRUE in which dbX2 ≡ 20 log 10X
2
colvec, rowvec are simple wrapper functions to vector_reshape.
Modulo division has higher order-of-operations ranking than other arithmetic operations; hence,x + 1 %% y is equivalent to x + (1 %% y) which can produce confusing results. mod is simply aseries of trunc commands which reduces the chance for unintentionally erroneous results.
Value
vector_reshape returns a "reshaped" vector, meaning it has had it’s dimensions changes so that ithas either one row (if vec.shape=="horizontal"), or one column ("vertical").

26 psd-utilities
is.spec, is.amt, and is.tapers return the output of inherits.
na_mat returns a matrix of dimensions (nrow,ncol) with NA values, the representation of which isset by NA_real_
mod returns the result of a modulo division, which is equivalent to (x) %% (y).
Note
The performance of mod has not been tested against the %% arithmetic method – it may or may notbe slower for large numeric vectors.
Author(s)
A.J. Barbour
References
For mod: see Peter Dalgaard’s explanation of the non-bug (#14771) I raised (instead I should’veasked it on R-help): https://bugs.r-project.org/bugzilla3/show_bug.cgi?id=14771#c2
See Also
psd-package, as.tapers, modulo_floor
Examples
## Not run: #REXlibrary(psd)
#### Various utilities##
set.seed(1234)X <- rnorm(1e2)
## Matrix and vector creation:## NA matrixnd <- 5na_mat(nd)na_mat(nd,nd-1)
# zeroszeros(nd)
# and onesones(nd)
## Check for tapers object:

psdcore 27
#is.tapers(X)is.tapers(as.tapers(X))
## Check for spec object:#PSD <- spectrum(X, plot=FALSE)plot(PSD)# return is class 'spec'is.spec(PSD) # TRUE# but the underlying structure is just a listPSD <- unclass(PSD)is.spec(PSD) # FALSE
## decibels#dB(1) # signal is equal <--> zero dBsig <- 1e-10all.equal(sig, dB(dB(sig), invert=TRUE))pow <- sig**2all.equal(pow, dB(dB(sig, is.power=TRUE), invert=TRUE, is.power=TRUE))
## Variance of difference series#vardiff(X) # first differencevarddiff(X) # second differenceall.equal(vardiff(X, TRUE), varddiff(X))
## modulo division#x <- 1:10mc1a <- mod(1,2)mc2a <- mod(1+x,2)mc1b <- 1 %% 2mc2b <- 1 + x %% 2mc2c <- (1 + x) %% 2all.equal(mc1a, mc1b) # TRUEall.equal(mc2a, mc2b) # "Mean absolute difference: 2"all.equal(mc2a, mc2c) # TRUE# on a seriesmodulo_floor(1:10) # defaults to 2modulo_floor(1:10, 3)
## End(Not run)#REX
psdcore Multitaper power spectral density estimates of a series

28 psdcore
Description
Compute power spectral density (PSD) estimates for the input series using sine multitapers. This isused by pspectrum for the adaptive estimation procedure.
Usage
psdcore(X.d, ...)
## S3 method for class 'ts'psdcore(X.d, ...)
## Default S3 method:psdcore(X.d, X.frq = NULL, ntaper = as.tapers(5),preproc = TRUE, na.action = stats::na.fail, plot = FALSE,refresh = FALSE, verbose = FALSE, ndecimate, ...)
Arguments
X.d the series to estimate a spectrum for
... additional parameters
X.frq scalar; the sampling information (see section Sampling)
ntaper scalar, vector, or tapers; the number of sine tapers to apply at each frequency
preproc logical; should X.d have a linear trend removed?
na.action function to deal with NA values
plot logical; should the estimates be shown compared to the spectrum-based esti-mates? Note that this will add some computation time, since the cosine-taperedperiodogram is calculated inside pgram_compare.
refresh logical; ensure a free environment prior to execution
verbose logical; should warnings and messages be given?
ndecimate now ignored
Details
Tapering: The parameter ntaper specifies the number of sine tapers to be used at each fre-quency: equal tapers at each frequency for a scalar; otherwise, use ntaper[j] sine tapers atfrequency[j].
Truncation: The series, with lengthN , is necessarily truncated so that 1+N/2 evenly spaced fre-quencies are returned. This truncation makes the series length “highly composite", which the dis-crete Fourier transform (DFT) is most efficient. The "fftw" vignette (accessed with vignette("fftw",package="psd"))shows how the performance of a DFT can be affected by series length.
Decimation: No longer supported. Setting ndecimate will not affect the results
Sampling: If X.frq is NULL, the value is assumed to be 1, unless X.d is a 'ts' object. IfX.frq > 0 it’s assumed the value represents frequency (e.g. Hz). If X.frq < 0 it’s assumed thevalue represents interval (e.g. seconds).

pspectrum 29
Value
An on object of class 'amt','spec', which has a structure similar to a regular 'spec' object, butwith a few additional fields, invisibly.
Author(s)
A.J. Barbour; original algorithm by R.L. Parker.
See Also
pspectrum, riedsid, parabolic_weights, pgram_compare
Examples
## Not run: #REXlibrary(psd)
#### Multitaper PSD estimation##
set.seed(1234)X <- rnorm(1e3)
# use the defaults, and appeal to plot.spec# sampling assumed to be 1plot(psdcore(X))
# use more tapers, compare to stats::spectrum, and clear# env data from the previous calculationpsdcore(X, ntaper=10, plot=TRUE, refresh=TRUE)
# change the sampling frequency to 20psdcore(X, X.frq=20, ntaper=10, plot=TRUE, refresh=TRUE)
## End(Not run)#REX
pspectrum Adaptive sine multitaper power spectral density estimation
Description
This is the primary function to be used in this package: it returns power spectral density estimatesof a univariate timeseries, with an optimal number of tapers at each frequency based on iterativereweighted spectral derivatives.

30 pspectrum
Usage
pspectrum(x, ...)
## S3 method for class 'ts'pspectrum(x, ...)
## S3 method for class 'spec'pspectrum(x, ...)
## Default S3 method:pspectrum(x, x.frqsamp = 1, ntap.init = NULL, niter = 5,AR = FALSE, Nyquist.normalize = TRUE, verbose = TRUE,no.history = FALSE, plot = FALSE, ...)
pspectrum_basic(x, ntap.init = 7, niter = 5, verbose = TRUE, ...)
adapt_message(stage, dvar = NULL)
Arguments
x vector; series to find PSD estimates for
... Optional parameters passed to riedsid
x.frqsamp scalar; the sampling rate (e.g. Hz) of the series x; equivalent to frequency.
ntap.init scalar; the number of sine tapers to use in the pilot spectrum estimation; if NULLthen the default in pilot_spec is used.
niter scalar; the number of adaptive iterations to execute after the pilot spectrum isestimated.
AR logical; should the effects of an AR model be removed from the pilot spectrum?Nyquist.normalize
logical; should the units be returned on Hz, rather than Nyquist?
verbose logical; Should messages be given?
no.history logical; Should the adaptive history not be saved?
plot logical; Should the results be plotted?
stage integer; the current adaptive stage (0 is pilot)
dvar numeric; the spectral variance; see also vardiff etc
Details
See the Adaptive estimation section in the description of the psd-package for details regardingadaptive estimation.
pspectrum_basic is a simplified implementation used mainly for testing.
Value
Object with class ’spec’, invisibly. It also assigns the object to "final_psd" in the working envi-ronment.

rcpp_ctap_simple 31
Author(s)
A.J. Barbour adapted original by R.L. Parker
See Also
psdcore, pilot_spec, riedsid, prewhiten
Examples
## Not run: #REXlibrary(psd)library(RColorBrewer)
#### Adaptive multitaper PSD estimation## (see also the "psd_overview" vignette)##
data(magnet)Xr <- magnet$rawXc <- magnet$clean
# adaptive psd estimation (turn off diagnostic plot)PSDr <- pspectrum(Xr, plot=FALSE)PSDc <- pspectrum(Xc, plot=FALSE)
# plot them on the same scaleplot(PSDc, log="dB",
main="Raw and cleaned Project MAGNET power spectral density estimates",lwd=3, ci.col=NA, ylim=c(0,32), yaxs="i")
plot(PSDr, log="dB", add=TRUE, lwd=3, lty=5)text(c(0.25,0.34), c(11,24), c("Clean","Raw"), cex=1)
## Change sampling, and inspect the diagnostic plotplot(pspectrum(Xc, niter=1, x.frqsamp=10, plot=TRUE))
## Say we forgot to assign the results: we can recover from the environment with:PSDc_recovered <- psd_envGet("final_psd")plot(PSDc_recovered)
## End(Not run)#REX
rcpp_ctap_simple c++ implementation of constrain filter
Description
c++ implementation of constrain filter

32 resample_fft_rcpp
Usage
rcpp_ctap_simple(tapvec, maxslope = 1L)
Arguments
tapvec,maxslope
see ctap_simple
resample_fft_rcpp Resample an fft using varying numbers of sine tapers
Description
Produce an un-normalized psd based on an fft and a vector of optimal sine tapers
Usage
resample_fft_rcpp(fftz, tapers, verbose = TRUE, dbl = TRUE,tapcap = 1000L)
Arguments
fftz complex; a vector representing the dual-length fft; see also the dbl argument
tapers integer; a vector of tapers
verbose logical; should messages be given?
dbl logical; should the code assume fftz is dual-length or single-length?
tapcap integer; the maximum number of tapers which can be applied; note that thelength is automatically limited by the length of the series.
Details
To produce a psd estimate with our adaptive spectrum estimation method, we need only make onefft calculation initially and then apply the weighting factors given by parabolic_weights_rcpp,which this function does.
See Also
riedsid
Examples
fftz <- complex(real=1:8, imaginary = 1:8)taps <- 1:4try(resample_fft_rcpp(fftz, taps))

riedsid 33
riedsid Constrained, optimal tapers using the Riedel & Sidorenko–Parkermethod
Description
Estimates the optimal number of tapers at each frequency of given PSD, using a modified Riedel-Sidorenko MSE recipe (RS-RLP).
Usage
riedsid(PSD, ...)
## S3 method for class 'spec'riedsid(PSD, ...)
## Default S3 method:riedsid(PSD, ntaper = 1L, tapseq = NULL,Deriv.method = c("local_qls", "spg"), constrained = TRUE,c.method = NULL, verbose = TRUE, ...)
riedsid2(PSD, ...)
## S3 method for class 'spec'riedsid2(PSD, ...)
## Default S3 method:riedsid2(PSD, ntaper = 1L, constrained = TRUE,verbose = TRUE, ...)
Arguments
PSD vector or class 'amt' or 'spec'; the spectral values used to optimize taper num-bers
... optional argments passed to constrain_tapers
ntaper scalar or vector; number of tapers to apply optimization
tapseq vector; representing positions or frequencies (same length as PSD)
Deriv.method character; choice of gradient estimation method
constrained logical; apply constraints with constrain_tapers; FALSE turns off constraints
c.method string; constraint method to use with constrain_tapers, only if constrained=TRUE
verbose logical; should messages be printed?

34 riedsid
Details
The optimization is as follows. First, weighted derivatives of the input PSD are computed. Usingthose derivates the optimal number of tapers is found through the RS-RLP formulation. Constraintsare then placed on the practicable number of tapers.
riedsid2 is a new implementation which does not allow for multiple constraint methods; this isthe preferred function to use.
Taper constraints: The parameter c.method provides an option to change the method of taperconstraints. A description of each may be found in the documentation for constrain_tapers.Once can use constrained=FALSE to turn off all taper constraints; this could lead to strangebehavior though.
Spectral derivatives: The parameter Deriv.method determines which method is used to esti-mate derivatives.
• "local_qls" (default) uses quadratic weighting and local least-squares estimation; this canbe slower than "spg".
• "spg" uses splineGrad; then, additional arguments may be passed to control the smoothnessof the derivatives (e.g spar in smooth.spline).
Value
Object with class 'tapers'
Warning
The "spg" can become numerically unstable, and it’s not clear when it will be the preferred overthe "local_qls" method, other than for efficiency’s sake.
Author(s)
A.J. Barbour adapted original by R.L. Parker
See Also
constrain_tapers, resample_fft_rcpp, psdcore, pspectrum
Examples
## Not run: #REXlibrary(psd)
#### Riedel-Sidorenko-Parker taper optimization##
set.seed(1234)# some paramsnd <- 512 # num datantap <- 10 # num tapers

spec-methods 35
nrm <- 40 # sharpness of the peaks rel 2*variance## create a pseudo spectrum# with broad peaksx <- 0:(nd-1)riex <- rnorm(nd) + nrm*abs(cos(pi*x/180) + 1.2)riex <- riex + 8*nrm*dcauchy(x, nd/3)riex <- riex + 5*nrm*dnorm(x, nd/2)# some flat regionsriex[riex<25] <- 25ried <- dB(riex, invert=TRUE)
# optimize tapersrtap <- riedsid(riex, ntaper=ntap)rtap2 <- riedsid2(riex, ntaper=ntap)
# plotop <- par(no.readonly = TRUE)par(mfrow=c(2,1), mar=rep(1.3,4), mai=rep(0.6,4))# ... the mock spectrumplot(riex, type="h", xaxs="i", ylim=c(0,200), main='Pseudo-spectrum')# ... the optimal tapersplot(rtap2, main='Optimal tapers')# original tapers:lines(rtap, col="red")par(op)
## End(Not run)#REX
spec-methods Generic methods for objects with class ’spec’
Description
Generic methods for objects with class 'spec'
Usage
## S3 method for class 'spec'as.list(x, ...)
as.spec(x, ...)
## S3 method for class 'amt'as.spec(x, ...)
## S3 method for class 'spec'lines(x, y = NULL, type = "l", ...)

36 spec-methods
## S3 method for class 'spec'as.data.frame(x, ...)
data.frame.spec(x, ...)
Arguments
x a 'spec' object
... optional arguments
y optional coordinate vector for the y-axis
type character; the type of plot
Details
Objects with class 'spec' are simply lists with spectral estimates and parameters as.data.frameconverts the list into a 'data.frame' with individual columns for the frequency, PSD, and tapervectors; all other information will be retained as an attribute.
Author(s)
A.J. Barbour
Examples
## Not run: #REXlibrary(psd)
#### Objects with class 'spec'##
set.seed(1234)xn <- rnorm(10)x <- spectrum(xn, plot=FALSE)xc <- psdcore(xn)
xdf <- as.data.frame(x)str(xdf)is.tapers(xdf$taper)
xdfc <- as.data.frame(xc)str(xdfc)is.tapers(xdfc$taper)
## End(Not run)#REX

spectral_properties 37
spectral_properties Calculate properties of multitaper power spectral density estimates
Description
Various spectral properties may be computed from the vector of tapers, and if necessary the sam-pling frequency.
Usage
spectral_properties(tapvec, ...)
## S3 method for class 'spec'spectral_properties(tapvec, ...)
## S3 method for class 'tapers'spectral_properties(tapvec, ...)
## Default S3 method:spectral_properties(tapvec, f.samp = 1, n.freq = NULL,p = 0.95, db.ci = FALSE, ...)
Arguments
tapvec object with class 'tapers' or 'spec'
... additional arguments (unused)
f.samp scalar; the sampling frequency (e.g. Hz) of the series the tapers are for
n.freq scalar; the number of frequencies of the original spectrum (if NULL the length ofthe tapers object is assumed to be the number)
p numeric; the coverage probability, bound within [0, 1)
db.ci logical; should the uncertainty confidence intervals be returned as decibels?
Details
Parameter Details:
Uncertainty: See spec_confint for details.
Resolution: The frequency resolution depends on the number of tapers (K), and is found from
K · fNNf
where fN is the Nyquist frequency and Nf is the number of frequencies estimated.
Degrees of Freedom: There are two degrees of freedom for each taper K:
ν = 2K

38 spectral_properties
Bandwidth: The bandwidth of a multitaper estimate depends on the number of tapers. FollowingWalden et al (1995) the effective bandwidth is ≈ 2W where
W =K + 1
2N
and N is the number of terms in the series, which makes N ·W the approximate time-bandwidthproduct.
Value
A list with the following properties (and names):
• taper: The original taper vector.
• stderr.chi .upper, .lower, .median: results returned from spec_confint.
• resolution: The effective spectral resolution.
• dof: The number of degrees of freedom.
• bw: The effective bandwidth of the spectrum.
Author(s)
A.J. Barbour
See Also
spec_confint, psd-package
Examples
## Not run: #REXlibrary(psd)
#### Spectral properties from the number of tapers used## (portions extracted from overview vignette)##
## Theoretical uncertainties from Chi^2 distribution#sp <- spectral_properties(as.tapers(1:50), p=0.95, db.ci=TRUE)par(las=1)plot(stderr.chi.upper ~ taper, sp, type="s",
ylim=c(-10,20), yaxs="i", xaxs="i",xlab=expression("number of tapers ("* nu/2 *")"), ylab="dB",main="Spectral uncertainties")
lines(stderr.chi.lower ~ taper, sp, type="s")lines(stderr.chi.median ~ taper, sp, type="s", lwd=2)lines(stderr.chi.approx ~ taper, sp, type="s", col="red",lwd=2)
#

spectral_properties 39
# An example using the Project MAGNET dataset#data(magnet)tapinit <- 15 # tapersdt <- 1 # 1/km
# remove mean/trend (not really necessary but good practice; also, done internally)ats <- prewhiten(ts(magnet$clean, deltat=dt), plot=FALSE)$prew_lm
# normal and adaptive multitaper spectraPspec <- psdcore(ats, dt, tapinit)Aspec <- pspectrum(ats, dt, tapinit, niter=3, plot=FALSE)
# calculate spectral propertiesspp <- spectral_properties(Pspec$taper, db.ci=TRUE)spa <- spectral_properties(Aspec$taper, db.ci=TRUE)
# function to create polygon data, and create thempspp <- create_poly(Pspec$freq, dB(Pspec$spec), spp$stderr.chi.approx)psppu <- create_poly(Pspec$freq, dB(Pspec$spec), spp$stderr.chi.upper)pspa <- create_poly(Aspec$freq, dB(Aspec$spec), spa$stderr.chi.approx)pspau <- create_poly(Aspec$freq, dB(Aspec$spec), spa$stderr.chi.upper)
#### Project MAGNET uncertainties##plot(c(0,0.5),c(-8,35),col="white",
main="Project MAGNET Spectral Uncertainty (p > 0.95)",ylab="", xlab="spatial frequency, 1/km", yaxt="n", frame.plot=FALSE)
lines(c(2,1,1,2)*0.01,c(5,5,8.01,8.01)-8)text(.05, -1.4, "3.01 dB")polygon(psppu$xx, (psppu$yy), col="light grey", border="black", lwd=0.5)polygon(pspp$xx, (pspp$yy), col="dark grey", border=NA)text(0.15, 6, "With adaptive\ntaper refinement", cex=1.2)polygon(pspau$xx, (pspau$yy)-10, col="light grey", border="black", lwd=0.5)polygon(pspa$xx, (pspa$yy)-10, col="dark grey", border=NA)text(0.35, 22, "Uniform tapering", cex=1.2)
#### Project MAGNET resolution##frq <- Aspec$freqrelp <- dB(1/spa$resolution)par(las=1)plot(frq, relp,
col="light grey",ylim=dB(c(1,5)),type="h", xaxs="i", yaxs="i",ylab="dB", xlab="frequency, 1/km",main="Project MAGNET Spectral Resolution and Uncertainty")
lines(frq, relp)lines(frq, spp$stderr.chi.upper+relp, lwd=1.5, lty=3)lines(frq, spa$stderr.chi.upper+relp, lwd=3, lty=2)

40 spec_confint
abline(h=dB(sqrt(vardiff(Aspec$spec))), lwd=1.5, lty=2, col="red")
##
## End(Not run)#REX
spec_confint Confidence intervals for multitaper power spectral density estimates
Description
Confidence intervals for multitaper power spectral density estimates
Usage
spec_confint(dof, p = 0.95, as.db = FALSE)
## S3 method for class 'spec'spec_confint(dof, p = 0.95, as.db = FALSE)
## S3 method for class 'tapers'spec_confint(dof, p = 0.95, as.db = FALSE)
## Default S3 method:spec_confint(dof, p = 0.95, as.db = FALSE)
Arguments
dof numeric; the degrees of freedom ν
p numeric; the coverage probability p, bound within [0, 1)
as.db logical; should the values be returned as decibels?
Details
The errors are estimated from the number of degrees of freedom ν by evaluating the χ2p,ν(ν, ν)
distribution for an optional coverage probability p (defaulting to p = 0.95). Additionally, thep = 0.5 values and an approximation from 1/
√ν − 1 are returned.
A more sophisticated (and complicated) approach would be to estimate via jack-knifing (Prieto etal 2007), but this is not yet made available.
Additive uncertainties δS are returned, such that the spectrum with confidence interval is S ± δS.

spec_confint 41
Value
A data.frame with the following properties (and names):
• lower: Based on upper tail probabilities (p)
• upper: Based on lower tail probabilities (1− p)
• median: Based on lower tail probabilities (p = 0.5)
• approx: Approximation based on 1/√(ν − 1).
Author(s)
A.J. Barbour; some code modified from the spec.ci function inside plot.spec
See Also
spectral_properties, psd-package, plot.spec, dB
Examples
## Not run: #REXlibrary(psd)
#### Confidence intervals from taper numbers##
sp <- spectral_properties(as.tapers(1:50), p=0.95, db.ci=TRUE)
# standard errors as a function of taperspar(las=1)plot(stderr.chi.upper ~ taper, sp, type="s",
ylim=c(-10,20), yaxs="i", xaxs="i",xlab=expression("number of tapers ("* nu/2 *")"), ylab="dB",main="Spectral uncertainties")
mtext("(additive factor)", line=.3)lines(stderr.chi.lower ~ taper, sp, type="s")lines(stderr.chi.median ~ taper, sp, type="s", lwd=2)lines(stderr.chi.approx ~ taper, sp, type="s", col="red",lwd=2)# indicate K needed to reach 3 dB wide confidence interval (p=.95)abline(v=33, lty=3)legend("topright",
c(expression("Based on "* chi^2 *"(p,"*nu*") and (1-p,"*nu*")"),expression(""* chi^2 *"(p=0.5,"*nu*")"),"approximation"),
lwd=c(1,3,3),col=c("black","black","red"),bg="grey98")
## End(Not run)#REX

42 splineGrad
splineGrad Numerical derivatives of a series based on its smooth-spline represen-tation
Description
This computes the numerical derivatives of a spline representation of the input series; differentiationof spline curves is numerically efficient.
Usage
splineGrad(dseq, dsig, ...)
## Default S3 method:splineGrad(dseq, dsig, plot.derivs = FALSE, ...)
Arguments
dseq numeric; a vector of positions for dsig.
dsig numeric; a vector of values (which will have a spline fit to them).
... additional arguments passed to smooth.spline
plot.derivs logical; should the derivatives be plotted?
Details
With smoothing, the numerical instability for "noisy" data can be drastically reduced, since splinecurves are inherently (at least) twice differentiable.
Value
A matrix with columns representing x, f(x), f ′(x), f ′′(x)
Author(s)
A.J. Barbour
See Also
smooth.spline, constrain_tapers
Examples
## Not run: #REXlibrary(psd)
#### Spline gradient##

tapers-constraints 43
set.seed(1234)x <- seq(0,5*pi,by=pi/64)y <- cos(x) #**2
splineGrad(x, y, TRUE)
# unfortunately, the presence of# noise will affect numerical derivativesy <- y + rnorm(length(y), sd=.1)splineGrad(x, y, TRUE)
# so change the smoothing used in smooth.splinesplineGrad(x, y, TRUE, spar=0.2)splineGrad(x, y, TRUE, spar=0.6)splineGrad(x, y, TRUE, spar=1.0)
## End(Not run)#REX
tapers-constraints Taper constraint methods
Description
In the Riedel-Sidorenko recipe, the number of optimal tapers at each frequency is strongly depen-dent on the first and second derivatives of the spectrum. It is crucial to enforce constraints on thenumber of actual tapers applied; this is because the derivatives of "noisy" series can be bogus.
constrain_tapers refines the number of tapers at each frequency.
minspan sets bounds on the number of tapers at each frequency.
Usage
constrain_tapers(tapvec, ...)
## S3 method for class 'tapers'constrain_tapers(tapvec, ...)
## Default S3 method:constrain_tapers(tapvec, tapseq = NULL,constraint.method = c("simple.slope.rcpp", "simple.slope", "loess.smooth","none"), verbose = TRUE, ...)
minspan(tapvec, ...)
## S3 method for class 'tapers'minspan(tapvec, ...)

44 tapers-constraints
## Default S3 method:minspan(tapvec, Kmin = NULL, Kmax = NULL, ...)
Arguments
tapvec 'tapers' object; the number of tapers at each frequency
... optional arguments sent to the constrain function (e.g. ctap_simple)
tapseq vector; positions or frequencies – necessary for smoother methodsconstraint.method
character; method to use for constraints on tapers numbers
verbose logical; should warnings and messages be given?
Kmin numeric; the minimum to set; default is 1
Kmax numeric; the maximum to set; default is the minimum of either (7/5 max value),or (1/2 series length)
Details
The method by which constrain_tapers refines tapers is set with the constraint.method argu-ment:
• 'simple.slope.rcpp' uses ctap_simple_rcpp
• 'simple.slope' uses ctap_simple
• 'loess.smooth' uses ctap_loess
• 'none' returns unbounded tapers.
minspan bounds the number of tapers to within the minimum of either the maximum number oftapers found in the object, or the half-length of the series, which is necessary because it would benonsense to have more tapers than the length of the series.
Details of the constraint methods:
via first differencing (the default):ctap_simple_rcpp is the preferred constraint method (in previous versions ctap_simple was).The algorithm uses first-differencing to modify the number of tapers in the previous position.Effectively, the constraint is based on a causal, 1st-order Finite Impulse-response Filter (FIR)which makes the method sensitive to rapid changes in the number of tapers; naturally, smootherspectra tend to produce less fluctuation in taper numbers, which makes this well suited for adaptiveprocessing.This produces, generally, the most stable results, meaning repeatedly running the constraint willnot change values other than on the first execution; the same cannot be said for the other methods,which are also considerably more expensive to use.
via LOESS smoothing:ctap_loess uses loess to smooth the taper vector; is can be very slow thanks to quadratic scal-ing.

tapers-constraints 45
Value
constrain_tapers: an object with class 'tapers'; minspan: a vector
Warning
ctap_loess results tend to be strongly dependent on the tuning parameters given to loess (forobvious reasons); hence, some effort should be given to understand their effect, and/or re-tuningthem if needed.
Author(s)
A.J. Barbour and R.L. Parker
See Also
riedsid, ctap_simple_rcpp, ctap_loess, tapers
Examples
## Not run: #REXlibrary(psd)
#### Taper constraint procedures##
data(magnet)X <- magnet$clean
#### spectrumPSD <- psdcore(X, ntaper=10, refresh=TRUE)## optimize taperskopt <- riedsid(PSD)kopt.loess <- riedsid(PSD, c.method="loess.smooth")#plot(kopt, log.y=TRUE, ylim =c(.1, 3e2))lines(kopt.loess)
#### To compare all the methods at once:demo("ctap")
## End(Not run)#REX

46 tapers-methods
tapers-methods Generic methods for objects with class ’tapers’
Description
Generic methods for objects with class 'tapers'
Usage
## S3 method for class 'tapers'as.data.frame(x, ...)
data.frame.tapers(x, ...)
## S3 method for class 'tapers'print(x, ...)
## S3 method for class 'tapers'summary(object, ...)
## S3 method for class 'summary.tapers'print(x, ...)
## S3 method for class 'tapers'lines(x, lwd = 1.8, col = "red", ...)
## S3 method for class 'tapers'points(x, pch = "_", cex = 1, ...)
## S3 method for class 'tapers'plot(x, xi = NULL, color.pal = c("Blues", "Spectral"),ylim = NULL, hv.lines = FALSE, log.y = FALSE, ...)
Arguments
x tapers object
... optional arguments
object tapers object
lwd line width (default is 1.8)
col color of line (default is "red")
pch point character (default is "_")
cex point size (default is 1)
xi optional vector for indices of x
color.pal color palette to use (choices are: "Blues","Spectral")

Tohoku 47
ylim optional limits for y-axis
hv.lines logical; should horizontal (log2) and vertical reference lines be plotted?
log.y logical; should the vertical scale be logarithmic?
Value
plot returns a list with names: line.colors (hex values)
Author(s)
A.J. Barbour
See Also
as.tapers, constrain_tapers
Examples
##tap <- as.tapers(c(1:49,50:0)+rnorm(1e2))print(tap)print(summary(tap))plot(tap)# no arithmetic methodstap <- as.tapers(tap/2)lines(tap)
Tohoku Observations of teleseismic strains from the 2011 Tohoku earthquake.
Description
The Mw9 Tohoku earthquake happend on March 11, 2011. The seismic waves were recordedat stations across the globe, including by strainmeters in the Plate Boundary Observatory (PBO)borehole strainmeters.
Format
A dataframe with 16000 observations on the following 15 variables.
Dts The original datetime string, in UTC.
areal Areal strains
areal.tide Tidal correction to the areal strains.
areal.baro Barometric correction to the areal strains.
gamma1 Engineering differential extensional strain: γ1gamma1.tide Tidal correction for the γ1 strains.

48 Tohoku
gamma1.baro Barometric pressure correction to the γ1 strains.gamma2 Engineering shear strain: γ2.gamma2.tide Tidal correction for the γ2 strains.gamma2.baro Barometric pressure correction to the γ2 strains.pressure.atm Atmospheric pressure.pressure.pore Pore-fluid pressure.Dt The Dts information converted to POSIX datetime.Origin.secs The number of seconds relative to the earthquake-origin time.epoch Classification based on predicted P-wave arrival: preseismic or seismic.
and 2 attributes:
units A list of strings regarding the units of various physical quantities given here.iasp A list of source and station characteristics, including the the origin time, predicted traveltimes
for P and S waves, and the geodetic information used in the traveltime calculation.
Details
These data are for station B084, which is located approximately 8500 km away from the epicenter.Because this distance is large, the seismic waves didn’t arrive at this station for more than 700seconds after the origin time. So there is a record of pre-seismic noise included, the timeseriesextends 6784 seconds prior to the origin time, and 9215 seconds after.
The data are classified with the "epoch" variable, which separates the series into pre-seismic andseismic data; this is defined relative to the predicted P-wave arrival time from a traveltime model.
The original dataset contained NA values, which were imputed using zoo::na.locf, which fills NAwith the last previous observation.
Source
PBO High Frequency archive:
http://borehole.unavco.org/bsm/earthquakes/NeartheEastCoastofHonshuJapan_20110311
References
USGS summary page:
http://earthquake.usgs.gov/earthquakes/eqinthenews/2011/usc0001xgp/
See Also
pspectrum, hfsnm, magnet
TauP.R for an R-implementation of the traveltime calculations:
http://cran.r-project.org/web/packages/TauP.R/
Examples
data(Tohoku)str(Tohoku)

Index
∗Topic datasetshfsnm, 8magnet, 9Tohoku, 47
adapt_message (pspectrum), 29as.data.frame.spec (spec-methods), 35as.data.frame.tapers (tapers-methods),
46as.list.spec (spec-methods), 35as.spec (spec-methods), 35as.tapers, 4, 24, 26, 47
colvec, 24colvec (psd-utilities), 24constrain_tapers, 6, 7, 33, 34, 42–45, 47constrain_tapers (tapers-constraints),
43create_poly, 24, 25create_poly (psd-utilities), 24ctap_loess, 5, 7, 44, 45ctap_simple, 7, 32, 44ctap_simple (ctap_simple_rcpp), 6ctap_simple_rcpp, 6, 6, 7, 44, 45
data.frame.spec (spec-methods), 35data.frame.tapers (tapers-methods), 46dB, 13, 24, 41dB (psd-utilities), 24db (psd-utilities), 24decibels (psd-utilities), 24
fft, 32frequency, 30
get_adapt_history, 21get_adapt_history (psd-environment), 18get_psd_env_name (psd-environment), 18get_psd_env_pointer (psd-environment),
18
hfsnm, 8, 9, 48
inherits, 26is.amt, 24is.amt (psd-utilities), 24is.spec, 24is.spec (psd-utilities), 24is.tapers, 5, 24is.tapers (psd-utilities), 24
last_psd (psd-environment), 18lines.spec (spec-methods), 35lines.tapers (tapers-methods), 46loess, 44log10, 13
magnet, 8, 9, 48minspan, 4, 43–45minspan (tapers-constraints), 43mod, 24–26mod (psd-utilities), 24modulo_floor, 10, 26
na_mat, 24na_mat (psd-utilities), 24new_adapt_history (psd-environment), 18nextn, 10normalization (psd-normalization), 21normalize (psd-normalization), 21
ones, 24ones (psd-utilities), 24
parabolic_weights, 11, 29parabolic_weights
(parabolic_weights_rcpp), 11parabolic_weights_fast, 11parabolic_weights_fast
(parabolic_weights_rcpp), 11parabolic_weights_rcpp, 11, 11, 32pgram_compare, 13, 28, 29
49

50 INDEX
pilot_spec, 14, 30, 31pilot_spectrum (pilot_spec), 14plot.tapers (tapers-methods), 46points.tapers (tapers-methods), 46polygon, 24, 25prewhiten, 15, 16, 31print.summary.tapers (tapers-methods),
46print.tapers (tapers-methods), 46psd (psd-package), 2psd-environment, 18psd-normalization, 21psd-package, 2psd-utilities, 24psd_envAssign (psd-environment), 18psd_envAssignGet (psd-environment), 18psd_envClear (psd-environment), 18psd_envGet (psd-environment), 18psd_envList (psd-environment), 18psd_envRefresh (psd-environment), 18psd_envStatus (psd-environment), 18psdcore, 3, 10, 12–15, 18, 20, 22–24, 27, 31,
34pspectrum, 2, 8, 9, 18, 20, 21, 28, 29, 29, 34,
48pspectrum_basic, 30pspectrum_basic (pspectrum), 29
rcpp_ctap_simple, 31resample_fft_rcpp, 11, 12, 32, 34riedsid, 3, 12, 29–32, 33, 45riedsid2, 34riedsid2 (riedsid), 33rowvec, 24rowvec (psd-utilities), 24
smooth.spline, 42spec-methods, 35spec.ar, 15spec.pgram, 13spec.pilot (pilot_spec), 14spec.psd (psd-package), 2spec_confint, 37, 38, 40spectral_properties, 3, 23, 37, 41spectrum, 24, 28splineGrad, 34, 42summary.tapers (tapers-methods), 46
tapers, 28, 45
tapers (as.tapers), 4tapers-constraints, 43tapers-methods, 46Tohoku, 8, 9, 47
update_adapt_history (psd-environment),18
varddiff, 24varddiff (psd-utilities), 24vardiff, 24, 30vardiff (psd-utilities), 24vector_reshape, 24vector_reshape (psd-utilities), 24
zeros, 24zeros (psd-utilities), 24