Embed Size (px)
Citation preview

Package ‘PivotalR’February 13, 2017
Type Package
Title A Fast, Easy-to-Use Tool for Manipulating Tables in Databasesand a Wrapper of MADlib
Version 0.1.18.3
Date 2017-2-7
Author Predictive Analytics Team at Pivotal Inc.
<[email protected]>, with contributions from Data Science Teamat Pivotal Inc.
Maintainer Rahul Iyer <[email protected]>
Contact Predictive Analytics Team at Pivotal Inc.
Depends R (>= 2.14.0), methods, Matrix
Suggests DBI, RPostgreSQL, shiny, testthat, tools, rpart,randomForest, topicmodels
Description Provides an R interface for the Pivotal Data stackrunning on 'PostgreSQL', 'Greenplum' or 'Apache HAWQ (incubating)'databases with parallel and distributed computation ability for big dataprocessing. 'PivotalR' provides an R interface to various databaseoperations on tables or views. These operations are almost the same asthe corresponding native R operations. Thus users of R do not needto learn 'SQL' when they operate on objects in the database. It alsoprovides a wrapper for 'Apache MADlib (incubating)', which is an open-source library for parallel and scalable in-database analytics.
License GPL (>= 2)
LazyLoad yes
LazyData yes
NeedsCompilation yes
Repository CRAN
Date/Publication 2017-02-13 23:34:46
1

2 R topics documented:
R topics documented:PivotalR-package . . . . . . . . . . . . . . . . . . . . . . . . . . . . . . . . . . . . . . 4abalone . . . . . . . . . . . . . . . . . . . . . . . . . . . . . . . . . . . . . . . . . . . 8Aggregate functions . . . . . . . . . . . . . . . . . . . . . . . . . . . . . . . . . . . . . 10AIC . . . . . . . . . . . . . . . . . . . . . . . . . . . . . . . . . . . . . . . . . . . . . 13Arith-methods . . . . . . . . . . . . . . . . . . . . . . . . . . . . . . . . . . . . . . . . 15array.len . . . . . . . . . . . . . . . . . . . . . . . . . . . . . . . . . . . . . . . . . . . 18arraydb.to.arrayr . . . . . . . . . . . . . . . . . . . . . . . . . . . . . . . . . . . . . . . 19as.db.data.frame . . . . . . . . . . . . . . . . . . . . . . . . . . . . . . . . . . . . . . . 21as.environment . . . . . . . . . . . . . . . . . . . . . . . . . . . . . . . . . . . . . . . 24as.factor-methods . . . . . . . . . . . . . . . . . . . . . . . . . . . . . . . . . . . . . . 25by . . . . . . . . . . . . . . . . . . . . . . . . . . . . . . . . . . . . . . . . . . . . . . 26cbind2-methods . . . . . . . . . . . . . . . . . . . . . . . . . . . . . . . . . . . . . . . 28clean.madlib.temp . . . . . . . . . . . . . . . . . . . . . . . . . . . . . . . . . . . . . . 30coef . . . . . . . . . . . . . . . . . . . . . . . . . . . . . . . . . . . . . . . . . . . . . 31Compare-methods . . . . . . . . . . . . . . . . . . . . . . . . . . . . . . . . . . . . . . 32conn.eql . . . . . . . . . . . . . . . . . . . . . . . . . . . . . . . . . . . . . . . . . . . 35conn.id . . . . . . . . . . . . . . . . . . . . . . . . . . . . . . . . . . . . . . . . . . . 36content . . . . . . . . . . . . . . . . . . . . . . . . . . . . . . . . . . . . . . . . . . . . 38crossprod . . . . . . . . . . . . . . . . . . . . . . . . . . . . . . . . . . . . . . . . . . 39db.connect . . . . . . . . . . . . . . . . . . . . . . . . . . . . . . . . . . . . . . . . . . 41db.data.frame . . . . . . . . . . . . . . . . . . . . . . . . . . . . . . . . . . . . . . . . 43db.data.frame-class . . . . . . . . . . . . . . . . . . . . . . . . . . . . . . . . . . . . . 44db.disconnect . . . . . . . . . . . . . . . . . . . . . . . . . . . . . . . . . . . . . . . . 46db.existsObject . . . . . . . . . . . . . . . . . . . . . . . . . . . . . . . . . . . . . . . 48db.list . . . . . . . . . . . . . . . . . . . . . . . . . . . . . . . . . . . . . . . . . . . . 49db.obj-class . . . . . . . . . . . . . . . . . . . . . . . . . . . . . . . . . . . . . . . . . 50db.objects . . . . . . . . . . . . . . . . . . . . . . . . . . . . . . . . . . . . . . . . . . 51db.q . . . . . . . . . . . . . . . . . . . . . . . . . . . . . . . . . . . . . . . . . . . . . 52db.Rcrossprod-class . . . . . . . . . . . . . . . . . . . . . . . . . . . . . . . . . . . . . 53db.Rquery-class . . . . . . . . . . . . . . . . . . . . . . . . . . . . . . . . . . . . . . . 54db.search.path . . . . . . . . . . . . . . . . . . . . . . . . . . . . . . . . . . . . . . . . 57db.table-class . . . . . . . . . . . . . . . . . . . . . . . . . . . . . . . . . . . . . . . . 58db.view-class . . . . . . . . . . . . . . . . . . . . . . . . . . . . . . . . . . . . . . . . 59delete . . . . . . . . . . . . . . . . . . . . . . . . . . . . . . . . . . . . . . . . . . . . 60dim-methods . . . . . . . . . . . . . . . . . . . . . . . . . . . . . . . . . . . . . . . . 63eql-methods . . . . . . . . . . . . . . . . . . . . . . . . . . . . . . . . . . . . . . . . . 64Extract database connection info . . . . . . . . . . . . . . . . . . . . . . . . . . . . . . 66Extract-Replace-methods . . . . . . . . . . . . . . . . . . . . . . . . . . . . . . . . . . 68Func-methods . . . . . . . . . . . . . . . . . . . . . . . . . . . . . . . . . . . . . . . . 70generic.bagging . . . . . . . . . . . . . . . . . . . . . . . . . . . . . . . . . . . . . . . 72generic.cv . . . . . . . . . . . . . . . . . . . . . . . . . . . . . . . . . . . . . . . . . . 73getTree.rf.madlib . . . . . . . . . . . . . . . . . . . . . . . . . . . . . . . . . . . . . . 76groups . . . . . . . . . . . . . . . . . . . . . . . . . . . . . . . . . . . . . . . . . . . . 77GUI . . . . . . . . . . . . . . . . . . . . . . . . . . . . . . . . . . . . . . . . . . . . . 79ifelse . . . . . . . . . . . . . . . . . . . . . . . . . . . . . . . . . . . . . . . . . . . . . 80is.db.data.frame . . . . . . . . . . . . . . . . . . . . . . . . . . . . . . . . . . . . . . . 81
R topics documented: 3
is.factor-methods . . . . . . . . . . . . . . . . . . . . . . . . . . . . . . . . . . . . . . 82is.na-method . . . . . . . . . . . . . . . . . . . . . . . . . . . . . . . . . . . . . . . . . 83key . . . . . . . . . . . . . . . . . . . . . . . . . . . . . . . . . . . . . . . . . . . . . . 84Logical-methods . . . . . . . . . . . . . . . . . . . . . . . . . . . . . . . . . . . . . . 85madlib.arima . . . . . . . . . . . . . . . . . . . . . . . . . . . . . . . . . . . . . . . . 87madlib.elnet . . . . . . . . . . . . . . . . . . . . . . . . . . . . . . . . . . . . . . . . . 91madlib.glm . . . . . . . . . . . . . . . . . . . . . . . . . . . . . . . . . . . . . . . . . 96madlib.kmeans . . . . . . . . . . . . . . . . . . . . . . . . . . . . . . . . . . . . . . . 101madlib.lda . . . . . . . . . . . . . . . . . . . . . . . . . . . . . . . . . . . . . . . . . . 103madlib.lm . . . . . . . . . . . . . . . . . . . . . . . . . . . . . . . . . . . . . . . . . . 105madlib.randomForest . . . . . . . . . . . . . . . . . . . . . . . . . . . . . . . . . . . . 109madlib.rpart . . . . . . . . . . . . . . . . . . . . . . . . . . . . . . . . . . . . . . . . . 111madlib.summary . . . . . . . . . . . . . . . . . . . . . . . . . . . . . . . . . . . . . . 113madlib.svm . . . . . . . . . . . . . . . . . . . . . . . . . . . . . . . . . . . . . . . . . 116margins . . . . . . . . . . . . . . . . . . . . . . . . . . . . . . . . . . . . . . . . . . . 120merge-method . . . . . . . . . . . . . . . . . . . . . . . . . . . . . . . . . . . . . . . . 123na.action . . . . . . . . . . . . . . . . . . . . . . . . . . . . . . . . . . . . . . . . . . . 125names-methods . . . . . . . . . . . . . . . . . . . . . . . . . . . . . . . . . . . . . . . 126null.data . . . . . . . . . . . . . . . . . . . . . . . . . . . . . . . . . . . . . . . . . . . 127perplexity.lda . . . . . . . . . . . . . . . . . . . . . . . . . . . . . . . . . . . . . . . . 129plot.dt.madlib . . . . . . . . . . . . . . . . . . . . . . . . . . . . . . . . . . . . . . . . 130predict . . . . . . . . . . . . . . . . . . . . . . . . . . . . . . . . . . . . . . . . . . . . 131predict.arima . . . . . . . . . . . . . . . . . . . . . . . . . . . . . . . . . . . . . . . . 134predict.bagging.model . . . . . . . . . . . . . . . . . . . . . . . . . . . . . . . . . . . 135predict.dt.madlib . . . . . . . . . . . . . . . . . . . . . . . . . . . . . . . . . . . . . . 136predict.elnet.madlib . . . . . . . . . . . . . . . . . . . . . . . . . . . . . . . . . . . . . 138predict.lda . . . . . . . . . . . . . . . . . . . . . . . . . . . . . . . . . . . . . . . . . . 139predict.rf.madlib . . . . . . . . . . . . . . . . . . . . . . . . . . . . . . . . . . . . . . 140preview . . . . . . . . . . . . . . . . . . . . . . . . . . . . . . . . . . . . . . . . . . . 141print . . . . . . . . . . . . . . . . . . . . . . . . . . . . . . . . . . . . . . . . . . . . . 143print-methods . . . . . . . . . . . . . . . . . . . . . . . . . . . . . . . . . . . . . . . . 145print.arima.madlib . . . . . . . . . . . . . . . . . . . . . . . . . . . . . . . . . . . . . . 146print.dt.madlib . . . . . . . . . . . . . . . . . . . . . . . . . . . . . . . . . . . . . . . . 147print.elnet.madlib . . . . . . . . . . . . . . . . . . . . . . . . . . . . . . . . . . . . . . 149print.lm.madlib . . . . . . . . . . . . . . . . . . . . . . . . . . . . . . . . . . . . . . . 150print.none.obj . . . . . . . . . . . . . . . . . . . . . . . . . . . . . . . . . . . . . . . . 151print.rf.madlib . . . . . . . . . . . . . . . . . . . . . . . . . . . . . . . . . . . . . . . . 151print.summary.madlib . . . . . . . . . . . . . . . . . . . . . . . . . . . . . . . . . . . . 153residuals . . . . . . . . . . . . . . . . . . . . . . . . . . . . . . . . . . . . . . . . . . . 154Row_actions . . . . . . . . . . . . . . . . . . . . . . . . . . . . . . . . . . . . . . . . . 155sample-methods . . . . . . . . . . . . . . . . . . . . . . . . . . . . . . . . . . . . . . . 157scale . . . . . . . . . . . . . . . . . . . . . . . . . . . . . . . . . . . . . . . . . . . . . 158sort . . . . . . . . . . . . . . . . . . . . . . . . . . . . . . . . . . . . . . . . . . . . . 160subset-methods . . . . . . . . . . . . . . . . . . . . . . . . . . . . . . . . . . . . . . . 161summary . . . . . . . . . . . . . . . . . . . . . . . . . . . . . . . . . . . . . . . . . . 162summary.arima.madlib . . . . . . . . . . . . . . . . . . . . . . . . . . . . . . . . . . . 163summary.elnet.madlib . . . . . . . . . . . . . . . . . . . . . . . . . . . . . . . . . . . . 164summary.lm.madlib . . . . . . . . . . . . . . . . . . . . . . . . . . . . . . . . . . . . . 165
4 PivotalR-package
text.dt.madlib . . . . . . . . . . . . . . . . . . . . . . . . . . . . . . . . . . . . . . . . 166Type Cast functions . . . . . . . . . . . . . . . . . . . . . . . . . . . . . . . . . . . . . 167unique-methods . . . . . . . . . . . . . . . . . . . . . . . . . . . . . . . . . . . . . . . 169vcov . . . . . . . . . . . . . . . . . . . . . . . . . . . . . . . . . . . . . . . . . . . . . 170
Index 173
PivotalR-package An R font-end to PostgreSQL and Greenplum database, and wrapperfor in-database parallel and distributed machine learning open-sourcelibrary MADlib
Description
PivotalR is a package that enables users of R, the most popular open source statistical programminglanguage and environment to interact with the Pivotal (Greenplum) Database as well as PivotalHD/HAWQ for Big Data analytics. It does so by providing an interface to the operations on ta-bles/views in the database. These operations are almost the same as those of data.frame. Thus theusers of R do not need to learn SQL when they operate on the objects in the database. The latestcode, along with a training video and a quick-start guide, are available at https://github.com/pivotalsoftware/PivotalR.
Details
Package: PivotalRType: PackageVersion: 0.1.18Date: 2016-09-15License: GPL (>= 2)Depends: methods, DBI, RPostgreSQL
This package enables R users to easily develop, refine and deploy R scripts that leverage the par-allelism and scalability of the database as well as in-database analytics libraries to operate on bigdata sets that would otherwise not fit in R memory - all this without having to learn SQL becausethe package provides an interface that they are familiar with.
The package also provides a wrapper for MADlib. MADlib is an open-source library for scalablein-database analytics. It provides data-parallel implementations of mathematical, statistical andmachine-learning algorithms for structured and unstructured data. The number of machine learningalgorithms that MADlib covers is quickly increasing.
As an R front-end to the PostgreSQL-like databases, this package minimizes the amount of datatransferred between the database and R. All the big data is stored in the database. The user enterstheir familiar R syntax, and the package translates it into SQL queries and sends the SQL query intodatabase for parallel execution. The computation result, which is small (if it is as big as the originaldata, what is the point of big data analytics?), is returned to R to the user.
On the other hand, this package also gives the usual SQL users the access of utilizing the powerful

PivotalR-package 5
analytics and graphics functionalities of R. Although the database itself has difficulty in plotting,the result can be analyzed and presented beautifully with R.
This current version of PivotalR provides the core R infrastructure and data frame functions as wellas over 50 analytical functions in R that leverage in- database execution. These include
* Data Connectivity - db.connect, db.disconnect, db.Rquery
* Data Exploration - db.data.frame, subsets
* R language features - dim, names, min, max, nrow, ncol, summary etc
* Reorganization Functions - merge, by (group-by), samples
* Transformations - as.factor, null replacement
* Algorithms - linear regression and logistic regression wrappers for MADlib
Note
This package is differernt from PL/R, which is another way of using R with PostgreSQL-likedatabases. PL/R enables the users to run R scripts from SQL. In the parallel Greenplum database,one can use PL/R to implement parallel algorithms.
However, PL/R still requires non-trivial knowledge of SQL to use it effectively. It is mostly limitedto explicitly parallel jobs. And for the end user, it is still a SQL interface.
This package does not require any knowledge of SQL, and it works for both explicitly and implicitlyparallel jobs by employing the open-source MADlib library. It is much more scalable. And for theend user, it is a pure R interface with the conventional R syntax.
Author(s)
Author: Predictive Analytics Team at Pivotal Inc. <[email protected]>, withcontributions from Data Scientist Team at Pivotal Inc.
Maintainer: Frank McQuillan, Pivotal Inc. <[email protected]>
References
[1] MADlib website, http://madlib.incubator.apache.org
[2] MADlib user docs, http://madlib.incubator.apache.org/docs/latest/
[3] MADlib Wiki page, https://cwiki.apache.org/confluence/display/MADLIB
[4] MADlib contribution guide, https://cwiki.apache.org/confluence/display/MADLIB/Contribution+Guidelines
[5] MADlib on GitHub, https://github.com/apache/incubator-madlib
See Also
madlib.lm Linear regression
madlib.glm Linear, logistic and multinomial logistic regressions
madlib.summary summary of a table in the database.

6 PivotalR-package
Examples
## Not run:## get the help for the packagehelp("PivotalR-package")
## get help for a functionhelp(madlib.lm)
## create multiple connections to different databasesdb.connect(port = 5433) # connection 1, use default values for the parametersdb.connect(dbname = "test", user = "qianh1", password = "", host ="remote.machine.com", madlib = "madlib07", port = 5432) # connection 2
db.list() # list the info for all the connections
## list all tables/views that has "ornst" in the namedb.objects("ornst")
## list all tables/viewsdb.objects(conn.id = 1)
## create a table and the R object pointing to the table## using the example data that comes with this packagedelete("abalone", conn.id = cid)x <- as.db.data.frame(abalone, "abalone")
## OR if the table already exists, you can create the wrapper directly## x <- db.data.frame("abalone")
dim(x) # dimension of the data table
names(x) # column names of the data table
madlib.summary(x) # look at a summary for each column
lk(x, 20) # look at a sample of the data
## look at a sample sorted by id columnlookat(sort(x, decreasing = FALSE, x$id), 20)
lookat(sort(x, FALSE, NULL), 20) # look at a sample ordered randomly
## linear regression Examples --------
## fit one different model to each group of data with the same sexfit1 <- madlib.lm(rings ~ . - id | sex, data = x)
fit1 # view the result
lookat(mean((x$rings - predict(fit1, x))^2)) # mean square error
## plot the predicted values v.s. the true values

PivotalR-package 7
ap <- x$rings # true valuesap$pred <- predict(fit1, x) # add a column which is the predicted values
## If the data set is very big, you do not want to load all the## data points into R and plot. We can just plot a random sample.random.sample <- lk(sort(ap, FALSE, "random"), 1000) # sort randomly
plot(random.sample) # plot a random sample
## fit a single model to all data treating sex as a categorical variable ---------y <- x # make a copy, y is now a db.data.frame objecty$sex <- as.factor(y$sex) # y becomes a db.Rquery object nowfit2 <- madlib.lm(rings ~ . - id, data = y)
fit2 # view the result
lookat(mean((y$rings - predict(fit2, y))^2)) # mean square error
## logistic regression Examples --------
## fit one different model to each group of data with the same sexfit3 <- madlib.glm(rings < 10 ~ . - id | sex, data = x, family = "binomial")
fit3 # view the result
## the percentage of correct predictionlookat(mean((x$rings < 10) == predict(fit3, x)))
## fit a single model to all data treating sex as a categorical variable ----------y <- x # make a copy, y is now a db.data.frame objecty$sex <- as.factor(y$sex) # y becomes a db.Rquery object nowfit4 <- madlib.glm(rings < 10 ~ . - id, data = y, family = "binomial")
fit4 # view the result
## the percentage of correct predictionlookat(mean((y$rings < 10) == predict(fit4, y)))
## Group by Examples --------
## mean value of each column except the "id" columnlk(by(x[,-1], x$sex, mean))
## standard deviation of each column except the "id" columnlookat(by(x[,-1], x$sex, sd))
## Merge Examples --------
## create two objects with different rows and columnskey(x) <- "id"y <- x[1:300, 1:6]z <- x[201:400, c(1,2,4,5)]
8 abalone
## get 100 rowsm <- merge(y, z, by = c("id", "sex"))
lookat(m, 20)
## operator Examples --------
y <- x$length + x$height + 2.3z <- x$length * x$height / 3
lk(y < z, 20)
## ------------------------------------------------------------------------## Deal with NULL values
delete("null_data")x <- as.db.data.frame(null.data, "null_data")
## OR if the table already exists, you can create the wrapper directly## x <- db.data.frame("null_data")
dim(x)
names(x)
## ERROR, because of NULL valuesfit <- madlib.lm(sf_mrtg_pct_assets ~ ., data = x)
## remove NULL valuesy <- x # make a copyfor (i in 1:10) y <- y[!is.na(y[i]),]
dim(y)
fit <- madlib.lm(sf_mrtg_pct_assets ~ ., data = y)
fit
## Or we can replace all NULL valuesx[is.na(x)] <- 45
## End(Not run)
abalone Abalone data set
Description
An example data.frame which is used by examples in this user manual

abalone 9
Usage
data(abalone)
Format
Given is the attribute name, attribute type, the measurement unit and a brief description. The numberof rings is the value to predict: either as a continuous value or as a classification problem.
Name / Data Type / Measurement Unit / Description
—————————–
Id / integer / – / index of each observation
Sex / nominal / – / M, F, and I (infant)
Length / continuous / mm / Longest shell measurement
Diameter / continuous / mm / perpendicular to length
Height / continuous / mm / with meat in shell
Whole weight / continuous / grams / whole abalone
Shucked weight / continuous / grams / weight of meat
Viscera weight / continuous / grams / gut weight (after bleeding)
Shell weight / continuous / grams / after being dried
Rings / integer / – / +1.5 gives the age in years
Details
Predicting the age of abalone from physical measurements. The age of abalone is determined bycutting the shell through the cone, staining it, and counting the number of rings through a micro-scope – a boring and time-consuming task. Other measurements, which are easier to obtain, areused to predict the age. Further information, such as weather patterns and location (hence foodavailability) may be required to solve the problem.
From the original data examples with missing values were removed (the majority having the pre-dicted value missing), and the ranges of the continuous values have been scaled for use with anANN (by dividing by 200).
Note
Lazy data loading is enabled in this package. So the user does not need to explicitly run data(abalone)to load the data. It will be loaded whenever it is used.
Source
[1] The original data is downloaded from http://archive.ics.uci.edu/ml/datasets/Abalone
[2] Warwick J Nash, Tracy L Sellers, Simon R Talbot, Andrew J Cawthorn and Wes B Ford (1994)"The Population Biology of Abalone (_Haliotis_ species) in Tasmania. I. Blacklip Abalone (H.rubra) from the North Coast and Islands of Bass Strait", Sea Fisheries Division, Technical ReportNo. 48 (ISSN 1034-3288)
10 Aggregate functions
Examples
## Not run:
## Assume that .port is port number and .dbname is the database namecid <- db.connect(port = .port, dbname = .dbname, verbose = FALSE)
## create a table from the example data.frame "abalone"## The user does not need to run data(abalone) to load the datadelete("abalone", conn.id = cid)x <- as.db.data.frame(abalone, "abalone", key = "id",
distributed.by = "id", conn.id = cid,verbose = FALSE)
## preview the actual datalk(x)
## preview the actual data ordered by idlk(sort(x, FALSE, x$id))
db.disconnect(cid, verbose = FALSE)
## End(Not run)
Aggregate functions Functions to perform a calculation on multiple values and return asingle value
Description
An aggregate function is a function where the values of multiple rows are grouped together as inputto calculate a single value of more significant meaning or measurement. The aggregate functionsincluded are mean, sum, count, max, min, standard deviation, and variance. Also included is afunction to compute the mean value of each column and a function to compute the sum of eachcolumn.
Usage
## S4 method for signature 'db.obj'mean(x, ...)
## S4 method for signature 'db.obj'sum(x, ..., na.rm = FALSE)
## S4 method for signature 'db.obj'count(x)

Aggregate functions 11
## S4 method for signature 'db.obj'max(x, ..., na.rm = FALSE)
## S4 method for signature 'db.obj'min(x, ..., na.rm = FALSE)
## S4 method for signature 'db.obj'sd(x)
## S4 method for signature 'db.obj'var(x)
## S4 method for signature 'db.obj'colMeans(x, na.rm = FALSE, dims = 1, ...)
## S4 method for signature 'db.obj'colSums(x, na.rm = FALSE, dims = 1, ...)
colAgg(x)
db.array(x, ...)
Arguments
x A db.obj object. The signature of the method.For db.array, x can also be a normal R object like double value.
... further arguments passed to or from other methods This is currently not imple-mented.
na.rm logical. Should missing values (including ’NaN’) be removed? This is currentlynot implemented.
dims integer: Which dimensions are regarded as ’rows’ or ’columns’ to sum over.This is currently not implemented and the default behavior is to sum over columns
Details
For aggregate functions: mean, sum, count, max, min, sd, and var, the signature x must be areference to a single column in a table.
For aggregate functions: colMeans, colSums, and colAgg the signature x can be a db.obj refer-encing to a single column or a single table, or can be a db.Rquery referencing to multiple columnsin a table.
Value
For mean, a db.Rquery which is a SQL query to extract the average of a column of a table. Actually,it can work on multiple columns, so it is the same as colMeans.
For sum, a db.Rquery which is a SQL query to extract the sum of a column of a table. Actually, itcan work on multiple columns, so it is the same as colSums.

12 Aggregate functions
For count, a db.Rquery which is a SQL query to extract the count of a column of a table.
For max, a db.Rquery which is a SQL query to extract the max of a column of a table.
For min, a db.Rquery which is a SQL query to extract the min of a column of a table.
For sd, a db.Rquery which is a SQL query to extract the standard deviation of a column of a table.
For var, a db.Rquery which is a SQL query to extract the variance of a column of a table.
For colMeans, a db.Rquery which is a SQL query to extract the mean of multiple columns of atable.
For colSums, a db.Rquery which is a SQL query to extract the sum of multiple columns of a table.
For colAgg, a db.Rquery which is a SQL query to retreive the column values as an array aggregate.
For db.array, a db.Rquery which is a SQL query which combine all columns into an array.
Author(s)
Author: Predictive Analytics Team at Pivotal Inc.
Maintainer: Frank McQuillan, <[email protected]>
See Also
by,db.obj-method is usually used together with aggregate functions.
Examples
## Not run:## get the help for a method## help("mean,db.obj-method")
## set up the database connection## Assume that .port is port number and .dbname is the database namecid <- db.connect(port = .port, dbname = .dbname, verbose = FALSE)
## ----------------------------------------------------------------------
## create a table from the example data.frame "abalone"delete("abalone", conn.id = cid)x <- as.db.data.frame(abalone, "abalone", conn.id = cid, verbose = FALSE)
## get the mean of a columnmean(x$diameter)
## get the sum of a columnsum(x$height)
## get the number of entries in a columncount(x$id)
AIC 13
## get the max value of a columnmax(x$diameter)
## get the min value of a columnmin(x$diameter)
## get the standard deviation of the values in columnsd(x$diameter)
## get the variance of the values in columnvar(x$diameter)
## get the mean of all columns in the tablecolMeans(x)
## get the sum of all columns in the tablecolSums(x)
## get the array aggregate of a specific column in the tablecolAgg(x$diameter)
## get the array aggregate of all columns in the tablecolAgg(x)
## put everything into an array plus a constant 1 as the first elementdb.array(1, x[,3:5], x[,6:7], x[,8:10])
## ----------------------------------------------------------------------
db.disconnect(cid, verbose = FALSE)
## End(Not run)
AIC AIC methods for Madlib regression objects
Description
Functions to extract the AIC and log-likelihood for regression models fit in Madlib.
Usage
## S3 method for class 'lm.madlib'extractAIC(fit, scale=0, k=2, ...)
## S3 method for class 'lm.madlib.grps'extractAIC(fit, scale=0, k=2, ...)
## S3 method for class 'lm.madlib'logLik(object, ...)
## S3 method for class 'lm.madlib.grps'logLik(object, ...)

14 AIC
## S3 method for class 'lm.madlib.grps'AIC(object, ..., k=2)
## S3 method for class 'logregr.madlib'extractAIC(fit, scale=0, k=2, ...)
## S3 method for class 'logregr.madlib.grps'extractAIC(fit, scale=0, k=2, ...)
## S3 method for class 'logregr.madlib'logLik(object, ...)
## S3 method for class 'logregr.madlib.grps'logLik(object, ...)
## S3 method for class 'logregr.madlib.grps'AIC(object, ..., k=2)
## S3 method for class 'glm.madlib'extractAIC(fit, scale=0, k=2, ...)
## S3 method for class 'glm.madlib.grps'extractAIC(fit, scale=0, k=2, ...)
## S3 method for class 'glm.madlib'logLik(object, ...)
## S3 method for class 'glm.madlib.grps'logLik(object, ...)
## S3 method for class 'glm.madlib.grps'AIC(object, ..., k=2)
Arguments
fit, object The regression model object, of class lm.madlib or logregr.madlib, fit usingmadlib.lm or madlib.glm respectively.
scale The scale parameter for the model. Currently unused.
k Numeric, specifying the equivalent degrees of freedom part in the AIC formula.
... Other arguments, not used.
Details
See the documentation for AIC and extractAIC.
Value
For ungrouped regressions, logLik returns an object of class logLik, and extractAIC returns alength-2 numeric vector giving the edf and AIC.

Arith-methods 15
For grouped regressions, logLik and extractAIC return a list giving the output of these methodsfor each of the component models. Similarly, AIC for a grouped regression returns a vector of theAICs for each of the component models.
Author(s)
Author: Hong Ooi, Pivotal Inc.
Maintainer: Frank McQuillan, Pivotal Inc. <[email protected]>
See Also
AIC, extractAIC, logLik.
Examples
## Not run:
## set up the database connection## Assume that .port is port number and .dbname is the database namecid <- db.connect(port = .port, dbname = .dbname, verbose = FALSE)
## create a tabledelete("abalone", conn.id = cid)x <- as.db.data.frame(abalone, "abalone", conn.id = cid, verbose = FALSE)
fit <- madlib.glm(rings < 10 ~ . - id | sex, data = x, family ="binomial")
AIC(fit)
AIC(fit[[1]])
db.disconnect(cid, verbose = FALSE)
## End(Not run)
Arith-methods Arithmetic Operators for db.obj objects
Description
These binary operators perform arithmetic on db.obj objects

16 Arith-methods
Usage
## S4 method for signature 'db.obj,db.obj'e1 + e2## S4 method for signature 'db.obj,db.obj'e1 - e2## S4 method for signature 'db.obj,ANY'e1 - e2## S4 method for signature 'db.obj,db.obj'e1 * e2## S4 method for signature 'db.obj,db.obj'e1 / e2## S4 method for signature 'db.obj,db.obj'e1 %% e2## S4 method for signature 'db.obj,db.obj'e1 %/% e2## S4 method for signature 'db.obj,db.obj'e1 ^ e2## S4 method for signature 'numeric,db.obj'e1 + e2## S4 method for signature 'character,db.obj'e1 + e2## S4 method for signature 'numeric,db.obj'e1 - e2## S4 method for signature 'character,db.obj'e1 - e2## S4 method for signature 'numeric,db.obj'e1 * e2## S4 method for signature 'numeric,db.obj'e1 / e2## S4 method for signature 'numeric,db.obj'e1 %% e2## S4 method for signature 'numeric,db.obj'e1 %/% e2## S4 method for signature 'numeric,db.obj'e1 ^ e2## S4 method for signature 'db.obj,numeric'e1 + e2## S4 method for signature 'db.obj,character'e1 + e2## S4 method for signature 'db.obj,numeric'e1 - e2## S4 method for signature 'db.obj,character'e1 - e2## S4 method for signature 'db.obj,numeric'e1 * e2## S4 method for signature 'db.obj,numeric'e1 / e2## S4 method for signature 'db.obj,numeric'

Arith-methods 17
e1 %% e2## S4 method for signature 'db.obj,numeric'e1 %/% e2## S4 method for signature 'db.obj,numeric'e1 ^ e2
Arguments
e1, e2 numeric or db.obj object.
Value
db.Rquery object, which contains the SQL query that computes the arithmetic operations.
Note
A meaningful expression is generated only when the .col.data_type is "numeric", otherwise a"NULL" value is generated.
"-" and "+" support computing the arithmetic computations between dates, timestamps, times etc.
Author(s)
Author: Predictive Analytics Team at Pivotal Inc.
Maintainer: Frank McQuillan, Pivotal Inc. <[email protected]>
See Also
db.Rquery contains a SQL query that does the operations.
Examples
## Not run:## get the help for a method## help("+,db.obj,db.obj-method")
## set up the database connection## Assume that .port is port number and .dbname is the database namecid <- db.connect(port = .port, dbname = .dbname, verbose = FALSE)
## ----------------------------------------------------------------------
## create a table from the example data.frame "abalone"delete("abalone", conn.id = cid)x <- as.db.data.frame(abalone, "abalone", conn.id = cid, verbose = FALSE)
x$rings <- (x$rings + 2.3) * 3 # change the values
x$area <- x$length * x$height # add a new column

18 array.len
lk(x$area, 10) # view the actual values computed in database
fit <- madlib.lm(rings ~ area, data = x)
## ----------------------------------------------------------------------
db.disconnect(cid, verbose = FALSE)
## End(Not run)
array.len Get the length of the array in an array column
Description
The column of a table in database can be an array. This function measures the length of the array.
Usage
array.len(x)
Arguments
x A db.obj object.
Value
An integer, which is the length of the array.
Author(s)
Author: Predictive Analytics Team at Pivotal Inc.
Maintainer: Frank McQuillan, Pivotal Inc. <[email protected]>
See Also
db.array combines columns of a table/view into an array.
as.list expands the db.obj columns into a list of separated db.Rquery objects.
cbind2 and cbind combine multiple db.obj objects into one db.obj object.
arraydb.to.arrayr 19
Examples
## Not run:
## set up the database connection## Assume that .port is port number and .dbname is the database namecid <- db.connect(port = .port, dbname = .dbname, verbose = FALSE)
delete("abalone", conn.id = cid)x <- as.db.data.frame(abalone, "abalone", conn.id = cid, verbose = FALSE)y <- db.array(x[-2]) # put columns into an arraynames(y) # "agg_opr"array.len(y$agg_opr) # 9
db.disconnect(cid, verbose = FALSE)
## End(Not run)
arraydb.to.arrayr Convert strings extracted from database into arrays
Description
An array object in database is converted to a string when passed into R, for example '\{1.2, 3.4, 5.7\}',and this function can convert the string to an array in R, for example c(1.2, 3.4, 5.7). This func-tion can also convert a vector of such strings into a two-dimensional array.
Usage
arraydb.to.arrayr(str, type = "double", ...)
Arguments
str A vector of strings, or a single string, that has multiple elements in it and deliitedby ",".
type The type of the return value of this function. Default is "double". It can be"character", "double", "logical", "integer", "numeric" etc. All typesother than "character", "logical" and "integer" will be treated as "numeric".
... Further arguments passed to or from other methods. Currently, no more param-eters can be passed and this is kept for backwards compatibility.
Details
When R reads in data from a table in the database, the result is a data.frame object. However, if theorginal data table has a column which is the array type, the array is automatically converted into astring and data.frame object has a corresponding column of strings, each of which starts with "\{"and ends with "\}", and all the original array elements are casted into strings delimited by ",".

20 arraydb.to.arrayr
For example, the array in database array['ab', 'c d', '"axx, t"'] becomes a string in R'{ab, c d, \"axx, t\"}'.
This function deals with such strings and turn them into faimiliar arrays that users can directly use.
Value
A two dimensional array, whose element’s type is decided by the function argument type.
Note
(1) The returned value is a two dimensional array, even if str is a single string.
(2) Although this function is for the strings extracted from database, it can actually deal with stringslike "a, b, c", which do not start or end with curly brackets.
Author(s)
Author: Predictive Analytics Team at Pivotal Inc.
Maintainer: Frank McQuillan, Pivotal Inc. <[email protected]>
See Also
lk or link{lookat} extracts the data of a table
Examples
## Not run:
## set up the database connection## Assume that .port is port number and .dbname is the database namecid <- db.connect(port = .port, dbname = .dbname, verbose = FALSE)
## Example 1 ----------
str <- '{1.2, 3.4, 5.6}'arraydb.to.arrayr(str, "double") # c(1.2, 3.4, 5.6)
str <- '{a, b, "c, d"}'arraydb.to.arrayr(str, "character") # c("a", "b", "\"c, d\"")
## Example 2 ----------
## table_in_database has a column of arraysx <- as.db.data.frame(abalone, conn.id = cid, verbose = FALSE)x$col.array <- db.array(x[,3:10])dat <- lk(x, nrows = 50, array = FALSE) # extract the actual dataarraydb.to.arrayr(dat$col.array, "double") # an array of 50 rows
## ----------------------------------------------------------------------db.disconnect(cid, verbose = FALSE)

as.db.data.frame 21
## End(Not run)
as.db.data.frame Convert other objects into a db.data.frame object
Description
Methods for function as.db.data.frame in package PivotalR. When x is a file name or data.frame,the method puts the data into a table in the database. When x is a db.Rquery object, it is convertedinto a table. When x is a db.data.frame object, a copy of the table/view that x points to is created.
Usage
## S4 method for signature 'character'as.db.data.frame(x, table.name = NULL,verbose = TRUE, conn.id = 1, add.row.names = FALSE, key = character(0),distributed.by = NULL, append = FALSE, is.temp = FALSE, ...)
## S4 method for signature 'data.frame'as.db.data.frame(x, table.name = NULL, verbose =TRUE, conn.id = 1, add.row.names = FALSE, key = character(0),distributed.by = NULL, append = FALSE, is.temp = FALSE, ...)
## S4 method for signature 'db.Rquery'as.db.data.frame(x, table.name = NULL, verbose =TRUE, is.view = FALSE, is.temp = FALSE, pivot = TRUE, distributed.by =NULL, nrow = NULL, field.types = NULL, na.as.level = FALSE,factor.full = rep(FALSE, length(names(x))))
## S4 method for signature 'db.data.frame'as.db.data.frame(x, table.name = NULL, verbose= TRUE, is.view = FALSE, is.temp = FALSE, distributed.by = NULL, nrow =NULL, field.types = NULL)
as.db.Rview(x)
Arguments
x The signature of this method.When it is of type character, it should be a file name.When it is of type data.frame, it is the data.frame that already exists in thecurrent R session.When it is of type db.Rquery, it represents a series of operations on a existingdb.data.frame object. See db.Rquery for more.For as.db.Rview, x must be a db.Rquery object.

22 as.db.data.frame
table.name A string, the name of the table to be created. The returned db.data.frameobject is pointing to this table. When table.name is NULL, a random name isused, which also avoids the name conflicts.
verbose A logical, default is TRUE, whether to print some prompt messages.
conn.id An integer, default is 1. The ID of the connection. See db.list for moreinformation.
add.row.names A logical, default is FALSE, whether to add a column named "row.names" isadded to the newly created table as the first column, which is just the row numberof the original data.frame or file.
key A string, default is character(0). The primary key column name. When it isnot character(0), a primary key is created for this column.
distributed.by A string, default is NULL. It is a column name or multiple column names sep-arated by comma. When creating tables in a Greenplum database [1], the usercan choose to specify whether he want to distributed the table onto multiplesegments according the values of some columns. When this parameter is NULL,the data is distributed randomly, and when this parameter is an empty stringcode"", Greenplum database automatically chooses a column and distribute thedata according to that column.
append A logical, default is FALSE. Whether to append the content of a file or data.frameto an existing table in the database.
nrow An integer, default is NULL. How many rows of data extracted from a db.Rqueryobject is used to create the new table. NULL means using all the rows.
is.temp A logical, default is FALSE, whether the created table/view should be a tempo-rary table/view.
... Extra parameters used to create the table inside the database. We support thefollowing parameters: header = FALSE, nrows = 50, sep = ",",eol = "\n", skip = 0.header is a logical indicating whether the first data line (but see skip) has aheader or not. If missing, it value is determined following read.table conven-tion, namely, it is set to TRUE if and only if the first row has one fewer field thatthe number of columns.nrowsWhen creating table from file or data.frame, the function will try to inferthe data type of each column using the first nrows rows of the data.sep specifies the field separator, and its default is ",".eol specifies the end-of-line delimiter, and its default is "\n".skip specifies number of lines to skip before reading the data, and it defaults to0.field.types A list of key=value pairs, where the value is a string of data type.Force the new table to use the data type for the column key.
is.view A logical, default is FALSE, whether to create a view instead of a table.
pivot A logical, default is TRUE, whether to create dummy columns for a column thathas been denoted as "factor". See as.factor for more details.
na.as.level A logical value, default is FALSE. Whether to treat NA value as a level in a cate-gorical variable or just ignore it.
as.db.data.frame 23
field.types A list of key=value pairs, where the value is a string of data type. Force thenew table to use the data type for the column key.
factor.full A vector of logical values with the length of the column number. All FALSE bydefault. When the function creates dummy variables for a factor (categorical)variable, whether to create n dummies or n-1 dummies, where n is the numberof levels of the factor. For some regression problem, we need to create dummyvariables for all the distinct values of the categorical variable.
Value
A db.data.frame object. It points to a table whose name is given by table.name in connectionconn.id.
Note
All the as.db.data.frame accept the option field.types.
Author(s)
Author: Predictive Analytics Team at Pivotal Inc.
Maintainer: Frank McQuillan, Pivotal Inc. <[email protected]>
References
[1] Greenplum database, http://www.greenplum.org
See Also
db.data.frame creates an object pointing to a table/view in the database.
lk looks at data from the table
db.Rquery this type of object represents operations on an existing db.data.frame object.
Examples
## Not run:## get the help for a method## help("as.db.data.frame")## help("as.db.data.frame,db.Rquery-method")
## set up the database connection## Assume that .port is port number and .dbname is the database namecid <- db.connect(port = .port, dbname = .dbname, verbose = FALSE)
## create a table from the example data.frame "abalone"x <- as.db.data.frame(abalone, conn.id = cid, verbose = FALSE)
## preview of a tablelk(x, nrows = 10) # extract 10 rows of data

24 as.environment
## do some operations and preview the resulty <- (x[,-2] + 1.2) * 2lk(y, 20, FALSE)
## table abalone has a column named "id"lk(sort(x, INDICES = x$id), 20) # the preview is ordered by "id" value
## create a copied table## x[,] converts x from db.data.frame object to db.Rquery objectz <- as.db.data.frame(x[,])
## Force the data type, use random table name
z1 <- as.db.data.frame(x$rings, field.types = list(rings="integer"))
db.disconnect(cid, verbose = FALSE)
## End(Not run)
as.environment Evaluate expressions within the context of a database table or view
Description
These functions allow a db.table or db.view object to be treated as an environment, in a manneranalogous to data frames.
Usage
## S3 method for class 'db.obj'as.environment(x, ...)
## S3 method for class 'db.obj'with(data, expr, ...)
Arguments
x, data A db.obj object to treat as an environment.
expr For with, an R expression to evaluate in the context of a database table or view.
... Other arguments; unused.
Value
For as.environment, the created environment. Note that no data is transferred to the client; allobjects in the environment are queries pointing back to the host.
For with, a db.Rquery stored query object representing the expression. Use lk, lookat or as.data.frameto execute the query on the host and retrieve its contents.

as.factor-methods 25
Author(s)
Author: Hong Ooi, Pivotal Inc. <[email protected]>
Maintainer: Frank McQuillan, Pivotal Inc. <[email protected]>
See Also
as.environment
as.factor-methods Convert one column of a db.obj object into a categorical variable
Description
Convert one column of a db.obj object into a categorical variable. When madlib.lm or madlib.glmare applied onto a db.obj with categorical columns, dummy columns will be created and fitted. Thereference level for regressions can be selected using relevel.
Usage
## S4 method for signature 'db.obj'as.factor(x)
## S4 method for signature 'db.obj'relevel(x, ref, ...)
Arguments
x A db.obj object. It must have only one column.
ref A single value, which is the reference level that is used in the regressions.
... Other arguments passed into the result. Not implemented yet.
Value
A db.Rquery object. It has only one column which is categorical. By default, a reference level isautomatically selected in regressions, which is usually the minimum of all levels, but one can easilychange the reference level using relevel.
Author(s)
Author: Predictive Analytics Team at Pivotal Inc.
Maintainer: Frank McQuillan, Pivotal Inc. <[email protected]>
See Also
madlib.lm and madlib.glm can fit categorical variables
When as.db.data.frame creates a table/view, it can create dummy variables for a categoricalvariable.

26 by
Examples
## Not run:## get help for a method## help("as.factor,db.obj-method")
## set up the database connection## Assume that .port is port number and .dbname is the database namecid <- db.connect(port = .port, dbname = .dbname, verbose = FALSE)
## create a temporary table from the example data.frame "abalone"x <- as.db.data.frame(abalone, conn.id = cid, verbose = FALSE)
## set sex to be a categorical variablex$sex <- as.factor(x$sex)
fit1 <- madlib.lm(rings ~ . - id, data = x) # linear regression
fit2 <- madlib.glm(rings < 10 ~ . - id, data = x, family = "binomial") # logistic regression
## another temporary tablez <- as.db.data.frame(abalone, conn.id = cid, verbose = FALSE)
## specify factor during fittingfit3 <- madlib.lm(rings ~ as.factor(sex) + length + diameter, data = z)
## as.factor is automatically used onto text column## so as.factor is not necessaryfit4 <- madlib.glm(rings < 10 ~ sex + length + diameter, data= z, family = "binomial")
## using relevel to change the reference levelx$sex <- relevel(x$sex, ref = "M")madlib.lm(rings ~ . - id, data = x) # use "M" as the reference level
db.disconnect(cid, verbose = FALSE)
## End(Not run)
by Apply a Function to a db.data.frame Split by column(s)
Description
by is equivalent to "group by" in SQL language. It groups the data according the value(s) of one ormultiple columns, and then apply an aggregate function onto each group of the data.

by 27
Usage
## S4 method for signature 'db.obj'by(data, INDICES, FUN, ..., simplify = TRUE)
Arguments
data A db.obj object. It represents a table/view in the database if it is an db.data.frameobject, or a series of operations applied on an existing db.data.frame object ifit is a db.Rquery object.
INDICES A list of db.Rquery objects. Each of the list element selects one or multiplecolumns of data. When the value is NULL, no grouping of data is done, and theaggregate function FUN will be applied onto all the data.
FUN A function, which will be applied onto each group of the data. The result of FUNcan be of db.obj type or any other data types that R supports.
... Extra arguments passed to FUN, currently not implemented.
simplify Not implemented yet.
Value
The type of the returned value depends on the return type of FUN.
If the return type of FUN is a db.obj object, then this function returns a db.Rquery object, which isactually the SQL query that does the "GROUP BY". It computes the group-by values. The resultcan be viewed using lk or lookat.
If the return type of FUN is not a db.obj object, then this function returns a list, which contains anumber of sub-lists. Each sub-list contains two items: (1) index, an array of strings, a set of distinctvalues of the INDICES converted to string; and (2) result, the result produced by FUN applying ontothe group of data that has the set of distinct values. The total number of sub-lists is equal to the totalnumber of groups of data partitioned by INDICES.
Author(s)
Author: Predictive Analytics Team at Pivotal Inc.
Maintainer: Frank McQuillan, Pivotal Inc. <[email protected]>
See Also
Aggregate functions lists all the supported aggregate functions.
lk or lookat can display the actual result of this function.
Examples
## Not run:## help("by,db.obj-method") # display this doc
## set up the database connection## Assume that .port is port number and .dbname is the database name

28 cbind2-methods
cid <- db.connect(port = .port, dbname = .dbname, verbose = FALSE)
## create a table from the example data.frame "abalone"x <- as.db.data.frame(abalone, conn.id = cid, verbose = FALSE)
## mean values for each columnlk(by(x, x$sex, mean))
## No need to compute the mean of id and sexlk(by(x[,-c(1,2)], x$sex, mean))lk(by(x[,-c(1,2)], x[,2], mean)) # the samelk(by(x[,-c(1,2)], x[,"sex"], mean)) # the same
## The return type of FUN is not db.objdat <- x
## Fit linear model to each group of databy(dat, dat$sex, function(x) madlib.lm(rings ~ . - id - sex, data = x))
db.disconnect(cid, verbose = FALSE)
## End(Not run)
cbind2-methods Combine two db.obj Objects by Columns
Description
cbind2 or cbind combine two or multiple db.obj objects to form a new db.obj. And as.listdoes the opposite and expand a db.obj object into a list of db.obj objects with each one of themrepresenting one column of the original db.obj object. as.list is usually used together withReduce and Map.
Usage
## S4 method for signature 'db.obj,db.obj'cbind2(x, y)
## S4 method for signature 'db.obj'as.list(x, array = FALSE, ...)
Arguments
x, y The signature of the method. Both arguments are db.obj objects.
array logical, default is FALSE. When it is TRUE, the array columns are also expandedand all the elements are put into the resulting list. Otherwise, an array columnis treated as a single item in the result.
... In cbind they can be anything that can form new columns together with x. Inas.list, it is not implemented yet.

cbind2-methods 29
Value
cbind2 or cbind: A db.Rquery object, which contains all columns of x and y.
as.list: A list of db.Rquery objects, which are the columns of x
Author(s)
Author: Predictive Analytics Team at Pivotal Inc.
Maintainer: Frank McQuillan, Pivotal Inc. <[email protected]>
See Also
db.array combines columns of a table/view into an array.
array.len measures the length of the array in an array column.
Examples
## Not run:
## set up the database connection## Assume that .port is port number and .dbname is the database namecid <- db.connect(port = .port, dbname = .dbname, verbose = FALSE)
## create a table from the example data.frame "abalone"delete('abalone', conn.id = cid)x <- as.db.data.frame(abalone, 'abalone', conn.id = cid, verbose = FALSE)
fit <- madlib.lm(rings ~ . - id - sex, data = x)
## create a db.Rquery object that has two columnsz <- cbind(x$rings, predict(fit, x))
## plot prediction v.s. real valueplot(lookat(z, 100))
## expand the db.objunlist(Map(function(x)
if (col.types(x) == "text")paste(lk(unique(x)), collapse="-", sep="")
elselk(mean(x))),
as.list(x))
## sum of all columns (excluding the 2nd column)Reduce(function(left, right) left + right, as.list(x[-2]))
db.disconnect(cid, verbose = FALSE)
## End(Not run)

30 clean.madlib.temp
clean.madlib.temp Delete all the result tables created during calculations of MADlib
Description
Some MADlib wrapper functions create result tables that cannot be dropped in the background,because other functions need to use these tables. For example, madlib.arima creates 3 resulttables, which are needed by predict.arima.css.madlib. One can manually delete these 3 tableswhen they are not useful anymore using delete,arima.css.madlib-method. One can also chooseto all such tables created by many such functions together using this function.
Usage
clean.madlib.temp(conn.id = 1)
Arguments
conn.id An integer, the connection ID of the database. See db.connect for more details.
Details
All such result tables created by MADlib wrapper functions start with "__madlib_temp_" followedby three random integers. This function deletes all such tables.
Author(s)
Author: Predictive Analytics Team at Pivotal Inc.
Maintainer: Frank McQuillan, Pivotal Inc. <[email protected]>
See Also
madlib.arima creates three tables with names starting with "__madlib_temp_" when it fits ARIMAmodel to time series
delete,arima.css.madlib-method deletes the result of madlib.arima together with the model,residual and statistics tables.
Examples
## Not run:
## set up the database connection## Assume that .port is port number and .dbname is the database namecid <- db.connect(port = .port, dbname = .dbname, verbose = FALSE)
## use double values as the time stamp## Any values that can be ordered will workexample_time_series <- data.frame(

coef 31
id = seq(0,1000,length.out=length(ts)),val = arima.sim(list(order=c(2,0,1),ar=c(0.7, -0.3), ma=0.2), n=1000000) + 3.2)
x <- as.db.data.frame(example_time_series, field.types =list(id="double precision", val = "double precision"),conn.id = cid, verbose = FALSE)
dim(x)
names(x)
## use formulas <- madlib.arima(val ~ id, x, order = c(2,0,1))
s
## delete all result tablesclean.madlib.temp(conn.id = 1)
## s still exists but the 3 tables (model, residuals, etc.) are deleteds
db.disconnect(cid, verbose = FALSE)
## End(Not run)
coef Extract model coefficients for Madlib regression objects
Description
Functions to extract the coefficients for regression models fit in Madlib.
Usage
## S3 method for class 'lm.madlib'coef(object, ...)
## S3 method for class 'lm.madlib.grps'coef(object, ...)
## S3 method for class 'logregr.madlib'coef(object, ...)
## S3 method for class 'logregr.madlib.grps'coef(object, ...)
Arguments
object The regression model object, fit using madlib.lm or madlib.glm.
... Other arguments, not used.

32 Compare-methods
Details
Extract the fitted coefficients for a linear or logistic regression model, or a grouped list of suchmodels.
Value
For ungrouped regressions, a named numeric vector giving the fitted coefficients.
For grouped regressions, a list giving the coefficients for each of the component models.
Author(s)
Author: Hong Ooi, Pivotal Inc. <[email protected]>
Maintainer: Frank McQuillan, Pivotal Inc. <[email protected]>
See Also
coef.
Examples
## Not run:
## set up the database connection## Assume that .port is port number and .dbname is the database namecid <- db.connect(port = .port, dbname = .dbname, verbose = FALSE)
## create a tabledelete("abalone", conn.id = cid)x <- as.db.data.frame(abalone, "abalone", conn.id = cid, verbose = FALSE)
fit <- madlib.glm(rings < 10 ~ . - id | sex, data = x, family ="binomial")
coef(fit)
coef(fit[[1]])
db.disconnect(cid, verbose = FALSE)
## End(Not run)
Compare-methods Comparison Operators for db.obj objects
Description
These binary operators perform comparison on db.obj objects

Compare-methods 33
Usage
## S4 method for signature 'db.obj,db.obj'e1 > e2## S4 method for signature 'db.obj,db.obj'e1 < e2## S4 method for signature 'db.obj,db.obj'e1 >= e2## S4 method for signature 'db.obj,db.obj'e1 <= e2## S4 method for signature 'db.obj,db.obj'e1 == e2## S4 method for signature 'db.obj,db.obj'e1 != e2## S4 method for signature 'character,db.obj'e1 > e2## S4 method for signature 'character,db.obj'e1 < e2## S4 method for signature 'character,db.obj'e1 >= e2## S4 method for signature 'character,db.obj'e1 <= e2## S4 method for signature 'character,db.obj'e1 == e2## S4 method for signature 'character,db.obj'e1 != e2## S4 method for signature 'db.obj,character'e1 > e2## S4 method for signature 'db.obj,character'e1 < e2## S4 method for signature 'db.obj,character'e1 >= e2## S4 method for signature 'db.obj,character'e1 <= e2## S4 method for signature 'db.obj,character'e1 == e2## S4 method for signature 'db.obj,character'e1 != e2## S4 method for signature 'numeric,db.obj'e1 > e2## S4 method for signature 'numeric,db.obj'e1 < e2## S4 method for signature 'numeric,db.obj'e1 >= e2## S4 method for signature 'numeric,db.obj'e1 <= e2## S4 method for signature 'numeric,db.obj'e1 == e2## S4 method for signature 'numeric,db.obj'

34 Compare-methods
e1 != e2## S4 method for signature 'db.obj,numeric'e1 > e2## S4 method for signature 'db.obj,numeric'e1 < e2## S4 method for signature 'db.obj,numeric'e1 >= e2## S4 method for signature 'db.obj,numeric'e1 <= e2## S4 method for signature 'db.obj,numeric'e1 == e2## S4 method for signature 'db.obj,numeric'e1 != e2## S4 method for signature 'db.obj,logical'e1 == e2## S4 method for signature 'logical,db.obj'e1 == e2## S4 method for signature 'db.obj,logical'e1 != e2## S4 method for signature 'logical,db.obj'e1 != e2## S4 method for signature 'character,db.obj'grepl(pattern, x, ignore.case = FALSE, perl = FALSE, fixed = FALSE, useBytes = FALSE)
Arguments
e1, e2 numeric, character or db.obj object.
pattern character string containing a regular expression (or character string for ’fixed =TRUE’) to be matched in the given character vector.
x A db.obj object.
ignore.case if ’FALSE’, the pattern matching is _case sensitive_ and if ’TRUE’, case isignored during matching.
perl logical. Should perl-compatible regexps be used? Not implemented yet.
fixed logical. If ’TRUE’, ’pattern’ is a string to be matched as is. Overrides all con-flicting arguments.
useBytes logical. Not implemented yet.
Value
db.Rquery object, which contains the SQL query that computes the comparison operations.
Note
A meaningful expression is generated only when the .col.data_type is "character" or "numeric",otherwise a "NULL" value is generated.

conn.eql 35
Author(s)
Author: Predictive Analytics Team at Pivotal Inc.
Maintainer: Frank McQuillan, Pivotal Inc. <[email protected]>
See Also
db.Rquery contains a SQL query that does the operations.
Examples
## Not run:## get the help for a method## help(">,db.obj,db.obj-method")
## set up the database connection## Assume that .port is port number and .dbname is the database namecid <- db.connect(port = .port, dbname = .dbname, verbose = FALSE)
## create a table from the example data.frame "abalone"delete("abalone", conn.id = cid)x <- as.db.data.frame(abalone, "abalone", conn.id = cid, verbose = FALSE)
lk(x[x$length > 10,])
db.disconnect(cid, verbose = FALSE)
## End(Not run)
conn.eql Check whether two connections are the same
Description
Two connections are regarded as equal if and only if they have the same database name, host,DBMS, and port number.
Usage
conn.eql(conn.id1, conn.id2)
Arguments
conn.id1 An integer, a connection ID number.
conn.id2 An integer, another connection ID number.

36 conn.id
Value
A logical. TRUE if and only if the two connections have the same database name, host, DBMS, andport number.
Author(s)
Author: Predictive Analytics Team at Pivotal Inc.
Maintainer: Frank McQuillan, Pivotal Inc. <[email protected]>
See Also
connection info has all functions that can extract information about the database connection.
db.connect creates connections to the databases.
db.disconnect disconnects an existing connection.
db.list lists all the current connections with their information.
Examples
## Not run:
## set up the database connection## Assume that .port is port number and .dbname is the database namecid1 <- db.connect(port = .port, dbname = .dbname, verbose = FALSE)cid2 <- db.connect(port = .port, dbname = .dbname, verbose = FALSE)
db.list() # list the above two connections
conn.eql(cid1, cid2) # returns TRUE
db.disconnect(cid1, verbose = FALSE)db.disconnect(cid2, verbose = FALSE)
## End(Not run)
conn.id Find out the connection ID of a db.obj object
Description
Each db.obj object contains the ID of the connection that its data resides on. This function returnsthe connection ID number. The user can also change the connection ID that a db.obj is associatedwith.
Usage
conn.id(x)conn.id(x) <- value

conn.id 37
Arguments
x A db.obj object.
value An integer, the connection ID number. The user is allowed to change the con-nection ID that is associated with x.
Value
An integer, the connection ID associated with x
Author(s)
Author: Predictive Analytics Team at Pivotal Inc.
Maintainer: Frank McQuillan, Pivotal Inc. <[email protected]>
See Also
db.connect creates connections to the databases.
db.disconnect disconnects an existing connection.
db.list lists all the current connections with their information.
connection info has all functions that can extract information about the database connection.
conn.eql tests whether two connections are actually the same one.
Examples
## Not run:
## set up the database connection## Assume that .port is port number and .dbname is the database namecid1 <- db.connect(port = .port, dbname = .dbname, verbose = FALSE)cid2 <- db.connect(port = .port, dbname = .dbname, verbose = FALSE)
db.list() # list the two connections
conn.eql(cid1, cid2) # returns TRUE
## use the example data to create a table in connection 1delete("abalone", conn.id = cid2)x <- as.db.data.frame(abalone, "abalone", conn.id = cid1, verbose = FALSE)
db.disconnect(cid1) # disconnect connection 1
## lookat(x) # gives an error since connection 1 is disconnected
conn.id(x) <- cid2 # 1 and 2 are the same
lk(x) # gives what you want
db.disconnect(cid2, verbose = FALSE)

38 content
## End(Not run)
content Print the content of a db.obj object
Description
A db.data.frame object’s content is the table/view name that it points to. A db.Rquery object’scontent is the SQL query that represents the operations applied on an existing db.data.frame. Thisfunction is mainly for debugging. Normal user who is not familiar with SQL does not need to useit.
Usage
content(x)
Arguments
x A db.obj object, whose content will be returned.
Value
A string, the content of db.obj object x. A db.data.frame object’s content is the table/view namethat it points to. A db.Rquery object’s content is the SQL query that represents the operationsapplied on an existing db.data.frame.
Author(s)
Author: Predictive Analytics Team at Pivotal Inc.
Maintainer: Frank McQuillan, Pivotal Inc. <[email protected]>
See Also
db.obj, db.data.frame, db.table, db.view, db.Rquery explain the definitions of the class hier-archy of this package.
Examples
## Not run:
## set up the database connection## Assume that .port is port number and .dbname is the database namecid <- db.connect(port = .port, dbname = .dbname, verbose = FALSE)
delete("abalone", conn.id = cid)y <- as.db.data.frame(abalone, "abalone", conn.id = cid) # create a tablex <- db.data.frame("abalone", conn.id = cid, key = "id")

crossprod 39
## actually, x and y are pointing the same tableeql(x, y) # returns TRUE
content(x)content(x$id)content(x$id < 10)content(x[,1:5])content(x == y) # this is different from eql(x, y)content(sort(x, INDICES = x$id))content(x[x$id<10,])content(x[1:10,])content(colSums(x))content(by(x, NULL, sum))content(by(x, x$sex, sum))
db.disconnect(cid, verbose = FALSE)
## End(Not run)
crossprod Compute the matrix product of X^T and Y.
Description
The function computes the cross product of two matrices. The matrix is stored in the table either asmultiple columns of data or a column of arrays.
Usage
## S4 method for signature 'db.obj,ANY'crossprod(x, y = x)
Arguments
x A db.obj object. It either has multiple columns or a column of arrays, and thusforms a matrix.
y A db.obj object, default is the same as x. This represents the second matrix inthe cross product.
Value
db.Rcrossprod object, which is subclass of db.Rquery. It is actually a vectorized version of theresulting product matrix represented in an array. If you want to take a look at the actual valuesinside this matrix, lk or lookat can be used to extract the correct matrix format as long as thematrix can be loaded into the memory. Usually the resulting product matrix is not too large becausethe number n of columns is usually not too large and the dimension of the resulting matrix is n x n.

40 crossprod
Author(s)
Author: Predictive Analytics Team at Pivotal Inc.
Maintainer: Frank McQuillan, Pivotal Inc. <[email protected]>
See Also
db.array forms an array using columns
Examples
## Not run:## get the help for a method## help("crossprod,db.obj-method")
## set up the database connection## Assume that .port is port number and .dbname is the database namecid <- db.connect(port = .port, dbname = .dbname, verbose = FALSE)
## create a table from the example data.frame "abalone"delete("abalone", conn.id = cid)x <- as.db.data.frame(abalone, "abalone", conn.id = cid, verbose = FALSE)
lookat(crossprod(x[,-c(1,2)]))
x$arr <- db.array(1, x$length, x$diameter)
lookat(crossprod(x$arr))
## -----------------------------------------------------
## Create a function that does Principal Component Analysis in parallel.## As long as the number of features of the data table is fewer than## ~ 5000, the matrix t(x)## the eigenvalues and eigenvectors. However, the step t(x)## be done in-database in parallel, because x can be very big.pca <- function (x, center = TRUE, scale = FALSE){
y <- scale(x, center = center, scale = scale) # centering and scalingz <- as.db.data.frame(y, verbose = FALSE) # create an intermediate table to save computationm <- lookat(crossprod(z)) # one scan of the table to compute Z^T * Zd <- delete(z) # delete the intermediate tableres <- eigen(m) # only this computation is in Rn <- attr(y, "row.number") # save the computation to count rows
## return the resultlist(val = sqrt(res$values/(n-1)), # eigenvalues
vec = res$vectors, # columns of this matrix are eigenvectorscenter = attr(y, "scaled:center"),scale = attr(y, "scaled:scale"))
}

db.connect 41
## create a data table with a random namedat <- db.data.frame("abalone", conn.id = cid, verbose = FALSE)
## exclude id and sex columnsp <- pca(dat[,-c(1,2)])
p$val # eigenvalues
db.disconnect(cid, verbose = FALSE)
## End(Not run)
db.connect Create a connection to a database
Description
Create a connection to a PostgreSQL or Greenplum (Pivotal) database. One can create multipleconnections to multiple databases. The connections are indexed by an integer starting from 1.
Usage
db.connect(host = "localhost", user = Sys.getenv("USER"), dbname = user,password = "", port = 5432, madlib = "madlib", conn.pkg = "RPostgreSQL",default.schemas = NULL, verbose = TRUE, quick = FALSE)
Arguments
host A string, default is "localhost". The name or IP of the host where the databaseis located.
user A string, default is the user’s username. The username used to connect to thedatabase.
dbname A string, default is the same as the username. The name of the database that youwant to connect to.
password A string, default is "". The password string used to connect to the database.
port An integer, default is 5432. The port number used to connect to the database.
madlib A string, default is "madlib". The name of the schema where MADlib is in-stalled.
conn.pkg A string, default is "RPostgreSQL". The name of the R package used to connectto the database. Currently, only RPostgreSQL is supported, but the support forother packages such as RODBC can be easily added.
default.schemas
A string, default is NULL. The search path or default schemas of the database thatyou want to use. The string must be a set of schema names separated by commas.One can also use db.default.schemas or db.search.path to display or set thesearch path in the database.

42 db.connect
verbose A logival value, default is TRUE, whether to print some information while con-necting to the database.
quick A logical value, default is FALSE. Whether to skip some of the argument checksto speed up the creation of the connection. Useful when using this functioninside a function, where you have already validate all the arguments. It is notrecommended to set this value to TRUE when you are using this function directly.
Value
An integer, the ID number for the newly created connection.
Note
Right only MADlib 0.6 or later is supported. If you have an older version of MADlib, you will notbe able to use all the functions whose names start with "madlib.". However you can still use all theother functions.
Also, right now only PostgreSQL and Greenplum databases are supported.
Author(s)
Author: Predictive Analytics Team at Pivotal Inc.
Maintainer: Frank McQuillan, Pivotal Inc. <[email protected]>
See Also
db.disconnect disconnects a connection.
db.list lists all active connections.
connection info the functions that extract information about the connection.
conn.eql tests whether two connections are the same.
db.search.path and db.default.schemas displays or sets the search path (i.e. default schemas)in the connected database.
Examples
## Not run:## connect to a database
## set up the database connection## Assume that .port is port number and .dbname is the database namecid <- db.connect(port = .port, dbname = .dbname, verbose = FALSE)
db.disconnect(cid, verbose = FALSE)
## End(Not run)

db.data.frame 43
db.data.frame Create a db.data.frame object pointing to a table/view in thedatabase
Description
This function creates an object of db.data.frame, which points to an existing table/view in thedatabase. The operations that can be applied onto this class of objects are very similar to thoseof data.frame. No real data is loaded into R. The data transfered between the database and R isminimized, which is necessary when we deal with large data sets.
Usage
db.data.frame(x, conn.id = 1, key = character(0), verbose = TRUE,is.temp = FALSE)
Arguments
x A string. It is the name of an existing table/view in the database.
conn.id An integer, default is 1. The ID number of the database connection where thetable resides.
key A string, default is character(0). The name of the primary key column. Aprimary key is a column in a table which must contain a unique value which canbe used to identify each and every row of a table uniquely.
verbose A logical, default is TRUE. Whether to print a short message when the object inthe database is created.
is.temp A logical, default is FALSE. Whether the existing table/view in the database istemporary.
Value
A db.data.frame object. More precisely, a db.table object if it points to an existing table in thedatabase, and a db.view object if it points to an existing view in the database.
Author(s)
Author: Predictive Analytics Team at Pivotal Inc.
Maintainer: Frank McQuillan, Pivotal Inc. <[email protected]>
See Also
db.objects lists all tables and views in a database together with their schema.
db.existsObject tests whether a table/view exists in the database.
as.db.data.frame creates a db.data.frame from a data.frame, a data file or a db.Rquery.

44 db.data.frame-class
Examples
## Not run:
## set up the database connection## Assume that .port is port number and .dbname is the database namecid <- db.connect(port = .port, dbname = .dbname)
## create a table using as.db.data.framedelete("abalone", conn.id = cid)x <- as.db.data.frame(abalone, "abalone", conn.id = cid)
## create an object pointing to the tabley <- db.data.frame("abalone", conn.id = cid)
## x and y point to the same tableeql(x, y) # returns TRUE
## create an object pointing to a table in a schemadb.q("create schema myschema", conn.id = cid)z <- as.db.data.frame(abalone, "myschema.abalone", conn.id = cid)db.q("drop schema myschema cascade", conn.id = cid)
db.disconnect(cid, verbose = FALSE)
## End(Not run)
db.data.frame-class Class "db.data.frame"
Description
An object of this class points to a real table/view in the database. No data is transfered into R. Onlya minimal amount of information is kept in the object.
Objects from the Class
Objects can be created by calls of db.data.frame or as.db.data.frame.
The object represents a real table/view in the database. Usually it is NOT recommended to directlymanipulate the internal slots of these objects.
Slots
.name: Object of class "character". It is the table name if this db.data.frame was created usingjust a table name. It can also be a two-element array if this db.data.frame was created. Thisslot is obsolete.
.content: Object of class "character". The table name. The function content can get thisvalue.

db.data.frame-class 45
.conn.id: Object of class "numeric", an integer. The ID number of the database connectionwhere the table resides. The functions conn.id and conn.id<- can get and set this value.
.col.name: Object of class "character". The 1D array of column names of the table/view thatthis db.data.frame points to. The S4 method names,db.obj-methodgets this value.
.col.data_type: Object of class "character". The 1D array of column data types of the ta-ble/view that this db.data.frame points to. This is not supposed to be used by the normaluser.
.col.udt_name: Object of class "character". The 1D array of column udt names of the ta-ble/view that this db.data.frame points to. This is not to used by normal users.
.table.type: Object of class "character". The information about the type of tha table/view thatthis db.data.frame points to, for example, "BASE TABLE", "VIEW" or "LOCAL TEMPO-RARY".
.is.factor: Object of class "logical". An array of logical values which indicate whether eachcolumn of the table/view is a factor. This is not to be used by the normal users.
.factor.suffix: Object of class "character". An array of strings for every column. Whencreating dummy columns for a factor column, we add a random string in the names of thedummy columns to avoid naming conflicts. So a factor column’s .factor.suffix is a randomstring, otherwise it is just an empty string. This is not to be used by the normal users. It isused only the MADlib wrapper functions that support categorical variables.
.factor.ref: The value of the factor reference level for the regressions. If it is NA, then theregressions automatically select a reference level.
.appear.name: Object of class "character". This is also related the factor columns. print.lm.madliband print.logregr.madlib use this value for printing the names of the dummy columns.This is not to be used by the normal users.
.dummy: Object of class "character". An array of strings, The dummy column names which areused only for factor support.
.dummy.expr: Object of class "character". The SQL expressions used to create dummy columnnames which are used only for factor support.
.dist.by: A string, the distribution policy when using Greenplum database or HAWQ. It can becharacter(0), which means the data table is distributed randomly. Or it can be a string ofcolumn names separated by comma, which are the columns that are used in the "distributedby" when the table was created.
Extends
Class db.obj, directly.
Methods
Aggregate functions, by,db.obj-method, dim,db.table-method, dim,db.view-method, dim,db.Rquery-method,names,db.obj-method, conn.id, conn.id<-, eql, key, key<-, merge,db.obj,db.obj-method,print,db.data.frame-method, show,db.data.frame-method, sort,db.obj-method, subset,db.obj-method,Arith methods, Compare methods, Logical methods, Extraction methods, Replacement methods,madlib.lm, madlib.glm, madlib.summary

46 db.disconnect
Author(s)
Author: Predictive Analytics Team at Pivotal Inc.
Maintainer: Frank McQuillan, Pivotal Inc. <[email protected]>
See Also
db.data.frame creates a db.data.frame object.
as.db.data.frame converts db.Rquery object, data.frame, or a data file into a db.data.frameobject and at the same time creates a new table in the database.
db.obj is the superclass.
db.table and db.view are the sub-classes.
db.Rquery is another sub-class of db.obj.
lk or lookat display a part of the table
Examples
## Not run:showClass("db.data.frame")
## set up the database connection## Assume that .port is port number and .dbname is the database namecid <- db.connect(port = .port, dbname = .dbname, verbose = FALSE)
delete("abalone", conn.id = cid)as.db.data.frame(abalone, "abalone", conn.id = cid, verbose = FALSE)x <- db.data.frame("abalone", conn.id = cid, verbose = FALSE) # x points to table "abalone"
lk(x)
db.disconnect(cid, verbose = FALSE)
## End(Not run)
db.disconnect Disconnect a connection to a database
Description
Although all the database connections will be automatically closed when this package is unloaded,one can choose to disconnect a database connection himself.
Usage
db.disconnect(conn.id = 1, verbose = TRUE, force = FALSE)

db.disconnect 47
Arguments
conn.id An integer, the ID of the connection that you want to disconnect.
verbose A logical, default is TRUE. Whether to print a message during disconnection.
force A logical, default is FALSE. Whether to remove the connection forcefully. Thisis useful when you lose the connection and cannot disconnect the connectionnormally.
Value
A logical, TRUE if the connection is successfully disconnected.
Author(s)
Author: Predictive Analytics Team at Pivotal Inc.
Maintainer: Frank McQuillan, Pivotal Inc. <[email protected]>
See Also
db.connect creates the database connection.
db.list lists all active connections.
connection info the functions that extract information about the connection.
conn.eql tests whether two connections are the same.
Examples
## Not run:
## set up the database connection## Assume that .port is port number and .dbname is the database namecid <- db.connect(port = .port, dbname = .dbname, verbose = FALSE)
db.list()
## disconnect the connectiondb.disconnect(cid, verbose = FALSE)
db.list()
## End(Not run)

48 db.existsObject
db.existsObject Test whether an object exists in the database
Description
Test whether a table or view exists in the database
Usage
db.existsObject(name, conn.id = 1, is.temp = FALSE)
Arguments
name A string, the name of table or view
conn.id An integer, default is 1. The ID of the database connection.
is.temp A logical, default is FALSE. Whether this table/view is a temporary object.
Value
This function returns different types of results depending the input.
If name has the format of myschema.mytable, the return value is a logical. It is TRUE if thetable/view exists in the database.
If name has the format of mytable and is.temp = FALSE, the return value is also a logical,which is TRUE if the table/view exists in the database.
If name has the format of mytable and is.temp = TRUE, the return value is a list. The listhas two elements. The first is a logical, which is TRUE if the table/view exists in the database.The second is a character array with 2 elements, whose first is the temporary schema name and thesecond is the table/view name.
Author(s)
Author: Predictive Analytics Team at Pivotal Inc.
Maintainer: Frank McQuillan, Pivotal Inc. <[email protected]>
See Also
objects to See Also as help, ~~~
Examples
## Not run:
## set up the database connection## Assume that .port is port number and .dbname is the database namecid <- db.connect(port = .port, dbname = .dbname, verbose = FALSE)

db.list 49
db.list()
db.existsObject("madlibtestdata.lin_ornstein", cid)
db.disconnect(cid, verbose = FALSE)
## End(Not run)
db.list List all the currently active connections with their information
Description
List all the currently active connections with their information including the connection ID, host,user, database, DBMS (database management system), MADlib schema name in the database, andthe R package name used to connect to the database.
Usage
db.list()
Value
No value is returned.
Note
Currently, only connection to PostgreSQL and Greenplum databases are supported. Support forother types of DBMS’s will be added in the future.
Author(s)
Author: Predictive Analytics Team at Pivotal Inc.
Maintainer: Frank McQuillan, Pivotal Inc. <[email protected]>
See Also
db.connect connects to database.
db.disconnect disconnects a connection.
connection info the functions that extract information about the connection.
conn.eql tests whether two connections are the same.

50 db.obj-class
Examples
## Not run:
## set up the database connection## Assume that .port is port number and .dbname is the database namecid1 <- db.connect(port = .port, dbname = .dbname, verbose = FALSE)cid2 <- db.connect(port = .port, dbname = .dbname, verbose = FALSE)
db.list() # list the two connections
db.disconnect(cid1, verbose = FALSE)db.disconnect(cid2, verbose = FALSE)
## End(Not run)
db.obj-class Abstract Class "db.obj"
Description
The super class of db.data.frame and db.Rquery
Objects from the Class
A virtual Class: No objects may be created from it.
Methods
See db.data.frame for all the available methods and functions.
Author(s)
Author: Predictive Analytics Team at Pivotal Inc.
Maintainer: Frank McQuillan, Pivotal Inc. <[email protected]>
See Also
db.data.frame creates a db.data.frame object.
as.db.data.frame converts db.Rquery object, data.frame, or a data file into a db.data.frameobject and at the same time creates a new table in the database.
db.data.frame and db.Rquery are the sub-classes.
lk or lookat displays a part of the table

db.objects 51
db.objects List all the existing tables/views in a database with their schema names
Description
This function lists all the existing tables and views in a database, together with their schema names
Usage
db.objects(search = NULL, conn.id = 1)
Arguments
search A string, default is NULL. List all database objects whose names have the stringin them. You can put regular expression here.
conn.id An integer, default is 1. The ID of the database connection.
Value
A character array. Each element has the format of ’schema_name.table_name’.
Author(s)
Author: Predictive Analytics Team at Pivotal Inc.
Maintainer: Frank McQuillan, Pivotal Inc. <[email protected]>
See Also
db.connect creates a connection to a database.
db.existsObject tests whether an object exists in the database
Examples
## Not run:
## set up the database connection## Assume that .port is port number and .dbname is the database namecid <- db.connect(port = .port, dbname = .dbname, verbose = FALSE)
## create a table using as.db.data.framedelete("abalone", conn.id = cid)x <- as.db.data.frame(abalone, "abalone", conn.id = cid)
db.objects(conn.id = cid) # list all tables/views
## list all tables/views start with "madlibtestdata.lin"## where "madlibtestdata" is the schema name

52 db.q
db.objects("^madlibtestdata.lin", cid)
db.disconnect(cid, verbose = FALSE)
## End(Not run)
db.q Execute a SQL query
Description
This function sends SQL queries into the connected database to execute, and then extracts the resultif there is any.
Usage
db(..., nrows = 100, conn.id = 1, sep = " ", verbose = TRUE)
.db(..., nrows = 100, conn.id = 1, sep = " ", verbose = TRUE)
db.q(..., nrows = 100, conn.id = 1, sep = " ", verbose = TRUE)
Arguments
... One or multiple SQL query strings. Multiple strings will be concatenated intoone SQL query string.
nrows An integer, default is 100. How many rows should be extracted? If it is NULL,"all" or non-positive value, all rows in the result will be loaded into R. For bigdataset, you may not want to do this.
conn.id An integer, default is 1. The ID of the connection. See db.list for how to listthe existing database connections.
sep A string, default is a space character " ". If multiple strings are used in ...,this string is used to separate them in the concatenation.
verbose A logical, default is TRUE. Whether to output the SQL query that you are exe-cuting.
Value
A data.frame that contains the result if the result is not empty. Otherwise, it returns a logicalvalue, which indicates whether the SQL query has been sent to the database successfully.
Author(s)
Author: Predictive Analytics Team at Pivotal Inc.
Maintainer: Frank McQuillan, Pivotal Inc. <[email protected]>
db.Rcrossprod-class 53
See Also
db.connect, db.objects, db.list,
Examples
## Not run:
## set up the database connection## Assume that .port is port number and .dbname is the database namecid <- db.connect(port = .port, dbname = .dbname, verbose = FALSE)
db("show search_path", conn.id = cid).db("drop table if exists tr;",
"create temp table tr (idx integer,val double precision);",
"insert into tr values (1, 2.3), (2, 3.4)", conn.id = cid)db.q("select * from tr", conn.id = cid)
db.disconnect(cid, verbose = FALSE)
## End(Not run)
db.Rcrossprod-class Class "db.Rcrossprod"
Description
This is the result generated by crossprod, and a sub-class of db.Rquery
Slots
As a sub-class of db.Rquery, this class contains all the slots that belong to db.Rquery. It also hasone additional slot as is described in the following.
.is.crossprod: A vector of logical values, which has the same length as the number of columns.Whether each column is the result of crossprod.
.is.symmetric: A vector of logical values, which has the same length as the number of columns.Whether the column contains matrices that are symmetric.
.dim: Dimension of the matrix represented by this object.
Extends
Class "db.Rquery", directly.
Methods
All methods for db.data.frame can be applied onto this class.

54 db.Rquery-class
Author(s)
Author: Predictive Analytics Team at Pivotal Inc.
Maintainer: Frank McQuillan, Pivotal Inc. <[email protected]>
See Also
db.Rquery is the superclass.
lk or lookat display the matrix
Examples
## Not run:showClass("db.Rcrossprod")
## set up the database connection## Assume that .port is port number and .dbname is the database namecid <- db.connect(port = .port, dbname = .dbname, verbose = FALSE)
## x points to table "abalone"x <- as.db.data.frame(abalone, conn.id = cid, verbose = FALSE)
lookat(crossprod(x[,-c(1,2)]))
x$arr <- db.array(1, x$length, x$diameter)
lookat(crossprod(x$arr))
db.disconnect(cid, verbose = FALSE)
## End(Not run)
db.Rquery-class Class "db.Rquery" and its sub-class db.Rview-class
Description
An object of this class represents a series of operations applied onto an existing db.data.frameobject. These operations are actually a SQL query, which one can choose to materialize in thedatabase using as.db.data.frame. lk can fetch a part of the result of executing the SQL query.Thus one does not need to create a table for every step of the operations, and the data transferedbetween R and the database is minimized.

db.Rquery-class 55
Objects from the Class
Objects can be created by almost all functions/methods that can be applied onto db.data.frameexcept content, lk and delete.
db.Rview-class is a sub-class of db.Rquery-class, and it behaves just like "view" in the databasesexcept that it exists only in R. Usually there is no difference to use db.Rview or db.Rquery.as.db.Rview casts a db.Rquery object into a db.Rview object.
Usually it is NOT recommended to directly manipulate the internal slots of these objects.
Slots
.content: Object of class "character". The SQL query that represents the operations. Thefunction content can get this value.
.expr: Object of class "character". An array of expression strings for columns of the table thatthe SQL query can be materialized into. It is not to used by the normal users.
.source: Object of class "character". A string, the table/view name which this SQL query isoriginated. It is not to used by the normal users.
.parent: Object of class "character". A string. In the SQl query it is the part after "from". It isnot to used by the normal users.
.conn.id: Object of class "numeric", an integer. The ID number of the database connectionwhere .source resides. The functions conn.id and conn.id<- can get and set this value.
.col.name: Object of class "character". An array of strings. The names of columns of the tablethat the SQL query can be materialized into. The S4 method names,db.obj-method gets thisvalue.
.key: Object of class "character". The name of the primary key column name in .source.Currently only one primary key column is supported. This value can be set during the creationof the object when using the function db.data.frame. The functions key and key<- can beused to get and set this value.
.col.data_type: Object of class "character". The 1D array of column data types of the tablethat the SQL query can be materialized into. This is not supposed to be used by the normaluser.
.col.udt_name: Object of class "character". The 1D array of column udt names of the tablethat the SQL query can be materialized into. This is not to used by normal users.
.where: Object of class "character". The condition string used in "where" inside the SQL query.
.is.factor: Object of class "logical". An array of logical values which indicate whether eachcolumn of the table that the SQL query can be materialized into is a factor. This is not to beused by the normal users.
.factor.suffix: Object of class "character". An array of strings for every column. Whencreating dummy columns for a factor column, we add a random string in the names of thedummy columns to avoid naming conflicts. So a factor column’s .factor.suffix is a randomstring, otherwise it is just an empty string. This is not to be used by the normal users. It isused only the MADlib wrapper functions that support categorical variables.
.factor.ref: The value of the factor reference level for the regressions. If it is NA, then theregressions automatically select a reference level.

56 db.Rquery-class
.sort: Object of class "list". The list contains the information used for "order by" in the SQLquery.by: A string. The column names that are used in "order by".order: A string, "" or "desc"str: A string, the full "order by ..." string.
.is.agg: logical value, whether this object represents an aggregate operation.
.dist.by: A string, the distribution policy for the original data table, which is used to constructthis db.Rquery object, when using Greenplum database or HAWQ. It can be character(0),which means the original data table is distributed randomly. Or it can be a string of columnnames separated by comma, which are the columns that are used in the "distributed by" whenthe original table was created.
Extends
Class "db.obj", directly.
Methods
All methods for db.data.frame can be applied onto this class.
Author(s)
Author: Predictive Analytics Team at Pivotal Inc.
Maintainer: Frank McQuillan, Pivotal Inc. <[email protected]>
See Also
db.data.frame creates a db.data.frame object.
as.db.data.frame converts db.Rquery object, data.frame, or a data file into a db.data.frameobject and at the same time creates a new table in the database.
as.db.Rview converts a db.Rquery object to a db.Rview object.
db.obj is the superclass.
Class db.data.frame is another sub-class of db.obj.
lk display a part of the table
Examples
## Not run:showClass("db.Rquery")
## set up the database connection## Assume that .port is port number and .dbname is the database namecid <- db.connect(port = .port, dbname = .dbname)
delete("abalone", conn.id = cid)

db.search.path 57
x <- as.db.data.frame(abalone, "abalone", conn.id = cid)
## create several db.Rquery objectsy <- x[,1:2]z <- x[x$rings > 10,]
dim(z) # get an error
lk(y)
lk(z)
## materialize a db.Rquery objectz <- as.db.data.frame(z, "abalone_rings_larger_10")delete("abalone_rings_larger_10", conn.id = cid)
dim(z) # no error
db.disconnect(cid, verbose = FALSE)
## End(Not run)
db.search.path Display or set the search path (i.e. default schemas) for a connectedsession to a database. The use can easily switch to a schema that hehas the privilege to write.
Description
Allow the user to check and set the search path for the session that he connects to the database. Thesearch path is a set of schema names separated by commas. These are the default schemas that theprogramme will search and save tables if a schema name is not given together with the table namein the format of "schema_name.table_name".
Usage
db.search.path(conn.id = 1, set = NULL)
db.default.schemas(conn.id = 1, set = NULL)
Arguments
conn.id An integer, default is 1. The ID of the database connection.
set A string, default is NULL. The default schema names separated by commas.
Value
When set is NULL, this function prints the current connected session’s search path.

58 db.table-class
Author(s)
Author: Predictive Analytics Team at Pivotal Inc.
Maintainer: Frank McQuillan, Pivotal Inc. <[email protected]>
See Also
db.connect connects to database, and the parameter default.schemas can be used to set thesearch path when connecting.
Examples
## Not run:
## set up the database connection## Assume that .port is port number and .dbname is the database namecid <- db.connect(port = .port, dbname = .dbname, verbose = FALSE, default.schemas ="public,madlib")
db.search.path()
db.search.path(set = "public,madlibtestdata")
db.disconnect(cid, verbose = FALSE)
## End(Not run)
db.table-class Class "db.table"
Description
A sub-class of db.data.frame which points to tables in the database
Objects from the Class
Objects can be created by calls of db.data.frame or as.db.data.frame
Slots
As a sub-class, this class has all the slots of db.data.frame. Here we list the extra slots.
.key: Object of class "character". The name of the primary key column name. Currently onlyone primary key column is supported. This value can be set during the creation of the objectwhen using the function db.data.frame. The functions key and key<- can be used to getand set this value.
.dim: Object of class "numeric". A two-integer array, the dimension information of the table thatthis object points to. The first integer is the total row number of the table, and the second isthe number of columns of the table. dim,db.table-method gets this value.

db.view-class 59
Extends
Class "db.data.frame", directly. Class "db.obj", by class "db.data.frame", distance 2.
Methods
See db.data.frame for all the methods that can take this class of object as an object.xs
Author(s)
Author: Predictive Analytics Team at Pivotal Inc.
Maintainer: Frank McQuillan, Pivotal Inc. <[email protected]>
See Also
db.data.frame creates a db.data.frame object.
as.db.data.frame converts db.Rquery object, data.frame, or a data file into a db.data.frameobject and at the same time creates a new table in the database.
db.data.frame is the superclass.
db.view is the other subclass of db.data.frame
db.Rquery is another sub-class of db.obj.
lk or lookat display a part of the table
db.view-class Class "db.view"
Description
A sub-class of db.data.frame which points to tables in the database
Objects from the Class
Objects can be created by calls of db.data.frame or as.db.data.frame
Slots
As a sub-class, this class has all the slots of db.data.frame. Here we list the extra slots.
.key: Object of class "character". The name of the primary key column name when the viewis materialized. The view in the database does not have a primary key. Currently only oneprimary key column is supported. This value can be set during the creation of the object whenusing the function db.data.frame. The functions key and key<- can be used to get and setthis value.
Extends
Class "db.data.frame", directly. Class "db.obj", by class "db.data.frame", distance 2.

60 delete
Methods
See db.data.frame for all the methods that can take this class of object as an object.xs
Author(s)
Author: Predictive Analytics Team at Pivotal Inc.
Maintainer: Frank McQuillan, Pivotal Inc. <[email protected]>
See Also
db.data.frame creates a db.data.frame object.
as.db.data.frame converts db.Rquery object, data.frame, or a data file into a db.data.frameobject and at the same time creates a new table in the database.
db.data.frame is the superclass.
db.table is the other subclass of db.data.frame
db.Rquery is another sub-class of db.obj.
lk or lookat display a part of the table
delete Safely delete a db.obj object or a table/view in the database
Description
This function deletes a db.data.frame object together with the table/view that it points to. Itdeletes a db.Rquery object. It can also directly delete a table or view in the database. Whenapplied onto some composite data objects, it deletes the data table wrapped by them.
Usage
## S4 method for signature 'db.data.frame'delete(x, cascade = FALSE)
## S4 method for signature 'db.Rquery'delete(x)
## S4 method for signature 'character'delete(x, conn.id = 1, is.temp = FALSE, cascade =FALSE)
## S4 method for signature 'arima.css.madlib'delete(x)
## S4 method for signature 'summary.madlib'delete(x)

delete 61
## S4 method for signature 'lm.madlib'delete(x)
## S4 method for signature 'lm.madlib.grps'delete(x)
## S4 method for signature 'logregr.madlib'delete(x)
## S4 method for signature 'logregr.madlib.grps'delete(x)
## S4 method for signature 'bagging.model'delete(x)
## S4 method for signature 'elnet.madlib'delete(x)
## S4 method for signature 'dt.madlib'delete(x)
## S4 method for signature 'dt.madlib.grps'delete(x)
Arguments
x The signature of the method.A db.data.frame object, which points to a table or view in the database;Or a db.Rquery object, which represents some operations on an existing db.data.frameobject;Or a string, the table/view name to delete in the database;Or an object which is the result of madlib.arima. In the this case, the resultmodel tables wrapped by model, residuals and statistics will be deleted.Or an object which is the result of madlib.summary (a summary.madlib object).In this case the result table created in the database and wrapped by the attribute"summary" will be deleted.Or an object which is the result of madlib.lm (a lm.madlib or lm.madlib.grpsobject). In this case, the result model table wrapped by model will be deleted.Or an object which is the result of madlib.glm with family = "binomial"(a logregr.madlib or logregr.madlib.grps object). In this case, the resultmodel table wrapped by model will be deleted.Or an object which is the result of generic.bagging. In this case, all resultmodel tables will be deleted.Or an object which is the result of madlib.elnet. In this casem all result modeltables will be deleted.

62 delete
Or an object which is the result of madlib.rpart. All result tables will bedeleted.
conn.id An integer, default is 1. The connection ID to the database.
is.temp A logical, default is FALSE. Whether the table/view is temporary.
cascade A logical, default is FALSE. Whether to delete objects together with all the ob-jects depending on it.
Details
When a db.data.frame object is deleted, the table/view that is associated with it is also deleted.
Value
When x is db.data.frame or table/view name, this function returns a logical value. which is TRUEif the deletion is successful.
No value is returned if x is db.Rquery
Author(s)
Author: Predictive Analytics Team at Pivotal Inc.
Maintainer: Frank McQuillan, Pivotal Inc. <[email protected]>
See Also
db.data.frame creates an object pointing to a table/view in the database.
db.objects lists all tables and views in a database together with their schema.
db.existsObject tests whether a table/view exists in the database.
as.db.data.frame creates a db.data.frame from a data.frame, a data file or a db.Rquery.
madlib.lm, madlib.glm, madlib.summary, madlib.arima are MADlib wrapper functions whoseresults can be safely deleted by this function.
Examples
## Not run:
## set up the database connection## Assume that .port is port number and .dbname is the database namecid <- db.connect(port = .port, dbname = .dbname, verbose = FALSE)
delete("abalone", cid, is.temp = TRUE)
delete("abalone", cid, is.temp = FALSE)
delete("abalone", conn.id = cid)x <- as.db.data.frame(abalone, "abalone", conn.id = cid)
lk(x, 10)

dim-methods 63
y <- as.db.data.frame(abalone, "abalone", conn.id = cid, is.temp = TRUE)
lk(y, 10)
db.existsObject("abalone", cid, is.temp = TRUE)
db.existsObject("abalone", cid, is.temp = FALSE)
delete("abalone", cid)
p <- db.objects()p[p == "abalone"]
## Example: delete multiple tables## all table in public schema start with "ornste"to.delete <- db.objects("public.ornste", conn.id = cid)for (table.name in to.delete) delete(table.name, conn.id = cid)
db.disconnect(cid, verbose = FALSE)
## End(Not run)
dim-methods Dimension of a table
Description
Display the dimension of the table that a db.table object points to.
Usage
## S4 method for signature 'db.table'dim(x)
## S4 method for signature 'db.view'dim(x)
## S4 method for signature 'db.Rquery'dim(x)
Arguments
x A db.obj. Only for db.table object, this function gives the dimension of tablethat x points to. For db.view and db.Rquery objects, an error message is raised.
Value
A two-integer array, where the first integer is the number of rows and the second integer is thenumber of columns.

64 eql-methods
Author(s)
Author: Predictive Analytics Team at Pivotal Inc.
Maintainer: Frank McQuillan, Pivotal Inc. <[email protected]>
See Also
db.obj, db.data.frame, db.table, db.view, db.Rquery are the class hierarchy structure of thispackage.
Examples
## Not run:
## set up the database connection## Assume that .port is port number and .dbname is the database namecid <- db.connect(port = .port, dbname = .dbname, verbose = FALSE)
## create a table from the example data.frame "abalone"delete("abalone", conn.id = cid)x <- as.db.data.frame(abalone, "abalone", conn.id = cid, verbose = FALSE)## preview of a tablelk(x, nrows = 10) # extract 10 rows of data
## get names of all columnsdim(x)
dim(x[,1:3])
db.disconnect(cid, verbose = FALSE)
## End(Not run)
eql-methods Test if two objects point to the same table
Description
This function checks if two db.obj objects are the equivalent. For objects of class db.data.frame,they need to have the same associated table. For objects of other types, they need to have identicalexpressions and the same associated table.
Usage
## S4 method for signature 'db.obj,db.obj'eql(e1,e2)

eql-methods 65
Arguments
e1, e2 The signature of the method. Both arguments are db.obj objects to be checkedfor equality.
Details
Objects of type db.data.frame are considered equal if they have the same content representation,and their associated tables have the same name, connected datbase, and type. Objects of other typesderived from db.obj are considered equal if they have the same values for content representation,@.source, @.parent, @.expression, @.where, @.conn.id, @.col.data_type, @.is.factor [email protected]. Two objects of different types are always considered not equal.
Value
A logical. Returns TRUE is the objects are equal.
Author(s)
Author: Predictive Analytics Team at Pivotal Inc.
Maintainer: Frank McQuillan, Pivotal Inc. <[email protected]>
See Also
lk or lookat Displays the actual data in a db.obj object.
Examples
## Not run:
## set up the database connection## Assume that .port is port number and .dbname is the database namecid <- db.connect(port = .port, dbname = .dbname, verbose = FALSE)
delete("abalone", conn.id = cid)as.db.data.frame(abalone, "abalone", conn.id = cid, verbose = FALSE)
x <- db.data.frame('abalone', conn.id = cid, key = 'id') # use default connection 1
y <- db.data.frame('abalone', conn.id = cid)
## Check for equalityeql(x,y) # This returns true
## create a db.Rquery objectz <- x[,] # x is a db.data.frame object, but z is not
eql(x,z) # This returns false
db.disconnect(cid, verbose = FALSE)

66 Extract database connection info
## End(Not run)
Extract database connection info
Utilities for extracting related information about a database connec-tion
Description
For a given database connection, these functions return the user name, host, database name, infoabout database management system, connection, the version of MADlib installed on this database,the schema name of MADlib installation, and the R package that is used to connect to this database.
Usage
user(conn.id = 1)
host(conn.id = 1)
dbname(conn.id = 1)
dbms(conn.id = 1)
conn(conn.id = 1)
port(conn.id = 1)
madlib(conn.id = 1)
madlib.version(conn.id = 1)
schema.madlib(conn.id = 1)
conn.pkg(conn.id = 1)
Arguments
conn.id Default value is 1. The database connection ID number con.id. It is an integer.
Value
For user, a string, which is the user name.
For host, a string, which is the host address.
For dbname, a string, which is the database name.
For dbms, a string, which is DBMS version information.
Extract database connection info 67
For conn, an object of DBI connection, which can be directly used with packages such as RPost-greSQL.
For port, an integer, which is the port number of the connection.
For madlib, a string, which is the MADlib version information.
For madlib.version, a string, exactly the same as madlib.
For schema.madlib, a string, which is the schema name of MADlib installation.
For conn.pkg, a string, which is the name of the R package that has been used to connect to thisdatabase.
Author(s)
Author: Predictive Analytics Team at Pivotal Inc.
Maintainer: Frank McQuillan, Pivotal Inc. <[email protected]>
See Also
db.connect creates connections to the databases.
db.disconnect disconnects an existing connection.
db.list lists all the current connections with their information.
conn.eql tests whether two connections are actually the same one.
Examples
## Not run:
## set up the database connection## Assume that .port is port number and .dbname is the database namecid1 <- db.connect(port = .port, dbname = .dbname, verbose = FALSE)cid2 <- db.connect(port = .port, dbname = .dbname, verbose = FALSE)
user(cid1)host(cid2)dbname(cid1) # use default connection 1dbms(cid1)madlib(cid1)madlib.version(cid1)schema.madlib(cid1)conn.pkg(cid1)
## conn is mostly for other packagescon <- conn(cid1) # get the connection objectdbListTables(con) # directly use functions in package RPostgreSQL
## This package provides a better function to list all tables/viewsdb.objects(cid1) # list all tables/views with their schema in connection 1
db.disconnect(cid1, verbose = FALSE)

68 Extract-Replace-methods
db.disconnect(cid2, verbose = FALSE)
## End(Not run)
Extract-Replace-methods
Extract or replace a part of db.obj objects
Description
Operators acting on db.obj objects to extract or replace parts.
Usage
## S4 method for signature 'db.obj'x$name## S4 method for signature 'db.obj'x[[i, j, ...]]## S4 method for signature 'db.obj,ANY,ANY,ANY'x[i, j, ..., drop = TRUE]## S4 replacement method for signature 'db.obj,character'x$name <- value## S4 replacement method for signature 'db.obj,integer'x$name <- value## S4 replacement method for signature 'db.obj,numeric'x$name <- value## S4 replacement method for signature 'db.obj,logical'x$name <- value## S4 replacement method for signature 'db.obj,db.Rquery'x$name <- value## S4 replacement method for signature 'db.obj,ANY,ANY,character'x[[i, j]] <- value## S4 replacement method for signature 'db.obj,ANY,ANY,integer'x[[i, j]] <- value## S4 replacement method for signature 'db.obj,ANY,ANY,numeric'x[[i, j]] <- value## S4 replacement method for signature 'db.obj,ANY,ANY,logical'x[[i, j]] <- value## S4 replacement method for signature 'db.obj,ANY,ANY,db.Rquery'x[[i, j]] <- value## S3 replacement method for class 'db.obj'x[i, j] <- value

Extract-Replace-methods 69
Arguments
x A db.obj (either db.table, db.view, or db.Rquery) from which to extractelement(s).
i, j, ... Indices specifying elements to extract or replace. Indices are ‘numeric’ or ‘char-acter’ vectors or db.Rquery object or empty (missing) or ‘NULL’.
name A string. The column name.
value Any valid value, including db.Rquery, character, numeric, integer, andlogical object. The value that is used to replace the part of the db.obj.
drop Not implemented yet.
Value
A db.Rquery object is returned. For the extraction methods, this is a SQL query to extract therequested subset. For the replacement methods, this is a SQL query representing the modifiedversion of x.
Author(s)
Author: Predictive Analytics Team at Pivotal Inc.
Maintainer: Frank McQuillan, Pivotal Inc. <[email protected]>
See Also
subset,db.obj-method Operator to extract elements
Examples
## Not run:
## set up the database connection## Assume that .port is port number and .dbname is the database namecid <- db.connect(port = .port, dbname = .dbname, verbose = FALSE)
x <- as.db.data.frame(abalone, conn.id = cid, verbose = FALSE)
x$area <- x[["length"]] * x[,"height"] # add a new column
y <- x[,-c(1,2)] # use all columns except the first two
db.disconnect(cid, verbose = FALSE)
## End(Not run)

70 Func-methods
Func-methods Mathematical functions that take db.obj objects as the argument
Description
Functions that apply onto db.obj objects
Usage
## S4 method for signature 'db.obj'exp(x)## S4 method for signature 'db.obj'abs(x)## S4 method for signature 'db.obj'log(x, ...)## S4 method for signature 'db.obj'log10(x)## S4 method for signature 'db.obj'sign(x)## S4 method for signature 'db.obj'sqrt(x)## S4 method for signature 'db.obj'factorial(x)## S4 method for signature 'db.obj'sin(x)## S4 method for signature 'db.obj'cos(x)## S4 method for signature 'db.obj'tan(x)## S4 method for signature 'db.obj'asin(x)## S4 method for signature 'db.obj'acos(x)## S4 method for signature 'db.obj'atan(x)## S4 method for signature 'db.obj,db.obj'atan2(y, x)## S4 method for signature 'db.obj,numeric'atan2(y, x)## S4 method for signature 'numeric,db.obj'atan2(y, x)
Arguments
x,y db.obj object. The function applies to each column of the db.obj object. If acolumn is an array, then the function applies onto each element of the array. If

Func-methods 71
the data type of the column makes no sense to be used in the function, then anull value is returned.
... Extra parameters. Not implemented.
Value
db.Rquery object, which contains the SQL query that computes the operations.
Note
A meaningful expression is generated only when the .col.data_type is "numeric", otherwise a"NULL" value is generated.
Author(s)
Author: Predictive Analytics Team at Pivotal Inc.
Maintainer: Frank McQuillan, Pivotal Inc. <[email protected]>
See Also
db.Rquery contains a SQL query that does the operations.
Examples
## Not run:## get the help for a method## help("+,db.obj,db.obj-method")
## set up the database connection## Assume that .port is port number and .dbname is the database namecid <- db.connect(port = .port, dbname = .dbname)
## create a table from the example data.frame "abalone"delete("abalone", conn.id = cid)x <- as.db.data.frame(abalone, "abalone", conn.id = cid)
x$rings <- exp(x$rings) # change the values
x$area <- log((x$length + 1) * (x$height + 1)) # add a new column
lk(x$area, 10) # view the actual values computed in database
fit <- madlib.lm(rings ~ area, data = x)
db.disconnect(cid, verbose = FALSE)
## End(Not run)

72 generic.bagging
generic.bagging This function runs boostrap aggregating for a given training function.
Description
A generic function to do boostrap aggregating for a given machine learning model. The user mightneed to write a wrapper for the training function so that they could satisfy the format requirementsdesceribed in the following.
Usage
generic.bagging(train, data, nbags = 10, fraction = 1)
Arguments
train A training function. It must have only one argument data. Given the data, itproduces the model.
data A db.obj object, which wraps the data in the database.
nbags An integer, default is 10. The number of bagging sampling.
fraction A double, default is 1. The fraction of data in each bagging sample.
Value
A bagging.model object, which is actually a list of fitted models.
Author(s)
Author: Predictive Analytics Team at Pivotal Inc.
Maintainer: Frank McQuillan, Pivotal Inc. <[email protected]>
References
[1] Wiki: bagging http://en.wikipedia.org/wiki/Bootstrap_aggregating
See Also
predict.bagging.model makes predictions using the result of this function.
generic.cv for cross-validation
sample,db.obj-method samples data from a table
generic.cv 73
Examples
## Not run:
## set up the database connection## Assume that .port is port number and .dbname is the database namecid <- db.connect(port = .port, dbname = .dbname, verbose = FALSE)
delete("abalone", conn.id = cid)as.db.data.frame(abalone, "abalone", conn.id = cid, verbose = FALSE)y <- db.data.frame("abalone", conn.id = cid)
fit <- generic.bagging(function(data) {madlib.lm(rings ~ . - id - sex, data = data)
}, data = y, nbags = 25, fraction = 0.7)
pred <- predict(fit, newdata = y) # make prediction
lookat(mean((y$rings - pred)^2)) # mean squared error
db.disconnect(cid, verbose = FALSE)
## End(Not run)
generic.cv Generic cross-validation for supervised learning algorithms
Description
This function runs cross-validation for a given supervised learning model, which is specified by thetraining function, prediction function, and metric function. The user might need to write wrappersfor the functions so that they satisfy the format requirements desceribed in the following. Thisfunction works on both in-memory and in-database data.
Usage
generic.cv(train, predict, metric, data, params = NULL, k = 10,approx.cut = TRUE, verbose = TRUE, find.min = TRUE)
Arguments
train A training function. Its first argument must be a db.obj object which is thewrapper for the data in database. Given the data, it produces the model. It canalso have other parameters that specifies the model, and these parameters mustappear in the list params.
predict A prediction function. It must have only two arguments, which are the fittedmodel (the first argument) and the new data input for prediction (the secondargument).

74 generic.cv
metric A metric function. It must have only two arguments. The first argument isthe prediction and the second is the data that contains the actual value. Thisfunction shoud measure the difference between the predicted and actual valuesand produce a single numeric value.
data A db.obj object, which wraps the data in the database, used for cross-validation.Or a data.frame, which contains data in memory.
params A list, default is NULL. The values of each parameters used by the training func-tion. An array of values for each parameter is an element in the list. The valuearrays for different parameters do not have to be the same length. The arrays ofshorter lengths are circularly expanded to the length of the longest element.
k An integer, default is 10. The cross-validation fold number.
approx.cut A boolean, default is TRUE. Whether to cut the data into k pieces in an approx-imate way, which is faster than the accurate way. For big data sets, cutting thedata into k pieces in an approximate way does not affect the result. See detailsfor more.
verbose A logical value, default is TRUE. Whether to print
find.min A logical value, default is TRUE. Whether the best set of parameters producesthe mode with the minimum metric value. Then a model will be trained on thewhole data set using the best set of parameters. If it is FALSE, the parameter setwith the maximum metric value will be used. This is ignored if params is NULL.
Details
In order to cut the data table into k equal pieces, a column of unique id for every row needs to beattached to the data so that one can cut the data using different ranges of the row id. For example,for a 1000 rows data table, when id is 1-100, 101-200, ..., one can cut the data into 10 pieces. Theid should be randomly assigned to the rows for cross-validation to use. Note that the original datais not touched in this process, instead all the data is copied to a new temporary table with the idcolumn created in the new table. Because a unique id is to be randomly assigned to each row, thisprocess cannot be easily parallelized.
When approx.cut is TRUE, which is the default, a column of uniform random integer instead ofconsecutive integers is created in the temporary table. We apply the same method to cut the datausing the different ranges of this column, for example, 1-100, 101-200, etc. Apparently, the kpieces of data do not have an exact equal size, and the sizes of them are only approximately equal.However, for big data sets, the differeces are relatively small and should not affect the result. Thisprocess does not generate unique ID’s for the rows, but can be easily parallelized, so this method ismuch faster for big data sets.
Value
If params is NULL, this function returns a list, which contains two elements: err and err.std,which are the errors and its standard deviation.
If params is not NULL, this function returns a cv.generic object, which is a list that contains thefollowing items:
metric A list, which contains- avg The average metric value for each set of parameters.

generic.cv 75
- std The standard deviation for the metric values of each set of parameters.- vals A matrix that contains all the metric value measured, whose rows corre-spond to different set of parameters, and columns correspond to different foldsof cross-validation.
params A data.frame, which contains all the parameter sets.
best The fit that has the optimum metric value.
best.params A list, the set of parameters that produces the optimum metric value.
Author(s)
Author: Predictive Analytics Team at Pivotal Inc.
Maintainer: Frank McQuillan, Pivotal Inc. <[email protected]>
See Also
generic.bagging does the boostrap aggregate computation.
Examples
## Not run:
## set up the database connectioncid <- db.connect(port = .port, dbname = .dbname, verbose = FALSE)
## ----------------------------------------------------------------------
dat <- as.db.data.frame(abalone, conn.id = cid, verbose = FALSE)
err <- generic.cv( function(data) {madlib.lm(rings ~ . - id - sex, data = data)
},predict,function(predicted, data) {
lookat(mean((data$rings - predicted)^2))}, data = dat, verbose = FALSE)
## ----------------------------------------------------------------------
x <- matrix(rnorm(100*20),100,20)y <- rnorm(100, 0.1, 2)
dat <- data.frame(x, y)delete("eldata", conn.id = cid)z <- as.db.data.frame(dat, "eldata", conn.id = cid, verbose = FALSE)
g <- generic.cv(train = function (data, alpha, lambda) {
madlib.elnet(y ~ ., data = data, family = "gaussian",

76 getTree.rf.madlib
alpha = alpha, lambda = lambda,control = list(random.stepsize=TRUE))
},predict = predict,metric = function (predicted, data) {
lk(mean((data$y - predicted)^2))},data = z,params = list(alpha=1, lambda=seq(0,0.2,0.1)),k = 5, find.min = TRUE, verbose = FALSE)
plot(g$params$lambda, g$metric$avg, type = 'b')
g$best
## ----------------------------------------------------------------------
db.disconnect(cid, verbose = FALSE)
## End(Not run)
getTree.rf.madlib MADlib wrapper function for Random Forest
Description
This function is a wrapper of MADlib’s random forest model get_tree function. The model builtusing madlib.randomForest is passed as input to this function.
Usage
getTree.rf.madlib(object, k=1, ...)
Arguments
object A random forest model object built using madlib.randomForest.
k Id of the tree to be retrieved. Can range between 1 and maximum number oftrees in the forest. default is 1.
... Arguments to be passed to or from other methods.
Value
A data frame object similar to R’s getTree result.
Author(s)
Author: Predictive Analytics Team at Pivotal Inc.
Maintainer: Frank McQuillan, Pivotal Inc. <[email protected]>

groups 77
References
[1] Documentation of random forest in MADlib 1.7, http://doc.madlib.net/latest/
See Also
madlib.randomForest function to train a random forest model.
print.rf.madlib function to print summary of a model fitted through madlib.randomForest
predict.rf.madlib is a wrapper for MADlib’s predict function for random forests.
madlib.lm, madlib.glm, madlib.summary, madlib.arima, madlib.elnet, madlib.rpart are allMADlib wrapper functions.
Examples
## Not run:
## set up the database connection## Assume that .port is port number and .dbname is the database namecid <- db.connect(port = .port, dbname = .dbname, verbose = FALSE)
x <- as.db.data.frame(abalone, conn.id = cid, verbose = FALSE)lk(x, 10)
## decision tree using abalone data, using default values of minsplit,## maxdepth etc.key(x) <- "id"fit <- madlib.randomForest(rings < 10 ~ length + diameter + height + whole + shell,
data=x)fitgetTree.rf.madlib(fit, k=2)
db.disconnect(cid)
## End(Not run)
groups Summary information for Logistic Regression output
Description
The function prints the value of each element in the Logistic Regression output object.

78 groups
Usage
## S3 method for class 'lm.madlib'groups(x)
## S3 method for class 'lm.madlib.grps'groups(x)
## S3 method for class 'logregr.madlib'groups(x)
## S3 method for class 'logregr.madlib.grps'groups(x)
Arguments
x The result of madlib.lm or madlib.glm
Value
A list that contains the value of each grouping colum. The elements of the list are the same asthe grouping columns. If x is a lm.madlib object with one group’s information in it, the elementsof the resulting list contain one value for each grouping column. If x is lm.madlib.grps, whichcontains multiple groups’ information, then each element of the resulting list is a vector with thelength equal to the number of different groups. logregr.madlib and logregr.madlib.grps havethe similar interpretation of the results.
If no grouping column is used, this funcion returns NULL.
Author(s)
Author: Predictive Analytics Team at Pivotal Inc.
Maintainer: Frank McQuillan, Pivotal Inc. <[email protected]>
See Also
madlib.glm wrapper for MADlib linear and logistic regressions.
madlib.lm wrapper for MADlib linear regression
predict.lm.madlib, predict.lm.madlib.grps, predict.logregr.madlib, predict.logregr.madlib.grpsmake predictions for new data.
Examples
## Not run:
## set up the database connection## Assume that .port is port number and .dbname is the database namecid <- db.connect(port = .port, dbname = .dbname, verbose = FALSE)

GUI 79
## create a table from the example data.framedelete("abalone", conn.id = cid)source_data <- as.db.data.frame(abalone, "abalone", conn.id = cid, verbose = FALSE)lk(source_data, 10)
## logistic regressionfit <- madlib.glm(rings < 10 ~ . - id | sex , data = source_data, family = "binomial")
groups(fit) # all grouping column values
groups(fit[[1]]) # the first model's grouping column value
db.disconnect(cid, verbose = FALSE)
## End(Not run)
GUI Graphical interface for PivotalR based upon shiny
Description
This function launches a shiny server which provides a graphical interface for PivotalR. Press Ctrl+cto stop the shiny server.
Usage
PivotalR()
pivotalr()
Details
The graphical interface for PivotalR is very easy to use. Just follow the instructions on screen.The GUI is still at a very early stage and has only very limited functionality. We will add morefunctionalities into the GUI in the future versions.
Author(s)
Author: Predictive Analytics Team at Pivotal Inc.
Maintainer: Frank McQuillan, Pivotal Inc. <[email protected]>
References
[1] RStudio and Inc. (2013). shiny: Web Application Framework for R. R package version 0.6.0.https://cran.r-project.org/package=shiny
[2] shiny website, http://www.rstudio.com/shiny/

80 ifelse
ifelse Conditional Element Selection
Description
’ifelse’ returns a value with the same shape as ’test’ which is filled with elements selected fromeither ’yes’ or ’no’ depending on whether the element of ’test’ is ’TRUE’ or ’FALSE’.
Usage
## S4 method for signature 'db.obj'ifelse(test, yes, no)
Arguments
test A db.obj object, which has only one column. The column can be casted intoboolean values.
yes A normal value or a db.obj object. It is the returned value when test is TRUE.
no The returned value when test is FALSE.
Value
A db.obj which has the same length in-database as test.
Author(s)
Author: Hong Ooi, Pivotal Inc.
Maintainer: Frank McQuillan, Pivotal Inc. <[email protected]>
See Also
db.obj
Examples
## Not run:
## set up the database connection## Assume that .port is port number and .dbname is the database namecid <- db.connect(port = .port, dbname = .dbname, verbose = FALSE)
## create a tablex <- as.db.data.frame(abalone, conn.id = cid, verbose = FALSE)
## create a new db.obj with one-column,## and values "small" or "big"z <- ifelse(x$rings < 10, "small", "big")

is.db.data.frame 81
db.disconnect(cid, verbose = FALSE)
## End(Not run)
is.db.data.frame Check if an object is of type db.data.frame
Description
This function checks if the input is of type db.data.frame.
Usage
is.db.data.frame(x)
Arguments
x The input can be of any type.
Details
is.db.data.frame() returns TRUE if x is of type db.data.frame. Otherwise, it returns FALSE.
Value
A logical. Returns TRUE if the input is of type db.data.frame
Author(s)
Author: Predictive Analytics Team at Pivotal Inc.
Maintainer: Frank McQuillan, Pivotal Inc. <[email protected]>
See Also
as.db.data.frame Convert an object into another object of type db.data.frame.
Examples
## Not run:
## set up the database connection## Assume that .port is port number and .dbname is the database namecid <- db.connect(port = .port, dbname = .dbname, verbose = FALSE)
## create a table from the example data.frame "abalone"tmp <- as.db.data.frame(abalone, conn.id = cid, verbose = FALSE)x <- db.data.frame(content(tmp), conn.id = cid, key = 'id')

82 is.factor-methods
## getting the primary keyis.db.data.frame(x) #check if x is of type db.data.frame
db.disconnect(cid, verbose = FALSE)
## End(Not run)
is.factor-methods Detect whether a db.obj object is a categorical object
Description
This function detects whether a db.obj object is a categorical object.
Usage
## S4 method for signature 'db.obj'is.factor(x)
Arguments
x A db.obj object.
Value
A logical value. When all columns of db.obj are categorical variables, this function returns TRUE.
Author(s)
Author: Predictive Analytics Team at Pivotal Inc.
Maintainer: Frank McQuillan, Pivotal Inc. <[email protected]>
See Also
as.factor,db.obj-method converts a column db.obj of into categorical variables.
Examples
## Not run:
## set up the database connection## Assume that .port is port number and .dbname is the database namecid <- db.connect(port = .port, dbname = .dbname, verbose = FALSE)
## create a table from the example data.frame "abalone"x <- as.db.data.frame(abalone, conn.id = cid, verbose = FALSE)

is.na-method 83
## set sex to be a categorical variablex$sex <- as.factor(x$sex)
is.factor(x$sex)
is.factor(x)
db.disconnect(cid, verbose = FALSE)
## End(Not run)
is.na-method Query if the entries in a table are NULL
Description
This function is equivalent to an SQL query that checks if the entries in a table are NULL.
Usage
## S4 method for signature 'db.obj'is.na(x)
Arguments
x The signature of the method. A db.obj object.
Details
is.na() creates a db.Rquery object where the NULL entries in a db.obj object are TRUE, andother the entries are FALSE.
Value
The return value is a db.Rquery object.
Author(s)
Author: Predictive Analytics Team at Pivotal Inc.
Maintainer: Frank McQuillan, Pivotal Inc. <[email protected]>
See Also
lk or lookat Displays the contents of a db.obj object.

84 key
Examples
## Not run:
## set up the database connection## Assume that .port is port number and .dbname is the database namecid <- db.connect(port = .port, dbname = .dbname, verbose = FALSE)
## create a temp table from the example data.frame "abalone"x <- as.db.data.frame(abalone, conn.id = cid, verbose = FALSE)
#Query which entries of x are NULLis.na(x)
y <- xy[is.na(y)] <- 3
z <- xz[is.na(x$height),"height"] <- 23
db.disconnect(cid, verbose = FALSE)
## End(Not run)
key Get or set the primary key for a table
Description
This function gets or sets the primary key for a db.obj table.
Usage
key(x)
key(x) <- value
Arguments
x is a db.obj object.
value must be a string.
Details
key() will return the primary key of a table. If the primary key is not set, key() will return thecharacter 0. If key() is being used to set the primary key, then value must be a string, and it mustmatch one of the column names in the table.

Logical-methods 85
If this function is used to change the primary key to a new column name, this function does NOTcheck if all the values in that column are unique.
Value
The return value is the primary key of the table.
Author(s)
Author: Predictive Analytics Team at Pivotal Inc.
Maintainer: Frank McQuillan, Pivotal Inc. <[email protected]>
See Also
lk or lookat Displays the contents of a db.obj object.
Examples
## Not run:
## set up the database connection## Assume that .port is port number and .dbname is the database namecid <- db.connect(port = .port, dbname = .dbname, verbose = FALSE)
## create a table from the example data.frame "abalone"tmp <- as.db.data.frame(abalone, conn.id = cid, verbose = FALSE)x <- db.data.frame(content(tmp), key = 'id', conn.id = cid, verbose = FALSE)
## getting the primary keykey(x) # Display the primary key for x
## Changing the primary keykey(x) <- 'length'
db.disconnect(cid, verbose = FALSE)
## End(Not run)
Logical-methods Logical operations for db.obj objects
Description
These binary operators perform logical operations on db.obj objects

86 Logical-methods
Usage
## S4 method for signature 'db.obj'
## S4 method for signature 'db.obj'!x
## S4 method for signature 'db.obj,db.obj'e1 & e2
## S4 method for signature 'db.obj,db.obj'e1 | e2
## S4 method for signature 'db.obj,logical'e1 & e2
## S4 method for signature 'db.obj,logical'e1 | e2
## S4 method for signature 'logical,db.obj'e1 & e2
## S4 method for signature 'logical,db.obj'e1 | e2
Arguments
e1, e2 logical or db.obj object.
x db.obj object.
Value
db.Rquery object, which contains the SQL query that computes the logical operations.
Note
A meaningful expression is generated only when the .col.data_type is "boolean", otherwise a"NULL" value is generated.
Author(s)
Author: Predictive Analytics Team at Pivotal Inc.
Maintainer: Frank McQuillan, Pivotal Inc. <[email protected]>
See Also
db.Rquery contains a SQL query that does the operations.

madlib.arima 87
Examples
## Not run:## get the help for a method## help("|,db.obj,db.obj-method")
## set up the database connection## Assume that .port is port number and .dbname is the database namecid <- db.connect(port = .port, dbname = .dbname, verbose = FALSE)
## create a table from the example data.frame "abalone"x <- as.db.data.frame(abalone, conn.id = cid, verbose = FALSE)
lk(x$rings[x$length > 10 & x$height < 2,])
db.disconnect(cid, verbose = FALSE)
## End(Not run)
madlib.arima Wrapper for MADlib’s ARIMA model fitting function
Description
Apply ARIM model fitting onto a table that contains time series data. The table must have twocolumns: one for the time series values, and the other for the time stamps. The time stamp can beanything that can be ordered. This is because the rows of a table does not have inherent order andthus needs to be ordered by the extra time stamp column.
Usage
## S4 method for signature 'db.Rquery,db.Rquery'madlib.arima(x, ts, by = NULL,order=c(1,1,1), seasonal = list(order = c(0,0,0), period = NA),include.mean = TRUE, method = "CSS", optim.method = "LM",optim.control = list(), ...)
## S4 method for signature 'formula,db.obj'madlib.arima(x, ts, order=c(1,1,1),seasonal = list(order = c(0,0,0), period = NA), include.mean = TRUE,method = "CSS", optim.method = "LM", optim.control = list(), ...)
Arguments
x A formula with the format of time series value ~ time stamp | grouping col_1 + ... + groupingcol_n. Or a db.Rquery object, which is the time series value. Grouping isnot implemented yet. Both time stamp and time series can be valid expressions.

88 madlib.arima
We must specify the time stamp because the table in database has no order ofrows, and we have to order they according the given time stamps.
ts If x is a formula object, this must be a db.obj object, which contains boththe time series and time stamp columns. If x is a db.Rquery object, this mustbe another db.Rquery object, which is the time stamp and can be a validexpression.
by A list of db.Rquery, the default is NULL. The grouping columns. Right now,this functionality is not implemented yet.
order A vector of 3 integers, default is c(1,1,1). The ARIMA orders p, d, q forAR, I and MA.
seasonal A list of order and perid, default is list(order = c(0,0,0), period = NA).The seasonal orders and period. Currently not implemented.
include.mean A logical value, default is TRUE. Whether to estimate the mean value of thetime series. If the integration order d (the second element of order) is not zero,include.mean is set to FALSE in the calculation.
method A string, the fitting method. The default is "CSS", which uses conditional-sum-of-squares to fit the time series. Right now, only "CSS" is supported.
optim.method A string, the optimization method. The default is "LM", the Levenberg-Marquardtalgorithm. Right now, only "LM" is supported.
optim.control A list, default is list(). The control parameters of the optimizer. For optim.method="LM",it can have the following optional parameters:- max_iter: Maximum number of iterations to run learning algorithm (Default =100)- tau: Computes the initial step size for gradient algorithm (Default = 0.001)- e1: Algorithm-specific threshold for convergence (Default = 1e-15)- e2: Algorithm-specific threshold for convergence (Default = 1e-15)- e3: Algorithm-specific threshold for convergence (Default = 1e-15)- hessian_delta: Delta parameter to compute a numerical approximation of theHessian matrix (Default = 1e-6)
... Other optional parameters. Not implemented.
Details
Given a time series of data X, the Autoregressive Integrated Moving Average (ARIMA) model isa tool for understanding and, perhaps, predicting future values in the series. The model consistsof three parts, an autoregressive (AR) part, a moving average (MA) part, and an integrated (I) partwhere an initial differencing step can be applied to remove any non-stationarity in the signal. Themodel is generally referred to as an ARIMA(p, d, q) model where parameters p, d, and q are non-negative integers that refer to the order of the autoregressive, integrated, and moving average partsof the model respectively.
MADlib’s ARIMA function implements a parallel version of the LM algorithm to maximize theconditional log-likelihood, which is suitable for big data.

madlib.arima 89
Value
Returns an arima.css.madlib object, which is a list that contains the following items:
coef A vector of double values. The fitting coefficients of AR, MA and mean value(if include.mean is TRUE).
s.e. A vector of double values. The standard errors of the fitting coefficients.
series A string, the data source table or SQL query.
time.stamp A string, the name of the time stamp column.
time.series A string, the name of the time series column.
sigma2 the MLE of the innovations variance.
loglik the maximized conditional log-likelihood (of the differenced data).
iter.num An integer, how many iterations of the LM algorithm is used to fit the time serieswith ARIMA model.
exec.time The time spent on the MADlib ARIMA fitting.
residuals A db.data.frame object that points to the table that contains all the fitted inno-vations.
model A db.data.frame object that points to the table that contains the coefficientsand standard error. This table is needed by predict.arima.css.madlib.
statistics A db.data.frame object that points to the table that contains information in-cluding log-likelihood, sigma^2 etc. This table is needed by predict.arima.css.madlib.
call A language object. The matched function call.
Author(s)
Author: Predictive Analytics Team at Pivotal Inc.
Maintainer: Frank McQuillan, Pivotal Inc. <[email protected]>
References
[1] Rob J Hyndman and George Athanasopoulos: Forecasting: principles and practice, http://otexts.com/fpp/
[2] Robert H. Shumway, David S. Stoffer: Time Series Analysis and Its Applications With R Ex-amples, Third edition Springer Texts in Statistics, 2010
[3] Henri Gavin: The Levenberg-Marquardt method for nonlinear least squares curve-fitting prob-lems, 2011
See Also
madlib.lm, madlib.glm, madlib.summary are MADlib wrapper functions.
delete deletes the result of this function together with the model, residual and statistics tables.
print.arima.css.madlib, show.arima.css.madlib and summary.arima.css.madlib prints theresult in a pretty format.
predict.arima.css.madlib makes forecast of the time series based upon the result of this func-tion.

90 madlib.arima
Examples
## Not run:library(PivotalR)
## set up the database connection## Assume that .port is port number and .dbname is the database namecid <- db.connect(port = .port, dbname = .dbname, verbose = FALSE)
## use double values as the time stamp## Any values that can be ordered will workexample_time_series <- data.frame(id =
seq(0,1000,length.out=length(ts)),val = arima.sim(list(order=c(2,0,1), ar=c(0.7,
-0.3), ma=0.2), n=1000000) + 3.2)
x <- as.db.data.frame(example_time_series, field.types = list(id="doubleprecision", val = "double precision"), conn.id = cid)
dim(x)
names(x)
## use formulas <- madlib.arima(val ~ id, x, order = c(2,0,1))
s
## delete s and the 3 tables: model, residuals and statisticsdelete(s)
s # s does not exist any more
## do not use formulas <- madlib.arima(x$val, x$id, order = c(2,0,1))
s
lookat(sort(s$residuals, F, s$residuals$tstamp), 10)
lookat(s$model)
lookat(s$statistics)
## 10 forecastspred <- predict(s, n.ahead = 10)
lookat(sort(pred, F, pred$step_ahead), "all")
## Use expressionss <- madlib.arima(val+2 ~ I(id + 1), x, order = c(2,0,1))

madlib.elnet 91
db.disconnect(cid, verbose = FALSE)
## End(Not run)
madlib.elnet MADlib’s elastic net regularization for generalized linear models
Description
This function wraps MAdlib’s elastic net regularization for generalized linear models. Currentlylinear and logistic regressions are supported.
Usage
madlib.elnet(formula, data, family = c("gaussian", "linear", "binomial","logistic"), na.action = NULL, na.as.level = FALSE, alpha = 1, lambda = 0.1,standardize = TRUE, method = c("fista", "igd", "sgd", "cd"),control = list(), glmnet = FALSE, ...)
Arguments
formula A formula (or one that can be coerced to that class), specifies the dependent andindependent variables.
data A db.obj object. Currently, this parameter is mandatory. If it is an objectof class db.Rquery or db.view, a temporary table will be created, and furthercomputation will be done on the temporary table. After the computation, thetemporary will be dropped from the corresponding database.
family A string which indicates which form of regression to apply. Default value is"gaussian". The accepted values are: "gaussian" or "linear": Linear regression;"binomial" or "logistic": Logistic regression. The support for other families willbe added in the future.
na.action A string which indicates what should happen when the data contain NAs. Possi-ble values include na.omit, "na.exclude", "na.fail" and NULL. Right now,na.omit has been implemented. When the value is NULL, nothing is done on theR side and NA values are filtered on the MADlib side. User defined na.actionfunction is allowed.
na.as.level A logical value, default is FALSE. Whether to treat NA value as a level in a cate-gorical variable or just ignore it.
alpha A numeric value in [0,1], elastic net mixing parameter. The penalty is definedas(1-alpha)/2||beta||_2^2+alpha||beta||_1.’alpha=1’ is the lasso penalty, and ’alpha=0’ the ridge penalty.
lambda A positive numeric value, the regularization parameter.
standardize A logical, default: TRUE. Whether to normalize the data. Setting this to TRUEusually yields better results and faster convergence.

92 madlib.elnet
method A string, default: "fista". Name of optimizer, "fista", "igd"/"sgd" or "cd". "fista"means the fast iterative shrinkage-thresholding algorithm [1], and "sgd" imple-ments the stochastic gradient descent algorithm [2]. "cd" implements the coor-dinate descent algorithm [5].
control A list, which contains the control parameters for the optimizers.(1) If method is "fista", the allowed control parameters are:- max.stepsize A numeric value, default is 4.0. Initial backtracking step size.At each iteration, the algorithm first tries stepsize = max.stepsize, and if it doesnot work out, it then tries a smaller step size, stepsize = stepsize/eta, where etamust be larger than 1. At first glance, this seems to perform repeated iterationsfor even one step, but using a larger step size actually greatly increases the com-putation speed and minimizes the total number of iterations. A careful choice ofmax_stepsize can decrease the computation time by more than 10 times.- eta A numeric value, default is 2. If stepsize does not work stepsize / eta istried. Must be greater than 1.- use.active.set A logical value, default is FALSE. If use_active_set is TRUE,an active-set method is used to speed up the computation. Considerable speedupis obtained by organizing the iterations around the active set of features – thosewith nonzero coefficients. After a complete cycle through all the variables, weiterate on only the active set until convergence. If another complete cycle doesnot change the active set, we are done, otherwise the process is repeated.- activeset.tolerance A numeric value, default is the value of the toleranceargument (see below). The value of tolerance used during active set calculation.- random.stepsize A logical value, default is FALSE. Whether to add somerandomness to the step size. Sometimes, this can speed up the calculation.(2) If method is "sgd", the allowed control parameters are:- stepsize The default is 0.01.- step.decay A numeric value, the actual setpsize used for current step is (pre-vious stepsize) / exp(setp.decay). The default value is 0, which means that aconstant stepsize is used in SGD.- threshold A numeric value, default is 1e-10. When a coefficient is reallysmall, set this coefficient to be 0. Due to the stochastic nature of SGD, we canonly obtain very small values for the fitting coefficients. Therefore, threshold isneeded at the end of the computation to screen out tiny values and hard-set themto zeros. This is accomplished as follows: (1) multiply each coefficient withthe standard deviation of the corresponding feature; (2) compute the averageof absolute values of re-scaled coefficients; (3) divide each rescaled coefficientwith the average, and if the resulting absolute value is smaller than threshold,set the original coefficient to zero.- parallel A logical value, the default is True. Whether to run the computationon multiple segments. SGD is a sequential algorithm in nature. When runningin a distributed manner, each segment of the data runs its own SGD model andthen the models are averaged to get a model for each iteration. This averagingmight slow down the convergence speed, although we also acquire the ability toprocess large datasets on multiple machines. This algorithm, therefore, providesthe parallel option to allow you to choose whether to do parallel computation.(3) The common control parameters for both "fista" and "sgd" optimizers:

madlib.elnet 93
- max.iter An integer, default is 100. The maximum number of iterations thatare allowed.- tolerance A numeric value, default is 1e-4. The criteria to end iterations.Basically 1e-4 will produce results with 4 significant digits. Both the "fista" and"sgd" optimizers compute the average difference between the coefficients of twoconsecutive iterations, and when the difference is smaller than tolerance or theiteration number is larger than max_iter, the computation stops.- warmup A logical value, default is FALSE. If warmup is TRUE, a series of lambdavalues, which is strictly descent and ends at the lambda value that the user wantsto calculate, is used. The larger lambda gives very sparse solution, and thesparse solution again is used as the initial guess for the next lambda’s solution,which speeds up the computation for the next lambda. For larger data sets,this can sometimes accelerate the whole computation and may be faster thancomputation on only one lambda value.- warmup.lambdas A vector of numeric values, default is NULL. The lambdavalue series to use when warmup is True. The default is NULL, which means thatlambda values will be automatically generated. The warmup lambda values startfrom a large value and end at the lambda value.- warmup.lambda.no An integer Default: 15. How many lambdas are used inwarm-up. If warmup_lambdas is not NULL, this value is overridden by thenumber of provided lambda values.- warmup.tolerance A numeric value, the value of tolerance used during warmup.The default is the same as the tolerance value.(4) The control parameters for "cd" optimizer includemax.iter, tolerance, use.active.set and verbose for family = "gaussian"
max.iter, tolerance, use.active.set, verbose, warmup, warmup.lambda.nofor family = "binomial"
All parameters have been explained above. The only one left is verbose.verbose A logical value, whether to output the warning message for "cd" opti-mizer. See the note section for details.
glmnet A logical value, default is FALSE. The R package glmnet states that "Note alsothat for gaussian, glmnet standardizes y to have unit variance before computingits lambda sequence (and then unstandardizes the resulting coefficients); if youwish to reproduce/compare results with other software, best to supply a stan-dardized y." So if the user wants to compare the result of this function with thatof glmnet, he can set this value to be TRUE, which tells this function to do thesame data transformation as glmnet in the "gaussian" case so that one can easilycompare the results. When family = "binomial", this parameter is ignored.
... More arguments, currently not implemented.
Details
the objective function for "gaussian" is
1/2 RSS/nobs + lambda*penalty,
and for the other models it is
-loglik/nobs + lambda*penalty.
94 madlib.elnet
Value
An object of elnet.madlib class, which is actually a list that contains the following items:
coef A vector, the fitting coefficients.
intercept A numeric value, the intercept.
y.scl A numeric value, which is used to scale the dependent values. In the "gaussian"case, it is 1 if glmnet is FALSE, and it is the standard deviation of the dependentvariable if glmnet is TRUE.
loglik A numeric value, the log-likelihood of the fitting result.
standardize The standardize value in the arguments.
iter An integer, the itertion number used.
ind.str A string. The independent variables in an array format string.
terms A terms object, describing the terms in the model formula.
model A db.data.frame object, which wraps the result table of this function. Whenmethod = "cd", there is no result table, because all the results are in R side.
call A language object. The function call that generates this result.
alpha The alpha in the arguments.
lambda The lambda in the arguments.
method The method string in the arguments.
family The family string in the arguments.
appear An array of strings, the same length as the number of independent variables. Thestrings are used to print a clean result, especially when we are dealing with thefactor variables, where the dummy variable names can be very long due to the in-serting of a random string to avoid naming conflicts, see as.factor,db.obj-methodfor details. The list also contains dummy and dummy.expr, which are also usedfor processing the categorical variables, but do not contain any important infor-mation.
max.iter, tolerance
The max.iter and tolerance in the control.
Note
The coordinate descent (method = "cd") algorithm is currently only available in PivotalR. In thefuture, we will also implement it in MADlib. The idea is to do some part of the computation inmemory. Due to the memory usage liimitation of the database, this method cannot handle the fittingwhere the number of features is too large (a couple of thousands).
Note
It is strongly recommended that you run this function on a subset of the data with a limited max_iterbefore applying it to the full data set with a large max.iter if the data set is big. In the pre-run, youcan adjust the parameters to get the best performance and then apply the best set of parameters tothe whole data set.

madlib.elnet 95
Author(s)
Author: Predictive Analytics Team at Pivotal Inc.
Maintainer: Frank McQuillan, Pivotal Inc. <[email protected]>
References
[1] Beck, A. and M. Teboulle (2009), A fast iterative shrinkage-thresholding algorithm for linearinverse problems. SIAM J. on Imaging Sciences 2(1), 183-202.
[2] Shai Shalev-Shwartz and Ambuj Tewari, Stochastic Methods for l1 Regularized Loss Minimiza-tion. Proceedings of the 26th International Conference on Machine Learning, Montreal, Canada,2009.
[3] Elastic net regularization. http://en.wikipedia.org/wiki/Elastic_net_regularization
[4] Kevin P. Murphy, Machine Learning: A Probabilistic Perspective, The MIT Press, Chap 13.4,2012.
[5] Jerome Friedman, Trevor Hastie and Rob Tibshirani, Regularization Paths for Generalized Lin-ear Models via Coordinate Descent, Journal of Statistical Software, Vol. 33(1), 2010.
See Also
generic.cv does k-fold cross-validation. See the examples there about how to use elastic nettogether with cross-validation.
Examples
## Not run:
## set up the database connection## Assume that .port is port number and .dbname is the database namecid <- db.connect(port = .port, dbname = .dbname, verbose = FALSE)
x <- matrix(rnorm(100*20),100,20)y <- rnorm(100, 0.1, 2)
dat <- data.frame(x, y)
delete("eldata")z <- as.db.data.frame(dat, "eldata", conn.id = cid, verbose = FALSE)
fit <- madlib.elnet(y ~ ., data = z, alpha = 0.2, lambda = 0.05, control= list(random.stepsize=TRUE))
fit
lk(mean((z$y - predict(fit, z))^2)) # mean square error
fit <- madlib.elnet(y ~ ., data = z, alpha = 0.2, lambda = 0.05, method = "cd")
fit

96 madlib.glm
db.disconnect(cid, verbose = FALSE)
## End(Not run)
madlib.glm Generalized Linear Regression by MADlib in databases
Description
The wrapper function for MADlib’s generzlized linear regression [7] including the support for mult-ple families and link functions. Heteroskedasticity test is implemented for linear regression. One ormultiple columns of data can be used to separate the data set into multiple groups according to thevalues of the grouping columns. The requested regression method is applied onto each group, whichhas fixed values of the grouping columns. Multinomial logistic regression is not implemented yet.Categorical variables are supported. The computation is parallelized by MADlib if the connecteddatabase is Greenplum/HAWQ database. The regression computation can also be done on a columnwhich contains an array as its value in the data table.
Usage
madlib.glm(formula, data, family = gaussian, na.action = NULL, control= list(), ...)
Arguments
formula An object of class formula (or one that can be coerced to that class): a symbolicdescription of the model to be fitted. The details of model specification are givenunder ‘Details’.
data An object of db.obj class. Currently, this parameter is mandatory. If it is anobject of class db.Rquery or db.view, a temporary table will be created, andfurther computation will be done on the temporary table. After the computation,the temporary will be dropped from the corresponding database.
family A string which indicates which form of regression to apply. Default valueis “gaussian”. The accepted values are: gaussian(identity) (default forgaussian family), gaussian(log), gaussian(inverse), binomial(logit)(default for binomial family), binomial(probit), poisson(log) (default forpoisson family), poisson(identity), poisson(sqrt), Gamma(inverse) (de-fault for Gamma family), Gamma(identity), Gamma(log), inverse.gaussian(1/mu^2)(default for inverse.gaussian family), inverse.gaussian(log), inverse.gaussian(identity),inverse.gaussian(inverse).
na.action A string which indicates what should happen when the data contain NAs. Possi-ble values include na.omit, "na.exclude", "na.fail" and NULL. Right now,na.omit has been implemented. When the value is NULL, nothing is done on theR side and NA values are filtered on the MADlib side. User defined na.actionfunction is allowed.
madlib.glm 97
control A list, extra parameters to be passed to linear or logistic regressions.na.as.level: A logical value, default is FALSE. Whether to treat NA value as alevel in a categorical variable or just ignore it.For the linear regressions, the extra parameter is hetero. A logical, deafult isFALSE. If it is TRUE, then Breusch-Pagan test is performed on the fitting modeland the corresponding test statistic and p-value are computed.For logistic regression, one can pass the following extra parameters:method: A string, default is "irls" (iteratively reweighted least squares [3]),other choices are "cg" (conjugate gradient descent algorithm [4]) and "igd"(stochastic gradient descent algorithm [5]). These algorithm names for logis-tic regression, namely family=binomial(logit) and use.glm=FALSE in thecontrol list.max.iter: An integer, default is 10000. The maximum number of iterationsthat the algorithms will run.tolerance: A numeric value, default is 1e-5. The stopping threshold for theiteration algorithms.use.glm: Whether to call MADlib’s GLM function even when the family isgaussian(identity) or binomial(logit). For these two cases, the defaultbehavior is to call MADlib’s linear regression or logistic regression respectively,which might give better performance under certain circumstances. However, ifuse.glm is TRUE, then the generalized linear function will be used.
... Further arguments passed to or from other methods. Currently, no more param-eters can be passed to the linear regression and logistic regression.
Details
See madlib.lm for more details.
Value
For the return value of linear regression see madlib.lm for details.
For the logistic regression, the returned value is similar to that of the linear regression. If there isno grouping (i.e. no | in the formula), the result is a logregr.madlib object. Otherwise, it is alogregr.madlib.grps object, which is just a list of logregr.madlib objects.
If MADlib’s generalized linear regression function is used (use.glm=TRUE for family=binomial(logit)),the return value is a glm.madlib object without grouping or a glm.madlib.grps object with group-ing.
A logregr.madlib or glm.madlib object is a list which contains the following items:
grouping column(s)
When there are grouping columns in the formula, the resulting list has multipleitems, each of which has the same name as one of the grouping columns. Allof these items are vectors, and they have the same length, which is equal to thenumber of distinct combinations of all the grouping column values. Each row ofthese items together is one distinct combination of the grouping values. Whenthere is no grouping column in the formula, none of such items will appear inthe resulting list.

98 madlib.glm
coef A numeric matrix, the fitting coefficients. Each row contains the coefficients forthe linear regression of each group of data. So the number of rows is equal tothe number of distinct combinations of all the grouping column values.
log_likelihood A numeric array, the log-likelihood for each fitting to the groups. Thus thelength of the array is equal to grps.
std_err A numeric matrix, the standard error for each coefficients. The row number isequal to grps.
z_stats,t_stats
A numeric matrix, the z-statistics or t-statistics for each coefficient. Each row isfor a fitting to a group of the data.
p_values A numeric matrix, the p-values of z_stats. Each row is for a fitting to a groupof the data.
odds_ratios Only for logregr.madlib object. A numeric array, the odds ratios [6] for thefittings for all groups.
condition_no Only for logregr.madlib object. A numeric array, the condition number forall combinations of the grouping column values.
num_iterations An integer array, the itertion number used by each fitting group.
grp.cols An array of strings. The column names of the grouping columns.
has.intercept A logical, whether the intercept is included in the fitting.
ind.vars An array of strings, all the different terms used as independent variables in thefitting.
ind.str A string. The independent variables in an array format string.
call A language object. The function call that generates this result.
col.name An array of strings. The column names used in the fitting.
appear An array of strings, the same length as the number of independent variables. Thestrings are used to print a clean result, especially when we are dealing with thefactor variables, where the dummy variable names can be very long due to the in-serting of a random string to avoid naming conflicts, see as.factor,db.obj-methodfor details. The list also contains dummy and dummy.expr, which are also usedfor processing the categorical variables, but do not contain any important infor-mation.
model A db.data.frame object, which wraps the result table of this function.
terms A terms object, describing the terms in the model formula.
nobs The number of observations used to fit the model.
data A db.obj object, which wraps all the data used in the database. If there arefittings for multiple groups, then this is only the wrapper for the data in onegroup.
origin.data The original db.obj object. When there is no grouping, it is equal to dataabove, otherwise it is the "sum" of data from all groups.
Note that if there is grouping done, and there are multiple logregr.madlib objects in the finalresult, each one of them contains the same copy model.

madlib.glm 99
Note
See madlib.lm’s note for more about the formula format.
For logistic regression, the dependent variable MUST be a logical variable with values being TRUEor FALSE.
Author(s)
Author: Predictive Analytics Team at Pivotal Inc.
Maintainer: Frank McQuillan, Pivotal Inc. <[email protected]>
References
[1] Documentation of linear regression in lastest MADlib, http://doc.madlib.net/latest/group__grp__linreg.html
[2] Documentation of logistic regression in latest MADlib, http://doc.madlib.net/latest/group__grp__logreg.html
[3] Wikipedia: Iteratively reweighted least squares, http://en.wikipedia.org/wiki/IRLS
[4] Wikipedia: Conjugate gradient method, http://en.wikipedia.org/wiki/Conjugate_gradient_method
[5] Wikipedia: Stochastic gradient descent, http://en.wikipedia.org/wiki/Stochastic_gradient_descent
[6] Wikipedia: Odds ratio, http://en.wikipedia.org/wiki/Odds_ratio
[7] Documentation of generalized linear regression in latest MADlib, http://doc.madlib.net/latest/group__grp__glm.html
See Also
madlib.lm, madlib.summary, madlib.arima are MADlib wrapper functions.
as.factor creates categorical variables for fitiing.
delete safely deletes the result of this function.
Examples
## Not run:
## set up the database connection## Assume that .port is port number and .dbname is the database namecid <- db.connect(port = .port, dbname = .dbname, verbose = FALSE)
source_data <- as.db.data.frame(abalone, conn.id = cid, verbose = FALSE)
lk(source_data, 10)
## linear regression conditioned on nation value

100 madlib.glm
## i.e. groupingfit <- madlib.glm(rings ~ . -id | sex, data = source_data, heteroskedasticity = T)fit
## logistic regression
## logistic regression## The dependent variable must be a logical variable## Here it is y < 10.fit <- madlib.glm(rings < 10 ~ . - id - 1 , data = source_data, family = binomial)
fit <- madlib.glm(rings < 10 ~ sex + length + diameter,data = source_data, family = "logistic")
## 3rd example## The table has two columns: x is an array, y is double precisiondat <- source_datadat$arr <- db.array(source_data[,-c(1,2)])array.data <- as.db.data.frame(dat)
## Fit to y using every element of x## This does not work in R's lm, but works in madlib.lmfit <- madlib.glm(rings < 10 ~ arr, data = array.data, family = binomial)
fit <- madlib.glm(rings < 10 ~ arr - arr[1:2], data = array.data, family = binomial)
fit <- madlib.glm(rings < 10 ~ arr[1:7] + sex | id
fit <- madlib.glm(rings < 10 ~ arr - arr[8] + sex | id
## 4th example## Step-wise feature selectionstart <- madlib.glm(rings < 10 ~ . - id - sex, data = source_data, family = "binomial")## step(start)
## ------------------------------------------------------------## Examples for using GLM model
fit <- madlib.glm(rings < 10 ~ . - id - sex, data = source_data, family = binomial(probit),control = list(max.iter = 10))
fit <- madlib.glm(rings ~ . - id | sex, data = source_data, family = poisson(log),control = list(max.iter = 10))
fit <- madlib.glm(rings ~ . - id, data = source_data, family = Gamma(inverse),control = list(max.iter = 10))
db.disconnect(cid, verbose = FALSE)
## End(Not run)
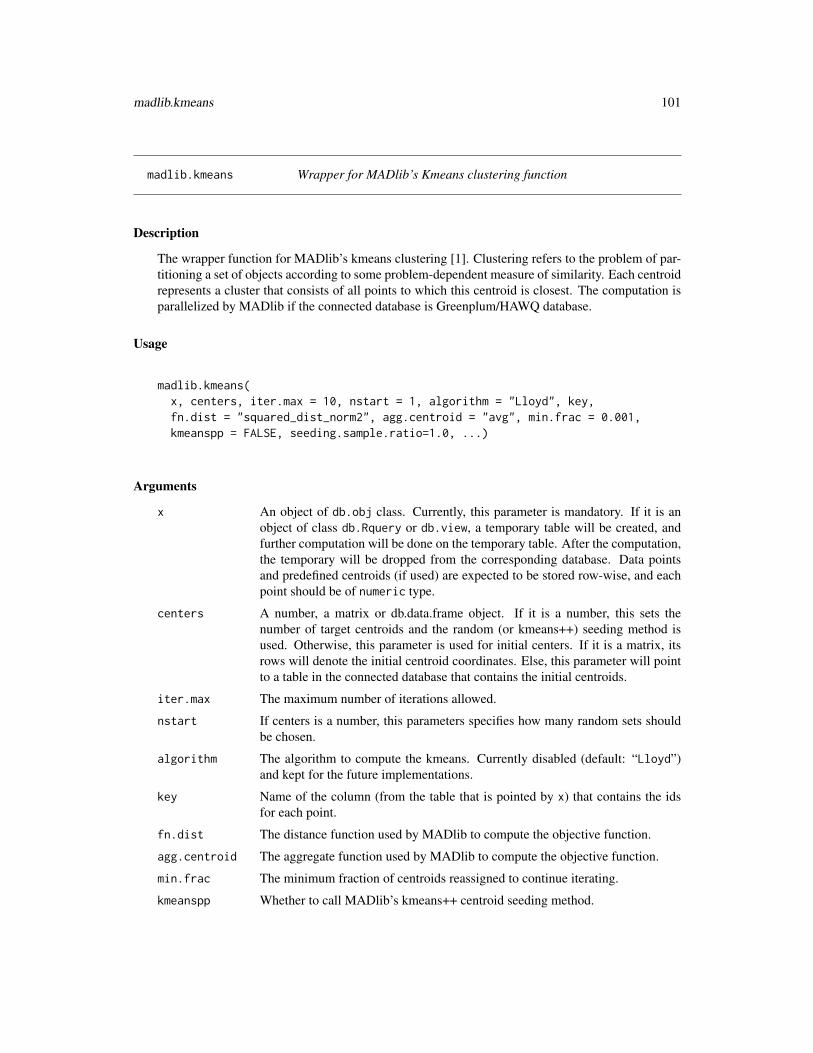
madlib.kmeans 101
madlib.kmeans Wrapper for MADlib’s Kmeans clustering function
Description
The wrapper function for MADlib’s kmeans clustering [1]. Clustering refers to the problem of par-titioning a set of objects according to some problem-dependent measure of similarity. Each centroidrepresents a cluster that consists of all points to which this centroid is closest. The computation isparallelized by MADlib if the connected database is Greenplum/HAWQ database.
Usage
madlib.kmeans(x, centers, iter.max = 10, nstart = 1, algorithm = "Lloyd", key,fn.dist = "squared_dist_norm2", agg.centroid = "avg", min.frac = 0.001,kmeanspp = FALSE, seeding.sample.ratio=1.0, ...)
Arguments
x An object of db.obj class. Currently, this parameter is mandatory. If it is anobject of class db.Rquery or db.view, a temporary table will be created, andfurther computation will be done on the temporary table. After the computation,the temporary will be dropped from the corresponding database. Data pointsand predefined centroids (if used) are expected to be stored row-wise, and eachpoint should be of numeric type.
centers A number, a matrix or db.data.frame object. If it is a number, this sets thenumber of target centroids and the random (or kmeans++) seeding method isused. Otherwise, this parameter is used for initial centers. If it is a matrix, itsrows will denote the initial centroid coordinates. Else, this parameter will pointto a table in the connected database that contains the initial centroids.
iter.max The maximum number of iterations allowed.
nstart If centers is a number, this parameters specifies how many random sets shouldbe chosen.
algorithm The algorithm to compute the kmeans. Currently disabled (default: “Lloyd”)and kept for the future implementations.
key Name of the column (from the table that is pointed by x) that contains the idsfor each point.
fn.dist The distance function used by MADlib to compute the objective function.
agg.centroid The aggregate function used by MADlib to compute the objective function.
min.frac The minimum fraction of centroids reassigned to continue iterating.
kmeanspp Whether to call MADlib’s kmeans++ centroid seeding method.

102 madlib.kmeans
seeding.sample.ratio
The proportion of subsample of original dataset to use for kmeans++ centroidseeding method.
... Further arguments passed to or from other methods. Currently, no more param-eters can be passed to madlib.kmeans.
Details
See madlib.kmeans for more details.
Value
For the return value of kmeans clustering see madlib.kmeans for details.
MADlib kmeans clustering output is similar to that of the kmeans output of the kmeans function ofR package stats. madlib.kmeans also returns an object of class "kmeans" which has a print anda fitted method.It is a list with at least the following components:
cluster A vector of integers (from 1:k) indicating the cluster to which each point isallocated.
centers A matrix of cluster centres.
withinss Vector of within-cluster sum of squares, one component per cluster.
tot.withinss Total within-cluster sum of squares, i.e. sum(withinss).
size The number of points in each cluster.
iter The number of (outer) iterations.
Author(s)
Author: Predictive Analytics Team at Pivotal Inc.
Maintainer: Frank McQuillan, Pivotal Inc. <[email protected]>
References
[1] Documentation of kmeans clustering in the latest MADlib release, http://madlib.incubator.apache.org/docs/latest/group__grp__kmeans.html
See Also
madlib.lm, madlib.summary, madlib.arima are MADlib wrapper functions.
Examples
## Not run:
## set up the database connection## Assume that .port is port number and .dbname is the database namecid <- db.connect(port = .port, dbname = .dbname, verbose = FALSE)

madlib.lda 103
dat <- db.data.frame("__madlib_km_sample__", conn.id = cid, verbose = FALSE)cent <- db.data.frame("__madlib_km_centroids__", conn.id = cid, verbose = FALSE)
seed.matrix <- matrix(c(14.23,1.71,2.43,15.6,127,2.8,3.06,0.28,2.29,5.64,1.04,3.92,1065,13.2,1.78,2.14,11.2,1,2.65,2.76,0.26,1.28,4.38,1.05,3.49,1050),
byrow=T, nrow=2)
fit <- madlib.kmeans(dat, 2, key= 'key')fit
## kmeans++ seeding methodfit <- madlib.kmeans(dat, 2, key= 'key', kmeanspp=TRUE)fit # display the result
## Initial centroid tablefit <- madlib.kmeans(dat, centers= cent, key= 'key')fit
## Initial centroid matrixfit <- madlib.kmeans(dat, centers= seed.matrix, key= 'key')fit
db.disconnect(cid)
## End(Not run)
madlib.lda Wrapper for MADlib’s Latent Dirichilet Allocation
Description
This function is a wrapper for MADlib’s Latent Dirichlet Allocation. The computation is paral-lelized by MADlib if the connected database is distributed. Please refer to MADlib documentationfor details of the algorithm implementation [1].
Usage
madlib.lda(data, topic_num, alpha, beta, iter_num = 20,nstart = 1, best = TRUE,...)
Arguments
data An object of db.obj class. This is the database table containing the documentson which the algorithm will train. The text of each document should be tok-enized into ’words’.
topic_num Number of topics.
alpha Dirichlet parameter for the per-doc topic multinomial.
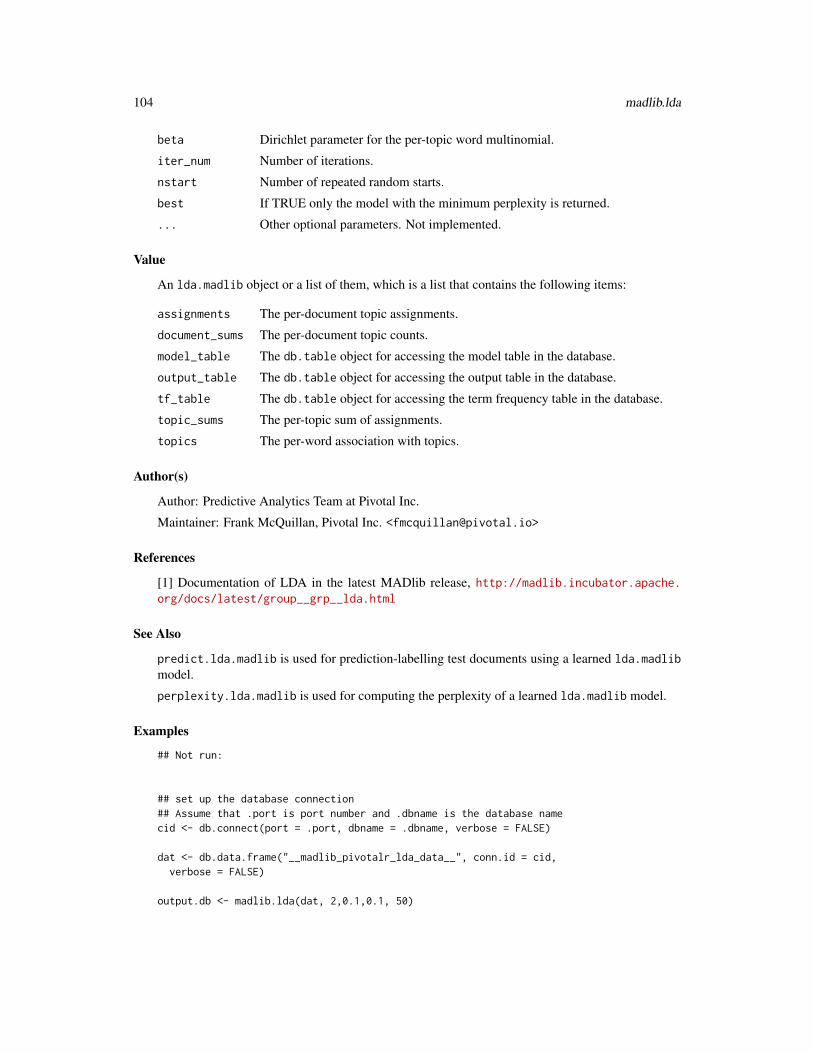
104 madlib.lda
beta Dirichlet parameter for the per-topic word multinomial.
iter_num Number of iterations.
nstart Number of repeated random starts.
best If TRUE only the model with the minimum perplexity is returned.
... Other optional parameters. Not implemented.
Value
An lda.madlib object or a list of them, which is a list that contains the following items:
assignments The per-document topic assignments.
document_sums The per-document topic counts.
model_table The db.table object for accessing the model table in the database.
output_table The db.table object for accessing the output table in the database.
tf_table The db.table object for accessing the term frequency table in the database.
topic_sums The per-topic sum of assignments.
topics The per-word association with topics.
Author(s)
Author: Predictive Analytics Team at Pivotal Inc.
Maintainer: Frank McQuillan, Pivotal Inc. <[email protected]>
References
[1] Documentation of LDA in the latest MADlib release, http://madlib.incubator.apache.org/docs/latest/group__grp__lda.html
See Also
predict.lda.madlib is used for prediction-labelling test documents using a learned lda.madlibmodel.
perplexity.lda.madlib is used for computing the perplexity of a learned lda.madlib model.
Examples
## Not run:
## set up the database connection## Assume that .port is port number and .dbname is the database namecid <- db.connect(port = .port, dbname = .dbname, verbose = FALSE)
dat <- db.data.frame("__madlib_pivotalr_lda_data__", conn.id = cid,verbose = FALSE)
output.db <- madlib.lda(dat, 2,0.1,0.1, 50)
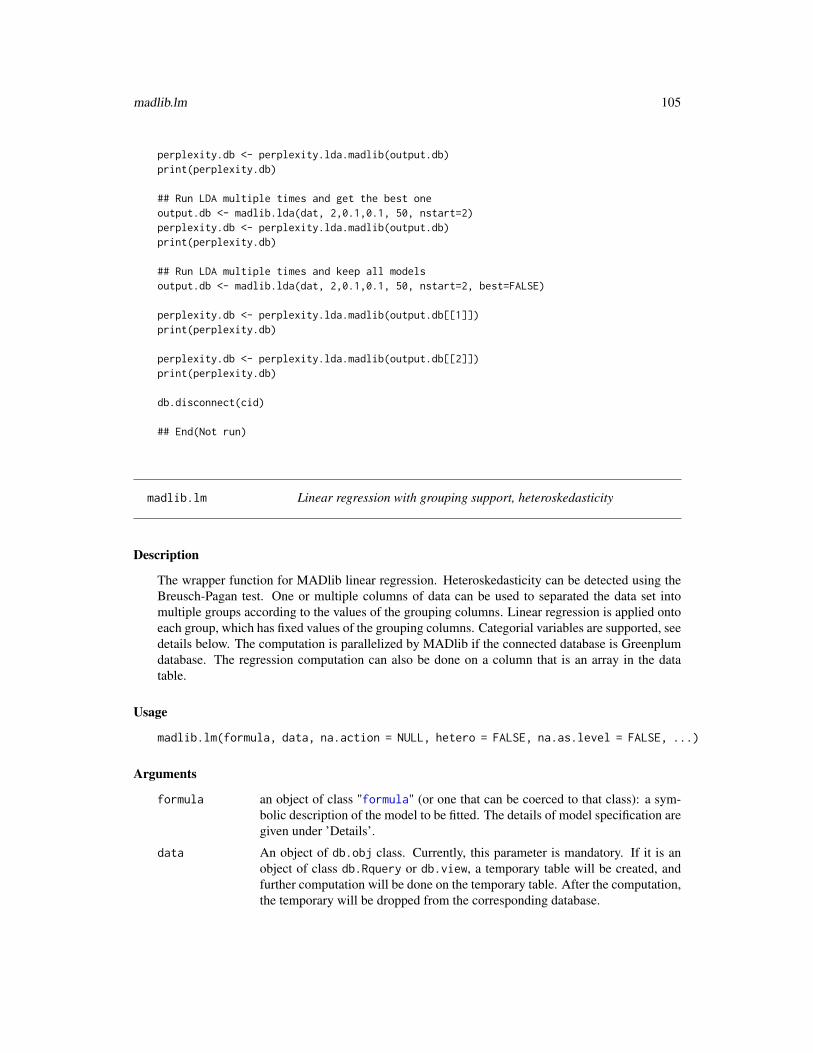
madlib.lm 105
perplexity.db <- perplexity.lda.madlib(output.db)print(perplexity.db)
## Run LDA multiple times and get the best oneoutput.db <- madlib.lda(dat, 2,0.1,0.1, 50, nstart=2)perplexity.db <- perplexity.lda.madlib(output.db)print(perplexity.db)
## Run LDA multiple times and keep all modelsoutput.db <- madlib.lda(dat, 2,0.1,0.1, 50, nstart=2, best=FALSE)
perplexity.db <- perplexity.lda.madlib(output.db[[1]])print(perplexity.db)
perplexity.db <- perplexity.lda.madlib(output.db[[2]])print(perplexity.db)
db.disconnect(cid)
## End(Not run)
madlib.lm Linear regression with grouping support, heteroskedasticity
Description
The wrapper function for MADlib linear regression. Heteroskedasticity can be detected using theBreusch-Pagan test. One or multiple columns of data can be used to separated the data set intomultiple groups according to the values of the grouping columns. Linear regression is applied ontoeach group, which has fixed values of the grouping columns. Categorial variables are supported, seedetails below. The computation is parallelized by MADlib if the connected database is Greenplumdatabase. The regression computation can also be done on a column that is an array in the datatable.
Usage
madlib.lm(formula, data, na.action = NULL, hetero = FALSE, na.as.level = FALSE, ...)
Arguments
formula an object of class "formula" (or one that can be coerced to that class): a sym-bolic description of the model to be fitted. The details of model specification aregiven under ’Details’.
data An object of db.obj class. Currently, this parameter is mandatory. If it is anobject of class db.Rquery or db.view, a temporary table will be created, andfurther computation will be done on the temporary table. After the computation,the temporary will be dropped from the corresponding database.

106 madlib.lm
na.action A string which indicates what should happen when the data contain NAs. Possi-ble values include na.omit, "na.exclude", "na.fail" and NULL. Right now,na.omit has been implemented. When the value is NULL, nothing is done on theR side and NA values are filtered on the MADlib side. User defined na.actionfunction is allowed.
hetero A logical value with default value FALSE. If it is TRUE, then Breusch-Pagan testis performed on the fitting model and the corresponding test statistic and p-valueare computed. See [1] for more details.
na.as.level A logical value, default is FALSE. Whether to treat NA value as a level in a cate-gorical variable or just ignore it.
... More parameters can be passed into this function. Currently, it is just a placeholder and any parameter here is not used.
Details
For details about how to write a formula, see formula for details. "|" can be used at the end of theformula to denote that the fitting is done conditioned on the values of one or more variables. Forexample, y ~ x + sin(z) | v + w will do the fitting each distinct combination of the values of vand w.
Both the linear regression (this function) and the logistic regression (madlib.glm) support cate-gorical variables. Use as.factor,db.obj-method to denote that a variable is categorical, and thecorresponding dummy variables are created and fitted. See as.factor,db.obj-method for more.
Value
If there is no grouping (i.e. no | in the formula), the result is a lm.madlib object. Otherwise, it is alm.madlib.grps object, which is just a list of lm.madlib objects.
A lm.madlib object is a list which contains the following items:
grouping column(s)
When there are grouping columns in the formula, the resulting list has multipleitems, each of which has the same name as one of the grouping columns. Allof these items are vectors, and they have the same length, which is equal to thenumber of distinct combinations of all the grouping column values. Each row ofthese items together is one distinct combination of the grouping values. Whenthere is no grouping column in the formula, none of such items will appear inthe resulting list.
coef A numeric matrix, the fitting coefficients. Each row contains the coefficients forthe linear regression of each group of data. So the number of rows is equal to thenumber of distinct combinations of all the grouping column values. The numberof columns is equal to the number features (including intercept if it presents inthe formula).
r2 A numeric array. R2 values for all combinations of the grouping column values.
std_err A numeric matrix, the standard error for each coefficients.
t_stats A numeric matrix, the t-statistics for each coefficient, which is the absolute valueof the ratio of std_err and coef.

madlib.lm 107
p_values A numeric matrix, the p-values of t_stats. Each row is for a fitting to a groupof the data.
condition_no A numeric array, the condition number for all combinations of the groupingcolumn values.
bp_stats A numeric array when hetero = TRUE, the Breusch-Pagan test statistics foreach combination of the grouping column values.
bp_p_value A numeric array when hetero = TRUE, the Breusch-Pagan test p value for eachcombination of the grouping column values.
grps An integer, the number of groups that the data is divided into according to thegrouping columns in the formula.
grp.cols An array of strings. The column names of the grouping columns.
has.intercept A logical, whether the intercept is included in the fitting.
ind.vars An array of strings, all the different terms used as independent variables in thefitting.
ind.str A string. The independent variables in an array format string.
call A language object. The function call that generates this result.
col.name An array of strings. The column names used in the fitting.
appear An array of strings, the same length as the number of independent variables. Thestrings are used to print a clean result, especially when we are dealing with thefactor variables, where the dummy variable names can be very long due to the in-serting of a random string to avoid naming conflicts, see as.factor,db.obj-methodfor details. The list also contains dummy and dummy.expr, which are also usedfor processing the categorical variables, but do not contain any important infor-mation.
model A db.data.frame object, which wraps the result table of this function.
terms A terms object, describing the terms in the model formula.
nobs The number of observations used to fit the model.
data A db.obj object, which wraps all the data used in the database. If there arefittings for multiple groups, then this is only the wrapper for the data in onegroup.
origin.data The original db.obj object. When there is no grouping, it is equal to dataabove, otherwise it is the "sum" of data from all groups.
Note that if there is grouping done, and there are multiple lm.madlib objects in the final result,each one of them contains the same copy model.
Note
| is not part of standard R formula object, but many R packages use | to add their own functionalitiesinto formula object. However, | has different meanings and usages in different packages. The usermust be careful that usage of | in PivotalR-package may not be the same as the others.

108 madlib.lm
Author(s)
Author: Predictive Analytics Team at Pivotal Inc.
Maintainer: Frank McQuillan, Pivotal Inc. <[email protected]>
References
[1] Wikipedia: Breusch-Pagan test, http://en.wikipedia.org/wiki/Breusch-Pagan_test [2]Documentation of linear regression in MADlib v0.6, http://doc.madlib.net/v0.6/group__grp__linreg.html.
See Also
madlib.glm, madlib.summary, madlib.arima are MADlib wrapper functions.
as.factor creates categorical variables for fitiing.
delete safely deletes the result of this function.
Examples
## Not run:
## set up the database connection## Assume that .port is port number and .dbname is the database namecid <- db.connect(port = .port, dbname = .dbname, verbose = FALSE)
x <- as.db.data.frame(abalone, conn.id = cid, verbose = FALSE)lk(x, 10)
## linear regression conditioned on nation value## i.e. groupingfit <- madlib.lm(rings ~ . - id | sex, data = x, heteroskedasticity = T)fit
## use I(.) for expressionsfit <- madlib.lm(rings ~ length + diameter + shell + I(diameter^2),data = x, heteroskedasticity = T)fit # display the result
## Another examplefit <- madlib.lm(rings ~ . - id | sex + (id < 2000), data = x)
## 3rd example## The table has two columns: x is an array, y is double precisiondat <- xdat$arr <- db.array(x[,-c(1,2)])array.data <- as.db.data.frame(dat)
## Fit to y using every element of x## This does not work in R's lm, but works in madlib.lmfit <- madlib.lm(rings ~ arr, data = array.data)

madlib.randomForest 109
fit <- madlib.lm(rings ~ arr - arr[1], data = array.data)
fit <- madlib.lm(rings ~ . - arr[1:2], data = array.data)
fit <- madlib.lm(as.integer(rings < 10) ~ . - arr[1:2], data = array.data)
## 4th example## Step-wise feature selectionstart <- madlib.lm(rings ~ . - id - sex, data = x)## step(start)
db.disconnect(cid)
## End(Not run)
madlib.randomForest MADlib wrapper function for Random Forest
Description
This function is a wrapper of MADlib’s random forest model training function. The resulting forestis stored in a table in the database, and one can also view the result from R using print.rf.madlib.
Usage
madlib.randomForest(formula, data, id = NULL, ntree = 100, mtry = NULL,importance = FALSE, nPerm = 1, na.action = NULL, control,na.as.level = FALSE, verbose = FALSE, ...)
Arguments
formula A formula object, intercept term will automatically be removed. Factors will notbe expanded to their dummy variables. Grouping syntax is also supported, seemadlib.lm and madlib.glm for more details.
data A db.obj object, which wraps the data in the database.
id A string, the index for each row. If key has been specified for data, the key willbe used as the ID unless this argument is also specified. We have to have thisspecified so that predict.rf.madlib’s result can be compared with the originaldata.
ntree An integer, maximum number of trees to grow in the random forest model, de-fault is 100.
mtry An integer, number of features randomly selected for each split.
importance A boolean, whether or not to calculate variable importance, default is FALSE.
nPerm An integer, number of times to permute each feature value while calculatingvariable importance, default is 1.

110 madlib.randomForest
na.action A function, which filters the NULL values from the data. Not implemented yet.
control A list, which includes parameters for the fit. Supported parameters include:’minsplit’ - minimum number of observations that must be present in a node fora split to be attempted. default is minsplit=20’minbucket’ - Minimum number of observations in any terminal node, default ismin_split/3’maxdepth’ - Maximum depth of any node, default is maxdepth=10’nbins’ - Number of bins to find possible node split threshold values for contin-uous variables, default is 100 (Must be greater than 1)’max_surrogates’ - Number of surrogate splits at each node in the trees con-structed.
na.as.level A boolean, indicating if NULL value for a categorical variable is treated as adistinct level, default is na.as.level=false
verbose A boolean, indicating whether or not to print more info, default is verbose=false
... Arguments to be passed to or from other methods.
Value
An S3 object of type rf.madlib in the case of non-grouping, and of type rf.madlib.grp in the case ofgrouping.
Author(s)
Author: Predictive Analytics Team at Pivotal Inc.
Maintainer: Frank McQuillan, Pivotal Inc. <[email protected]>
References
[1] Documentation of random forest in MADlib 1.7, http://doc.madlib.net/latest/
See Also
print.rf.madlib function to print summary of a model fitted through madlib.randomForest
predict.rf.madlib is a wrapper for MADlib’s predict function for random forests.
madlib.lm, madlib.glm, madlib.summary, madlib.arima, madlib.elnet, madlib.rpart are allMADlib wrapper functions.
Examples
## Not run:
## set up the database connection## Assume that .port is port number and .dbname is the database namecid <- db.connect(port = .port, dbname = .dbname, verbose = FALSE)
x <- as.db.data.frame(abalone, conn.id = cid, verbose = FALSE)

madlib.rpart 111
lk(x, 10)
## decision tree using abalone data, using default values of minsplit,## maxdepth etc.key(x) <- "id"fit <- madlib.randomForest(rings < 10 ~ length + diameter + height + whole + shell,
data=x)fit
## Another example, using groupingfit <- madlib.randomForest(rings < 10 ~ length + diameter + height + whole + shell | sex,
data=x)fit
db.disconnect(cid)
## End(Not run)
madlib.rpart MADlib wrapper function for Decision Tree
Description
This function is a wrapper of MADlib’s decision tree model training function. The resulting tree isstored in a table in the database, and one can also view the result from R using plot.dt.madlib,text.dt.madlib and print.dt.madlib.
Usage
madlib.rpart(formula, data, weights = NULL, id = NULL, na.action = NULL, parms,control, na.as.level = FALSE, verbose = FALSE, ...)
Arguments
formula A formula object, intercept term will automatically be removed. Factors will notbe expanded to their dummy variables. Grouping syntax is also supported, seemadlib.lm and madlib.glm for more details.
data A db.obj object, which wraps the data in the database.
weights A string, the column name for the weights.
id A string, the index for each row. If key has been specified for data, teh key willbe used as the ID unless this argument is also specified. We have to have thisspecified so that predict.dt.madlib’s result can be compared with the originaldata.
na.action A function, which filters the NULL values from the data. Not implemented yet.
parms A list, which includes parameters for the splitting function. Supported param-eters include: ’split’ specifying which split function to use. Options are ’gini’,’misclssification’ and ’entropy’ for classification, and ’mse’ for regression. De-fault is ’gini’ for classification and ’mse’ for regression.

112 madlib.rpart
control A list, which includes parameters for the fit. Supported parameters include:’minsplit’ - minimum number of observations that must be present in a node fora split to be attempted. default is minsplit=20’minbucket’ - Minimum number of observations in any terminal node, default ismin_split/3’maxdepth’ - Maximum depth of any node, default is maxdepth=10’nbins’ - Number of bins to find possible node split threshold values for contin-uous variables, default is 100 (Must be greater than 1)’cp’ - Cost complexity parameter, default is cp=0.01’n_folds’ - Number of cross-validation folds’max_surrogates’ - The number of surrogates number
na.as.level A boolean, indicating if NULL value for a categorical variable is treated as adistinct level, default is na.as.level=false
verbose A boolean, indicating whether or not to print more info, default is verbose=false
... Arguments to be passed to or from other methods.
Value
An S3 object of type dt.madlib in the case of non-grouping, and of type dt.madlib.grp in the case ofgrouping.
Author(s)
Author: Predictive Analytics Team at Pivotal Inc.
Maintainer: Frank McQuillan, Pivotal Inc. <[email protected]>
References
[1] Documentation of decision tree in MADlib 1.6, http://doc.madlib.net/latest/
See Also
plot.dt.madlib, text.dt.madlib, print.dt.madlib are visualization functions for a model fit-ted through madlib.rpart
predict.dt.madlib is a wrapper for MADlib’s predict function for decision trees.
madlib.lm, madlib.glm, madlib.summary, madlib.arima, madlib.elnet are all MADlib wrap-per functions.
Examples
## Not run:
## set up the database connection## Assume that .port is port number and .dbname is the database namecid <- db.connect(port = .port, dbname = .dbname, verbose = FALSE)

madlib.summary 113
x <- as.db.data.frame(abalone, conn.id = cid, verbose = FALSE)lk(x, 10)
## decision tree using abalone data, using default values of minsplit,## maxdepth etc.key(x) <- "id"fit <- madlib.rpart(rings < 10 ~ length + diameter + height + whole + shell,
data=x, parms = list(split='gini'), control = list(cp=0.005))fit
## Another example, using groupingfit <- madlib.rpart(rings < 10 ~ length + diameter + height + whole + shell | sex,
data=x, parms = list(split='gini'), control = list(cp=0.005))fit
db.disconnect(cid)
## End(Not run)
madlib.summary Data summary function
Description
‘summary’ is a generic function used to produce summary statistics of any data table. The functioninvokes particular methods’ from the MADlib library to provide an overview of the data. Thecomputation is parallelized by MADlib if the connected database is Greenplum database.
Usage
madlib.summary(x, target.cols = NULL, grouping.cols = NULL,get.distinct = TRUE, get.quartiles = TRUE,ntile = NULL, n.mfv = 10, estimate = TRUE,interactive = FALSE)
## S4 method for signature 'db.obj'summary(object, target.cols = NULL, grouping.cols = NULL,
get.distinct = TRUE, get.quartiles = TRUE,ntile = NULL, n.mfv = 10, estimate = TRUE,interactive = FALSE)
Arguments
x,object An object of db.obj class. Currently, this parameter is mandatory. If it is anobject of class db.Rquery or db.view, a temporary table will be created, andfurther computation will be done on the temporary table. After the computation,the temporary will be dropped from the corresponding database.
target.cols Vector of string. Default value is NULL. Column names in the table for whichthe summary is desired. When NULL all summary of all columns are returned.

114 madlib.summary
grouping.cols List of string. Default value is NULL. Column names in the table by which togroup the data. When NULL no grouping of data is performed.
get.distinct Logical. Default value is TRUE. Are distinct values required in the summary?
get.quartiles Logical. Default value is TRUE. Are quartile values required in the summary?
ntile Vector of floats. Default value is NULL. Vector of quantiles required as part ofthe summary.
n.mfv Integer. Default value is 10. How many ‘most-frequent-values’ (MFVs) to com-pute?
estimate Logical. Default value is TRUE. Should an estimated computation be usedto compute values for distincts and MFVs (as opposed to an exact but slowmethod)?
interactive Logical. Default is FALSE. If x is of type db.view, then extracting data fromit would actually compute the view, which might take a longer time, especiallyfor large data sets. When interactive is TRUE, this function will ask the userwhether to continue to extract data from the view.
Value
A data.frame object. Each column in the table (or target.cols) is a row in the result data frame.Each column of the data frame is described below:
group_by character. Group-by column names (NA if none provided)
group_by_value character. Values of the group-by columns (NA if no grouping)
target_column character. Targeted column values for which summary is requested
column_number integer. Physical column number for the target column in the database
data_type character. Data type of target column. Standard database descriptors will bedisplayed
row_count numeric. Number of rows for the target columndistinct_values
numeric. Number of distinct values in the target column
missing_values numeric. Number of missing values in the target column
blank_values numeric. Number of blank values (blanks are defined as values with only whites-pace)
fraction_missing
numeric. Percentage of total rows that are missing. Will be expressed as adecimal (e.g. 0.3)
fraction_blank numeric. Percentage of total rows that are blank. Will be expressed as a decimal(e.g. 0.3)
mean numeric. Mean value of target column (if target is numeric, else NA)
variance numeric. Variance of target columns (if target is numeric, else NA for strings)
min numeric. Min value of target column (for strings this is the length of the shorteststring)

madlib.summary 115
max numeric. Max value of target column (for strings this is the length of the longeststring)
first_quartile numeric. First quartile (25th percentile, valid only for numeric columns)
median numeric. Median value of target column (valid only for numeric columns)
third_quartile numeric. Third quartile (75th percentile, valid only for numeric columns)
quantile_array numeric. Percentile values corresponding to ntile_arraymost_frequent_values
character. Most frequent valuesmfv_frequencies
character. Frequency of the most frequent values
The data.frame has an extra attribute names "summary", which is a db.data.frame object andwraps the result table created by MADlib inside the database. One can access this object usingattr(res, "summary"), where res is the result of this function.
Author(s)
Author: Predictive Analytics Team at Pivotal Inc.
Maintainer: Frank McQuillan, Pivotal Inc. <[email protected]>
See Also
madlib.lm, madlib.glm, madlib.arima are MADlib wrapper functions.
delete safely deletes the result of this function.
Examples
## Not run:## get the help for a method## help("madlib.summary")
## set up the database connection## Assume that .port is port number and .dbname is the database namecid <- db.connect(port = .port, dbname = .dbname, verbose = FALSE)
delete("abalone", conn.id = cid)as.db.data.frame(abalone, "abalone", conn.id = cid, verbose = FALSE)x <- db.data.frame("abalone", conn.id = cid, verbose = FALSE)
lk(x, 10)
# madlib.summarysummary_result <- madlib.summary(x)print(summary_result)
# madlib.summarysummary_result <- madlib.summary(x, target.cols=c('rings', 'length', 'diameter'),
grouping.cols=c('sex'),

116 madlib.svm
get.distinct=FALSE,get.quartiles=TRUE,ntile=c(0.1, 0.6),n.mfv=5,estimate=TRUE,interactive=FALSE)
print(summary_result)
db.disconnect(cid, verbose = FALSE)
## End(Not run)
madlib.svm Support Vector Machine with regression and novelty detection
Description
This function wraps MADlib’s SVM for classification, regresssion and novelty detection.
Usage
madlib.svm (formula, data,na.action = NULL, na.as.level = FALSE,type = c("classification", "regression", "one-class"),kernel = c("gaussian", "linear", "polynomial"),degree = 3, gamma = NULL, coef0 = 1.0, class.weight = NULL,tolerance = 1e-10, epsilon = NULL, cross = 0, lambda = 0.01,control = list(), verbose = FALSE, ...)
Arguments
formula an object of class "formula" (or one that can be coerced to that class): a sym-bolic description of the model to be fitted. The details of model specification aregiven under ’Details’.
data An object of db.obj class. Currently, this parameter is mandatory. If it is anobject of class db.Rquery or db.view, a temporary table will be created, andfurther computation will be done on the temporary table. After the computation,the temporary will be dropped from the corresponding database.
na.action A string which indicates what should happen when the data contain NAs. Possi-ble values include na.omit, "na.exclude", "na.fail" and NULL. Right now,na.omit has been implemented. When the value is NULL, nothing is done on theR side and NA values are filtered on the MADlib side. User defined na.actionfunction is allowed.
na.as.level A logical value, default is FALSE. Whether to treat NA value as a level in a cate-gorical variable or just ignore it.

madlib.svm 117
type A string, default: "classification". Indicate type of analysis to perform: "classi-fication", "regression" or "one-class".
kernel A string, default: "gaussian". Type of kernel. Currently three kernel types aresupported: ’linear’, ’gaussian’, and ’polynomial’.
degree Default: 3. The parameter needed for polynomial kernel
gamma Default: 1/num_features. The parameter needed for gaussian kernel
coef0 Default: 1.0. The independent term in polynomial kernel
class.weight Default: 1.0. Set the weight for the positive and negative classes. If not given,all classes are set to have weight one. If class_weight = balanced, values of yare automatically adjusted as inversely proportional to class frequencies in theinput data i.e. the weights are set as n_samples / (n_classes * bincount(y)).Alternatively, class_weight can be a mapping, giving the weight for each class.Eg. For dependent variable values ’a’ and ’b’, the class_weight can be a: 2, b: 3.This would lead to each ’a’ tuple’s y value multiplied by 2 and each ’b’ y valuewill be multiplied by 3.For regression, the class weights are always one.
tolerance Default: 1e-10. The criterion to end iterations. The training stops whenever <thedifference between the training models of two consecutive iterations is <smallerthan tolerance or the iteration number is larger than max_iter.
epsilon Default: [0.01]. Determines the epsilon for epsilon-SVR. Ignored during clas-sification. When training the model, differences of less than epsilon betweenestimated labels and actual labels are ignored. A larger epsilon will yield amodel with fewer support vectors, but will not generalize as well to future data.Generally, it has been suggested that epsilon should increase with noisier data,and decrease with the number of samples. See [5].
cross Default: 0. Number of folds (k). Must be at least 2 to activate cross validation.If a value of k > 2 is specified, each fold is then used as a validation set once,while the other k - 1 folds form the training set.
lambda Default: [0.01]. Regularization parameter. Must be non-negative.
control A list, which contains the more control parameters for the optimizer.- init.stepsize: Default: [0.01]. Also known as the initial learning rate. Asmall value is usually desirable to ensure convergence, while a large value pro-vides more room for progress during training. Since the best value depends onthe condition number of the data, in practice one often searches in an exponentialgrid using built-in cross validation; e.g., "init_stepsize = [1, 0.1, 0.001]". To re-duce training time, it is common to run cross validation on a subsampled dataset,since this usually provides a good estimate of the condition number of the wholedataset. Then the resulting init_stepsize can be run on the whole dataset.- decay.factor: Default: [0.9]. Control the learning rate schedule: 0 meansconstant rate; <-1 means inverse scaling, i.e., stepsize = init_stepsize / iteration;> 0 means <exponential decay, i.e., stepsize = init_stepsize * decay_factor^iteration.- max.iter: Default: [100]. The maximum number of iterations allowed.- norm: Default: ’L2’. Name of the regularization, either ’L2’ or ’L1’.- eps.table: Default: NULL. Name of the input table that contains values ofepsilon for different groups. Ignored when grouping_col is NULL. Define this
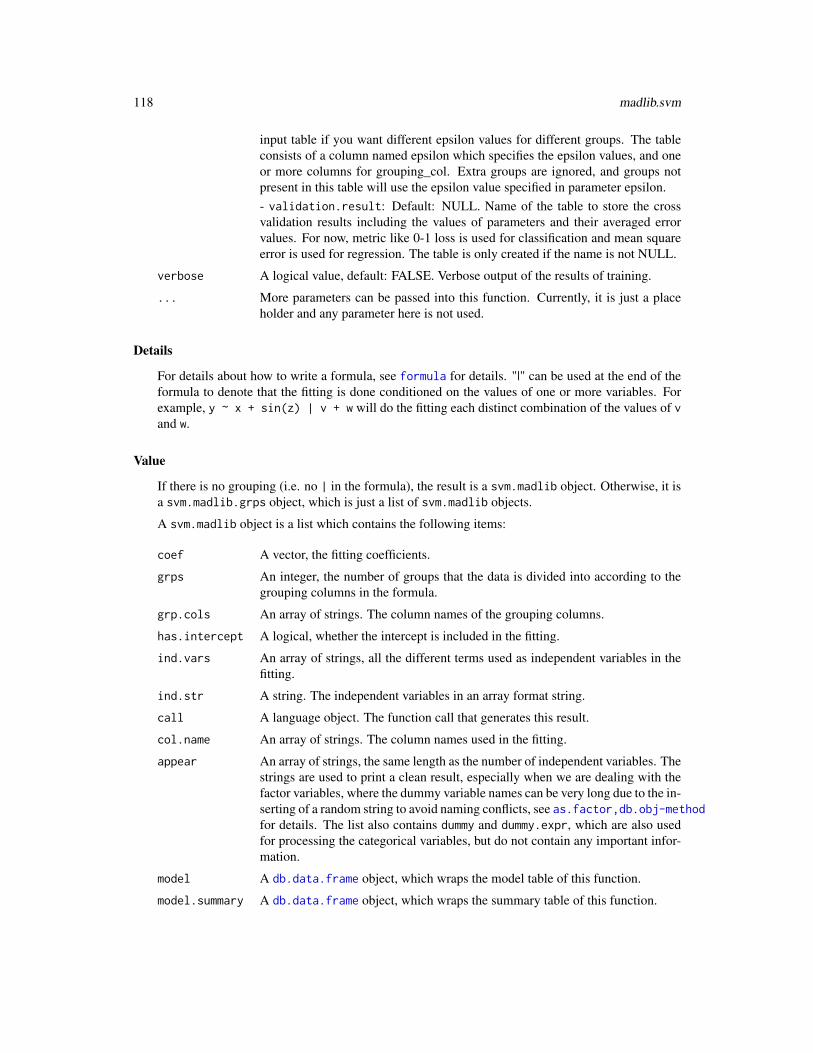
118 madlib.svm
input table if you want different epsilon values for different groups. The tableconsists of a column named epsilon which specifies the epsilon values, and oneor more columns for grouping_col. Extra groups are ignored, and groups notpresent in this table will use the epsilon value specified in parameter epsilon.- validation.result: Default: NULL. Name of the table to store the crossvalidation results including the values of parameters and their averaged errorvalues. For now, metric like 0-1 loss is used for classification and mean squareerror is used for regression. The table is only created if the name is not NULL.
verbose A logical value, default: FALSE. Verbose output of the results of training.
... More parameters can be passed into this function. Currently, it is just a placeholder and any parameter here is not used.
Details
For details about how to write a formula, see formula for details. "|" can be used at the end of theformula to denote that the fitting is done conditioned on the values of one or more variables. Forexample, y ~ x + sin(z) | v + w will do the fitting each distinct combination of the values of vand w.
Value
If there is no grouping (i.e. no | in the formula), the result is a svm.madlib object. Otherwise, it isa svm.madlib.grps object, which is just a list of svm.madlib objects.
A svm.madlib object is a list which contains the following items:
coef A vector, the fitting coefficients.
grps An integer, the number of groups that the data is divided into according to thegrouping columns in the formula.
grp.cols An array of strings. The column names of the grouping columns.
has.intercept A logical, whether the intercept is included in the fitting.
ind.vars An array of strings, all the different terms used as independent variables in thefitting.
ind.str A string. The independent variables in an array format string.
call A language object. The function call that generates this result.
col.name An array of strings. The column names used in the fitting.
appear An array of strings, the same length as the number of independent variables. Thestrings are used to print a clean result, especially when we are dealing with thefactor variables, where the dummy variable names can be very long due to the in-serting of a random string to avoid naming conflicts, see as.factor,db.obj-methodfor details. The list also contains dummy and dummy.expr, which are also usedfor processing the categorical variables, but do not contain any important infor-mation.
model A db.data.frame object, which wraps the model table of this function.
model.summary A db.data.frame object, which wraps the summary table of this function.
madlib.svm 119
model.random A db.data.frame object, which wraps the kernel table of this function. Onlycreated when non-linear kernel is used.
terms A terms object, describing the terms in the model formula.
nobs The number of observations used to fit the model.
data A db.obj object, which wraps all the data used in the database. If there arefittings for multiple groups, then this is only the wrapper for the data in onegroup.
origin.data The original db.obj object. When there is no grouping, it is equal to dataabove, otherwise it is the "sum" of data from all groups.
Note that if there is grouping done, and there are multiple svm.madlib objects in the final result,each one of them contains the same copy model.
Note
| is not part of standard R formula object, but many R packages use | to add their own functionalitiesinto formula object. However, | has different meanings and usages in different packages. The usermust be careful that usage of | in PivotalR-package may not be the same as the others.
Author(s)
Author: Predictive Analytics Team at Pivotal Inc.
Maintainer: Frank McQuillan, Pivotal Inc. <[email protected]>
See Also
madlib.lm, madlib.summary, madlib.arima are MADlib wrapper functions.
as.factor creates categorical variables for fitting.
delete safely deletes the result of this function.
Examples
## Not run:
## set up the database connection## Assume that .port is port number and .dbname is the database namecid <- db.connect(port = .port, dbname = .dbname, verbose = FALSE)
data <- as.db.data.frame(abalone, conn.id = cid, verbose = FALSE)lk(data, 10)
## svm regression## i.e. grouping on multiple columnsfit <- madlib.svm(length ~ height + shell | sex + (rings > 7), data = data, type = "regression")fit
## use I(.) for expressionsfit <- madlib.svm(rings > 7 ~ height + shell + diameter + I(diameter^2),

120 margins
data = data, type = "classification")fit # display the result
## Adding new column for trainingdat <- datadat$arr <- db.array(data[,-c(1,2)])array.data <- as.db.data.frame(dat)fit <- madlib.svm(rings > 7 ~ arr, data = array.data)
db.disconnect(cid)
## End(Not run)
margins Compute the marginal effects of regression models
Description
margins calculates the marginal effects of the variables given the result of regressions (madlib.lm,madlib.glm etc). Vars lists all the variables used in the regression model. Terms lists the specifiedterms in the original model. Vars and Terms are only used in margins’s dydx option.
Usage
## S3 method for class 'lm.madlib'margins(model, dydx = ~Vars(model), newdata =model$data, at.mean = FALSE, factor.continuous = FALSE, na.action =NULL, ...)
## S3 method for class 'lm.madlib.grps'margins(model, dydx = ~Vars(model), newdata =lapply(model, function(x) x$data), at.mean = FALSE, factor.continuous =FALSE, na.action = NULL, ...)
## S3 method for class 'logregr.madlib'margins(model, dydx = ~Vars(model), newdata =model$data, at.mean = FALSE, factor.continuous = FALSE, na.action =NULL, ...)
## S3 method for class 'logregr.madlib.grps'margins(model, dydx = ~Vars(model),newdata = lapply(model, function(x) x$data), at.mean = FALSE,factor.continuous = FALSE, na.action = NULL, ...)
## S3 method for class 'margins'print(x, digits = max(3L, getOption("digits") - 3L),...)
margins 121
Vars(model)
Terms(term = NULL)
Arguments
model The result of madlib.lm, madlib.glm, which represents a regression model forthe training data.
dydx A formula, and the default is ~ Vars(model), which tells the function to com-pute the marginal effects for all the variables that appear in the model. ~ .will compute the marginal effects of all variables in newdata. Use the normalformula to specify which variables’ marginal effects are to be computed.
newdata A db.obj object, which represents the data in the database. The default is thedata used to train the regression model, but the user can freely use other datasets.
at.mean A logical, the default is FALSE. Whether to compute the marginal effects at themean values of the variables.
factor.continuous
A logical, the default is FALSE. Whether to compute the marginal effects offactors by treating them as continuous variables. See "details" for more expla-nation.
na.action A string which indicates what should happen when the data contain NAs. Possi-ble values include na.omit, "na.exclude", "na.fail" and NULL. Right now,na.omit,db.obj-method has been implemented. When the value is NULL, noth-ing is done on the R side and NA values are filtered out and omitted on theMADlib side. User defined na.action function is allowed, and see na.omit,db.obj-methodfor the preferred function interface.
... Other arguments, not implemented.
x The result of margins function, which is of the class "margins".
digits A non-null value for ‘digits’ specifies the minimum number of significant digitsto be printed in values. The default, ‘NULL’, uses ‘getOption("digits")’. (Forthe interpretation for complex numbers see signif.) Non-integer values will berounded down, and only values greater than or equal to 1 and no greater than 22are accepted.
term A vector of integers, the default is NULL. When term=i, compute the marginaleffects of the i-th term. Even if this term contains multiple variables, we treat itas a variable independent of all others. When term=NULL, the marginal effects ofall terms are calculated. In the final result, margianl effect results for ".term.1",".term.2" etc will be shown. By comparing with names(model$coef), onecan easily figure out which term corresponds to which expression. (Intercept)term’s marginal effect cannot be computed using this (One can create an extracolumn that equals 1 and use it as a variable without using intercept by add -1into the fitting formula).

122 margins
Details
For a continuous variable, its marginal effects is just the first derivative of the response functionwith respect to the variable. For a categorical variable, it is usually more meaningful to computethe finite difference of the response function for the variable being 1 and 0. The finite differencemarginal effect measures how much more the response function would be compared with the refer-ence category. The reference category for a categorical variable can be changed by relevel.
Value
margins function returns a margins object, which is a data.frame. It contains the following item:
Estimate The marginal effect values for all variable that have been specified in dydx.
Std. Error The standard errors for the marginal effects.t value, z value
The t statistics (for linear regression) or z statistics (for logistic regression).Pr(>|t|), Pr(>|z|)
The corresponding p values.
Vars returns a vector of strings, which are the variable names that have been used in the regressionmodel.
Author(s)
Author: Predictive Analytics Team at Pivotal Inc.
Maintainer: Frank McQuillan, Pivotal Inc. <[email protected]>
References
[1] Stata 13 help for margins, http://www.stata.com/help.cgi?margins
See Also
relevel changes the reference category.
madlib.lm, madlib.glm compute linear and logistic regressions.
Examples
## Not run:
## set up the database connection## Assume that .port is port number and .dbname is the database namecid <- db.connect(port = .port, dbname = .dbname)
## create a data table in database and the R wrapperdelete("abalone", conn.id = cid)dat <- as.db.data.frame(abalone, "abalone", conn.id = cid)
fit <- madlib.lm(rings ~ length + diameter*sex, data = dat)
merge-method 123
margins(fit)margins(fit, at.mean = TRUE)margins(fit, factor.continuous = TRUE)margins(fit, dydx = ~ Vars(model) + Terms())
fit <- madlib.glm(rings < 10 ~ length + diameter*sex, data = dat, family = "logistic")margins(fit, ~ length + sex)margins(fit, ~ length + sex.M, at.mean = TRUE)margins(fit, ~ length + sex.I, factor.continuous = TRUE)margins(fit, ~ Vars(model) + Terms())
## create a data table that has two columns## one of them is an array columndat1 <- cbind(db.array(dat[,-c(1,2,10)]), dat[,10])names(dat1) <- c("x", "y")delete("abalone_array", conn.id = cid)dat1 <- as.db.data.frame(dat1, "abalone_array")
fit <- madlib.glm(y < 10 ~ x[-1], data = dat1, family = "logistic")margins(fit, ~ x[2:5])
db.disconnect(cid, verbose = FALSE)
## End(Not run)
merge-method Computing a join on two tables
Description
This method is equivalent to a database join on two tables, and the merge can be by commoncolumn or row names. It supports the equivalent of inner, left-outer, right-outer, and full-outer joinoperations. This method is similar to merge.data.frame.
Usage
## S4 method for signature 'db.obj,db.obj'merge(x, y, by = intersect(names(x), names(y)),by.x = by, by.y = by, all = FALSE, all.x = all, all.y = all,key = [email protected], suffixes = c("_x","_y"), ...)
Arguments
x,y The signature of the method. Both argument are db.obj objects, and their asso-ciated tables will be merged.
by,by.x,by.y specifications of the columns used for merging. See ’Details’.
all logical; all = L is shorthand for all.x = L and all.y = L, where L is eitherTRUE or FALSE.

124 merge-method
all.x logical; if TRUE, then extra rows will be added to the output, one for each row inx that has no matching row in y. These rows will have NAs in those columns thatare usually filled with values from y. The default is FALSE, so that only rowswith data from both x and y are included in the output.
all.y logical; analogous to all.x.
key specifies the primary key of the newly created table.
suffixes a character vector of length 2 specifying the suffixes to be used for makingunique the names of columns in the result which not used for merging (appearingin by etc).
... arguments to be passed to or from methods.
Details
See merge.data.frame. Note that merge.data.frame supports an incomparables argument, whichis not yet supported here.
Value
A db.Rquery object, which expresses the join operation.
Author(s)
Author: Predictive Analytics Team at Pivotal Inc.
Maintainer: Frank McQuillan, Pivotal Inc. <[email protected]>
See Also
merge.data.frame a merge operation for two data frames.
Examples
## Not run:
## set up the database connection## Assume that .port is port number and .dbname is the database namecid <- db.connect(port = .port, dbname = .dbname, verbose = FALSE)
## create sample databasesauthors <- data.frame(
surname = I(c("Tukey", "Venables", "Tierney", "Ripley", "McNeil")),nationality = c("US", "Australia", "US", "UK", "Australia"),deceased = c("yes", rep("no", 4)))
books <- data.frame(name = I(c("Tukey", "Venables", "Tierney",
"Ripley", "Ripley", "McNeil", "R Core")),title = c("Exploratory Data Analysis",
"Modern Applied Statistics ...","LISP-STAT",

na.action 125
"Spatial Statistics", "Stochastic Simulation","Interactive Data Analysis","An Introduction to R"),
other.author = c(NA, "Ripley", NA, NA, NA, NA,"Venables & Smith"))
delete("books", conn.id = cid)delete("authors", conn.id = cid)as.db.data.frame(books, 'books', conn.id = cid, verbose = FALSE)as.db.data.frame(authors, 'authors', conn.id = cid, verbose = FALSE)
## Cast them as db.data.frame objectsa <- db.data.frame('authors', conn.id = cid, verbose = FALSE)b <- db.data.frame('books', conn.id = cid, verbose = FALSE)
## Merge them togetherm1 <- merge(a, b, by.x = "surname", by.y = "name", all = TRUE)
db.disconnect(cid, verbose = FALSE)
## End(Not run)
na.action Functions for filtering NA values in data
Description
’na.omit’ returns the object with incomplete cases removed.
Usage
## S4 method for signature 'db.obj'na.omit(object, vars = NULL, ...)
Arguments
object A db.obj object, which wraps a data table in the connected database (db.data.frame),or some operations on a data table (db.Rquery).
vars An array of strings, default is NULL. The names of the columns that the userwants to filter NA values. If it is NULL, all rows that contains NULL in any columnwill be filtered out.
... Further arguments, not implemented yet.
Value
A db.Rquery object, which wraps the operation that filters the NA values from the columns vars inobject.

126 names-methods
Author(s)
Author: Predictive Analytics Team at Pivotal Inc.
Maintainer: Frank McQuillan, Pivotal Inc. <[email protected]>
See Also
madlib.lm, madlib.glm for linear and logistic regressions.
Examples
## Not run:
## set up the database connection## Assume that .port is port number and .dbname is the database namecid <- db.connect(port = .port, dbname = .dbname, verbose = FALSE)
delete("abalone", conn.id = cid)dat <- as.db.data.frame(abalone, "abalone", conn.id = cid, verbose = FALSE)
madlib.lm(rings ~ . - sex - id, data = dat, na.action = na.omit)
db.disconnect(cid, verbose = FALSE)
## End(Not run)
names-methods The Names of an object
Description
This function gives the names of a db.obj, which are the column names of a db.table or db.view.The names are returned as a list
Usage
## S4 method for signature 'db.obj'names(x)## S4 replacement method for signature 'db.obj'names(x) <- value
Arguments
x A db.obj. The input data frame for which the column names are required.
value An array of strings. New names to replace the names of x.

null.data 127
Value
Returns a string with the list of the column names of data frame. The names are ordered.
Author(s)
Author: Predictive Analytics Team at Pivotal Inc.
Maintainer: Frank McQuillan, Pivotal Inc. <[email protected]>
See Also
db.obj, db.data.frame, db.table, db.view, db.Rquery are the class hierarchy structure of thispackage.
Examples
## Not run:
## set up the database connection## Assume that .port is port number and .dbname is the database namecid <- db.connect(port = .port, dbname = .dbname, verbose = FALSE)
## create a table from the example data.frame "abalone"delete("abalone", conn.id = cid)x <- as.db.data.frame(abalone, "abalone", conn.id = cid, verbose = FALSE)## preview of a tablelk(x, nrows = 10) # extract 10 rows of data
## get names of all columnsnames(x)
db.disconnect(cid, verbose = FALSE)
## End(Not run)
null.data A Data Set with lots of NA values
Description
An example data.frame which is used by examples in this user manual
Usage
data(null.data)
Format
This data has 104 columns and 2000 rows.

128 null.data
Details
This data set has lots of NA values in it. By using as.db.data.frame, one can put the data set intothe connected database. All the NA values will be converted into NULL values.
The MADlib wrapper functions like madlib.lm and link{madlib.glm} will throw an error if thereare NULL values in the data. So one needs to clean up the data before using the regression functionssupplied by MADlib.
Note
Lazy data loading is enabled in this package. So the user does not need to explicitly run data(null.data)to load the data. It will be loaded whenever it is used.
Examples
## Not run:
## set up the database connection## Assume that .port is port number and .dbname is the database namecid <- db.connect(port = .port, dbname = .dbname, verbose = FALSE)
## create a table from the example data.frame "abalone"delete("null_data", conn.id = cid)x <- as.db.data.frame(null.data, "null_data", conn.id = cid, verbose = FALSE)
## ERROR, because of NULL valuesfit <- madlib.lm(sf_mrtg_pct_assets ~ ris_asset + lncrcd + lnauto +
lnconoth + lnconrp + intmsrfv + lnrenr1a + lnrenr2a +lnrenr3a, data = x)
## select columnsy <- x[,c("sf_mrtg_pct_assets","ris_asset", "lncrcd","lnauto",
"lnconoth","lnconrp","intmsrfv","lnrenr1a","lnrenr2a","lnrenr3a")]
dim(y)
## remove NULL valuesfor (i in 1:10) y <- y[!is.na(y[i]),]
dim(y)
fit <- madlib.lm(sf_mrtg_pct_assets ~ ., data = y)
fit
db.disconnect(cid, verbose = FALSE)
## End(Not run)

perplexity.lda 129
perplexity.lda Perplexity of LDA predictions
Description
Perplexity is a measurement of how well a probability distribution or probability model predicts asample. This functions computes the perplexity of the prediction by linlk{predict.madlib.lda}
Usage
## S3 method for class 'lda.madlib'perplexity(object, predict_output_table, ...)
Arguments
object The result of madlib.lda.
predict_output_table
The result of predict on the madlib.lda object.
... Arguments passed to or from other methods, not implemented yet.
Value
A numeric value that indicates the perplexity of the LDA prediction.
Author(s)
Author: Predictive Analytics Team at Pivotal Inc.
Maintainer: Frank McQuillan, Pivotal Inc. <[email protected]>
See Also
madlib.lda builds a topic model using a set of documents.
Examples
## Not run:## Please see the examples in madlib.lda doc.
## End(Not run)

130 plot.dt.madlib
plot.dt.madlib Plot the result of madlib.rpart
Description
This is a visualization function which plots the result of madlib.rpart. This function internallycalls R’s plot.rpart function.
Usage
## S3 method for class 'dt.madlib'plot(x, uniform = FALSE, branch = 1, compress = FALSE,
nspace, margin = 0, minbranch = 0.3, ...)
Arguments
x The fitted tree from the result of madlib.rpart
uniform A boolean, if TRUE, uses uniform vertical spacing of the nodes.
branch A double value, between 0 and 1, to control the shape of the branches fromparent to child.
compress A boolean, if FALSE, the leaf nodes will be at the horizontal plot coordinate of1:nleaves. Use TRUE for a more compact arrangement.
nspace A double value, indicating the amount of extra space between a node with chil-dren and a leaf. default is branch
margin A double value, indicating the amount of extra space to leave around the bordersof the tree.
minbranch A double value, specifying the minimum length for a branch.
... Arguments to be passed to or from other methods.
Value
The coordinates of the nodes are returned as a list, with components x and y.
Author(s)
Author: Predictive Analytics Team at Pivotal Inc.
Maintainer: Frank McQuillan, Pivotal Inc. <[email protected]>
References
[1] Documentation of decision tree in MADlib 1.6, http://doc.madlib.net/latest/

predict 131
See Also
madlib.rpart is the wrapper for MADlib’s tree_train function for decision trees. text.dt.madlib,print.dt.madlib are other visualization functions.
madlib.lm, madlib.glm, madlib.rpart, madlib.summary, madlib.arima, madlib.elnet are allMADlib wrapper functions.
Examples
## Not run:
## set up the database connection## Assume that .port is port number and .dbname is the database namecid <- db.connect(port = .port, dbname = .dbname, verbose = FALSE)
x <- as.db.data.frame(abalone, conn.id = cid, verbose = FALSE)lk(x, 10)
## decision tree using abalone data, using default values of minsplit,## maxdepth etc.key(x)<-"id"fit <- madlib.rpart(rings < 10 ~ length + diameter + height + whole + shell,
data=x, parms = list(split='gini'), control = list(cp=0.005))fit
plot(fit, uniform =TRUE)text(fit)
db.disconnect(cid)
## End(Not run)
predict Generate the db.Rquery object that can calculate the predictions
Description
Generate the db.Rquery object that can calculate the predictions for linear/logistic regressions. Theactual result can be viewed using lk.
Usage
## S3 method for class 'lm.madlib'predict(object, newdata, ...)
## S3 method for class 'lm.madlib.grps'predict(object, newdata, ...)

132 predict
## S3 method for class 'logregr.madlib'predict(object, newdata, type = c("response",
"prob"), ...)
## S3 method for class 'logregr.madlib.grps'predict(object, newdata, type= c("response", "prob"), ...)
## S3 method for class 'glm.madlib'predict(object, newdata, type = c("response",
"prob"), ...)
## S3 method for class 'glm.madlib.grps'predict(object, newdata, type = c("response",
"prob"), ...)
Arguments
object The result of madlib.lm and madlib.glm.
newdata A db.obj object, which contains the information about the real data in thedatabase.
type A string, default is "response". It produces the predicted results for the newdata.The alternative value is "prob", which is only used for binomial{logit} tocompute the probabilities.A string, default is "response", which produces the TRUE or FALSE prediction.If it is "prob", this function computes the probabilities for TRUE cases.
... Extra parameters. Not implemented yet.
Value
A db.Rquery object, which contains the SQL query to compute the predictions.
Author(s)
Author: Predictive Analytics Team at Pivotal Inc.
Maintainer: Frank McQuillan, Pivotal Inc. <[email protected]>
See Also
madlib.lm linear regression
madlib.glm logistic regression
lk view the actual result
groups.lm.madlib, groups.lm.madlib.grps, groups.logregr.madlib, groups.logregr.madlib.grpsextract grouping column information from the fitted model(s).

predict 133
Examples
## Not run:
## set up the database connection## Assume that .port is port number and .dbname is the database namecid <- db.connect(port = .port, dbname = .dbname, verbose = FALSE)
## create db.table object pointing to a data tabledelete("abalone", conn.id = cid)x <- as.db.data.frame(abalone, "abalone", conn.id = cid, verbose = FALSE)
## Example 1 --------
fit <- madlib.lm(rings ~ . - sex - id, data = x)
fit
pred <- predict(fit, x) # prediction
content(pred)
ans <- x$rings # the actual value
lk((ans - pred)^2, 10) # squared error
lk(mean((ans - pred)^2)) # mean squared error
## Example 2 ---------
y <- xy$sex <- as.factor(y$sex)fit <- madlib.lm(rings ~ . - id, data = y)
lk(mean((y$rings - predict(fit, y))^2))
## Example 3 ---------
fit <- madlib.lm(rings ~ . - id | sex, data = x)
fit
pred <- predict(fit, x)
content(pred)
ans <- x$rings
lk(mean((ans - pred)^2))

134 predict.arima
## predictions for one group of data where sex = Iidx <- which(groups(fit)[["sex"]] == "I") # which sub-modelpred1 <- predict(fit[[idx]], x[x$sex == "I",]) # predict on part of data
## Example 3 --------
## plot the predicted values v.s. the true valuesap <- ans # true valuesap$pred <- pred # add a column which is the predicted values
## If the data set is very big, you do not want to load all the## data points into R and plot. We can just plot a random sample.random.sample <- lk(sort(ap, FALSE, NULL), 1000) # sort randomly
plot(random.sample)
## ------------------------------------------------------------## GLM prediction
fit <- madlib.glm(rings ~ . - id | sex, data = x, family = poisson(log),control = list(max.iter = 20))
p <- predict(f)
lk(p, 10)
db.disconnect(cid, verbose = FALSE)
## End(Not run)
predict.arima Forecast from MADlib’s ARIMA fits
Description
Forecast from models fit by linlk{madlib.arima}
Usage
## S3 method for class 'arima.css.madlib'predict(object, n.ahead = 1, ...)
Arguments
object The result of madlib.arima.
n.ahead The number of steps ahead for which prediction is required.
... Arguments passed to or from other methods, not implemented yet.

predict.bagging.model 135
Value
A db.table object, which points to a table that contains the forecasted values. The table has twocolumns: steps_ahead and forecast_value. One can use the function lk to look at the values.
Author(s)
Author: Predictive Analytics Team at Pivotal Inc.
Maintainer: Frank McQuillan, Pivotal Inc. <[email protected]>
See Also
madlib.arima fits ARIMA model to a time series.
Examples
## Not run:## Please see the examples in madlib.arima doc.
## End(Not run)
predict.bagging.model Make predictions using the result of generic.bagging
Description
Make predictions using boostrap aggregating models
Usage
## S3 method for class 'bagging.model'predict(object, newdata, combine = "mean", ...)
Arguments
object A bagging.model, which is the result of generic.bagging.
newdata A db.obj object, which wraps the data in the database.
combine A string, default is "mean". The other choice is "vote". How to summarizethe predictions of the multiple models in the fitting result of generic.bagging."mean" will produce the average of the predictions, while "vote" will select theprediction with the most votes.
... Extra parameters. Not implemented yet.
Value
A db.Rquery object, which contains the SQL query to compute the prediction. One can use thefunction lk to look at the values.

136 predict.dt.madlib
Author(s)
Author: Predictive Analytics Team at Pivotal Inc.
Maintainer: Frank McQuillan, Pivotal Inc. <[email protected]>
See Also
generic.bagging generates the models of boostrap aggregating.
predict.lm.madlib and predict.logregr.madlib produce predictions for linear and logisticmodels.
Examples
## Not run:
## set up the database connection## Assume that .port is port number and .dbname is the database namecid <- db.connect(port = .port, dbname = .dbname, verbose = FALSE)
y <- as.db.data.frame(abalone, conn.id = cid, verbose = FALSE)
fit <- generic.bagging(function(data) {madlib.lm(rings ~ . - id - sex, data = data)
}, data = y, nbags = 25, fraction = 0.7)
pred <- predict(fit, newdata = y) # make prediction
lookat(mean((y$rings - pred)^2)) # mean squared error
db.disconnect(cid, verbose = FALSE)
## End(Not run)
predict.dt.madlib Compute the predictions of the model produced by madlib.rpart
Description
This is actually a wrapper for MADlib’s predict function of decision tree. It accepts the result ofmadlib.rpart, which is a representation of decision tree, and compute the predictions for new datasets.
Usage
## S3 method for class 'dt.madlib'predict(object, newdata, type = c("response", "prob"),
...)

predict.dt.madlib 137
Arguments
object A dt.madlib object, which is the result of madlib.rpart.
newdata A db.obj object, which contains the data used for prediction. If it is not given,then the data set used to train the model will be used.
type A string, default is "response". For regessions, this will generate the fittingvalues. For classification, this will generate the predicted class values. There isan extra option "prob" for classification tree, which computes the probabilitiesof each class.
... Other arguments. Not implemented yet.
Value
A db.obj object, which wraps a table that contains the predicted values and also a valid ID column.For type='response', the predicted column has the fitted value (regression tree) or the predictedclasses (classification tree). For type='prob', there are one column for each class, which containsthe probabilities for that class.
Author(s)
Author: Predictive Analytics Team at Pivotal Inc.
Maintainer: Frank McQuillan, Pivotal Inc. <[email protected]>
References
[1] Documentation of decision tree in MADlib 1.6, http://doc.madlib.net/latest/
See Also
madlib.lm, madlib.glm, madlib.rpart, madlib.summary, madlib.arima, madlib.elnet are allMADlib wrapper functions.
predict.lm.madlib, predict.logregr.madlib, predict.elnet.madlib, predict.arima.css.madlibare all predict functions related to MADlib wrapper functions.
Examples
## Not run:
## set up the database connection## Assume that .port is port number and .dbname is the database namecid <- db.connect(port = .port, dbname = .dbname, verbose = FALSE)
x <- as.db.data.frame(abalone, conn.id = cid, verbose = FALSE)
key(x) <- "id"fit <- madlib.rpart(rings < 10 ~ length + diameter + height + whole + shell,
data=x, parms = list(split='gini'), control = list(cp=0.005))
predict(fit, x, 'r')

138 predict.elnet.madlib
db.disconnect(cid)
## End(Not run)
predict.elnet.madlib Predict using the regression result of elastic net regularization
Description
Prediction from models fit by madlib.elnet
Usage
## S3 method for class 'elnet.madlib'predict(object, newdata, type = c("response", "prob"), ...)
Arguments
object The result of madlib.elnet
newdata A db.obj object, which wraps the data in the database.
type A string, default is "response". The other option is "prob". The prediction for"gaussian"/"linear" family of madlib.elnet result is always for the dependentvariable. The prediction for "binomial"/"logistic" family is TRUE/FALSE valuesfor "response", and probabilities of TRUE for "prob".
... Extra parameters. Not implemented yet.
Value
A db.Rquery object, which contains the SQL query to compute the prediction. One can use thefunction lk to look at the values.
Author(s)
Author: Predictive Analytics Team at Pivotal Inc.
Maintainer: Frank McQuillan, Pivotal Inc. <[email protected]>
See Also
madlib.elnet Wrapper for MADlib elastic net regularization.
predict.lm.madlib and predict.logregr.madlib produce predictions for linear and logisticmodels.
Examples
## see the examples in madlib.elnet

predict.lda 139
predict.lda Prediction function for MADlib’s LDA models
Description
Labelling test documents using a learned LDA model built by linlk{madlib.lda}
Usage
## S3 method for class 'lda.madlib'predict(object, data, docid, words, ...)
Arguments
object The result of madlib.lda.
data An object of db.obj class. This is the database table containing the documentson which the algorithm will predict. The text of each document should be tok-enized into ’words’.
docid Text name of the column containing the id of the documents.
words Column name of the input data table containing the vector of words/tokens inthe documents.
... Arguments passed to or from other methods, not implemented yet.
Value
A db.table object, which points to a table that contains the predicted values. The table has thefollowing columns: docid wordcount words counts topic_count topic_assignment
One can use the function lk to look at the values.
Author(s)
Author: Predictive Analytics Team at Pivotal Inc.
Maintainer: Frank McQuillan, Pivotal Inc. <[email protected]>
See Also
madlib.lda builds a topic model using a set of documents.
Examples
## Not run:## Please see the examples in madlib.lda doc.
## End(Not run)

140 predict.rf.madlib
predict.rf.madlib Compute the predictions of the model produced bymadlib.randomForest
Description
This is actually a wrapper for MADlib’s predict function of random forests. It accepts the resultof madlib.randomForest, which is a representation of a random forest model, and computes thepredictions for new data sets.
Usage
## S3 method for class 'rf.madlib'predict(object, newdata, type = c("response", "prob"),
...)
Arguments
object A rf.madlib object, which is the result of madlib.randomForest.
newdata A db.obj object, which contains the data used for prediction. If it is not given,then the data set used to train the model will be used.
type A string, default is "response". For regessions, this will generate the fitting val-ues. For classification, this will generate the predicted class values. There is anextra option "prob" for classification models, which computes the probabilitiesof each class.
... Other arguments. Not implemented yet.
Value
A db.obj object, which wraps a table that contains the predicted values and also a valid ID col-umn. For type='response', the predicted column has the fitted value (regression model) or thepredicted classes (classification model). For type='prob', there are one column for each class,which contains the probabilities for that class.
Author(s)
Author: Predictive Analytics Team at Pivotal Inc.
Maintainer: Frank McQuillan, Pivotal Inc. <[email protected]>
References
[1] Documentation of random forests in MADlib 1.7, http://doc.madlib.net/latest/

preview 141
See Also
madlib.lm, madlib.glm, madlib.randomForest, madlib.rpart, madlib.summary, madlib.arima,madlib.elnet are all MADlib wrapper functions.
predict.lm.madlib, predict.logregr.madlib, predict.elnet.madlib, predict.arima.css.madlib,predict.dt.madlib, predict.rf.madlib are all predict functions related to MADlib wrapperfunctions.
Examples
## Not run:
## set up the database connection## Assume that .port is port number and .dbname is the database namecid <- db.connect(port = .port, dbname = .dbname, verbose = FALSE)
x <- as.db.data.frame(abalone, conn.id = cid, verbose = FALSE)
key(x) <- "id"fit <- madlib.randomForest(rings < 10 ~ length + diameter + height + whole + shell,
data=x)
predict(fit, x, 'r')
db.disconnect(cid)
## End(Not run)
preview Read the actual data stored in a table of database.
Description
These functions read the actual data from a database table or operation, returning a data.frame orother object as appropriate. lookat and lk are actually the same.
Usage
lookat(x, nrows = 100, array = TRUE, conn.id = 1, drop = TRUE)
lk(x, nrows = 100, array = TRUE, conn.id = 1, drop = TRUE)
## S3 method for class 'db.table'as.data.frame(x, row.names = NULL, optional = FALSE,
nrows = NULL, stringsAsFactors = default.stringsAsFactors(), array= TRUE, ...)
## S3 method for class 'db.view'

142 preview
as.data.frame(x,row.names=NULL, optional=FALSE, nrows= NULL, stringsAsFactors = default.stringsAsFactors(), array = TRUE,...)
## S3 method for class 'db.Rquery'as.data.frame(x, row.names = NULL, optional =
FALSE, nrows = NULL, stringsAsFactors = default.stringsAsFactors(),array = TRUE, ...)
Arguments
x A db.data.frame (includes db.table and db.view) object, which points to atable or view in the database; or a db.Rquery object, which represents someoperations on a db.data.frame object. If x is a string, which means a tablename, this function directly reads data from the table without having to wrap itwith a db.data.frame class object.
conn.id An integer, the ID of the connection where the table resides.
nrows An integer, how many rows of data to retrieve. If it is NULL or "all" or a non-positive value, then all data in the table will be send into R. Be careful, you donot want to do this if the data table is very large.
array Logical, default is TRUE. This decides how to parse columns that have array astheir elements. When TRUE, each element in the array is extracted and put into anew column. Otherwise, the array is read in as a string.
stringsAsFactors
Logical, whether character variables should be converted to factors.
drop Whether to coerce single-column tables to a vector of the appropriate class.row.names,optional,...
For compatibility with the as.data.frame generic; not used.
Details
When x is a db.data.frame object, this function reads the data in a table or view in the connecteddatabase.
When x is a db.Rquery object, this function reads the result of some operations on a db.data.frameobject.
When x is a db.Rcrossprod object, this function output a matrix to R. If the matrix is symmetric,it is returned as dspMatrix. Otherwise, it is returned as dgeMatrix. If there are multiple matricesin x, a list is returned and each element of the list is a matrix.
The as.data.frame method calls lookat with nrows = NULL to perform the conversion to a dataframe. In this case drop is set to FALSE, ie the result will always be a data frame.
Value
For db.data.frame and db.Rquery objects, a data frame. Each column in the table becomes acolumn of the returned data.frame. A column of arrays is converted into a column of strings,see arraydb.to.arrayr for more details. Single-column tables created with lookat or lk will becoerced to a vector if drop == TRUE.

print 143
For db.Rcrossprod objects, a matrix or list of matrix objects as appropriate (see above).
Author(s)
Author: Predictive Analytics Team at Pivotal Inc.
Hong Ooi, Pivotal Inc. <[email protected]> wrote the as.data.frame methods.
Maintainer: Frank McQuillan, Pivotal Inc. <[email protected]>
See Also
arraydb.to.arrayr convert strings extracted form database into arrays.
Examples
## Not run:
## set up the database connection## Assume that .port is port number and .dbname is the database namecid <- db.connect(port = .port, dbname = .dbname, verbose = FALSE)
## create a table from the example data.frame "abalone"x <- as.db.data.frame(abalone, conn.id = cid, verbose = FALSE)
## preview of a tablelk(x, nrows = 10) # extract 10 rows of data
## do some operations and preview the resulty <- (x[,1:2] + 1.2) * 2lk(y, 20)
## table abalone has a column named "id"lk(sort(x, INDICES = x$id), 20) # the preview is ordered by "id" value
## use as.data.frameas.data.frame(x, 10)
db.disconnect(cid, verbose = FALSE)
## End(Not run)
print Display results of logistic regression
Description
This function displays the results of logistic regression in a pretty format.

144 print
Usage
## S3 method for class 'logregr.madlib'print(x, digits = max(3L, getOption("digits")- 3L), ...)
## S3 method for class 'logregr.madlib.grps'print(x, digits = max(3L, getOption("digits")- 3L), ...)
## S3 method for class 'logregr.madlib'show(object)
## S3 method for class 'logregr.madlib.grps'show(object)
## S3 method for class 'glm.madlib'print(x, digits = max(3L, getOption("digits") - 3L), ...)
## S3 method for class 'glm.madlib.grps'print(x, digits = max(3L, getOption("digits") - 3L),
...)
## S3 method for class 'glm.madlib'show(object)
## S3 method for class 'glm.madlib.grps'show(object)
Arguments
x, object The logistic regression result object to be printed.
digits A non-null value for ‘digits’ specifies the minimum number of significant digitsto be printed in values. The default, ‘NULL’, uses ‘getOption("digits")’. (Forthe interpretation for complex numbers see signif.) Non-integer values will berounded down, and only values greater than or equal to 1 and no greater than 22are accepted.
... Further arguments passed to or from other methods. This is currently not imple-mented.
Value
No value is returned
Author(s)
Author: Predictive Analytics Team at Pivotal Inc.

print-methods 145
Maintainer: Frank McQuillan, Pivotal Inc. <[email protected]>
See Also
madlib.glm Wrapper for MADlib linear and logistic regression
Examples
## Not run:## see the examples in madlib.glm
## End(Not run)
print-methods Display the connection information associated with a db object
Description
This function displays the SQL table, database, host, and connection information associated with adb.table or db.view object.
Usage
## S4 method for signature 'db.data.frame'print(x)
## S4 method for signature 'db.Rquery'print(x)
## S4 method for signature 'db.data.frame'show(object)
## S4 method for signature 'db.Rquery'show(object)
Arguments
x The signature of the method. A db.data.frame (includes db.table and db.view)object, which points to a table or view in the database; or a db.Rquery object,which represents some operations on a db.data.frame object.
object The signature of the method. A db.data.frame (includes db.table and db.view)object, which points to a table or view in the database; or a db.Rquery object,which represents some operations on a db.data.frame object.

146 print.arima.madlib
Details
When the signature x is either a db.data.frame object or a db.Rquery object, this function displaysthe name of connected SQL database, the SQL database host, and the connection ID.
When the signature x is a db.data.frame object, the function also displays the associated table.When the signature x is a db.Rquery object, this function displays the temporary status of the input,and the table that it is derived from.
Value
This function returns nothing.
Author(s)
Author: Predictive Analytics Team at Pivotal Inc.
Maintainer: Frank McQuillan, Pivotal Inc. <[email protected]>
See Also
lk or lookat Displays the contents of an associated table.
Examples
## Not run:
## set up the database connection## Assume that .port is port number and .dbname is the database namecid <- db.connect(port = .port, dbname = .dbname, verbose = FALSE)
## create a table from the example data.frame "abalone"x <- as.db.data.frame(abalone, conn.id = cid, verbose = FALSE)
## printing db.data.frame objectx # Display the associated table, and database information for x
db.disconnect(cid, verbose = FALSE)
## End(Not run)
print.arima.madlib Display results of ARIMA fitting of madlib.arima
Description
This function displays the results of madlib.arima in a pretty format.

print.dt.madlib 147
Usage
## S3 method for class 'arima.css.madlib'print(x, digits = max(3L, getOption("digits")- 3L), ...)
## S3 method for class 'arima.css.madlib'show(object)
Arguments
x, object The ARIMA fitting result object of madlib.arima
digits A non-null value for ‘digits’ specifies the minimum number of significant digitsto be printed in values. The default, ‘NULL’, uses ‘getOption("digits")’. (Forthe interpretation for complex numbers see signif.) Non-integer values will berounded down, and only values greater than or equal to 1 and no greater than 22are accepted.
... Further arguments passed to or from other methods. This is currently not imple-mented.
Author(s)
Author: Predictive Analytics Team at Pivotal Inc.
Maintainer: Frank McQuillan, Pivotal Inc. <[email protected]>
See Also
madlib.arima Wrapper for MADlib ARIMA model fitting
Examples
## Not run:## Please see the examples in madlib.arima doc
## End(Not run)
print.dt.madlib Print the result of madlib.rpart
Description
This function prints the result of madlib.rpart to the screen. It internally calls R’s print.rpartfunction.

148 print.dt.madlib
Usage
## S3 method for class 'dt.madlib'print(x, digits = max(3L, getOption("digits") - 3L),
...)
Arguments
x The fitted tree from the result of madlib.rpart
digits The number of digits to print for numerical values.
... Arguments to be passed to or from other methods.
Author(s)
Author: Predictive Analytics Team at Pivotal Inc.
Maintainer: Frank McQuillan, Pivotal Inc. <[email protected]>
References
[1] Documentation of decision tree in MADlib 1.6, http://doc.madlib.net/latest/
See Also
madlib.rpart is the wrapper for MADlib’s tree_train function for decision trees. plot.dt.madlib,text.dt.madlib are other visualization functions.
madlib.lm, madlib.glm, madlib.rpart, madlib.summary, madlib.arima, madlib.elnet are allMADlib wrapper functions.
Examples
## Not run:
## set up the database connection## Assume that .port is port number and .dbname is the database namecid <- db.connect(port = .port, dbname = .dbname, verbose = FALSE)
x <- as.db.data.frame(abalone, conn.id = cid, verbose = FALSE)lk(x, 10)
## decision tree using abalone data, using default values of minsplit,## maxdepth etc.key(x)<-"id"fit <- madlib.rpart(rings < 10 ~ length + diameter + height + whole + shell,
data=x, parms = list(split='gini'), control = list(cp=0.005))
print(fit)

print.elnet.madlib 149
db.disconnect(cid)
## End(Not run)
print.elnet.madlib Display the results from madlib.elnet function in a pretty format
Description
This function prints the results from madlib.elnet in a human-readable format.
Usage
## S3 method for class 'elnet.madlib'print(x, digits = max(3L, getOption("digits") - 3L), ...)
## S3 method for class 'elnet.madlib'show(object)
Arguments
x, object The elnet.madlib object to be printed.
digits A non-null value for ‘digits’ specifies the minimum number of significant digitsto be printed in values. The default, ‘NULL’, uses ‘getOption("digits")’. (Forthe interpretation for complex numbers see signif.) Non-integer values will berounded down, and only values greater than or equal to 1 and no greater than 22are accepted.
... Further arguments passed to or from other methods. This is currently not imple-mented.
Author(s)
Author: Predictive Analytics Team at Pivotal Inc.
Maintainer: Frank McQuillan, Pivotal Inc. <[email protected]>
See Also
madlib.elnet Wrapper for MADlib elastic net regularization.
Examples
## see the examples in madlib.elnet

150 print.lm.madlib
print.lm.madlib Display results of linear regression
Description
This function displays the results of linear regression in a pretty format.
Usage
## S3 method for class 'lm.madlib'print(x, digits = max(3L, getOption("digits") - 3L),...)
## S3 method for class 'lm.madlib.grps'print(x, digits = max(3L, getOption("digits") -3L), ...)
## S3 method for class 'lm.madlib'show(object)
## S3 method for class 'lm.madlib.grps'show(object)
Arguments
x, object The linear regression result object to be printed.
digits A non-null value for ‘digits’ specifies the minimum number of significant digitsto be printed in values. The default, ‘NULL’, uses ‘getOption("digits")’. (Forthe interpretation for complex numbers see signif.) Non-integer values will berounded down, and only values greater than or equal to 1 and no greater than 22are accepted.
... Further arguments passed to or from other methods. This is currently not imple-mented.
Value
No value is returned
Author(s)
Author: Predictive Analytics Team at Pivotal Inc.
Maintainer: Frank McQuillan, Pivotal Inc. <[email protected]>
See Also
madlib.lm Wrapper for MADlib linear regression

print.none.obj 151
Examples
## see the examples in madlib.lm
print.none.obj Function used in GUI to print absolutely nothing
Description
This function prints nothing and is used only in GUI.
Usage
## S3 method for class 'none.obj'print(x, ...)
Arguments
x A none.obj object. The content of this object does not matter. It is used toreturn a value which makes the GUI print nothing on the screen.
... Not used.
Author(s)
Author: Predictive Analytics Team at Pivotal Inc.
Maintainer: Frank McQuillan, Pivotal Inc. <[email protected]>
See Also
PivotalR launches the GUI for PivotalR.
print.rf.madlib Print the result of madlib.randomForest
Description
This function prints the result of madlib.randomForest to the screen. It internally calls R’s printfunction for random forests.
Usage
## S3 method for class 'rf.madlib'print(x, digits = max(3L, getOption("digits") - 3L),
...)

152 print.rf.madlib
Arguments
x The fitted forest from the result of madlib.randomForest
digits The number of digits to print for numerical values.
... Arguments to be passed to or from other methods.
Author(s)
Author: Predictive Analytics Team at Pivotal Inc.
Maintainer: Frank McQuillan, Pivotal Inc. <[email protected]>
References
[1] Documentation of random forest in MADlib 1.7, http://doc.madlib.net/latest/
See Also
madlib.randomForest is the wrapper for MADlib’s forest_train function for random forests.
madlib.lm, madlib.glm, madlib.rpart, madlib.summary, madlib.arima, madlib.elnet, madlib.rpartare all MADlib wrapper functions.
Examples
## Not run:
## set up the database connection## Assume that .port is port number and .dbname is the database namecid <- db.connect(port = .port, dbname = .dbname, verbose = FALSE)
x <- as.db.data.frame(abalone, conn.id = cid, verbose = FALSE)lk(x, 10)
## random forest using abalone data, using default values of minsplit,## maxdepth etc.key(x)<-"id"fit <- madlib.randomForest(rings < 10 ~ length + diameter + height + whole + shell,
data=x)
print(fit)
db.disconnect(cid)
## End(Not run)

print.summary.madlib 153
print.summary.madlib Display the results from summary function in a pretty format
Description
This function prints the results from madlib.summary in a human-readable format.
Usage
## S3 method for class 'summary.madlib'print(x, digits = max(3L,getOption("digits") - 3L),...)
## S3 method for class 'summary.madlib'show(object)
Arguments
x, object The summary result object to be printed.
digits A non-null value for ‘digits’ specifies the minimum number of significant digitsto be printed in values. The default, ‘NULL’, uses ‘getOption("digits")’. (Forthe interpretation for complex numbers see signif.) Non-integer values will berounded down, and only values greater than or equal to 1 and no greater than 22are accepted.
... Further arguments passed to or from other methods. This is currently not imple-mented.
Author(s)
Author: Predictive Analytics Team at Pivotal Inc.
Maintainer: Frank McQuillan, Pivotal Inc. <[email protected]>
See Also
madlib.summary Wrapper for MADlib linear and logistic regression
Examples
## see the examples in madlib.summary

154 residuals
residuals Residuals methods for Madlib regression objects
Description
Functions to extract the residuals for regression models fit in Madlib.
Usage
## S3 method for class 'lm.madlib'residuals(object, ...)
## S3 method for class 'lm.madlib.grps'residuals(object, ...)
## S3 method for class 'logregr.madlib'residuals(object, ...)
## S3 method for class 'logregr.madlib.grps'residuals(object, ...)
## S3 method for class 'glm.madlib'residuals(object, ...)
## S3 method for class 'glm.madlib.grps'residuals(object, ...)
Arguments
object The regression model object, of class lm.madlib, lm.madlib.grps or logregr.madlib,logregr.madlib.grps obtained using madlib.lm or madlib.glm respectively.
... Other arguments, not used.
Details
See the documentation for residuals
Value
For ungrouped regressions, residuals returns an object of class db.Rquery
For grouped regressions, residuals returns a list of db.Rquery objects giving the output of thesemethods for each of the component models. Similarly, AIC for a grouped regression returns a vectorof the AICs for each of the component models.

Row_actions 155
Author(s)
Author: Predictive Analytics Team, Pivotal Inc.
Maintainer: Frank McQuillan, Pivotal Inc. <[email protected]>
See Also
AIC, extractAIC, logLik.
Examples
## Not run:
## set up the database connection## Assume that .port is port number and .dbname is the database namecid <- db.connect(port = .port, dbname = .dbname, verbose = FALSE)
x <- as.db.data.frame(abalone, conn.id = cid, verbose = FALSE)lk(x, 10)
fit <- madlib.glm(rings < 10 ~ . - id | sex, data = x, family ="binomial")
residuals(fit)
db.disconnect(cid)
## End(Not run)
Row_actions Compute the sum or mean of all columns in one row of a table
Description
This function returns a db.Rquery object, which produces the sum or mean value of all columns ofone row when executed in database.
Usage
## S4 method for signature 'db.obj'rowSums(x, na.rm = FALSE, dims = 1, ...)## S4 method for signature 'db.obj'rowMeans(x, na.rm = FALSE, dims = 1, ...)
156 Row_actions
Arguments
x A db.obj object, which has only one column. The column can be casted intoboolean values.
na.rm logical. Should missing values (including ’NaN’) be omitted from the calcula-tions? Not implemented yet.
dims integer: Which dimensions are regarded as ’rows’ or ’columns’ to sum over. For’row*’, the sum or mean is over dimensions ’dims+1, ...’; for ’col*’ it is overdimensions ’1:dims’. Not implemented yet.
... Other arguments. Not implemented yet.
Value
A db.Rquery object which, when executed, computes the mean or sum of all columns on every rowof a table.
Author(s)
Author: Hong Ooi, Pivotal Inc.
Maintainer: Frank McQuillan, Pivotal Inc. <[email protected]>
See Also
sum,db.obj-method, colSums,db.obj-method compute the sum of each column.
mean,db.obj-method, colMeans,db.obj-method compute the mean values column-wise.
Examples
## Not run:
## set up the database connection## Assume that .port is port number and .dbname is the database namecid <- db.connect(port = .port, dbname = .dbname, verbose = FALSE)
x <- as.db.data.frame(abalone, conn.id = cid, verbose = FALSE)lk(x, 10)
row.sum <- rowSums(x[,-2]) # the second column is textrow.avg <- rowMeans(x[,-2])
## lokk at 10 resultslk(row.sum, 10)lk(row.avg, 10)
db.disconnect(cid, verbose = FALSE)
## End(Not run)

sample-methods 157
sample-methods Methods for sampling rows of data from a table/view randomly
Description
This method samples rows of data from a table/view randomly. The sampled result is stored in atemporary table.
Usage
## S4 method for signature 'db.obj'sample(x, size, replace = FALSE, prob = NULL, ...)
Arguments
x A db.obj object, which is the wrapper to the data table.
size An integer. The size of the random sample. When replace is FALSE, size mustbe smaller than the data table/view’s total row number.
replace A logical value, default is FALSE. When it is TRUE, the data is sampled withreplacement, which means a row might be sampled for multiple times. When itis FALSE, each row can only be sampled at most once.
prob A vector of double values, default is NULL. The probabilityies of each row tosample. Not implemented yet.
... Extra parameters. Not implemented.
Details
When replace is FALSE, the data is just sorted randomly (see sort,db.obj-method) and selected,which is similar to sort(x, FALSE, "random"). When replace is TRUE, we have to scan the tablemultiple times to select repeated items.
Value
A db.data.frame object, which is a wrapper to a temporary table. The table contains the sampleddata.
Author(s)
Author: Predictive Analytics Team at Pivotal Inc.
Maintainer: Frank McQuillan, Pivotal Inc. <[email protected]>
See Also
generic.bagging uses sample
158 scale
Examples
## Not run:
## set up the database connection## Assume that .port is port number and .dbname is the database namecid <- db.connect(port = .port, dbname = .dbname, verbose = FALSE)
y <- as.db.data.frame(abalone, conn.id = cid, verbose = FALSE)lk(y, 10)
dim(y)
a <- sample(y, 20)
dim(a)
lookat(a)
b <- sample(y, 40, replace = TRUE)
dim(b)
lookat(b)
delete(b)
db.disconnect(cid, verbose = FALSE)
## End(Not run)
scale Scaling and centering of tables
Description
scale centers and/or scales the columns of a numeric table.
Usage
## S4 method for signature 'db.obj'scale(x, center = TRUE, scale = TRUE)
Arguments
x A db.obj object. It represents a table/view in the database if it is an db.data.frameobject, or a series of operations applied on an existing db.data.frame object ifit is a db.Rquery object.

scale 159
center either a logical value or a numeric vector of length equal to the number ofcolumns of ’x’.
scale either a logical value or a numeric vector of length equal to the number ofcolumns of ’x’.
Details
The value of ’center’ determines how column centering is performed. If ’center’ is a numeric vectorwith length equal to the number of columns of ’x’, then each column of ’x’ has the correspondingvalue from ’center’ subtracted from it. If ’center’ is ’TRUE’ then centering is done by subtractingthe column means (omitting ’NA’s) of ’x’ from their corresponding columns, and if ’center’ is’FALSE’, no centering is done.
The value of ’scale’ determines how column scaling is performed (after centering). If ’scale’ is anumeric vector with length equal to the number of columns of ’x’, then each column of ’x’ is dividedby the corresponding value from ’scale’. If ’scale’ is ’TRUE’ then scaling is done by dividing the(centered) columns of ’x’ by their standard deviations if ’center’ is ’TRUE’, and the root meansquare otherwise. If ’scale’ is ’FALSE’, no scaling is done.
The root-mean-square for a (possibly centered) column is defined as sqrt(sum(x^2)/(n-1)), where xis a vector of the non-missing values and n is the number of non-missing values. In the case ’center= TRUE’, this is the same as the standard deviation, but in general it is not. (To scale by the standarddeviations without centering, use ’scale(x, center = FALSE, scale = lookat(sd(x)))’.)
Value
A db.Rquery object. It computes the centering and/or scaling of codex for each column includingarray elements. The result can be viewed using lk or lookat.
The numeric centering and scalings used (if any) are returned as attributes "scaled:center" and"scaled:scale". The number of rows in the table is also returned as the attribute "row.number".
Author(s)
Author: Predictive Analytics Team at Pivotal Inc.
Maintainer: Frank McQuillan, Pivotal Inc. <[email protected]>
See Also
db.array creates an array column for a db.Rquery object.
Examples
## Not run:## help("scale,db.obj-method") # display this doc
## set up the database connection## Assume that .port is port number and .dbname is the database namecid <- db.connect(port = .port, dbname = .dbname)
x <- as.db.data.frame(abalone, conn.id = cid)

160 sort
lk(x, 10)
s <- scale(x[-c(1,2)]) # scale all numeric columns
centers <- attr(s, "scaled:center")scales <- attr(s, "scaled:scale")
## create the scaled tabledelete("scaled_abalone")y <- as.db.data.frame(s, "scaled_abalone")
lk(y, 10)
db.disconnect(cid, verbose = FALSE)
## End(Not run)
sort Sort a table or view by a set of columns
Description
This function is used to sort a table of view in the database.
Usage
## S4 method for signature 'db.obj'sort(x, decreasing = FALSE, INDICES, ...)
Arguments
x The signature of the method. A db.obj (includes db.table and db.view) ob-ject, which points to a table or view in the database.
decreasing A logical, with default value as FALSE. Should the sort be increasing or de-creasing?
INDICES A list of db.Rquery objects. Each of the list element selects one or multiplecolumns of x. NULL to order by random().
... Further arguments passed to or from other methods. This is currently not imple-mented.
Value
A db.Rquery object. It is the query object used to sort the db.obj in the database.
Author(s)
Author: Predictive Analytics Team at Pivotal Inc.
Maintainer: Frank McQuillan, Pivotal Inc. <[email protected]>

subset-methods 161
See Also
by has similar syntax to this function.
lk or lookat to view portion of the data table
Examples
## Not run:
## set up the database connection## Assume that .port is port number and .dbname is the database namecid <- db.connect(port = .port, dbname = .dbname, verbose = FALSE)
x <- as.db.data.frame(abalone, conn.id = cid, verbose = FALSE)lk(x, 10)
y <- sort(x, decreasing = FALSE, list(x$id, x$sex) )# get the SQL query to be runcontent(y)# get the sorted outputlk(y, 20)
db.disconnect(cid, verbose = FALSE)
## End(Not run)
subset-methods Extract a subset of a table or view
Description
This function extracts a subset of a db.obj which could either be a db.table or db.view object.
Usage
## S4 method for signature 'db.obj'subset(x, subset, select)
Arguments
x A db.obj (either db.table or db.view) object from which to extract element(s).
subset, select Indices specifying elements to extract or replace. Indices are ‘numeric’ or ‘char-acter’ vectors or empty (missing) or ‘NULL’. Numeric values are coerced tointeger as by ‘as.integer’ (and hence truncated towards zero).
Value
A db.Rquery object is returned which is a SQL query to extract the requested subset.
162 summary
Author(s)
Author: Predictive Analytics Team at Pivotal Inc.
Maintainer: Frank McQuillan, Pivotal Inc. <[email protected]>
See Also
[-methods Operator to extract elements
Examples
## Not run:
## set up the database connection## Assume that .port is port number and .dbname is the database namecid <- db.connect(port = .port, dbname = .dbname, verbose = FALSE)
x <- as.db.data.frame(abalone, conn.id = cid, verbose = FALSE)lk(x, 10)
lk(x[1:3])lk(subset(x, 1:3))
db.disconnect(cid, verbose = FALSE)
## End(Not run)
summary Summary information for Logistic Regression output
Description
The function prints the value of each element in the Logistic Regression output object.
Usage
## S3 method for class 'logregr.madlib'summary(object, ...)
## S3 method for class 'logregr.madlib.grps'summary(object, ...)
## S3 method for class 'glm.madlib'summary(object, ...)
## S3 method for class 'glm.madlib.grps'summary(object, ...)

summary.arima.madlib 163
Arguments
object Logistic regression object
... Further arguments passed to or from other methods. This is currently not imple-mented.
Value
The function returns the logregr.madlib or logregr.madlib.grps object passed to the function.
Author(s)
Author: Predictive Analytics Team at Pivotal Inc.
Maintainer: Frank McQuillan, Pivotal Inc. <[email protected]>
See Also
madlib.glm wrapper for MADlib linear and logistic regressions.
madlib.lm wrapper for MADlib linear regression
Examples
## see the examples in madlib.glm
summary.arima.madlib Summary information for MADlib’s ARIMA model
Description
The function prints the result of madlib.arima in a pretty format
Usage
## S3 method for class 'arima.css.madlib'summary(object, ...)
Arguments
object The ARIMA fitting result object of madlib.arima
... Further arguments passed to or from other methods. This is currently not imple-mented.
Value
The function returns the object passed to the function

164 summary.elnet.madlib
Author(s)
Author: Predictive Analytics Team at Pivotal Inc.
Maintainer: Frank McQuillan, Pivotal Inc. <[email protected]>
See Also
madlib.arima Wrapper for MADlib ARIMA model fitting
print.arima.css.madlib print the ARIMA result
Examples
## Not run:## Please see the examples in madlib.arima doc
## End(Not run)
summary.elnet.madlib Summary information for Elastic net regularization output
Description
The function prints the value of each element in the output object of madlib.elnet.
Usage
## S3 method for class 'elnet.madlib'summary(object, ...)
Arguments
object A elnet.madlib object produced by madlib.elnet.
... Further arguments passed to or from other methods. This is currently not imple-mented.
Value
The function returns the elnet.madlib object in the argument.
Author(s)
Author: Predictive Analytics Team at Pivotal Inc.
Maintainer: Frank McQuillan, Pivotal Inc. <[email protected]>
See Also
madlib.elnet Wrapper for MADlib elastic net regularization.
summary.lm.madlib 165
Examples
## see the examples in madlib.elnet
summary.lm.madlib Summary information for Linear Regression output
Description
The function prints the value of each element in the Linear Regression output object.
Usage
## S3 method for class 'lm.madlib'summary(object, ...)
## S3 method for class 'lm.madlib.grps'summary(object, ...)
Arguments
object Linear regression object
... Further arguments passed to or from other methods. This is currently not imple-mented.
Value
The function returns the lm.madlib or lm.madlib.grps object passed to the function
Author(s)
Author: Predictive Analytics Team at Pivotal Inc.
Maintainer: Frank McQuillan, Pivotal Inc. <[email protected]>
See Also
madlib.lm Wrapper for MADlib linear regression
Examples
## see the examples in madlib.lm

166 text.dt.madlib
text.dt.madlib Add labels onto the figure generated by plot.dt.madlib
Description
This is a function which adds labels to the plot generated by plot.dt.madlib.
Usage
## S3 method for class 'dt.madlib'text(x, splits = TRUE, label, FUN = text, all = FALSE,
pretty = NULL, digits = getOption("digits") - 3L, use.n = FALSE, fancy= FALSE, fwidth = 0.8, fheight = 0.8, bg = par("bg"), minlength = 1L, ...)
Arguments
x The fitted tree from the result of madlib.rpart
splits A boolean, if TRUE, labels the splits with the criterion for the split.
label This is currently ignored.
FUN The name of a labeling function, e.g. text
all A boolean, if TRUE, labels all the nodes, otherwise just the terminal nodes.
pretty An alternative to the minlength argument.
digits Number of significant digits to include in numeric labels.
use.n A boolean, if TRUE, adds to label (\#events level1/ \#events level2/etc. for clas-sification and n for regression)
fancy A boolean, if TRUE, represents internal nodes by ellipses and leaves by rectan-gles.
fwidth Controls the width of the ellipses and rectangles if fancy=TRUE.
fheight Controls the height of the ellipses and rectangles if fancy=TRUE.
bg The color used to paint the background if fancy=TRUE.
minlength The length to use for factor labels.
... Other graphical parameters to be supplied as input to this function (see par).
Author(s)
Author: Predictive Analytics Team at Pivotal Inc.
Maintainer: Frank McQuillan, Pivotal Inc. <[email protected]>
References
[1] Documentation of decision tree in MADlib 1.6, http://doc.madlib.net/latest/

Type Cast functions 167
See Also
madlib.rpart is the wrapper for MADlib’s tree_train function for decision trees. plot.dt.madlib,print.dt.madlib are visualization functions for a model fitted through madlib.rpart
predict.dt.madlib is a wrapper for MADlib’s predict function for decision trees.
madlib.lm, madlib.glm, madlib.summary, madlib.arima, madlib.elnet are all MADlib wrap-per functions.
Examples
## Not run:
## set up the database connection## Assume that .port is port number and .dbname is the database namecid <- db.connect(port = .port, dbname = .dbname, verbose = FALSE)
x <- as.db.data.frame(abalone, conn.id = cid, verbose = FALSE)
key(x) <- "id"fit <- madlib.rpart(rings < 10 ~ length + diameter + height + whole + shell,
data=x, parms = list(split='gini'), control = list(cp=0.005))
plot(fit, uniform=TRUE)text(fit, use.n=TRUE, all=TRUE)
db.disconnect(cid)
## End(Not run)
Type Cast functions Cast columns of db.obj objects to other types
Description
Coerce db.obj object columns into other types. col.types displays the types of each column.as.Date converts to date (no time of day); as.time converts to time of day (no date); as.timestampconverts to both date and time; as.interval converts to time interval. db.date.style can displayor set the date style for a particular connection.
Usage
## S4 method for signature 'db.obj'as.integer(x, ...)
## S4 method for signature 'db.obj'as.character(x, array = TRUE, ...)

168 Type Cast functions
## S4 method for signature 'db.obj'as.double(x, ...)
## S4 method for signature 'db.obj'as.logical(x, ...)
## S4 method for signature 'db.obj'as.numeric(x, ...)
## S4 method for signature 'db.obj'as.Date(x, ...)
db.date.style(conn.id = 1, set = NULL)
as.time(x, ...)
as.timestamp(x, ...)
as.interval(x, ...)
col.types(x)
Arguments
x A db.obj object. All columns of the object will be converted into the targettype. If the column contains arrays, the array will be converted into an array ofthe target type.
array A logical, default is TRUE. If array is TRUE, then an array column is convertedinto an array of strings. If array is FALSE, then an array column is convertedinto a string column, i.e. array[1,2,3] is casted into '\{1,2,3\}'.
... further arguments passed to or from other methods This is currently not imple-mented.
conn.id An integer, default is 1. The connection ID for the database connection.
set A string, default is NULL. It can be "us" or "european". If it is NULL, db.date.styledisplays the current date style in the connected database. Otherwise, it sets thedate style for the connected database.
Value
A db.Rquery object, which is a SQL query which combine all columns into an array.
col.types returns a vector of characters, which are the column types of x.
Author(s)
Author: Predictive Analytics Team at Pivotal Inc.
Maintainer: Frank McQuillan, Pivotal Inc. <[email protected]>

unique-methods 169
See Also
by,db.obj-method is usually used together with aggregate functions.
Examples
## Not run:
## set up the database connection## Assume that .port is port number and .dbname is the database namecid <- db.connect(port = .port, dbname = .dbname, verbose = FALSE)
x <- as.db.data.frame(abalone, conn.id = cid, verbose = FALSE)lk(x, 10)
z <- as.integer(x > 1)lookat(z, 10)
z <- as.integer(x[,2] == "M")lookat(z, 10)
col.types(x)
col.types(z)
db.disconnect(cid, verbose = FALSE)
## End(Not run)
unique-methods The Unique of an object
Description
This function gives the unique values of a db.obj, which are the column unique of a db.table ordb.view.
Usage
## S4 method for signature 'db.obj'unique(x, incomparables = FALSE, ...)
Arguments
x A db.obj object, which the column unique are to be computed. The object hasto have only one column otherwise an error will be raised.
incomparables Not implemented.
... Not implemented.

170 vcov
Value
An db.Rquery, whose column is the unique value of the column.
Note
This function applies only onto db.obj with one column. If you want to put the unique values frommultiple columns together, you have to use db.array
Author(s)
Author: Predictive Analytics Team at Pivotal Inc.
Maintainer: Frank McQuillan, Pivotal Inc. <[email protected]>
See Also
db.obj, db.data.frame, db.table, db.view, db.Rquery are the class hierarchy structure of thispackage.
Examples
## Not run:
## set up the database connection## Assume that .port is port number and .dbname is the database namecid <- db.connect(port = .port, dbname = .dbname, verbose = FALSE)
x <- as.db.data.frame(abalone, conn.id = cid, verbose = FALSE)lk(x, 10)
## get unique of all columnsunique(x$sex)
db.disconnect(cid, verbose = FALSE)
## End(Not run)
vcov vcov methods for Madlib regression objects
Description
Functions to extract the variance-cocariance matrix for regression models fit in Madlib.

vcov 171
Usage
## S3 method for class 'lm.madlib.grps'vcov(object, na.action = NULL, ...)
## S3 method for class 'lm.madlib'vcov(object, na.action = NULL, ...)
## S3 method for class 'logregr.madlib.grps'vcov(object, na.action = NULL, ...)
## S3 method for class 'logregr.madlib'vcov(object, na.action = NULL, ...)
Arguments
object The regression model object, of class lm.madlib, lm.madlib.grps, logregr.madlib,logregr.madlib.grps.
na.action A function, default is NULL. Possible choice is na.omit,db.obj-method.
... Other arguments, not used.
Value
For lm.madlib and logregr.madlib objects, this function returns the variance-covariance matrixof the main parameters.
For lm.madlib.grps and logregr.madlib.grps objects, which are a list of models for multiplegroups of data, returns a list, each of which is the variance-cocariance matrix for the model of eachgroup of data.
Author(s)
Author: Hong Ooi, Pivotal Inc.
Maintainer: Frank McQuillan, Pivotal Inc. <[email protected]>
See Also
madlib.lm, madlib.glm for MADlib regression wrappers
Examples
## Not run:
## set up the database connection## Assume that .port is port number and .dbname is the database namecid <- db.connect(port = .port, dbname = .dbname, verbose = FALSE)
x <- as.db.data.frame(abalone, conn.id = cid, verbose = FALSE)lk(x, 10)
fit <- madlib.glm(rings < 10 ~ . - id | sex, data = x, family ="binomial")

172 vcov
vcov(fit)
vcov(fit[[1]])
db.disconnect(cid, verbose = FALSE)
## End(Not run)

Index
!,db.obj-method (Logical-methods), 85!=,character,db.obj-method
(Compare-methods), 32!=,db.obj,character-method
(Compare-methods), 32!=,db.obj,db.obj-method
(Compare-methods), 32!=,db.obj,logical-method
(Compare-methods), 32!=,db.obj,numeric-method
(Compare-methods), 32!=,logical,db.obj-method
(Compare-methods), 32!=,numeric,db.obj-method
(Compare-methods), 32∗Topic GUI
GUI, 79print.none.obj, 151
∗Topic IOprint, 143print-methods, 145print.arima.madlib, 146print.elnet.madlib, 149print.lm.madlib, 150print.none.obj, 151print.summary.madlib, 153
∗Topic \textasciitildekwd1getTree.rf.madlib, 76madlib.randomForest, 109madlib.rpart, 111plot.dt.madlib, 130print.dt.madlib, 147print.rf.madlib, 151text.dt.madlib, 166
∗Topic \textasciitildekwd2getTree.rf.madlib, 76madlib.randomForest, 109madlib.rpart, 111plot.dt.madlib, 130
print.dt.madlib, 147print.rf.madlib, 151text.dt.madlib, 166
∗Topic classesdb.data.frame-class, 44db.obj-class, 50db.Rcrossprod-class, 53db.Rquery-class, 54db.table-class, 58db.view-class, 59
∗Topic connectiondb.connect, 41db.disconnect, 46
∗Topic data operationarray.len, 18by, 26cbind2-methods, 28Extract-Replace-methods, 68key, 84merge-method, 123null.data, 127preview, 141subset-methods, 161Type Cast functions, 167
∗Topic databasearraydb.to.arrayr, 19as.db.data.frame, 21clean.madlib.temp, 30conn.eql, 35conn.id, 36content, 38db.connect, 41db.data.frame, 43db.data.frame-class, 44db.disconnect, 46db.existsObject, 48db.list, 49db.obj-class, 50db.objects, 51
173

174 INDEX
db.q, 52db.Rcrossprod-class, 53db.Rquery-class, 54db.search.path, 57db.table-class, 58db.view-class, 59delete, 60dim-methods, 63eql-methods, 64Extract database connection info,
66is.db.data.frame, 81is.na-method, 83key, 84merge-method, 123names-methods, 126null.data, 127preview, 141sample-methods, 157sort, 160subset-methods, 161unique-methods, 169
∗Topic datasetsabalone, 8
∗Topic factoras.factor-methods, 25
∗Topic madlibgroups, 77madlib.arima, 87madlib.elnet, 91madlib.glm, 96madlib.kmeans, 101madlib.lda, 103madlib.lm, 105madlib.summary, 113madlib.svm, 116perplexity.lda, 129predict.arima, 134predict.bagging.model, 135predict.dt.madlib, 136predict.elnet.madlib, 138predict.lda, 139predict.rf.madlib, 140print, 143print.arima.madlib, 146print.elnet.madlib, 149print.lm.madlib, 150print.summary.madlib, 153
summary, 162summary.arima.madlib, 163summary.elnet.madlib, 164summary.lm.madlib, 165
∗Topic mathAggregate functions, 10Arith-methods, 15as.factor-methods, 25Compare-methods, 32crossprod, 39Func-methods, 70generic.bagging, 72generic.cv, 73groups, 77is.factor-methods, 82is.na-method, 83Logical-methods, 85margins, 120perplexity.lda, 129predict, 131predict.arima, 134predict.bagging.model, 135predict.dt.madlib, 136predict.elnet.madlib, 138predict.lda, 139predict.rf.madlib, 140sample-methods, 157scale, 158summary, 162summary.arima.madlib, 163summary.elnet.madlib, 164summary.lm.madlib, 165
∗Topic methodsas.db.data.frame, 21as.factor-methods, 25by, 26Compare-methods, 32crossprod, 39delete, 60dim-methods, 63Func-methods, 70is.factor-methods, 82Logical-methods, 85merge-method, 123names-methods, 126predict, 131preview, 141sample-methods, 157

INDEX 175
scale, 158sort, 160unique-methods, 169
∗Topic packagePivotalR-package, 4
∗Topic statsAggregate functions, 10generic.bagging, 72generic.cv, 73groups, 77madlib.arima, 87madlib.elnet, 91madlib.glm, 96madlib.lm, 105madlib.summary, 113madlib.svm, 116margins, 120perplexity.lda, 129predict, 131predict.arima, 134predict.bagging.model, 135predict.dt.madlib, 136predict.elnet.madlib, 138predict.lda, 139predict.rf.madlib, 140sample-methods, 157scale, 158summary, 162summary.arima.madlib, 163summary.elnet.madlib, 164summary.lm.madlib, 165
∗Topic utilitiesprint.elnet.madlib, 149print.none.obj, 151print.summary.madlib, 153
∗Topic utilityarray.len, 18arraydb.to.arrayr, 19as.db.data.frame, 21cbind2-methods, 28clean.madlib.temp, 30coef, 31conn.eql, 35conn.id, 36content, 38db.connect, 41db.data.frame, 43db.disconnect, 46
db.existsObject, 48db.list, 49db.objects, 51db.q, 52db.search.path, 57delete, 60eql-methods, 64Extract database connection info,
66Extract-Replace-methods, 68GUI, 79is.db.data.frame, 81is.na-method, 83na.action, 125preview, 141print, 143print-methods, 145print.arima.madlib, 146print.lm.madlib, 150sample-methods, 157sort, 160Type Cast functions, 167
*,db.obj,db.obj-method (Arith-methods),15
*,db.obj,numeric-method(Arith-methods), 15
*,numeric,db.obj-method(Arith-methods), 15
+,character,db.obj-method(Arith-methods), 15
+,db.obj,character-method(Arith-methods), 15
+,db.obj,db.obj-method (Arith-methods),15
+,db.obj,numeric-method(Arith-methods), 15
+,numeric,db.obj-method(Arith-methods), 15
-,character,db.obj-method(Arith-methods), 15
-,db.obj,ANY-method (Arith-methods), 15-,db.obj,character-method
(Arith-methods), 15-,db.obj,db.obj-method (Arith-methods),
15-,db.obj,numeric-method
(Arith-methods), 15-,numeric,db.obj-method

176 INDEX
(Arith-methods), 15.db (db.q), 52/,db.obj,db.obj-method (Arith-methods),
15/,db.obj,numeric-method
(Arith-methods), 15/,numeric,db.obj-method
(Arith-methods), 15<,character,db.obj-method
(Compare-methods), 32<,db.obj,character-method
(Compare-methods), 32<,db.obj,db.obj-method
(Compare-methods), 32<,db.obj,numeric-method
(Compare-methods), 32<,numeric,db.obj-method
(Compare-methods), 32<=,character,db.obj-method
(Compare-methods), 32<=,db.obj,character-method
(Compare-methods), 32<=,db.obj,db.obj-method
(Compare-methods), 32<=,db.obj,numeric-method
(Compare-methods), 32<=,numeric,db.obj-method
(Compare-methods), 32==,character,db.obj-method
(Compare-methods), 32==,db.obj,character-method
(Compare-methods), 32==,db.obj,db.obj-method
(Compare-methods), 32==,db.obj,logical-method
(Compare-methods), 32==,db.obj,numeric-method
(Compare-methods), 32==,logical,db.obj-method
(Compare-methods), 32==,numeric,db.obj-method
(Compare-methods), 32>,character,db.obj-method
(Compare-methods), 32>,db.obj,character-method
(Compare-methods), 32>,db.obj,db.obj-method
(Compare-methods), 32
>,db.obj,numeric-method(Compare-methods), 32
>,numeric,db.obj-method(Compare-methods), 32
>=,character,db.obj-method(Compare-methods), 32
>=,db.obj,character-method(Compare-methods), 32
>=,db.obj,db.obj-method(Compare-methods), 32
>=,db.obj,numeric-method(Compare-methods), 32
>=,numeric,db.obj-method(Compare-methods), 32
[,db.obj,ANY,ANY,ANY-method(Extract-Replace-methods), 68
[<-.db.obj (Extract-Replace-methods), 68[[,db.obj-method
(Extract-Replace-methods), 68[[<-,db.obj,ANY,ANY,character-method
(Extract-Replace-methods), 68[[<-,db.obj,ANY,ANY,db.Rquery-method
(Extract-Replace-methods), 68[[<-,db.obj,ANY,ANY,integer-method
(Extract-Replace-methods), 68[[<-,db.obj,ANY,ANY,logical-method
(Extract-Replace-methods), 68[[<-,db.obj,ANY,ANY,numeric-method
(Extract-Replace-methods), 68$,db.obj-method
(Extract-Replace-methods), 68$<-,db.obj,character-method
(Extract-Replace-methods), 68$<-,db.obj,db.Rquery-method
(Extract-Replace-methods), 68$<-,db.obj,integer-method
(Extract-Replace-methods), 68$<-,db.obj,logical-method
(Extract-Replace-methods), 68$<-,db.obj,numeric-method
(Extract-Replace-methods), 68%/%,db.obj,db.obj-method
(Arith-methods), 15%/%,db.obj,numeric-method
(Arith-methods), 15%/%,numeric,db.obj-method
(Arith-methods), 15%%,db.obj,db.obj-method

INDEX 177
(Arith-methods), 15%%,db.obj,numeric-method
(Arith-methods), 15%%,numeric,db.obj-method
(Arith-methods), 15&,db.obj,db.obj-method
(Logical-methods), 85&,db.obj,logical-method
(Logical-methods), 85&,logical,db.obj-method
(Logical-methods), 85^,db.obj,db.obj-method (Arith-methods),
15^,db.obj,numeric-method
(Arith-methods), 15^,numeric,db.obj-method
(Arith-methods), 15
abalone, 8abs (Func-methods), 70abs,db.obj-method (Func-methods), 70acos,db.obj-method (Func-methods), 70Aggregate functions, 10AIC, 13, 14, 15, 155Arith methods (Arith-methods), 15Arith-methods, 15array.len, 18, 29arraydb.to.arrayr, 19, 142, 143as.character (Type Cast functions), 167as.character,db.obj-method (Type Cast
functions), 167as.data.frame, 24as.data.frame.db.Rquery (preview), 141as.data.frame.db.table (preview), 141as.data.frame.db.view (preview), 141as.Date,db.obj-method (Type Cast
functions), 167as.db.data.frame, 21, 25, 43, 44, 46, 50, 54,
56, 58–60, 62, 81, 128as.db.data.frame,character-method
(as.db.data.frame), 21as.db.data.frame,data.frame-method
(as.db.data.frame), 21as.db.data.frame,db.data.frame-method
(as.db.data.frame), 21as.db.data.frame,db.Rquery-method
(as.db.data.frame), 21as.db.Rview, 55, 56as.db.Rview (as.db.data.frame), 21
as.double (Type Cast functions), 167as.double,db.obj-method (Type Cast
functions), 167as.environment, 24, 25as.factor, 22, 99, 108, 119as.factor,db.obj-method
(as.factor-methods), 25as.factor-methods, 25as.integer (Type Cast functions), 167as.integer,db.obj-method (Type Cast
functions), 167as.interval (Type Cast functions), 167as.list, 18as.list,db.obj-method (cbind2-methods),
28as.logical (Type Cast functions), 167as.logical,db.obj-method (Type Cast
functions), 167as.numeric (Type Cast functions), 167as.numeric,db.obj-method (Type Cast
functions), 167as.time (Type Cast functions), 167as.timestamp (Type Cast functions), 167asin,db.obj-method (Func-methods), 70atan,db.obj-method (Func-methods), 70atan2,db.obj,db.obj-method
(Func-methods), 70atan2,db.obj,numeric-method
(Func-methods), 70atan2,numeric,db.obj-method
(Func-methods), 70
by, 26, 161by,db.obj-method (by), 26
cbind, 18cbind (cbind2-methods), 28cbind2, 18cbind2 (cbind2-methods), 28cbind2,db.obj,db.obj-method
(cbind2-methods), 28cbind2-methods, 28clean.madlib.temp, 30coef, 31, 32col.types (Type Cast functions), 167colAgg (Aggregate functions), 10colMeans,db.obj-method (Aggregate
functions), 10

178 INDEX
colSums,db.obj-method (Aggregatefunctions), 10
Compare methods (Compare-methods), 32Compare-methods, 32conn (Extract database connection
info), 66conn.eql, 35, 37, 42, 47, 49, 67conn.id, 36, 45, 55conn.id<- (conn.id), 36connection info (Extract database
connection info), 66content, 38, 44, 55, 65cos,db.obj-method (Func-methods), 70count (Aggregate functions), 10count,db.obj-method (Aggregate
functions), 10crossprod, 39, 53crossprod,db.obj,ANY-method
(crossprod), 39
data.frame, 141db (db.q), 52db.array, 18, 29, 40, 159, 170db.array (Aggregate functions), 10db.connect, 30, 36, 37, 41, 47, 49, 51, 53, 58,
67db.data.frame, 21, 23, 38, 43, 43, 44, 46, 50,
53–56, 58–60, 62, 64, 65, 89, 94, 98,107, 115, 118, 119, 125, 127, 142,157, 158, 170
db.data.frame-class, 44db.date.style (Type Cast functions), 167db.default.schemas, 41, 42db.default.schemas (db.search.path), 57db.disconnect, 36, 37, 42, 46, 49, 67db.existsObject, 43, 48, 51, 62db.list, 22, 36, 37, 42, 47, 49, 52, 53, 67db.obj, 15, 17, 18, 24, 25, 27, 28, 32, 34, 38,
39, 45, 46, 56, 59, 60, 64, 65, 68, 70,72–74, 80, 82, 85, 86, 88, 91, 109,111, 121, 125, 127, 135, 137, 138,140, 157, 158, 167, 168, 170
db.obj-class, 50db.objects, 43, 51, 53, 62db.q, 52db.Rcrossprod, 39, 142db.Rcrossprod-class, 53db.Rquery, 17, 21–24, 29, 34, 35, 38, 39, 46,
50, 53, 54, 59, 60, 64, 69, 71, 86–88,
124, 125, 127, 132, 135, 138, 142,154–156, 158, 159, 168, 170
db.Rquery-class, 54db.Rview-class (db.Rquery-class), 54db.search.path, 41, 42, 57db.table, 24, 38, 46, 60, 64, 127, 135, 139,
142, 170db.table-class, 58db.view, 24, 38, 46, 59, 64, 127, 142, 170db.view-class, 59dbms (Extract database connection
info), 66dbname (Extract database connection
info), 66delete, 55, 60, 89, 99, 108, 115, 119delete,arima.css.madlib-method
(delete), 60delete,bagging.model-method (delete), 60delete,character-method (delete), 60delete,db.data.frame-method (delete), 60delete,db.Rquery-method (delete), 60delete,dt.madlib-method (delete), 60delete,dt.madlib.grps-method (delete),
60delete,elnet.madlib-method (delete), 60delete,lm.madlib-method (delete), 60delete,lm.madlib.grps-method (delete),
60delete,logregr.madlib-method (delete),
60delete,logregr.madlib.grps-method
(delete), 60delete,summary.madlib-method (delete),
60dgeMatrix, 142dim,db.Rquery-method (dim-methods), 63dim,db.table-method (dim-methods), 63dim,db.view-method (dim-methods), 63dim-methods, 63dspMatrix, 142
eql, 45eql (eql-methods), 64eql,db.obj,db.obj-method (eql-methods),
64eql-methods, 64exp (Func-methods), 70exp,db.obj-method (Func-methods), 70Extract database connection info, 66
INDEX 179
Extract-Replace-methods, 68extractAIC, 14, 15, 155extractAIC.glm.madlib (AIC), 13extractAIC.lm.madlib (AIC), 13extractAIC.logregr.madlib (AIC), 13Extraction methods
(Extract-Replace-methods), 68
factorial (Func-methods), 70factorial,db.obj-method (Func-methods),
70formula, 96, 105, 106, 116, 118Func-methods, 70
generic.bagging, 61, 72, 75, 135, 136, 157generic.cv, 72, 73, 95getTree.rf.madlib, 76grepl (Compare-methods), 32grepl,character,db.obj-method
(Compare-methods), 32groups, 77groups.lm.madlib, 132groups.lm.madlib.grps, 132groups.logregr.madlib, 132groups.logregr.madlib.grps, 132GUI, 79
help, 48host (Extract database connection
info), 66
ifelse, 80ifelse,db.obj-method (ifelse), 80is.db.data.frame, 81is.factor,db.obj-method
(is.factor-methods), 82is.factor-methods, 82is.na,db.obj-method (is.na-method), 83is.na-method, 83
key, 45, 55, 58, 59, 84, 109, 111key<- (key), 84
lk, 20, 23, 24, 27, 39, 46, 50, 54–56, 59, 60,65, 83, 85, 131, 132, 135, 138, 139,146, 159, 161
lk (preview), 141log (Func-methods), 70log,db.obj-method (Func-methods), 70log10 (Func-methods), 70
log10,db.obj-method (Func-methods), 70Logical methods (Logical-methods), 85Logical-methods, 85logLik, 15, 155logLik.glm.madlib (AIC), 13logLik.lm.madlib (AIC), 13logLik.logregr.madlib (AIC), 13lookat, 24, 27, 39, 46, 50, 54, 59, 60, 65, 83,
85, 146, 159, 161lookat (preview), 141
madlib (Extract database connectioninfo), 66
madlib.arima, 30, 61, 62, 77, 87, 99, 102,108, 110, 112, 115, 119, 131, 134,135, 137, 141, 146–148, 152, 163,164, 167
madlib.arima,db.Rquery,db.Rquery-method(madlib.arima), 87
madlib.arima,formula,db.obj-method(madlib.arima), 87
madlib.elnet, 61, 77, 91, 110, 112, 131, 137,138, 141, 148, 149, 152, 164, 167
madlib.glm, 5, 14, 25, 31, 45, 61, 62, 77, 78,89, 96, 106, 108–112, 115, 120–122,126, 131, 132, 137, 141, 145, 148,152, 154, 163, 167, 171
madlib.kmeans, 101, 102madlib.lda, 103, 129, 139madlib.lm, 5, 14, 25, 31, 45, 61, 62, 77, 78,
89, 97, 99, 102, 105, 109–112, 115,119–122, 126, 128, 131, 132, 137,141, 148, 150, 152, 154, 163, 165,167, 171
madlib.randomForest, 76, 77, 109, 140, 141,151, 152
madlib.rpart, 62, 77, 110, 111, 130, 131,136, 137, 141, 147, 148, 152, 166,167
madlib.summary, 5, 45, 61, 62, 77, 89, 99,102, 108, 110, 112, 113, 119, 131,137, 141, 148, 152, 153, 167
madlib.svm, 116margins, 120Math Functions (Func-methods), 70max,db.obj-method (Aggregate
functions), 10mean,db.obj-method (Aggregate
functions), 10

180 INDEX
merge,db.obj,db.obj-method(merge-method), 123
merge-method, 123merge.data.frame, 123, 124min,db.obj-method (Aggregate
functions), 10
na.action, 125na.omit, 91, 96, 106, 116, 121na.omit,db.obj-method (na.action), 125names,db.obj-method (names-methods), 126names-methods, 126names<-,db.obj-method (names-methods),
126null.data, 127
par, 166perplexity.lda, 129PivotalR, 151PivotalR (GUI), 79pivotalr (GUI), 79PivotalR-package, 4plot.dt.madlib, 111, 112, 130, 148, 166, 167plot.rpart, 130port (Extract database connection
info), 66predict, 131predict.arima, 134predict.arima.css.madlib, 30, 89, 137,
141predict.bagging.model, 72, 135predict.dt.madlib, 111, 112, 136, 141, 167predict.elnet.madlib, 137, 138, 141predict.lda, 139predict.lm.madlib, 78, 136–138, 141predict.lm.madlib.grps, 78predict.logregr.madlib, 78, 136–138, 141predict.logregr.madlib.grps, 78predict.rf.madlib, 77, 109, 110, 140, 141preview, 141print, 143print,db.data.frame-method
(print-methods), 145print,db.Rquery-method (print-methods),
145print-methods, 145print.arima.css.madlib, 89, 164print.arima.css.madlib
(print.arima.madlib), 146
print.arima.madlib, 146print.dt.madlib, 111, 112, 131, 147, 167print.elnet.madlib, 149print.lm.madlib, 45, 150print.logregr.madlib, 45print.margins (margins), 120print.none.obj, 151print.rf.madlib, 77, 109, 110, 151print.rpart, 147print.summary.madlib, 153
relevel, 122relevel,db.obj-method
(as.factor-methods), 25Replacement methods
(Extract-Replace-methods), 68residuals, 154, 154Row_actions, 155rowMeans,db.obj-method (Row_actions),
155rowSums,db.obj-method (Row_actions), 155
sample,db.obj-method (sample-methods),157
sample-methods, 157scale, 158scale,db.obj-method (scale), 158schema.madlib (Extract database
connection info), 66sd (Aggregate functions), 10sd,db.obj-method (Aggregate functions),
10show,db.data.frame-method
(print-methods), 145show,db.Rquery-method (print-methods),
145show.arima.css.madlib, 89show.arima.css.madlib
(print.arima.madlib), 146show.elnet.madlib (print.elnet.madlib),
149show.glm.madlib (print), 143show.lm.madlib (print.lm.madlib), 150show.logregr.madlib (print), 143show.summary.madlib
(print.summary.madlib), 153sign (Func-methods), 70sign,db.obj-method (Func-methods), 70sin,db.obj-method (Func-methods), 70

INDEX 181
sort, 160sort,db.obj-method (sort), 160sqrt (Func-methods), 70sqrt,db.obj-method (Func-methods), 70subset,db.obj-method (subset-methods),
161subset-methods, 161sum,db.obj-method (Aggregate
functions), 10summary, 162summary,db.obj-method (madlib.summary),
113summary.arima.css.madlib, 89summary.arima.css.madlib
(summary.arima.madlib), 163summary.arima.madlib, 163summary.elnet.madlib, 164summary.lm.madlib, 165
tan,db.obj-method (Func-methods), 70Terms (margins), 120terms, 94, 98, 107, 119text.dt.madlib, 111, 112, 131, 148, 166Type Cast functions, 167
unique,db.obj-method (unique-methods),169
unique-methods, 169user (Extract database connection
info), 66
var (Aggregate functions), 10var,db.obj-method (Aggregate
functions), 10Vars (margins), 120vcov, 170
with (as.environment), 24