Embed Size (px)
Citation preview

Pacific vs. Indian Ocean warming:
How does it matter for global and regional climate change?
Joseph J. Barsugli
Sang-Ik Shin
Prashant D. SardeshmukhNOAA-CIRES Climate Diagnostics Center
Boulder, Colorado
NOAA Photo Library

Global Mean Surface Air Temperature DJF
Global Mean Precipitation DJF
A: Opposing Temperature and Precipitation Sensitivity to Tropical SSTs across 110E
Q: How does it matter for global (DJF) climate change?

Q: How does it matter for regional (NH Wintertime) climate change?
A: Opposing PNA and NAO Sensitivity to Tropical SSTs across 110-120E, with PNA emphasizing the central and eastern Pacific more.

• Method and Context (How did we get these plots and why do we believe them?)
• Understanding Opposing T, p sensitivity• Seasonal cycle in T, p sensitivity• PNA and NAO sensitivity with application to
50 year trend.

SST Patch Experiments with NCAR CCM3.10
43 SST anomaly patches total. 2K maximum anomaly
Indo-Pacific•32 ensemble members (16 Warm, 16 Cold)•18 month runs (2 winters, 1 summer)
Atlantic•40 ensemble members (20 warm, 20 Cold) •25 month runs
Climatology•100 year fixed climo-SST run
1 K
0.5K
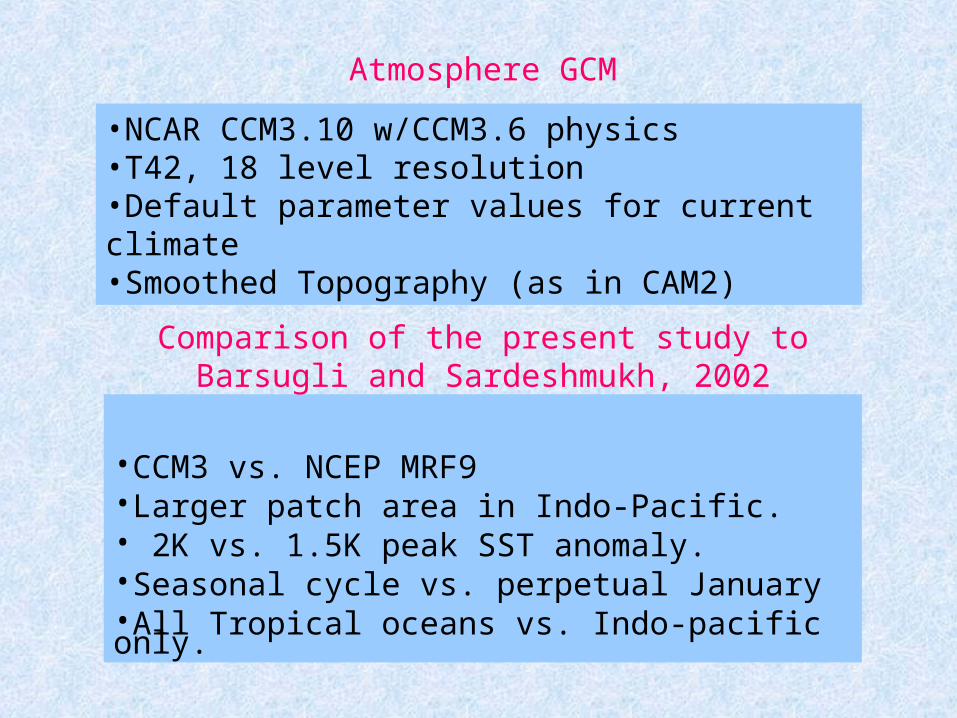
•NCAR CCM3.10 w/CCM3.6 physics •T42, 18 level resolution•Default parameter values for current climate•Smoothed Topography (as in CAM2)
•CCM3 vs. NCEP MRF9•Larger patch area in Indo-Pacific.• 2K vs. 1.5K peak SST anomaly.•Seasonal cycle vs. perpetual January•All Tropical oceans vs. Indo-pacific only.
Comparison of the present study to Barsugli and Sardeshmukh, 2002
Atmosphere GCM

Think of this as an “empirical linearization” about a given climate.
For a grid of T, or for a set of patches this becomes:
Note the Area Factor. This means that the grid-independent Green Function (and sensitivity) has units of
Indo-Pacific Patches ~ 12 SSTU; Atlantic Patches ~ 7.5 SSTU
Green Function approximation

Barsugli and Sardeshmukh, 2002

Simmons, Wallace, and Branstator, 1983
•Barotropic vorticity forcing
•“nodal line” for Pacific target? This is similar to patterns in Branstator et al, 1985 from explicit Green function approach.
•Hmmm, what about the forcing of North Atlantic….•Newman and Sardeshmukh, 1998. Strong seasonal dependence of sensitivity.

Ting and Sardeshmukh, 1993
•Linear Baroclinic Model. Deep heating.
•Remote response switches sign across 120E.
•Little remote response near “nodal line” at 120E.
•Local (rotational) response moves with forcing
•Heating is used as forcing, not SST.
•Nodal line not found when GFDL model basic state is used.

• Hoerling et al. (2004). Indian ocean SST’s force 50 year trend in North Atlantic “NAO”-like pattern. Found in 3 models.
• Branstator(2004) Circumglobal Waveguide Pattern responds more to forcing at the date line than to forcing at 150 W. The latter forcing results in a more isolated PNA pattern.

Temperature and Precipitation Sensitivity
Global Mean Precipitation DJF

Global Mean Surface Air Temperature DJF
Regions for Composites

Composite Surface Air Temperature
Indian Ocean
West Pacific Ocean

Composite Precipitation
Indian Ocean
West Pacific Ocean

Indian Ocean Patch Composite
Surface Latent Heat Flux
U-Wind Stress
V-Wind Stress
500 hPa Omega

W. Pacific Ocean Patch Composite
Surface Latent Heat Flux
U-Wind Stress
V-Wind Stress
500 hPa Omega

Precipitation Sensitivity – Seasonal Cycle
ANNUAL
MAM
DJF
JJA
SON

Surface Temperature

850 hPa Temperature

Annual Mean Temperature at different levels

NAO, PNA and Trends

NAO and PNA sensitivity
PNA MRF9
PNA
- NAO

PNA in detail

1950-1999 Trend in 500 hPa Z – NCEP Reanalysis
Pacific Sector
Atlantic Sector
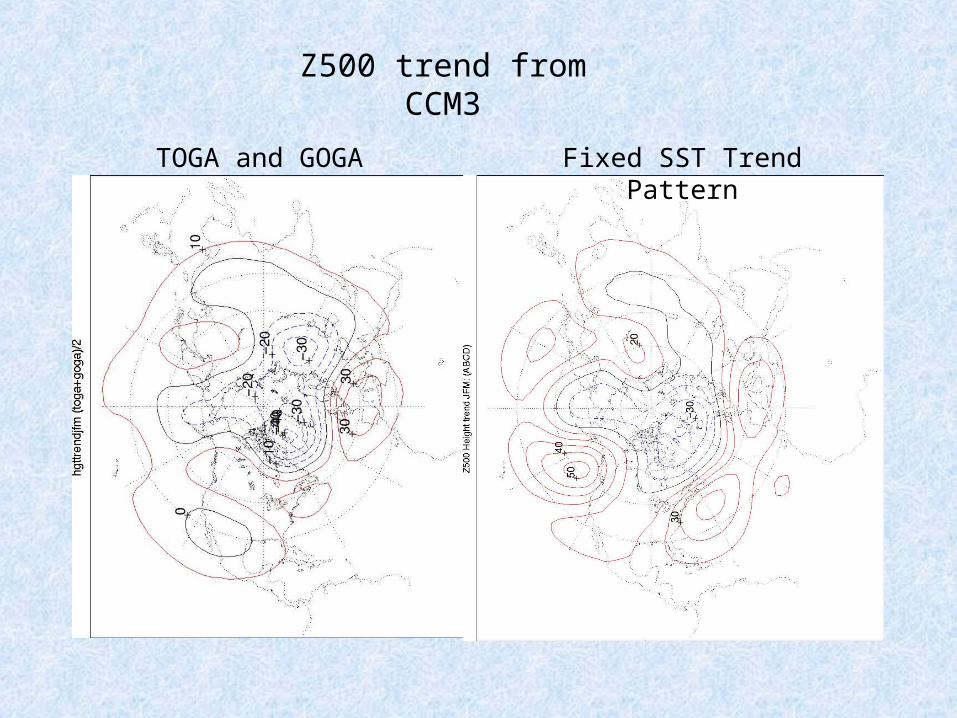
Z500 trend from CCM3
TOGA and GOGA Fixed SST Trend Pattern
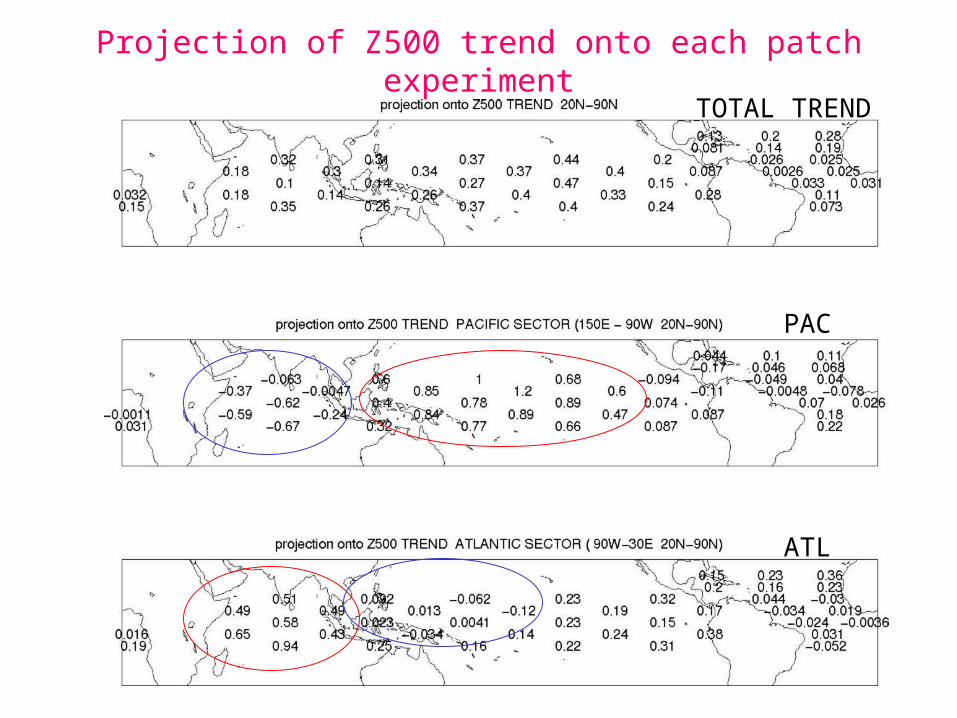
PAC
ATL
TOTAL TREND
Projection of Z500 trend onto each patch experiment

Pattern Correlation

Conclusions …
• There is opposing sensitivity to SST anomalies across longitude ~110E for global mean temperature and precipitation. E.g. warm SST anomalies in most of the Tropical Indian Ocean lead to a global mean cooling of the surface ( mainly land), cooling at 850 mb, and a reduction in global mean precipitation.
• The opposing temperature sensitivity is confined to the DJF season and is largest in the northern continents. The opposing sensitivity for precipitation is evident all year, and there is an additional area of negative sensitivity in the Eastern Pacific, south of the Equator.
• There is opposing sensitivity to SST anomalies across the same “nodal line” for the NAO and PNA pattern. Compared to the NAO, the PNA shows more sensitivity to SST’s at and east of the dateline.
• Therefore, the relative warming of the Indian and West Pacific warm pools will have a large impact on both global and (Northern Hemisphere) regional response to Tropical SST changes in DJF. Prediction (or past and paleo- reconstruction) of this broad spatial pattern of SST change is essential to get the global and regional picture correct.

… Conclusions• Because the “nodal line” was seen in BS2002 and earlier,
more idealized dynamical studies, we believe it to be a robust structure in the atmosphere of dynamical origin. The temperature sensitivity follows from the circulation anomalies. However, the origin of the coincident nodal line in Tropical precipitation remains uncertain.
• The Tropical Atlantic SST’s are generally more influential in JJA …for the global mean quantities.
• The full picture of Tropical-Extratropical interaction is a) more complicated than just ENSO, but not that much more complicated: 2-3 regions do pretty well to capture the changes that have a big global impact.
• Prashant will elaborate on the big picture at tomorrow’s talk.