Embed Size (px)
Citation preview

i
Agenda Item F.4.a Project Team Report
November 2016
MODIFICATIONS TO:
PACIFIC COAST GROUNDFISH ESSENTIAL FISH HABITAT
AND
TRAWL ROCKFISH CONSERVATION AREAS
(AMENDMENT 28 TO THE PACIFIC COAST GROUNDFISH FISHERY MANAGEMENT PLAN)
DESCRIPTION AND ANALYSIS OF ALTERNATIVES FOR
COUNCIL DECISION-MAKING
Pacific Fishery Management Council 7700 NE Ambassador Place, Suite 101
Portland, OR 97220
November 2016

i
Table of Contents 1. INTRODUCTION .................................................................................................................................... 1
1.1 Purpose and Need ......................................................................................................................... 2
1.2 History of Council Action ............................................................................................................. 3
2. DESCRIPTION OF ALTERNATIVES ....................................................................................................... 6 2.1 Preliminary Preferred Alternatives ............................................................................................... 8
2.2 Description of Fishery Management Action Alternatives ............................................................ 9
Subject Area 1. EFHCA changes contained in public proposals .......................................... 9
Subject Area 2. New EFHCAs within the current trawl RCA ............................................ 16
Subject Area 3. Adjustments to the trawl RCA .................................................................. 18
3. AFFECTED ENVIRONMENT ................................................................................................................ 26 3.1 Fish Resources ............................................................................................................................ 26
3.2 Protected Resources .................................................................................................................... 27
ESA-Listed Fishes............................................................................................................... 27
Marine Mammals ................................................................................................................ 32
Marine Turtles ..................................................................................................................... 39
Sea Birds ............................................................................................................................. 39
3.3 Habitat and Ecosystem Elements ................................................................................................ 42
California Current Large Marine Ecosystem ...................................................................... 42
Physical and Biological Oceanography .............................................................................. 43
Marine Protected Areas ....................................................................................................... 43
West Coast Biogeography ................................................................................................... 43
4. ANALYSIS OF EFFECTS ...................................................................................................................... 45 4.1 Analytical Approach ................................................................................................................... 45
Metrics ................................................................................................................................ 45
Analytical Levels ................................................................................................................ 49
4.2 Analysis by Alternative ............................................................................................................... 54
Subject Area 1: EFHCA changes contained in public proposals ........................................ 54
Subject Area 2: New EFHCAs within the current RCA ..................................................... 66
Subject Area 3: Adjustments to the Trawl RCA ................................................................. 70
5. SYNTHESIS ANALYSIS OF EFH AND RCA ALTERNATIVES ........................................................... 100
5.1 Alternative 1b, Collaborative and Alternative 3.b, Eliminate trawl RCA ................................ 101
5.2 Alternative 1.c, Oceana et al. and Alternative 3.b, Eliminate RCA .......................................... 101
6. REFERENCES .................................................................................................................................... 102

ii
List of Tables
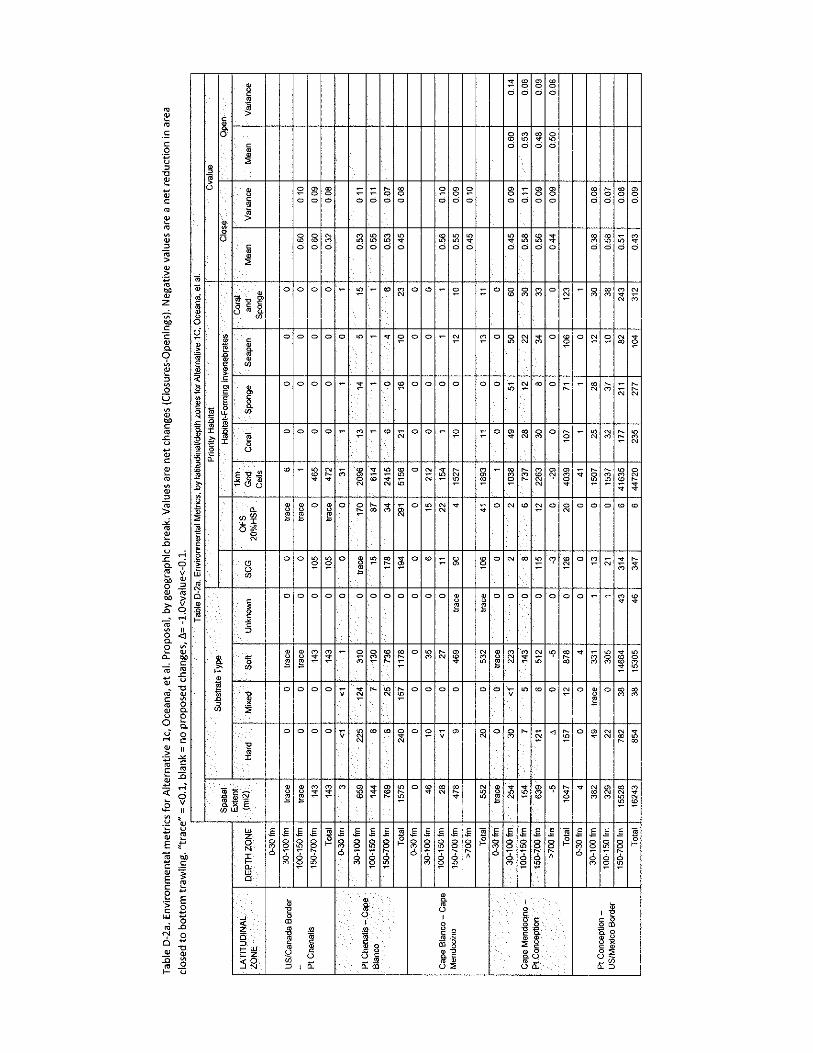
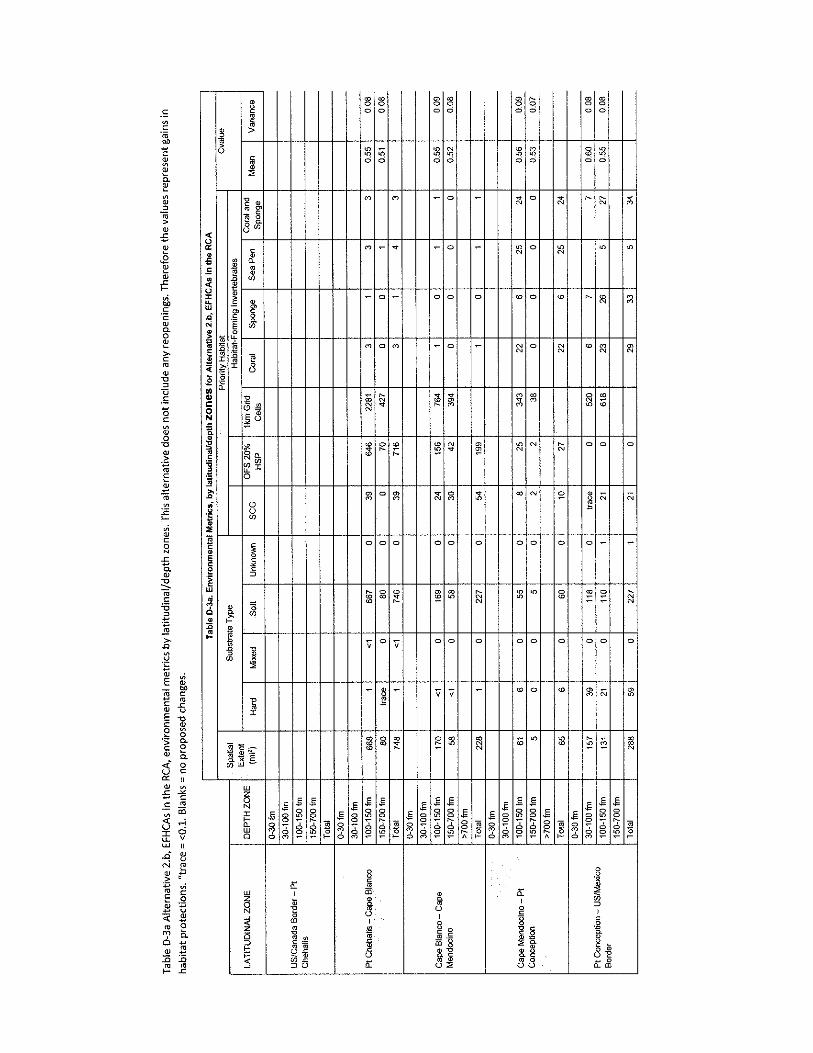
Table 1. Fishery Management Action Alternatives for EFH and RCA Modifications ................................. 6 Table 2. Administrative Actions Amending Groundfish Fishery Management Plan Appendices and Processes ....................................................................................................................................................... 7 Table 3. Trawl RCA boundaries for vessels using groundfish bottom trawl gear in 2015 ......................... 19 Table 4. List of IFQ Species in the Shorebased IFQ Program 2015 ........................................................... 20 Table 5. List of Species managed with trip limits in the shorebased IFQ program in 2015 ....................... 21 Table 6. Listing status, critical habitat designation, and protective regulations for ESA listed fishes. ...... 28 Table 7. Salmon mortality (number of fish) by species and fishing sector in Pacific Coast Groundfish Fisheries, 2002-2013 ................................................................................................................................... 29 Table 8. Observed numbers of green sturgeon bycatch from bottom trawl catch shares fishery (2011-2014) .................................................................................................................................................................... 31 Table 9. Observed bycatch numbers of eulachon from bottom and midwater trawl catch share fishery (2011-2014). .......................................................................................................................................................... 32 Table 10. Marine mammals occurring off the West Coast ......................................................................... 33 Table 11. Total number of interactions with marine mammal species for the bottom trawl fishery, 2002-2014. ........................................................................................................................................................... 35 Table 12. Type and number of marine mammal interactions observed in the bottom trawl fishery across all years (2002-2014) and all species ............................................................................................................... 36 Table 13. Interaction type for each marine mammal species in the bottom trawl fishery, 2002-2014 ....... 37 Table 14. Number of seabird interactions observed in the bottom trawl fishery across all years by species .................................................................................................................................................................... 40 Table 15. Number of seabird interactions observed in the bottom trawl fishery across all years (2002-2014) and all species. ............................................................................................................................................ 41 Table 16. Environmental metrics for Alternative 1a No Action ................................................................. 55 Table 17. Environmental metrics for Alternative 1.b Collaborative ........................................................... 56 Table 18. Total (count and weight in lb.) protected fish species interactions observed in proposed EFH closed areas for each proposal .................................................................................................................... 57 Table 19. Environmental metrics for Alternative 1c - Oceana et al ............................................................ 59 Table 20. Total (count and weight in lb.) protected fish species interactions observed in proposed EFH closed areas for each alternative. 2011-2014 observed data ....................................................................... 60 Table 21. Spatial extent (mi2) of current EFHCAs compared to the changes resulting from the other Subject Area 1 alternatives ...................................................................................................................................... 61 Table 22. Comparison of the spatial extent (mi2) of the substrate types closed or reopened to bottom trawling by Subject Area 1 alternatives ...................................................................................................... 63 Table 23. Comparison of the spatial extent (mi2) of the priority habitat types closed or reopened to bottom trawling by Subject Area 1 alternatives ...................................................................................................... 64 Table 24. Mean conservation value (± 1 s.d.) for each alternative ............................................................. 65 Table 25. Total (count and weight in pounds) protected fish species interactions observed in proposed EFHCAs for each proposal ......................................................................................................................... 65 Table 26. Miles of bottom trawling and percent of coastwide bottom trawl effort displaced or restored and net change for Subject Area 1 alternatives .................................................................................................. 66 Table 27. Environmental metrics for Alternative 2a, No Action ................................................................ 67 Table 28. Environmental metrics for Alternative 2b EFHCAs in the trawl RCA ...................................... 68 Table 29. Physical and Biological metrics for the current Trawl RCA. ..................................................... 71 Table 30. Total length (miles) of commercial tows, total number of vessels and total number of tows that occurred from 1998-2001 in the Groundfish Trawl RCA. .......................................................................... 73 Table 31. Average annual catch and average annual value by fish category for 1998-2001 for the Groundfish Trawl RCA .................................................................................................................................................. 74 Table 32. Average annual catch and average annual value for the five overfish species for 1998-2001 for the Groundfish Trawl RCA ......................................................................................................................... 74

iii
Table 33. Physical and biological metrics for all discrete area closures combined .................................... 80 Table 34. Physical and Biological Metrics for DAC grouped by Overfished Species ............................... 81 Table 35. Observed catch (count and weight lb) of protected fish species in discrete area closures .......... 84 Table 36. Marine mammals observed that were killed by bottom trawl gear in the DACs ........................ 85 Table 37. Marine mammal interactions by species and interaction type in the DACs ............................... 86 Table 38. Seabirds observed that were feeding on catch near bottom trawl gear in the DACs. ................. 86 Table 39. Total length (miles) of commercial tows, total number of vessels and total number of tows that occurred from 2011-2014 within the boundaries of the DAC groupings ................................................... 88 Table 40. Physical and biological metrics for block area closures ............................................................. 90 Table 41. Observed catch (counts and weight lb) of protected fish species by block area closure (2011-2014). .......................................................................................................................................................... 95 Table 42. Observed marine mammal interactions form 2011 to 2014 in the proposed BACs. .................. 95 Table 43. Observed seabird interactions form 2011 to 2014 in the proposed BACs. ................................. 96 Table 44. Total length (miles) of commercial tows, total number of vessels and total number of tows that occurred from 2011-2014 within the boundaries of the DAC groupings ................................................... 99 Table 45. Synthesis of environmental metrics for EFHCA alternatives with and without eliminating the trawl RCA. ................................................................................................................................................ 100
iv
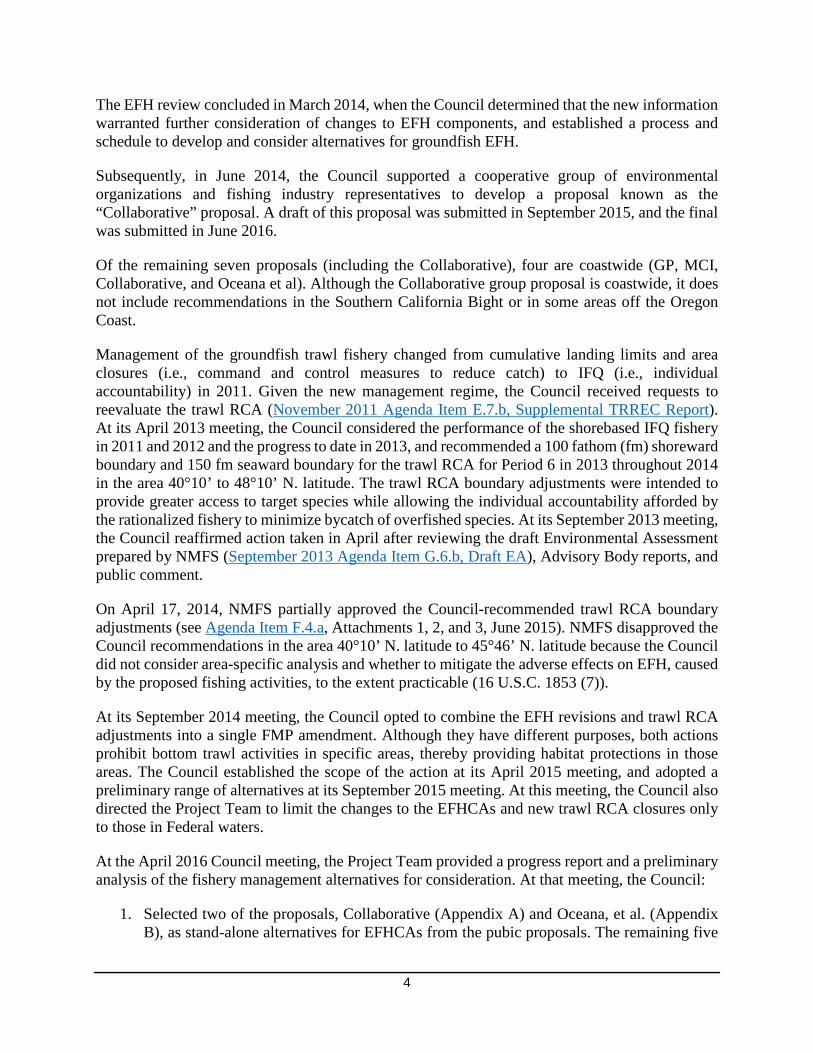
List of Figures
Figure 1. Current EFH conservation areas. ................................................................................................. 10 Figure 2. Collaborative proposal for areas reopened and closed to bottom trawling. ................................. 12 Figure 3. Oceana et al proposal for areas reopened and closed to bottom trawling. ................................... 15 Figure 4. Priority habitats within current trawl RCAs under Alternative 2b. ............................................. 17 Figure 5. Proposed discrete area closures for overfished species under Alternative 3c. ............................ 22 Figure 6. Proposed Block Area Closures under Alternative 3d. ................................................................. 25 Figure 7. Chinook bycatch in the IFQ bottom trawl fishery, 2011 to 2014. ............................................... 30 Figure 8. Calculation of habitat-forming invertebrate metric. .................................................................... 47 Figure 9. Latitudinal breaks and depth zones used in the analysis. ............................................................ 51 Figure 10. Port groups used in the analysis. ............................................................................................... 53 Figure 11. Habitat makeup of the current Groundfish Trawl RCA. ........................................................... 72 Figure 12. Example of hotspot polygons by species. Points are individual hauls that were statistically significant in relationship to each other. ..................................................................................................... 78 Figure 13. Discrete area closure polygons. ................................................................................................. 79 Figure 14. Substrate make-up of each discrete area closure.. ..................................................................... 82 Figure 15. Habitat make-up of each block area closure. ........................................................................... 92

v
List of Acronyms ACL Annual Catch Limit BAC Block Area Closure CBNMS Cordell Bank National Marine Sanctuary CFR Code of Federal Regulations CPS Costal Pelagic Species CPUE catch per unit of effort DAC Discrete Area Closure EEZ Exclusive Economic Zone EFH Essential Fish Habitat EFHCA Essential Fish Habitat Conservation Area EFP Exempted Fishing Permit EIS Environmental Impact Statement ESA Endangered Species Act ESU Evolutionary Significant Unit fm fathom FMA Fishermen’s Marketing Association FMP fishery management plan FRAM NOAA’s Fishery Resource Analysis and Monitoring ft feet GAP Groundfish Advisory Subpanel GFNMS Gulf of the Farallones National Marine Sanctuary GIS Geographic Information System GMT Groundfish Management Team GP Greenpeace HAPC Habitat Areas of Particular Concern HMS Highly Migratory Species IBQ individual bycatch quota IFQ individual fishing quota LME Large Marine Environment m meter MBNMS Monterey Bay National Marine Sanctuary MBTA Migratory Bird Treaty Act MCI Marine Conservation Institute MMPA Marine Mammal Protection Act MPA Marine Protected Area MSA Magnuson-Stevens Fishery Conservation and Management Act mt metric ton NEPA National Environmental Policy Act nm nautical miles NMFS National Marine Fisheries Service NOAA National Oceanic and Atmospheric Administration NRDC Natural Resources Defense Council NWFSC Northwest Fisheries Science Center OSU Oregon State University PacFIN Pacific Fishery Information Network POP Pacific Ocean perch PPA Preliminary Preferred Alternative RCA Rockfish Conservation Area SAFE Stock Assessment and Fishery Evaluation U&A Usual and Accustomed WCGOP West Coast Groundfish Observer Program

1
1. Introduction
The groundfish fisheries in the exclusive economic zone (EEZ) off the West Coast of the United States are managed under the Pacific Coast Groundfish Fishery Management Plan (FMP). The FMP was prepared by the Pacific Fishery Management Council (Council) under the Magnuson-Stevens Fishery Conservation and Management Act (MSA). The FMP includes 90 species of groundfish that are harvested using both commercial and recreational gear off of Washington, Oregon, and California. This document presents a description and analysis of the proposed fishery management alternatives for Amendment 28 to the FMP. The alternatives for consideration include changes to the essential fish habitat conservation areas (EFHCAs) and adjustments to the trawl Rockfish Conservation Area (RCA). The MSA mandates that each regional fishery management council designate essential fish habitat (EFH) for the species that they manage. EFH is defined as ‘‘those waters and substrate necessary to fish for spawning, breeding, feeding or growth to maturity.’’ Under this authority, the National Marine Fisheries Service (NMFS) and the Council have developed a comprehensive strategy to conserve EFH, including its identification and the implementation of measures to minimize adverse impacts to EFH from fishing, such as the establishment of EFHCAs which are areas closed to certain types of bottom-contact gear to protect the important habitat features found there. In addition to potential EFH revisions, this analysis also covers proposed modifications to RCAs. RCAs are large scale areas that extend along the entire length of the West Coast of the United States that are closed to bottom trawling in order to protect overfished groundfish species. The RCA boundaries are lines that connect a series of latitude and longitude coordinates that approximate particular depth contours of the continental shelf from 30 to 700 fathoms. RCA boundaries may and do change seasonally according to conservation needs. Fishing prohibitions associated with RCAs are in addition to those associated with EFHCAs; some EFHCAs are present within the boundaries of the RCA. The alternatives presented for consideration by the Council would potentially: 1) revise the current EFHCAs, using updated information, to minimize adverse effects of fishing on important habitats; and 2) modify the trawl RCA to provide greater access to target species while continuing to minimize catch of overfished species. The National Environmental Policy Act of 1969 (NEPA) requires that prior to undertaking a major federal action, the acting agency must conduct an analysis of the short- and long-term impacts on the human environment, which includes biological, physical, social and economic impacts. Given that Amendment 28 has the potential to affect physical, biological, social, and economic features of the human environment, this analytical document was prepared to inform both the Council, as it selects its preliminary preferred alternative (PPA), and the public, and a NEPA analysis will be prepared that evaluates the alternatives, including the PPA.

2
1.1 Purpose and Need
Amendment 28 to the FMP intends to accomplish several goals. Three are fishery management-related goals: (1) consider revising the EFH components of the FMP; (2) consider modifications to the trawl RCA; and (3) consider using the discretionary authorities in the MSA to protect deep-sea benthic habitats, including deep sea corals, from the adverse effects of fishing. In addition, there are several administrative goals. In order to achieve these three goals, the Council, in coordination with the National Marine Fisheries Service (NMFS), has identified multiple purposes and needs for the proposed action. These purposes and needs fall into two categories: (1) fishery management; and (2) administrative actions. Each purpose is paired with its associated need: Category 1: Fishery Management P1: Minimize the adverse effects of fishing on EFH to the extent practicable. N1: Consider new information on seafloor habitats, the distribution of fishing effort, the
distribution of deep-sea corals, and new ecosystem-related products as they relate to protecting EFH from the adverse effects of fishing.
P2: Evaluate and revise the RCA closures to minimize bycatch of a particular species or species
group, primarily those that are overfished. N2: Consider the RCAs in light of the 2011 implementation of the Shorebased Individual
Fishing Quota Program (IFQ). P3: Protect benthic habitats, including deep-sea corals, from the adverse effects of fishing. N3: Consider new discretionary MSA authorities under Section 303(b) that can be used to
protect species and habitats, including deep-sea corals. Category 2: Administrative Actions P4: Establish experimental and control areas within groundfish EFH to support research-based
information on habitat impacts from fishing activities. N4: Consider the need for scientific research on the effects of fishing activities on EFH,
consistent with EFH regulatory guidance and the groundfish FMP. P5: Revise the groundfish EFH research and information needs. N5: Revise the research and information needs for groundfish, EFH based on consideration of
new information on seafloor habitats, the distribution of fishing effort, and the distribution of deep-sea corals.
P6: Develop a more detailed description of the process to review and revise the EFH
components of the groundfish FMP, including development of criteria prior to the next review cycle that would help inform potential modifications to EFH.
N6: Provide for a more efficient process for reviewing and revising groundfish EFH. P7: Revise Appendix B to the groundfish FMP: Essential Fish Habitat. N7: Consider new information on the adverse effects of the groundfish fishery on EFH as it

3
relates to the information in Appendix C, Part 2 of the groundfish FMP. P8: Revise Appendix C, Part 2 to the groundfish FMP: “The Effects of Fishing on Habitat:
West Coast Perspective.” N8: Consider new information on groundfish EFH components, including major prey species,
as it relates to the information in Appendix B of the groundfish FMP. P9: Revise Appendix D to the groundfish FMP: “Nonfishing Effects on West Coast Groundfish
Essential Fish Habitat and Recommended Conservation Measures.” N9: Consider new information on the non-fishing activities that may adversely affect
groundfish EFH and conservation measures to avoid, minimize, or mitigate those effects as it relates to the information in Appendix D to the groundfish FMP.
The EFH fishery management actions are not intended to apply to, supersede, or otherwise affect management of state - managed species in state waters.
1.2 History of Council Action
Pacific Coast groundfish EFH was first established in 1998, in accordance with the 1996 Sustainable Fisheries Act (the MSA), and was incorporated into the fishery management plan as part of Amendment 11. In addition to describing EFH for West Coast groundfish, Amendment 11 also defined optimum yield, and overfishing rates and thresholds.
In response to a lawsuit (American Oceans Campaign v. Daley, 183 F. Supp. 2d 1 (D.D.C. 2000)), EFH was revised in 2006 by Amendment 19 to the Groundfish FMP. The Council established the overall description of EFH; established habitat areas of particular concern (HAPCs); described the adverse effects to EFH from fishing and established EFHCAs to minimize those effects; described the life history, habitat, and major prey items of groundfishes; and established a process for the review and revision of EFH.
The Council’s periodic review of groundfish EFH, required by the NMFS regulatory guidance (50 CFR §600.815(10)), began in December 2010. In 2013 the Council issued a request for proposals for potential changes to the EFH provisions of the groundfish FMP. Eight proposals were submitted and of these, two were subsequently withdrawn. The eight original proposals were:
• Environmental Defense Fund (withdrawn) • Fishermen’s Marketing Association (FMA) • Greenpeace (GP) • Gulf of the Farallones National Marine Sanctuary (GFNMS) • Marine Conservation Institute (MCI) • Monterey Bay National Marine Sanctuary (MBNMS) • Oceana/Natural Resources Defense Council/Oceana/Ocean Conservancy (Oceana et al) • Olympic Coast National Marine Sanctuary (withdrawn)
4
The EFH review concluded in March 2014, when the Council determined that the new information warranted further consideration of changes to EFH components, and established a process and schedule to develop and consider alternatives for groundfish EFH.
Subsequently, in June 2014, the Council supported a cooperative group of environmental organizations and fishing industry representatives to develop a proposal known as the “Collaborative” proposal. A draft of this proposal was submitted in September 2015, and the final was submitted in June 2016.
Of the remaining seven proposals (including the Collaborative), four are coastwide (GP, MCI, Collaborative, and Oceana et al). Although the Collaborative group proposal is coastwide, it does not include recommendations in the Southern California Bight or in some areas off the Oregon Coast.
Management of the groundfish trawl fishery changed from cumulative landing limits and area closures (i.e., command and control measures to reduce catch) to IFQ (i.e., individual accountability) in 2011. Given the new management regime, the Council received requests to reevaluate the trawl RCA (November 2011 Agenda Item E.7.b, Supplemental TRREC Report). At its April 2013 meeting, the Council considered the performance of the shorebased IFQ fishery in 2011 and 2012 and the progress to date in 2013, and recommended a 100 fathom (fm) shoreward boundary and 150 fm seaward boundary for the trawl RCA for Period 6 in 2013 throughout 2014 in the area 40°10’ to 48°10’ N. latitude. The trawl RCA boundary adjustments were intended to provide greater access to target species while allowing the individual accountability afforded by the rationalized fishery to minimize bycatch of overfished species. At its September 2013 meeting, the Council reaffirmed action taken in April after reviewing the draft Environmental Assessment prepared by NMFS (September 2013 Agenda Item G.6.b, Draft EA), Advisory Body reports, and public comment.
On April 17, 2014, NMFS partially approved the Council-recommended trawl RCA boundary adjustments (see Agenda Item F.4.a, Attachments 1, 2, and 3, June 2015). NMFS disapproved the Council recommendations in the area 40°10’ N. latitude to 45°46’ N. latitude because the Council did not consider area-specific analysis and whether to mitigate the adverse effects on EFH, caused by the proposed fishing activities, to the extent practicable (16 U.S.C. 1853 (7)).
At its September 2014 meeting, the Council opted to combine the EFH revisions and trawl RCA adjustments into a single FMP amendment. Although they have different purposes, both actions prohibit bottom trawl activities in specific areas, thereby providing habitat protections in those areas. The Council established the scope of the action at its April 2015 meeting, and adopted a preliminary range of alternatives at its September 2015 meeting. At this meeting, the Council also directed the Project Team to limit the changes to the EFHCAs and new trawl RCA closures only to those in Federal waters.
At the April 2016 Council meeting, the Project Team provided a progress report and a preliminary analysis of the fishery management alternatives for consideration. At that meeting, the Council:
1. Selected two of the proposals, Collaborative (Appendix A) and Oceana, et al. (Appendix B), as stand-alone alternatives for EFHCAs from the pubic proposals. The remaining five

5
proposals were eliminated as stand-alone alternatives. However, the Council directed the Project Team to analyze the individual polygons within these proposals, as well as the polygons on which the Collaborative could not reach consensus, to inform selection of the PPA at the November, 2016, meeting.
2. Eliminated the distinction between “verified” and “modeled” habitats in the trawl RCA and combined the two action alternatives into a single alternative. The presence of priority habitats, as identified in Amendment 19, can therefore be based on either modeled or verified habitat.
3. Defined “priority habitats” for identifying and proposing EFHCAs in the trawl RCA. These habitats were defined in the environmental impact statement (EIS) for Amendment 19, where they were referred to as “complex sensitive habitats” and used to identify areas for protection from fishing activities. They include:
a. Hard substrate b. Habitat-forming invertebrates (i.e., biogenic habitats) c. Submarine canyons and gullies d. Untrawlable areas (trawl hangs and abandoned trawl survey stations) e. Seamounts f. Highest 20 percent habitat suitability for overfished groundfish species as defined
by NOAA. 4. Recommended all four trawl RCA alternatives move forward for more detailed analysis,
as necessary. 5. Selected Subject Areas 4-10 as PPAs (see Table 1 and Table 2). 6. Eliminated from consideration, at this time, any changes to the EFHCAs or trawl RCA in
the usual and accustomed fishing grounds of the four Washington Coastal treaty tribes (Makah Tribe, Quileute Tribe, Hoh Tribe, and Quinault Indian Nation). NMFS is continuing to work with the tribes to ensure that adequate measures are in place to conserve essential fish habitat and overfished species within their usual and accustomed fishing areas.

6
2. Description of Alternatives
The alternatives depicted here are organized by “subject area”, which are numbered 1 through 10. Subject Areas 1-4 are fishery management actions (Table 1). Each alternative in these subject areas has a level of potential effect on natural resources and human reliance on those resources to require NEPA analysis through an environmental impact statement (EIS).
Table 1. Fishery Management Action Alternatives for EFH and RCA Modifications
Subject Area Alternatives
1. EFHCA changes contained in public proposals (re-openings and new closures)
1.a No Action
1.b Collaborative
1.c Oceana, et al.
2. New EFHCAs within current RCAs
2.a No Action
2.b Add new EFHCAs within the trawl RCA based on presence of priority habitats
3. Adjustments to Trawl RCA
3.a No Action
3.b Remove the trawl RCA
3.c Discrete area closures for overfished species
3.d Block area closures for overfished species and non-overfished species
4. Use MSA Sec. 303(b) discretionary authorities
4.a No Action
4.b Use MSA Sec. 303(b)(2)(A), 303(b)(2)(B), or 303(b)(12) to close waters deeper than 3,500 m to bottom contact gear, consistent with September 2015 Agenda Item H.8.a, Supplemental NMFS Report. (Preliminary Preferred)

7
Subject Areas 5-10 are administrative actions (Table 2). NMFS has determined that these actions do not rise to the level of a “major federal action1” and thus will not require additional analysis within the NEPA process, with the possible exception of some portions of Subject Area 10. Under Subject Area 10, a correction to align the named location “Potato Bank” and the described locational coordinates may effectively shift some reopen/closed areas, in which case description and analysis of those specific corrections would be appropriately included within the NEPA framework. The team will continue to identify such errors, for the Council’s consideration.
Table 2. Administrative Actions Amending Groundfish Fishery Management Plan Appendices and Processes
Subject Area Alternative
5. Groundfish FMP Appendix B
5.a No Action
5.b Update & revise information in Groundfish FMP Appendix B of the FMP to reflect new information on Pacific Coast Groundfish life history descriptions, text descriptions of groundfish EFH, and major prey items. (Preliminary Preferred; Not a Major Action)
6. Groundfish FMP Appendix C Part 2
6.a No Action
6.b Update & revise fishing gear effects described in Groundfish FMP Appendix C Part 2. (Preliminary Preferred; Not a Major Action)
7. Groundfish FMP Appendix D
7.a No Action
7.b Update & revise Groundfish FMP Appendix D with new information and add descriptions and conservation measures for new non-fishing activities that may adversely affect EFH. (Preliminary Preferred; Not a Major Action)
8. Groundfish FMP EFH Information and Research Needs
8.a No Action
8.b Update & revise groundfish EFH Information and Research Needs section of the FMP and move to an appendix. (Preliminary Preferred; Not a Major Action)
9. Groundfish FMP EFH Review and Revision Process
9.a No Action
9.b Develop new groundfish EFH review and revision process and describe elsewhere (e.g., COP). Include criteria prior to each review. (Preliminary Preferred; Not a Major Action)
10. Clarifications and Corrections
10.a No Action
10.b Provide clarifications and correct minor errors from Amendment 19. (Preliminary Preferred)
1 Regulations at § 1508.18 define what constitutes a Major Federal action. Major Federal action includes actions with effects that may be major and which are potentially subject to Federal control and responsibility. Major reinforces but does not have a meaning independent of significantly (§ 1508.27). Actions include the circumstance where the responsible officials fail to act and that failure to act is reviewable by courts or administrative tribunals under the Administrative Procedure Act or other applicable law as agency action.
8
2.1 Preliminary Preferred Alternatives
A number of alternatives were identified by the Council, at the April 2016 meeting, as elements of the PPA. These elements include one fishery management action alternative (4b) and the action alternative for all of the administrative subject areas (alternatives 5b through 10b). These elements will be included in Amendment 28, but they do not reflect the final composition of the full PPA. Using this analytical document, the Council is expected to select from alternatives 1 - 3, either in whole or part, when crafting its full PPA. Those elements previously selected for inclusion in the PPA are briefly described here in order to establish a clear record for the Council and the public, but will not be discussed further in this document. The administrative actions described below that do not rise to the level of a major federal action (alternatives 5-10) will not be included in the future NEPA analysis. Subject Area 4. Use MSA Section 303(b) discretionary authorities. Alternative 4b: Use MSA Section 303(b) to close waters deeper than 3,500 meters to bottom contact gear, and establish and experimental fishing permit (EFP) process. This alternative would prohibit all bottom contact fishing activities in West Coast EEZ waters deeper than 3500m, unless a permit owner or vessel owner receives approval to do so via a groundfish EFP request through the Council process. Fishing with bottom contact gear outside of an EFP could only be authorized through an FMP amendment and changes in regulation. As part of this alternative, an EFP process would be developed. Subject Area 5. EFH Descriptions, Life History, and Major Prey Species Alternative 5b: Update and revise information in Appendix B of the FMP This alternative would update and revise information on EFH descriptions, life history, and major prey species. The EFH regulatory guidance requires description of habitat components, currently included as Appendix B to the Groundfish FMP. Subject Area 6. Fishing Activities That May Adversely Affect EFH Alternative 6b: Revise fishing gear effects described in Appendix C Part 2 of the FMP This alternative would update the description of fishing gear effects that are described in Appendix C Part 2 of the Groundfish FMP. Subject Area 7. Non-Fishing Activities that May Adversely Affect EFH Alternative 7b: Update Appendix D with new information and add descriptions and conservation measures for new non-fishing activities that may adversely affect EFH. This alternative would update information on non-fishing effects and associated conservation measures. These are currently included in Appendix D of the Groundfish FMP. The identification of potential non-fishing effects are used by NMFS in EFH consultations with Federal agencies that are conducting or authorizing non-fishing activities that may adversely affect groundfish EFH. Subject Area 8. Information and Research Needs

9
Alternative 8b: Revise the Information and Research Needs section and move to an appendix. This alternative would result in an updated Information and Research Needs section related to groundfish EFH, and would move that to an FMP appendix. Subject Area 9. Review and Revision Process Alternative 9b: Update review and revision process and describe elsewhere. Include criteria prior to each review. This alternative will describe a new process for review and revision of groundfish EFH, and would memorialize the process in an FMP appendix, a COP, or elsewhere outside of FMP text. This alternative also would describe a process in which goals and objectives of each review/revision process would be established prior to each periodic review
Subject Area 10. Clarification and Corrections Alternative 10b: Provide clarifications and correct minor errors from Amendment 19. This alternative would provide a correction to certain named and described areas (i.e., Potato Bank), where the name of the location and the described area do not correspond to each other. Correcting this error may reveal that the described closure was misnamed, or conversely that the named area was incorrectly mapped. In the event that the correction will revise areas that are currently closed in this vicinity, this has the potential to affect the human environment in a manner that warrants inclusion for analysis under NEPA. Because these alternatives have already been selected by the Council as elements of the PPA, they are not discussed further in this document.
2.2 Description of Fishery Management Action Alternatives
There are three fishery management subject areas for the Council to select PPAs: 1. EFHCA changes contained in public proposals (reopenings and new closures) 2. New EFHCAs within the current trawl RCA, and 3. Adjustments to or removal of the trawl RCA The Council, in choosing its PPA, may elect parts from among the several alternatives presented here, or may select an alternative in its entirety, and supplement it with provisions from other alternatives, in order to provide a range of measures that, when combined, meets the purpose and need (see Section 1.1).
Subject Area 1. EFHCA changes contained in public proposals
Alternative 1a: No Action
The no action alternative would maintain the current EFHCAs that prohibit bottom trawling. There are 36 EFHCAs that are closed to bottom trawling but open to other types of bottom contact gear (e.g., long line or pot gear). These are along the coasts of Washington, Oregon, and California;

10
and occur mostly seaward of state territorial waters, and as far offshore as the U.S. EEZ. (Figure 1). There would be no removal, no modification, or additional EFHCAs established.
Figure 1. Current EFH conservation areas.
11
Alternative 1b: Collaborative Group Proposal
The Collaborative group worked with the fishing industry and environmental non-governmental organizations to identify “common ground” areas that would provide increased habitat protections in areas of known high quality habitat, while providing increased fishing access to other areas that are currently closed.
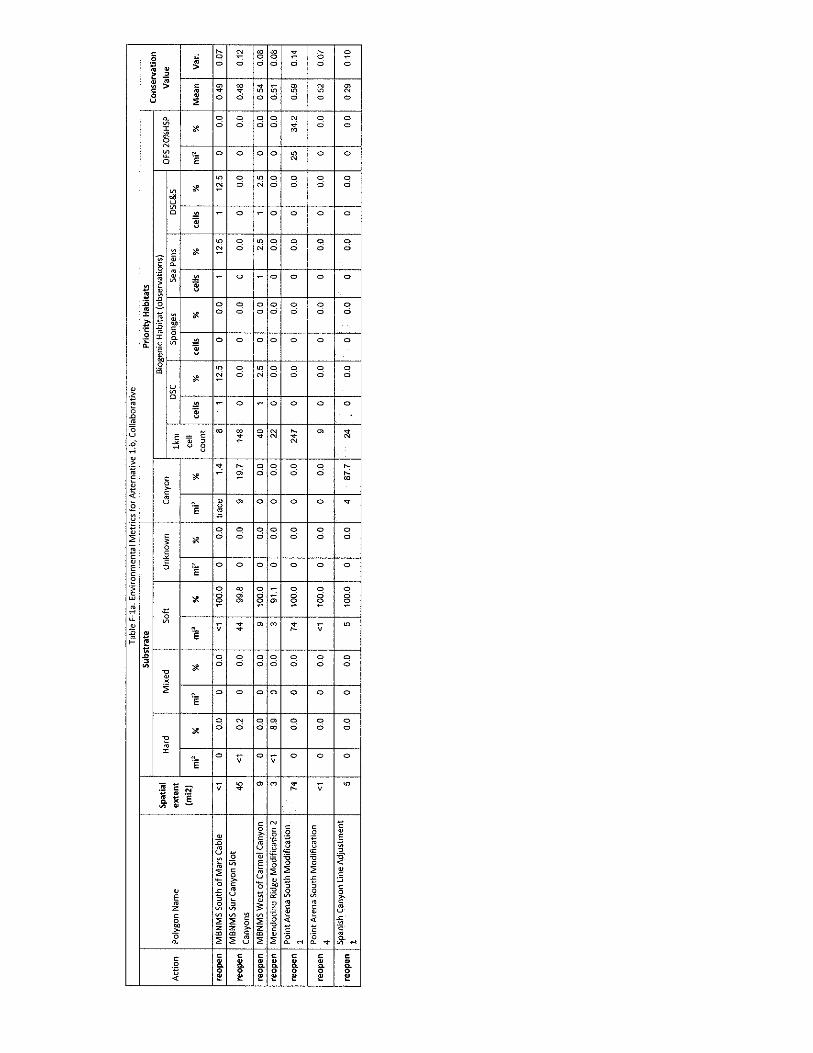
The Collaborative proposal includes proposed adjustments (both reopenings and closures) to several existing EFHCAs, as well a number of new stand-alone closures. In all, there are 43 proposed closed areas and 16 proposed new reopened areas (Figure 2). The Collaborative proposal also includes recommendations for removing the trawl RCA. The analysis of Alternative 1b assumes the 2015 trawl RCA structure remains in place. However, Section 5 of this report contains description and analysis of an integrated proposal, considering both the RCA changes and EFHCA changes together.
Minor adjustments to the spatial boundaries were made, in cooperation with the Project Team’s geographic information systems (GIS) analyst, to ensure consistency across projections and/or mapping platforms.
While the Collaborative group was able to reach full stakeholder consensus for recommendations off the coast of Washington, they were not able to achieve full consensus for most areas off the central Oregon coast. In addition, there are no consensus recommendations for the Southern California Bight.
The Collaborative proposal incorporates the changes proposed by FMA and MBNMS, and most of the changes proposed by GFNMS. The Collaborative proposal was also modified, per the Council’s April 2016 directive, to eliminate any changes in tribal U&As off Washington and any changes in state waters.

12
Figure 2. Collaborative proposal for areas reopened and closed to bottom trawling.

13
Alternative 1c: Oceana et al Proposal
The Oceana et al proposal was originally submitted in response to the 2013 RFP, and has been modified somewhat, at the request of the proposers.. The original proposal can be found at:
ftp://ftp.pcouncil.org/pub/EFH_Proposals_2013/H7a_Att7_Oceana_NRDC_OC_Proposal_NOV2013BB/Final.Oceana.NRDC.OC.7.31.13.EFHProposal.pdf.
The Council should note that two types of modifications have been made to this proposal. First, the proponents requested the following changes to be made:
1. Remove Proposed Closure Area 4 (“Copalis Inner Shelf”), based on input from Treaty Tribes in Washington State;
2. Remove Proposed Closure Area 21 (Pt. St. George Reef), based on information from the shrimp trawl fleet on the importance of this area to their fishery;
3. Remove Proposed Reopenings 43 and 44 (Cordell Bank East and South Reopenings), based on concerns raised by the Cordell Bank National Marine Sanctuary (CBNMS) regarding reopening of areas currently closed to trawling within CBNMS boundaries;
4. Remove Proposed Closure 59 (Monterey Canyon Deep Expansion), based on input from participants in the collaborative MBNMS proposal; and
5. Do not analyze Proposed Reopening 76 (Concept for Monterey Bay State Waters), reopening of state waters closed by California legislature is not within the scope or authority of the Council’s action.
Second, minor adjustments to the spatial boundaries were made, in cooperation with the Project Team’s GIS analyst, to ensure consistency across projections and/or mapping platforms.
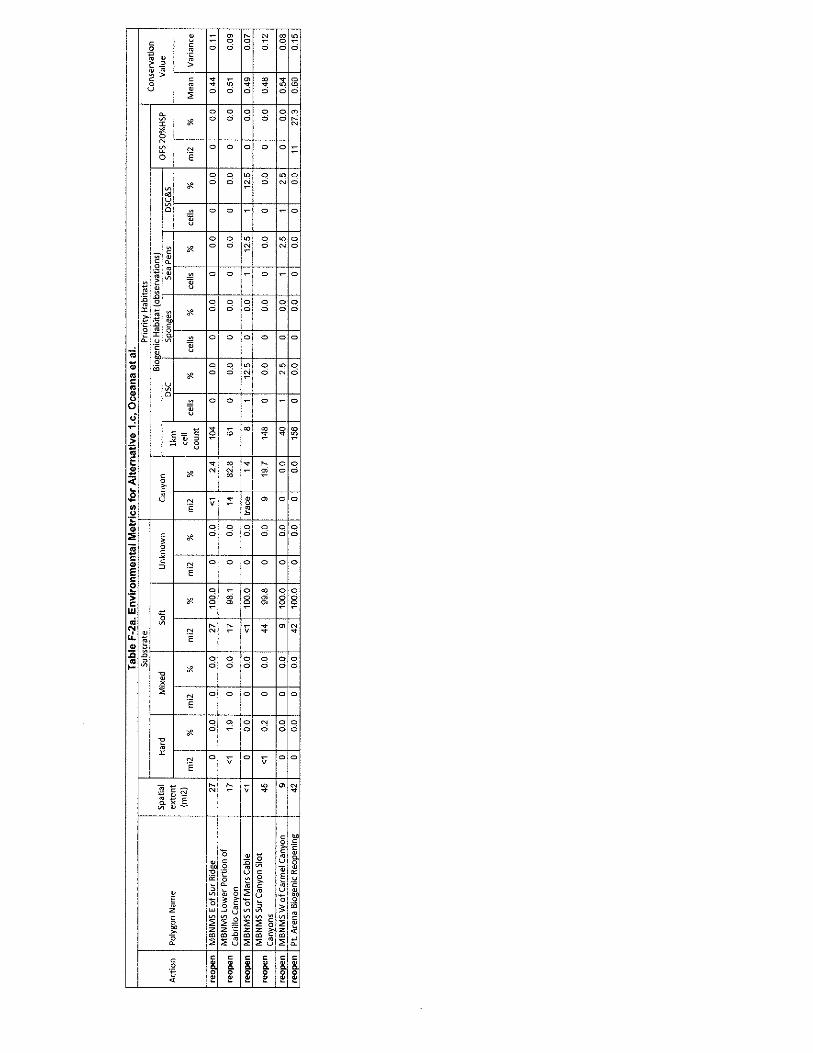
The Oceana et al proposal fully incorporates both the MBNMS and GFNMS proposals. This coast-wide alternative includes a total of 61 proposed closures and 7 proposed re-openings. In developing the proposal, the proponents prioritized areas known to exhibit the following characteristics:
1. Areas known to contain habitat features particularly sensitive to bottom trawl impacts, including hard substrate, biogenic habitats, submarine canyons, ridges, banks, escarpments, and/or other exceptional features;
2. Areas with high regional coral and/or sponge bycatch; 3. Areas within and/or adjacent to the current year-round closed portion of the trawl RCA
containing ecologically important and/or sensitive habitats important to overfished species and target species, so that these areas remain protected, as bycatch-related spatial protections are lifted;
4. Areas that improve the overall representation of habitat types contained in EFHCAs in regional and coastwide contexts;
5. Areas that are adjacent to newly designated marine protected areas; 6. Areas that increase the overall level of protection for sensitive habitat types within each of the
five west coast National Marine Sanctuaries; 7. Areas that are currently subject to very low or no trawl effort that may contain sensitive
habitats.

14
In addition, the proponents pursued the following objectives:
• Remove specific sections of existing EFHCAs where appropriate to improve trawl fishing opportunity in exchange for substantial overall net increases in regional and coastwide habitat protections.
• Achieve desired conservation targets with minimal cost to fishing industry (cost effectiveness). • Set a strong precedent for adaptive management of EFH in the periodic 5-year review process
through constructive refinements using best available science.
Finally, it should be noted that when the Oceana et al. proposal was developed, the Council had not yet merged the EFH action with potential RCA changes. Therefore, none of the public proposals from 2013 included proposals to modify the trawl RCA.

15
Figure 3. Oceana et al proposal for areas reopened and closed to bottom trawling.

16
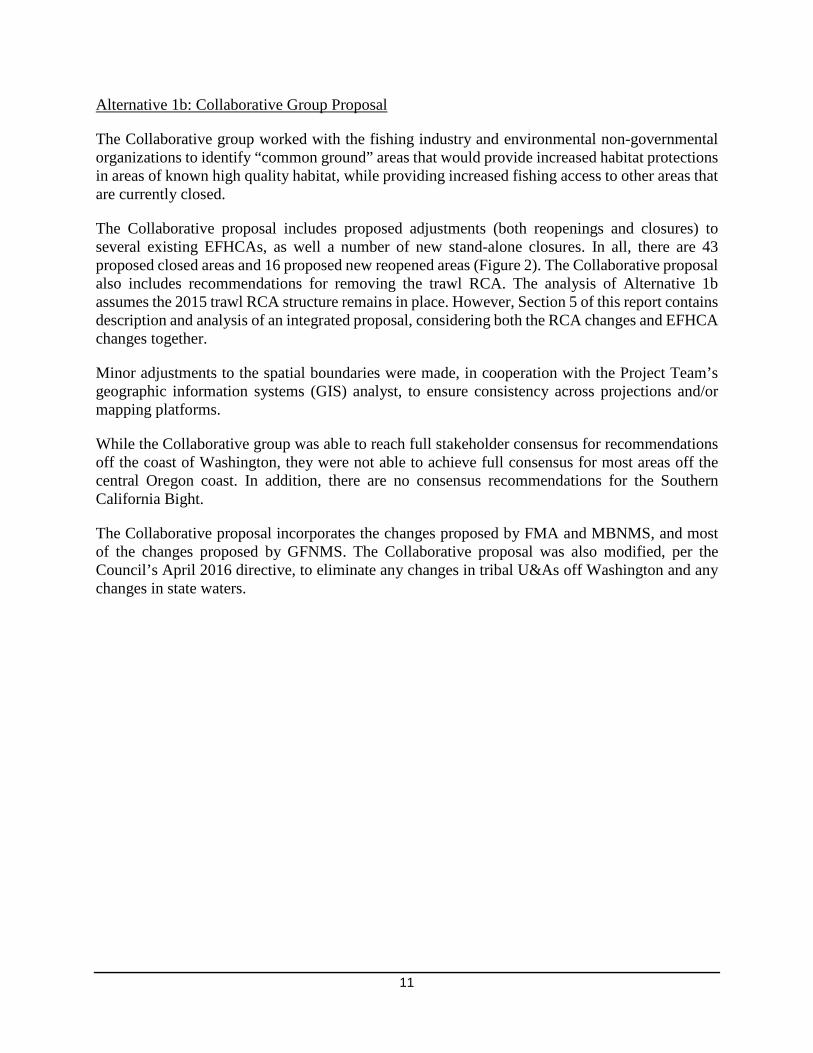
Subject Area 2. New EFHCAs within the current trawl RCA
Alternative 2a: No Action This alternative would not establish any new areas closed to bottom trawling for the purposes of protecting EFH within the current trawl RCA based on the presence of priority habitats. Several current EFHCAs overlap with the trawl RCA, and those EFHCAs would also remain in place, unless modified by Council action. This alternative is not mutually exclusive with Alternatives 1b (Collaborative) and 1c (Oceana et al.), each of which contain EFHCAs within the trawl RCA. Alternative 2b: Add new EFHCAs within the trawl RCA based on presence of priority habitats This alternative would identify new EFHCAs inside the boundaries of the 2015 trawl RCA, in areas where priority habitats are present (excluding areas within Tribal U&As off WashingtonError! Reference source not found.). Priority habitats, identified by the Council at the April 2016 meeting, include the following:
1. Hard substrate, including rocky ridges and rocky slopes 2. Habitat-forming invertebrates (also known as biogenic habitats) 3. Submarine canyons and gullies 4. Seamounts 5. Highest 20 percent habitat suitability for three overfished groundfish species (darkblotched
rockfish, Pacific Ocean perch, and yelloweye rockfish) as defined by NOAA The Council also included untrawlable areas (trawl hangs and abandoned trawl survey stations) as an additional criteria for identifying priority habitat. However, trawl hangs and abandoned trawl survey stations are indications of complex rocky habitat that is already incorporated into the substrate data (i.e., #1 and #3 above). Therefore, the Project Team decided to eliminate this category as a priority habitat. This alternative differs from the Subject Area 1 alternatives in that it does not propose a specific configuration of EFHCAs, but instead, identifies a list of potential EFHCAs that can inform selection of the PPA and was, therefore, not directly compared with the other alternatives in the analysis in Chapter 4. Alternative 2b is not mutually exclusive with Alternatives 1b (Collaborative) and 1c (Oceana et al.), each of which contain EFHCAs within the trawl RCA.
17
Figure 4. Priority habitats within current trawl RCAs under Alternative 2b.
The names of the polygons indicate the type(s) of habitat they contain: H=hard substrate, C=canyons and gullies, I=biogenic/invertebrates, O=OFS 20% HSP.

18
Subject Area 3. Adjustments to the trawl RCA
Trawl RCAs are areas closed to fishing by particular gear types, bounded by lines specifically defined by latitude and longitude coordinates intended to approximate depth contours established at 50 CFR 660.391–394. Vessels that are subject to the trawl RCA restrictions may not fish in the trawl RCA, or operate in the trawl RCA for any purpose other than transiting. Trawl RCAs are intended to protect a complex of species, and can include overfished species other than rockfish species. The action being considered here would modify the trawl RCA and affect where vessels fishing with groundfish bottom trawl gear can fish. Trawl RCA boundaries have been routinely adjusted over various depths since their inception. Once trawl RCA boundary lines are established in regulation through latitude and longitude coordinates and are available for use, there are two primary ways in which trawl RCAs can be modified over time. The first is modification of latitude and longitude coordinate points to better approximate a particular depth contour while allowing access to target stocks, or to correct inaccurate coordinates. The second is changing previously-approved waypoints to alter seaward and shoreward boundary lines that are used to define the trawl RCA (e.g., a trawl RCA originally bounded by the lines approximating the 75 fm and 150 fm depth contours may be changed to be bounded from the shoreline to 250 fm). These alternatives fall under the second category. This analysis considers four alternatives related to trawl RCAs: (1) No Action (status-quo); (2) remove the entire trawl RCA; (3) Remove the trawl RCA, but close discrete areas to protected overfished groundfish species (DACs), and (4) Remove the trawl RCA, but establish block area closures (BACs) to protect overfished and non-overfished groundfish species. The Collaborative Proposal includes partial RCA removal, which was not analyzed separately at this stage. The Project Team instead analyzed a range of RCA alternatives, within which the Collaborative Proposal would fit. Should the Council choose a PPA that includes the Collaborative’s partial RCA removal, the team will analyze it in the draft EIS. Alternative 3a: No Action Under the No Action alternative, the trawl RCA configuration would remain as it was in 2015 (Table 3). There would be no changes to the 2015 trawl RCA boundaries aside from routine in-season adjustments available to reduce catch of a particular species or species complex while maximizing catch of target species. There are other trawl RCA changes under consideration, but those are not incorporated into the baseline situation under this action. The seaward trawl RCA boundary in the area between 45°46' N. latitude and 40°10' N. latitude could not be shallower than the 200 fm modified petrale line.

19
Primary catch controls for vessels using trawl gears in the shorebased IFQ program would remain the same, and include the trawl RCA (Table 3), IFQ for selected species (Table 4), and trip limits for non-IFQ species (Table 5). NMFS also has the authority to close the shorebased IFQ fishery as a result of projected overages to prevent the trawl sector in aggregate or the individual trawl sectors from exceeding an annual catch limit (ACL), optimum yield, annual catch target, or formal allocation specified in the FMP or regulation (see regulations at 660.140(a)(3)).
Table 3. Trawl RCA boundaries for vessels using groundfish bottom trawl gear in 2015
JAN-FEB MAR-APR
MAY-AUG
SEPT-OCT
NOV-DEC
North of 48°10' N. lat.
shore - modified2/
200 fm line1/
shore - 200 fm line 1/
shore – 150 fm line1/
shore - 200 fm line1/
shore - modified2/
200 fm line1/
48°10' N. lat. - 45°46' N. lat. 100 fm line1/ - 150 fm line1/
45°46' N. lat. - 40°10' N. lat. 100 fm line1/ - modified2/ 200 fm line1/
South of 40°10' N. lat. 100 fm line1/ - 150 fm line1/ 3/
1/ The trawl RCA is an area closed to fishing by particular gear types, bounded by lines specifically defined by latitude and longitude coordinates set out at §§ 660.71-660.74. This trawl RCA is not defined by depth contours, and the boundary lines that define the trawl RCA may close areas that are deeper or shallower than the depth contour. Vessels that are subject to the trawl RCA restrictions may not fish or operate in the trawl RCA for any purpose other than transiting. 2/ The "modified" fathom lines are modified to exclude certain petrale sole areas from the trawl RCA. 3/ South of 34°27' N. lat., the trawl RCA is 100 fm line - 150 fm line along the mainland coast; shoreline - 150 fm line around islands.

20
Table 4. List of IFQ Species in the Shorebased IFQ Program 2015

21
Table 5. List of Species managed with trip limits in the shorebased IFQ program in 2015
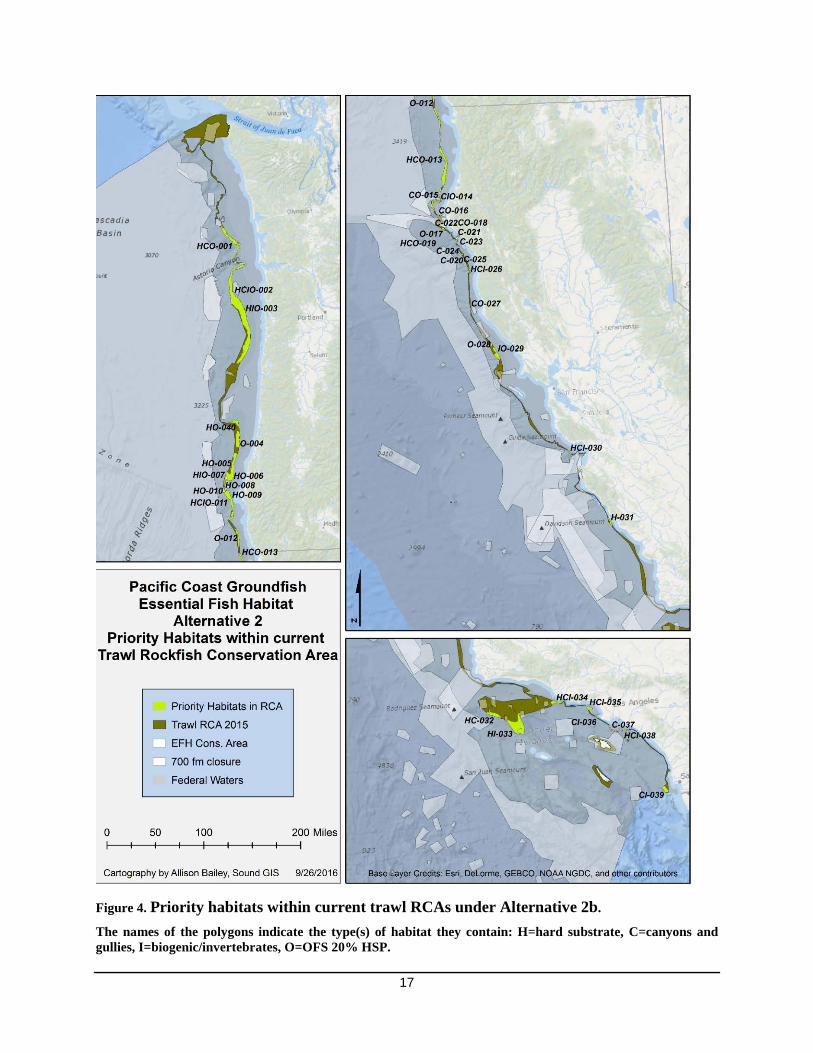
Alternative 3b: Remove the Trawl RCA The first action alternative (3b) would eliminate the entire trawl RCA, thereby allowing bottom trawling to take place in areas within the current trawl RCA that are not otherwise closed to fishing. For example, EFHCAs that are within the current trawl RCA would not be reopened to bottom trawling through this alternative. Changes made to EFHCAs within the boundaries of the current trawl RCA are under consideration for Subject Areas 1 and 2, which are discussed in Sections 2.2.1 and 2.2.2. Primary catch controls for vessels using trawl gear within the Shorebased IFQ program would be available. These controls include: IFQ for 29 stocks and stock complexes; individual bycatch quota (IBQ) for Pacific halibut; trip limits for non-IFQ species; and NMFS will retain the authority to close the fishery to prevent the trawl sector, in aggregate, or the individual sectors, from exceeding a harvest specification or formal allocation. Alternative 3c: Remove the Trawl RCA, but Close Discrete Areas to Protect Overfished Groundfish Species Under this alternative the trawl RCA would be removed, and discrete area closures - based on potential catch of overfished species - would be available either preseason or in-season to be implement as needed.

22
Figure 5. Proposed discrete area closures for overfished species under Alternative 3c. The names of the DACs indicate the species on which they are based: pop=Pacific ocean perch, cow=cowcod, dkb=darkblotched, boc=bocaccio, ylw=yelloweye
23
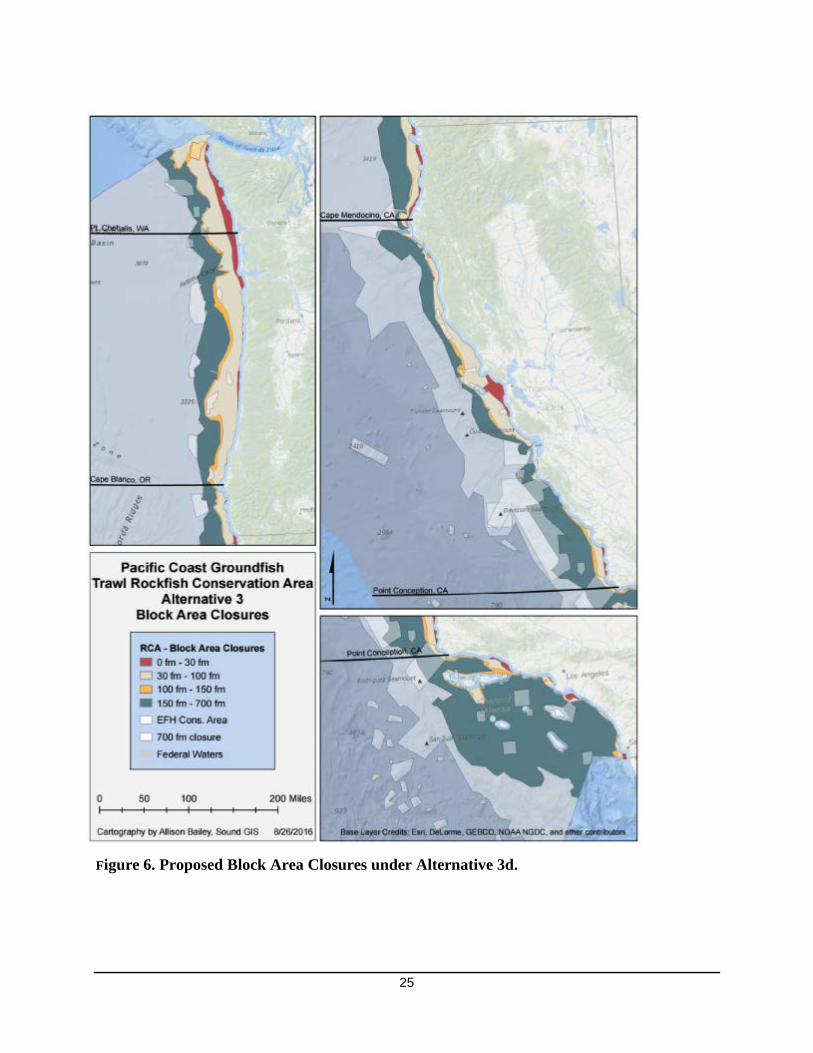
Discrete area closures were developed by identifying areas of high potential catch of overfished species (“hot spots”). We analyzed fishery dependent and trawl survey data to find areas that consistently had higher catches of overfished species. The fishery dependent data consisted of West Coast Groundfish Observer Program (WCGOP) trawl tow-level data from 2011-2014 and catch per unit effort (CPUE) calculated for each tow for each of the five overfished species (bocaccio, cowcod, darkblotched, Pacific Ocean Perch ((POP), and yelloweye). The CPUE data set joined the original dataset which used points converted from the polygons in the public proposals. The survey data includes data obtained from the Groundfish Trawl Survey from 2010-2015 that is kept by NOAA’s Fishery Resource Analysis and Monitoring (FRAM) Division. The survey data was used to create a point feature layer with CPUE for overfished species. The fishery dependent and survey data was then used to develop an optimized hot spot analysis. The analysis uses the points to identify statistically significant spatial clusters of high values (hot spots) and low values (cold spots). The optimized hot spot analysis tool was then applied to CPUE values independently for each overfished species and fishery-dependent and trawl survey data set. This created hot spot polygons as convex hulls with a 1,000 meter (m) buffer around each spot (cluster of high or low value spots). Alternative 3d: Remove the Trawl RCA, but Establish Block Area Closures to Protect Overfished Species (Groundfish and Non-Groundfish) Under alternative 3d, the trawl RCA would be removed and the fishing area off the West Coast out to 700 fm would be divided into a grid of 20 separate areas, using depth contours and existing latitude coordinates in regulation (Figure 6). These areas, referred to block area closures (BACs), could be implemented pre-season or in-season to reduce catch of a particular species or species complex, while maximizing target species catch. In-season actions could be based on Council recommendations or by NMFS automatic action authority when a shorebased IFQ allocation or ACL is projected to reach a pre-determined level of attainment. At the time of a closure, a single block, multiple blocks, part of a block, or all 20 blocks would be available to close, depending on the issue and conservation need. The BAC concept is meant to be a short-term solution to address a conservation or management issue of a species or species complex. They are not intended to protect habitat.
24
Latitudinal Zones
• US/Canada Border-Pt Chehalis • Pt Chehalis-Cape Blanco • Cape Blanco-Cape Mendocino • Cape Mendocino-Pt Conception • Pt Conception-US/Mexico border
Depth Zones
• Nearshore (state territorial sea boundary 30fm) • Shelf (30-100fm) • Slope (100-150fm) • Slope (150-700fm)
Areas within these depth contours that occur within state waters are excluded from analysis. Other than in Washington State, the 30 fathom line is frequently within state waters and the 100 fathom and 150 fathom lines occasionally cross into state waters, particularly in California (Figure 6).
25
Figure 6. Proposed Block Area Closures under Alternative 3d.
26
3. Affected Environment
The geographic scope of this action includes U.S. West Coast marine and estuarine waters between the Mexico and Canada borders, extending 200 miles from the coastline. The affected environment is comprised of managed resources; protected resources (including ESA-listed species, marine mammals, and sea birds); habitat and ecosystem elements; and the socio-economic environment
3.1 Fish Resources
Fish resources fall within multiple categories, and include all those finfish and shellfish resources that occur in the same environment with groundfish managed by the Council. This includes both target and non-target managed stocks, overfished species, and ESA-listed species. ESA-listed resources are described under “Protected Resources” below. Detailed information including life history, historical catch, and management information for each groundfish stock can be found in the Status of the Pacific Coast Groundfish Fishery (SAFE document), available on the Council website (www.pcouncil.org).
More than 90 fish species are managed under the Pacific Coast groundfish FMP. These groundfish include 60-plus rockfish, including all genera and species from the family Scorpaenidae (Sebastes, Scorpaena, Sebastolobus, and Scorpaenodes) occurring in waters off Washington, Oregon, and California; 12 flatfish species, six roundfish species; and six miscellaneous fish species that include sharks, skates, grenadiers, rattails, and morids. Rockfishes make up the majority of species managed under the Pacific Coast Groundfish FMP. Rockfishes vary greatly in their morphological and behavioral traits, with some species being semi-pelagic and found in mid-water schools, and others leading solitary, sedentary, bottom-dwelling lives (Love et al., 2002).
Roundfish managed under the Pacific Coast Groundfish FMP include lingcod, cabezon, kelp greenling, Pacific cod, sablefish and Pacific hake (whiting). As with the rockfishes, roundfishes vary in life history, habitat associations, and behavior.
Flatfish species from the order Pleuronectiformes have asymmetrical skulls with both eyes on the same side of the head. The 12 flatfish species in the FMP include species that have been assessed, such as arrrowtooth flounder, Dover sole, English sole, petrale sole, and starry flounder, as well as those that have not been assessed and that are managed in the “other flatfish’ complex (butter sole, curlfin sole, flathead sole, Pacific sanddab, rex sole, rock sole, and sand sole). Most of the flatfish species are distributed coastwide in waters of the continental shelf with the exception of arrowtooth flounder, butter sole, and flathead sole which are found on the shelf in waters north of central California. Flatfish species vary in depth distribution.
Many other fish species, managed and unmanaged, co-occur with Pacific Coast groundfish in the marine and estuarine environments. In the marine environment, species managed under the salmon FMP, the Highly Migratory Species (HMS) FMP, and Costal Pelagic Species (CPS) FMP are present. The HMS FMP includes species such as tuna, swordfish, and sharks; and the CPS FMP includes species such as Pacific sardine, Pacific mackerel, and northern anchovy. Several state-managed species such as Dungeness crab, pink shrimp, and California halibut also occupy groundfish habitats; and there are numerous unmanaged fish species that occur in the marine

27
environment, including sculpins, wolffishes, myctophids, ratfish, and poachers. In many cases (e.g., shrimp, Pacific sardine) other finfish serve as prey species for various species of groundfish.
3.2 Protected Resources
Protected resources are those species or stocks that are regulated by one or more of the following laws, Endangered Species Act (ESA), Marine Mammal Protection Act (MMPA), and the Migratory Bird Treaty Act (MBTA) and Responsibilities of Federal Agencies to Protect Migratory Birds (Executive Order 13186).
Several types of protected species are known to be affected by groundfish fisheries: fishes, marine mammals, marine turtles, and seabirds. The following sections provide the current list of species that are protected and may occur in the area of operation of the bottom trawl fishery.
The time periods over which baseline estimates of observed protected species were made are different for salmon than for all other species. For salmon the time period I 2002 to 2013. Fleet-wide salmon bycatch estimates for the fishery were derived from WCGOP observer, logbook, and fish ticket landings data for 2002 to 2010. Full observer coverage (100% observations) was used to derive catch from 2011 to 2013. For all other protected species estimates the time period is 2011 to 2014 and catch is derived from 100% at sea observer coverage. Except for salmon bycatch estimates in 2002 and 2003, all observations of protected species bycatch were made outside the trawl RCA.
ESA-Listed Fishes
Several species of fish are listed under the ESA (Table 6) and could be encountered in the bottom trawl fishery. Of the ESA-listed fish species, Chinook are most likely to be encountered as bycatch (Table 7). In addition, two separate distinct population segments of green sturgeon and eulachon are vulnerable to bottom trawl gear. Historically they have been observed as bycatch in the fishery but are typically encountered in low numbers (Table 8 and Table 9).

28
Table 6. Listing status, critical habitat designation, and protective regulations for ESA listed fishes. Note: ‘T’ means listed as threatened; ‘E’ means listed as endangered.
Species Listing Status Critical Habitat Protective
Regulations Chinook salmon (Oncorhynchus tshawytscha) Lower Columbia River T 6/28/05; 70 FR 37160 9/02/05; 70 FR 52630 6/28/05; 70 FR 37160 Upper Willamette River T 6/28/05; 70 FR 37160 9/02/05; 70 FR 52630 6/28/05; 70 FR 37160 Upper Columbia River spring-run E 6/28/05; 70 FR 37160 9/02/05; 70 FR 52630 ESA section 9 applies Snake River spring/summer-run T 6/28/05; 70 FR 37160 10/25/99; 64 FR 57399 6/28/05; 70 FR 37160 Snake River fall-run T 6/28/05; 70 FR 37160 12/28/93; 58 FR 68543 6/28/05; 70 FR 37160 Puget Sound T 6/28/05; 70 FR 37160 9/02/05; 70 FR 52630 6/28/05; 70 FR 37160 Chum salmon (O. keta) Columbia River T 6/28/05; 70 FR 37160 9/02/05; 70 FR 52630 6/28/05; 70 FR 37160 Hood Canal summer-run T 6/28/05; 70 FR 37160 9/02/05; 70 FR 52630 6/28/05; 70 FR 37160 Coho salmon (O. kisutch) Lower Columbia River T 6/28/05; 70 FR 37160 P 1/14/13; 78 FR 2726 6/28/05; 70 FR 37160 Oregon Coast T 6/20/11; 76 FR 35755 2/11/08; 73 FR 7816 2/11/08; 73 FR 7816 Southern Oregon/Northern California Coasts T 6/28/05; 70 FR 37160 5/5/99; 64 FR 24049 6/28/05; 70 FR 37160 Sockeye salmon (O. nerka) Lake Ozette T 6/28/05; 70 FR 37160 9/02/05; 70 FR 52630 6/28/05; 70 FR 37160 Snake River E 8/15/11; 70 FR 37160 12/28/93; 58 FR 68543 ESA section 9 applies Steelhead (O. mykiss) Lower Columbia River T 1/5/06; 71 FR 834 9/02/05; 70 FR 52630 6/28/05; 70 FR 37160 Upper Willamette River T 1/5/06; 71 FR 834 9/02/05; 70 FR 52630 6/28/05; 70 FR 37160 Middle Columbia River T 1/5/06; 71 FR 834 9/02/05; 70 FR 52630 6/28/05; 70 FR 37160 Upper Columbia River T 1/5/06; 71 FR 834 9/02/05; 70 FR 52630 2/1/06; 71 FR 5178 Snake River Basin T 1/5/06; 71 FR 834 9/02/05; 70 FR 52630 6/28/05; 70 FR 37160 Puget Sound T 5/11/07; 72 FR 26722 P 1/14/13; 78 FR 2726 P 2/7/07; 72 FR 5648 Green sturgeon (Acipenser medirostris) Southern DPS T 4/07/06; 71 FR 17757 10/09/09; 74 FR 52300 6/2/10; 75 FR 30714 Eulachon (Thaleichthys pacificus) Southern DPS T 3/18/10; 75 FR 13012 10/20/11; 76 FR 65324 Not applicable
Salmon The Chinook Evolutionary Significant Species Units (ESUs) that NMFS has concluded to be affected by the groundfish fisheries are: Snake River fall Chinook, Upper Willamette River Chinook, Lower Columbia River Chinook, Puget Sound Chinook, Sacramento River winter-run Chinook, California coastal Chinook, and Central Valley spring-run Chinook (NMFS 2006) . that NMFS has concluded listed salmonids that likely to be affected by the groundfish fisheries are: Snake River fall Chinook, Upper Willamette River Chinook, Lower Columbia River Chinook, Puget Sound Chinook, Sacramento River winter-run Chinook, California coastal Chinook, and Central Valley spring-run Chinook (NMFS 2006). The following sections provide the current status of these fish species and we provide the historical catch as observed and estimated by the WCGOP. The coastwide catch of Chinook in the bottom trawl fishery has decreased over time. In 2002 and 2003, the first two years that the bottom trawl fishery carried observers, the Chinook bycatch exceeded 9,000 fish (Table 7). After 2003 a large drop in coastwide Chinook bycatch occurred.
29
This may have been the result of changes in management measures affecting the nearshore trawl fishery (including implementation of the trawl RCA, small footrope requirements and the cut-back head rope requirement). Since 2006, only a few hundred Chinook have been caught annually with bottom trawl.
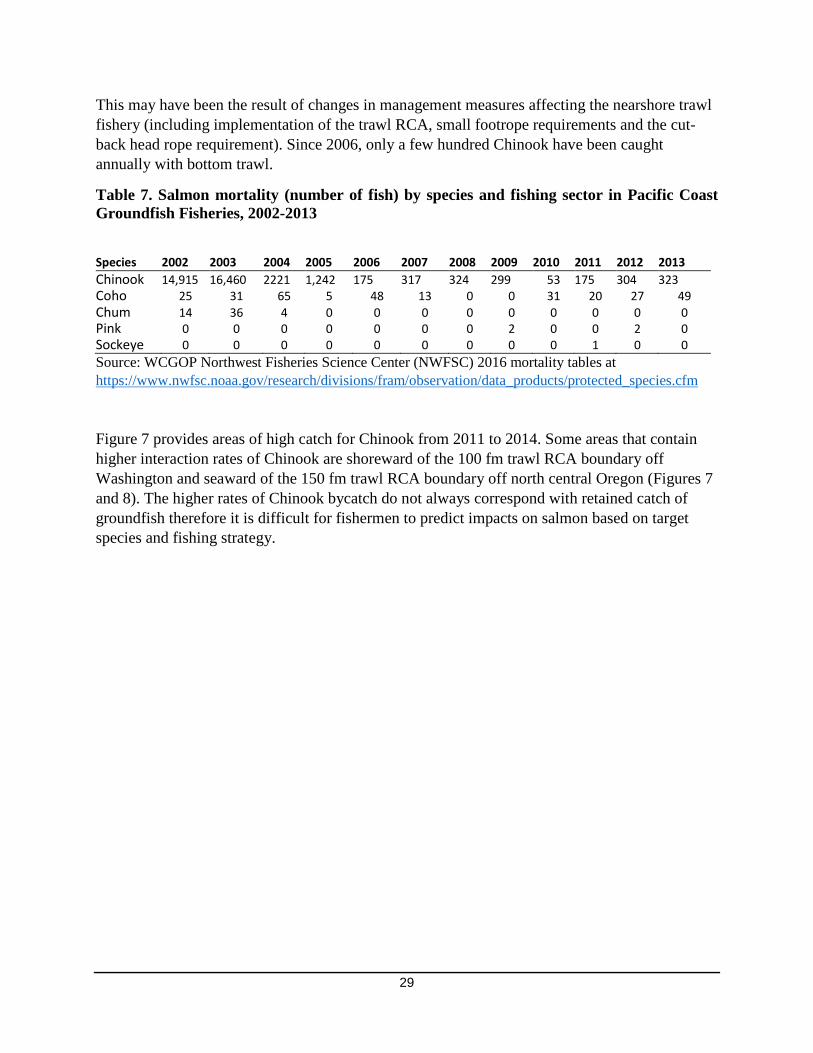
Table 7. Salmon mortality (number of fish) by species and fishing sector in Pacific Coast Groundfish Fisheries, 2002-2013 Species 2002 2003 2004 2005 2006 2007 2008 2009 2010 2011 2012 2013 Chinook 14,915 16,460 2221 1,242 175 317 324 299 53 175 304 323 Coho 25 31 65 5 48 13 0 0 31 20 27 49 Chum 14 36 4 0 0 0 0 0 0 0 0 0 Pink 0 0 0 0 0 0 0 2 0 0 2 0 Sockeye 0 0 0 0 0 0 0 0 0 1 0 0 Source: WCGOP Northwest Fisheries Science Center (NWFSC) 2016 mortality tables at https://www.nwfsc.noaa.gov/research/divisions/fram/observation/data_products/protected_species.cfm
Figure 7 provides areas of high catch for Chinook from 2011 to 2014. Some areas that contain higher interaction rates of Chinook are shoreward of the 100 fm trawl RCA boundary off Washington and seaward of the 150 fm trawl RCA boundary off north central Oregon (Figures 7 and 8). The higher rates of Chinook bycatch do not always correspond with retained catch of groundfish therefore it is difficult for fishermen to predict impacts on salmon based on target species and fishing strategy.

30
Figure 7. Chinook bycatch in the IFQ bottom trawl fishery, 2011 to 2014.

31
Green Sturgeon
Observations of green sturgeon in the bottom trawl fishery are minimal and all are in Oregon waters (Table 8). There does not seem to be a bycatch pattern in the fishery and the interaction rate is rather stable between 2011 and 2014.
Table 8. Observed numbers of green sturgeon bycatch from bottom trawl catch shares fishery (2011-2014) Note: Due to confidentiality mandates, catch for CA in 2011 and 2013-2014 are asterisked (**). Acronyms are state names: WA = Washington, OR = Oregon, and CA = California.
No. of
sturgeon No. of vessels
No. of trips
No. of tows
Observed groundfish
landings (MT)
Fleet total groundfish
landings (MT)
% groundfish
landings sampled
State Year WA 2011 0 9 81 935 1849.3 1859.6 99.4
2012 0 5 74 877 2035.1 2066.4 98.5 2013 0 6 61 886 1486.9 1488.7 99.9 2014 0 4 35 423 736.9 739.6 99.6
OR 2011 37 46 612 5883 10793.0 10876.7 99.2 2012 21 44 594 5537 10625.4 10692.1 99.4 2013 10 43 664 6298 12098.2 12133.5 99.7 2014 39 43 546 5017 10410.3 10437.6 99.7
CA 2011 0 23 414 2256 ** ** 99.9 2012 0 24 403 2474 4443.0 4451.4 99.8 2013 0 24 454 2746 ** ** 99.7 2014 0 23 432 2815 ** ** 99.5
Source: WCGOP NWFSC 2016 mortality tables at https://www.nwfsc.noaa.gov/research/divisions/fram/observation/data_products/protected_species.cfm
Eulachon
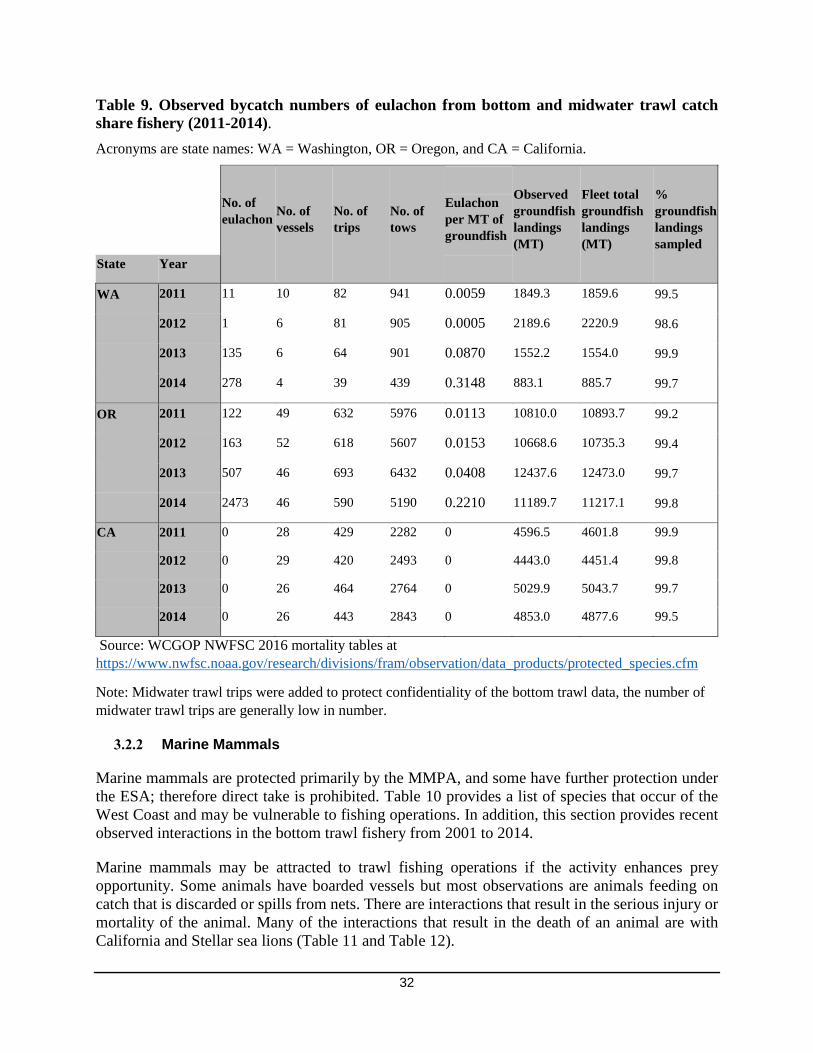
Bycatch of eulachon has increased in recent years (Table 9). This may be due to a recovery of the species but at this time it is not certain why the bycatch rate of eulachon per metric ton of groundfish has increased. As of September 2016, a new biological opinion is being developed for the groundfish fishery to evaluate effects of the fishery on eulachon.
32
Table 9. Observed bycatch numbers of eulachon from bottom and midwater trawl catch share fishery (2011-2014). Acronyms are state names: WA = Washington, OR = Oregon, and CA = California.
No. of eulachon
No. of vessels
No. of trips
No. of tows
Observed groundfish landings (MT)
Fleet total groundfish landings (MT)
% groundfish landings sampled
Eulachon per MT of groundfish
State Year
WA 2011 11 10 82 941 0.0059 1849.3 1859.6 99.5
2012 1 6 81 905 0.0005 2189.6 2220.9 98.6
2013 135 6 64 901 0.0870 1552.2 1554.0 99.9
2014 278 4 39 439 0.3148 883.1 885.7 99.7
OR 2011 122 49 632 5976 0.0113 10810.0 10893.7 99.2
2012 163 52 618 5607 0.0153 10668.6 10735.3 99.4
2013 507 46 693 6432 0.0408 12437.6 12473.0 99.7
2014 2473 46 590 5190 0.2210 11189.7 11217.1 99.8
CA 2011 0 28 429 2282 0 4596.5 4601.8 99.9
2012 0 29 420 2493 0 4443.0 4451.4 99.8
2013 0 26 464 2764 0 5029.9 5043.7 99.7
2014 0 26 443 2843 0 4853.0 4877.6 99.5
Source: WCGOP NWFSC 2016 mortality tables at https://www.nwfsc.noaa.gov/research/divisions/fram/observation/data_products/protected_species.cfm
Note: Midwater trawl trips were added to protect confidentiality of the bottom trawl data, the number of midwater trawl trips are generally low in number.
Marine Mammals
Marine mammals are protected primarily by the MMPA, and some have further protection under the ESA; therefore direct take is prohibited. Table 10 provides a list of species that occur of the West Coast and may be vulnerable to fishing operations. In addition, this section provides recent observed interactions in the bottom trawl fishery from 2001 to 2014.
Marine mammals may be attracted to trawl fishing operations if the activity enhances prey opportunity. Some animals have boarded vessels but most observations are animals feeding on catch that is discarded or spills from nets. There are interactions that result in the serious injury or mortality of the animal. Many of the interactions that result in the death of an animal are with California and Stellar sea lions (Table 11 and Table 12).
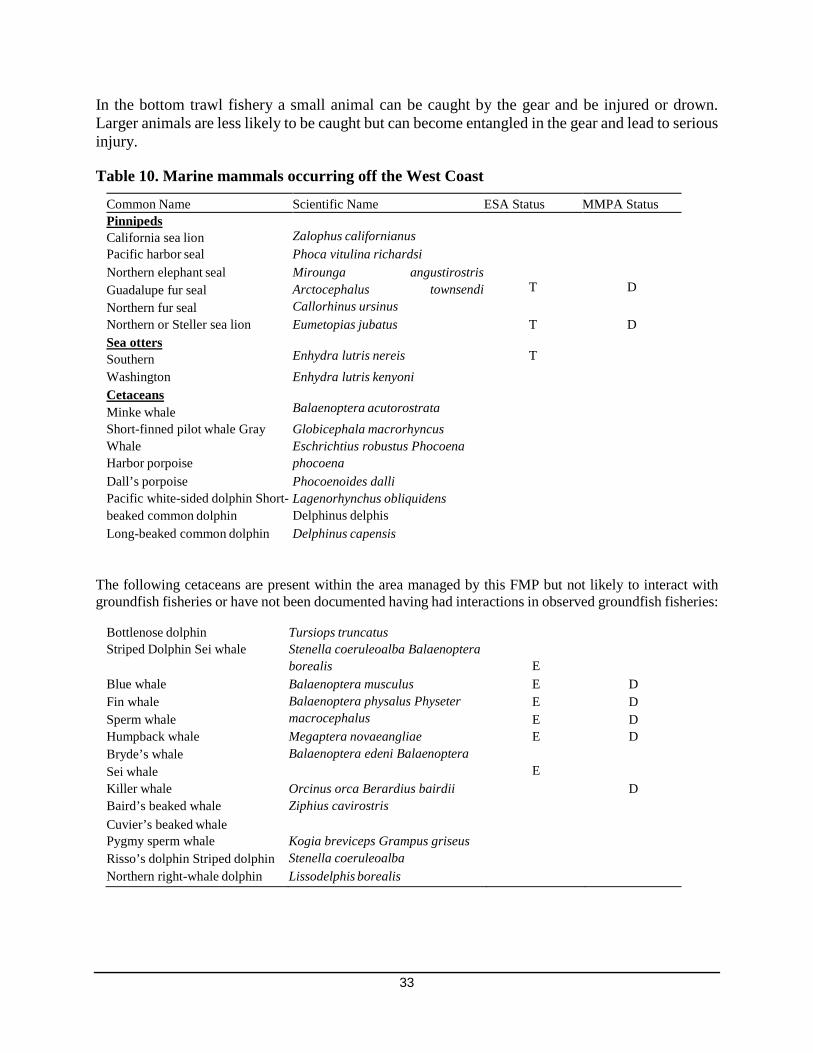
33
In the bottom trawl fishery a small animal can be caught by the gear and be injured or drown. Larger animals are less likely to be caught but can become entangled in the gear and lead to serious injury.
Table 10. Marine mammals occurring off the West Coast
Common Name Scientific Name ESA Status MMPA Status Pinnipeds California sea lion
Zalophus californianus
Pacific harbor seal Phoca vitulina richardsi Northern elephant seal Guadalupe fur seal Northern fur seal
Mirounga angustirostris Arctocephalus townsendi Callorhinus ursinus
T
D
Northern or Steller sea lion Sea otters Southern
Eumetopias jubatus Enhydra lutris nereis
T
T
D
Washington Cetaceans Minke whale
Enhydra lutris kenyoni Balaenoptera acutorostrata
Short-finned pilot whale Gray Whale Harbor porpoise
Globicephala macrorhyncus Eschrichtius robustus Phocoena phocoena
Dall’s porpoise Pacific white-sided dolphin Short-beaked common dolphin
Phocoenoides dalli Lagenorhynchus obliquidens Delphinus delphis
Long-beaked common dolphin Delphinus capensis
The following cetaceans are present within the area managed by this FMP but not likely to interact with groundfish fisheries or have not been documented having had interactions in observed groundfish fisheries:
Bottlenose dolphin Striped Dolphin Sei whale
Tursiops truncatus Stenella coeruleoalba Balaenoptera borealis
E
Blue whale Fin whale Sperm whale
Balaenoptera musculus Balaenoptera physalus Physeter macrocephalus
E E E
D D D
Humpback whale Bryde’s whale Sei whale
Megaptera novaeangliae Balaenoptera edeni Balaenoptera
E
E
D
Killer whale Baird’s beaked whale Cuvier’s beaked whale
Orcinus orca Berardius bairdii Ziphius cavirostris
D
Pygmy sperm whale Risso’s dolphin Striped dolphin
Kogia breviceps Grampus griseus Stenella coeruleoalba
Northern right-whale dolphin Lissodelphis borealis

34
In addition to the ESA, the federal MMPA guides marine mammal species protection and conservation policy. Under the MMPA, on the West Coast NMFS is responsible for the management of cetaceans and pinnipeds, while the USFWS manages sea otters. The following tables provide the total number of observed marine mammals in the bottom trawl fishery from 2002 to 2014. Prior to 2011 observations covered roughly 14% to 24% of the fleet. From 2011 to 2014 observation coverage as 100% of the bottom trawl fleet. Table 11 and Table 12 provides the number and type of marine mammal interactions observed in the bottom trawl fishery across all years (2002-2014), and all species. The observations depicted in include the following categories:
• Boarded vessel • Deterrence used • Entangled in gear - not trailing gear • Feeding on catch • Killed by gear • Lethal removal - not trailing gear • Other
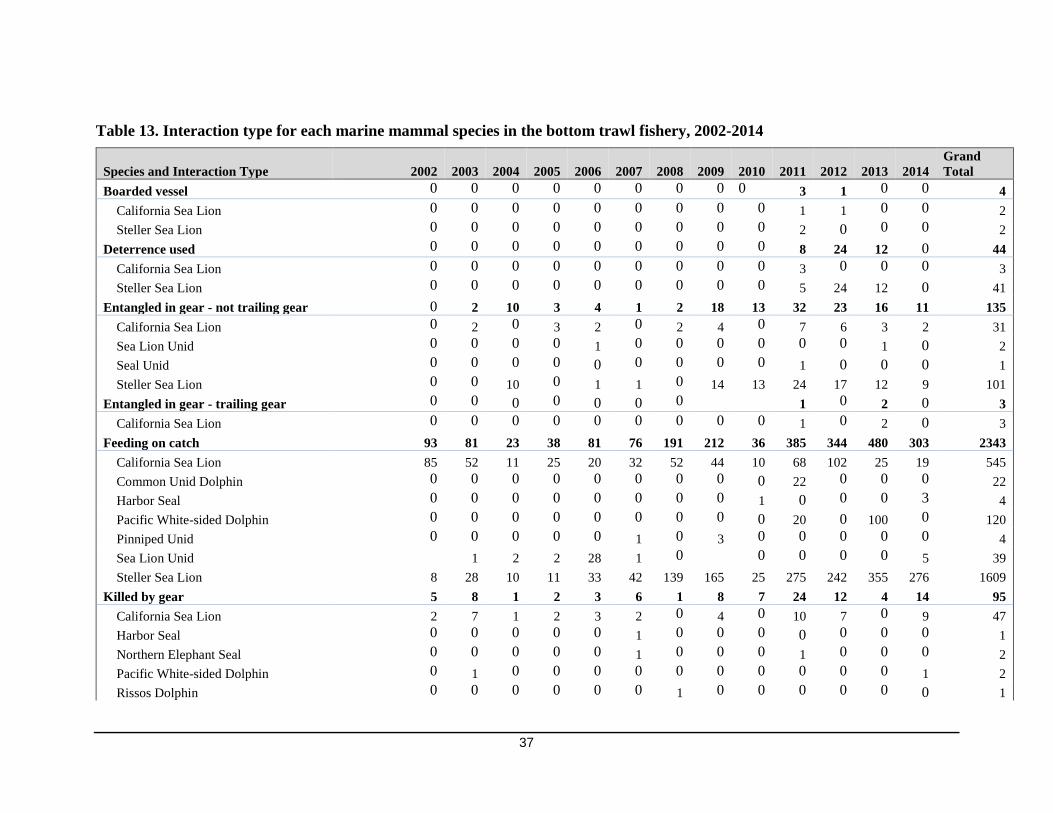
Table 13 shows the majority of interactions are animals feeding on catch that is spilled or discarded (typically stellar and California sea lions).

35
Table 11. Total number of interactions with marine mammal species for the bottom trawl fishery, 2002-2014.
Row Labels 2002 2003 2004 2005 2006 2007 2008 2009 2010 2011 2012 2013 2014 Grand Total
California Sea Lion 87 61 12 31 27 35 54 52 10 90 117 31 30 637 Common Unid Dolphin 0 0 0 0 0 0 0 0 0 22 0 0 0 22 Dalls Porpoise 0 0 0 0 1 0 2 0 0 0 0 0 0 3 Dolphin Unid 0 0 0 0 0 0 0 0 0 200 0 0 1 201 Harbor Porpoise 0 0 0 0 0 0 0 0 1 0 0 0 0 1 Harbor Seal 0 0 0 1 0 1 1 0 1 0 0 0 3 7 Marine mammal Unid 0 0 0 0 0 0 0 1 0 0 0 0 0 1 Northern Elephant Seal 0 0 0 0 0 1 0 1 0 1 0 1 0 4 Pacific White-sided Dolphin 0 1 0 0 0 0 0 0 0 20 1 100 1 123 Pinniped Unid 0 1 0 0 0 1 0 3 0 0 0 0 0 5 Porpoise Unid 0 0 0 0 0 0 0 0 0 0 1 0 0 1 Rissos Dolphin 0 0 0 0 0 0 1 0 0 0 0 0 0 1 Sea Lion Unid 1 1 2 2 29 1 0 0 0 0 0 1 5 42 Seal Unid 0 0 0 0 0 0 0 0 0 1 0 0 0 1 Short-beaked Com Dolphin 0 0 0 0 0 0 0 0 0 0 0 0 1 1 Steller Sea Lion 10 29 20 11 34 45 139 184 45 326 288 383 289 1803 Grand Total 98 93 34 45 91 84 197 241 57 660 407 516 330 2853

36
Table 12. Type and number of marine mammal interactions observed in the bottom trawl fishery across all years (2002-2014) and all species
Interaction type Sum of individuals Boarded vessel 4 Deterrence used 44 Entangled in gear - not trailing gear 135 Entangled in gear - trailing gear 3 Feeding on catch 2343 Killed by gear 95 Lethal removal - not trailing gear 3 Lethal removal -trailing gear 1 Other 205 Previously dead 17 Unknown 3 Grand Total 2853
37
Table 13. Interaction type for each marine mammal species in the bottom trawl fishery, 2002-2014
Species and Interaction Type 2002 2003 2004 2005 2006 2007 2008 2009 2010 2011 2012 2013 2014 Grand Total
Boarded vessel 0 0 0 0 0 0 0 0 0 3 1 0 0 4 California Sea Lion 0 0 0 0 0 0 0 0 0 1 1 0 0 2 Steller Sea Lion 0 0 0 0 0 0 0 0 0 2 0 0 0 2
Deterrence used 0 0 0 0 0 0 0 0 0 8 24 12 0 44 California Sea Lion 0 0 0 0 0 0 0 0 0 3 0 0 0 3 Steller Sea Lion 0 0 0 0 0 0 0 0 0 5 24 12 0 41
Entangled in gear - not trailing gear 0 2 10 3 4 1 2 18 13 32 23 16 11 135 California Sea Lion 0 2 0 3 2 0 2 4 0 7 6 3 2 31 Sea Lion Unid 0 0 0 0 1 0 0 0 0 0 0 1 0 2 Seal Unid 0 0 0 0 0 0 0 0 0 1 0 0 0 1 Steller Sea Lion 0 0 10 0 1 1 0 14 13 24 17 12 9 101
Entangled in gear - trailing gear 0 0 0 0 0 0 0 1 0 2 0 3 California Sea Lion 0 0 0 0 0 0 0 0 0 1 0 2 0 3
Feeding on catch 93 81 23 38 81 76 191 212 36 385 344 480 303 2343 California Sea Lion 85 52 11 25 20 32 52 44 10 68 102 25 19 545 Common Unid Dolphin 0 0 0 0 0 0 0 0 0 22 0 0 0 22 Harbor Seal 0 0 0 0 0 0 0 0 1 0 0 0 3 4 Pacific White-sided Dolphin 0 0 0 0 0 0 0 0 0 20 0 100 0 120 Pinniped Unid 0 0 0 0 0 1 0 3 0 0 0 0 0 4 Sea Lion Unid 1 2 2 28 1 0 0 0 0 0 5 39 Steller Sea Lion 8 28 10 11 33 42 139 165 25 275 242 355 276 1609
Killed by gear 5 8 1 2 3 6 1 8 7 24 12 4 14 95 California Sea Lion 2 7 1 2 3 2 0 4 0 10 7 0 9 47 Harbor Seal 0 0 0 0 0 1 0 0 0 0 0 0 0 1 Northern Elephant Seal 0 0 0 0 0 1 0 0 0 1 0 0 0 2 Pacific White-sided Dolphin 0 1 0 0 0 0 0 0 0 0 0 0 1 2 Rissos Dolphin 0 0 0 0 0 0 1 0 0 0 0 0 0 1

38
Species and Interaction Type 2002 2003 2004 2005 2006 2007 2008 2009 2010 2011 2012 2013 2014 Grand Total
Sea Lion Unid 1 0 0 0 0 0 0 0 0 0 0 0 0 1 Steller Sea Lion 2 0 0 0 0 2 0 4 7 13 5 4 4 41
Lethal removal - not trailing gear 0 0 0 1 0 0 0 1 0 1 0 0 0 3 California Sea Lion 0 0 0 1 0 0 0 0 0 0 0 0 0 1 Northern Elephant Seal 0 0 0 0 0 0 0 1 0 0 0 0 0 1 Steller Sea Lion 0 0 0 0 0 0 0 0 0 1 0 0 0 1
Lethal removal -trailing gear 0 0 0 0 0 0 0 0 0 0 1 0 1 California Sea Lion 0 0 0 0 0 0 0 0 0 0 0 1 0 1
Other 0 0 0 0 0 0 0 0 0 205 0 0 0 205 Dolphin Unid 0 0 0 0 0 0 0 0 0 200 0 0 0 200 Steller Sea Lion 0 0 0 0 0 0 0 0 0 5 0 0 0 5
Previously dead 2 1 3 1 1 2 1 1 3 0 2 17 California Sea Lion 0 0 0 0 2 1 0 0 0 0 1 0 0 4 Dalls Porpoise 0 0 0 0 1 0 0 0 0 0 0 0 0 1 Dolphin Unid 0 0 0 0 0 0 0 0 0 0 0 0 1 1 Harbor Porpoise 0 0 0 0 0 0 0 0 1 0 0 0 0 1 Harbor Seal 0 0 0 1 0 0 1 0 0 0 0 0 0 2 Marine mammal Unid 0 0 0 0 0 0 0 1 0 0 0 0 0 1 Pacific White-sided Dolphin 0 0 0 0 0 0 0 0 0 0 1 0 0 1 Pinniped Unid 0 1 0 0 0 0 0 0 0 0 0 0 0 1 Porpoise Unid 0 0 0 0 0 0 0 0 0 0 1 0 0 1 Short-beaked Common Dolphin 0 0 0 0 0 0 0 0 0 0 0 0 1 1 Steller Sea Lion 0 1 0 0 0 0 0 1 0 1 0 0 0 3
Unknown 0 0 0 0 0 0 2 0 0 0 0 1 0 3 Dalls Porpoise 0 0 0 0 0 0 2 0 0 0 0 0 0 2 Northern Elephant Seal 0 0 0 0 0 0 0 0 0 0 0 1 0 1
Grand Total 98 93 34 45 91 84 197 241 57 660 407 516 330 2853
39
Marine Turtles
Sea turtles are highly migratory, and four of the six species found in U.S. waters have been sighted off the West Coast. Little is known about the interactions between sea turtles and West Coast fisheries. Directed fishing for sea turtles in West Coast groundfish fisheries is prohibited because of their ESA listings; however, incidental take of sea turtles by longline or trawl gear may occur. The management and conservation of sea turtles is shared between NMFS and the U.S. Fish and Wildlife Service (USFWS). All four species occurring in West Coast waters are protected under the ESA:
• Green sea turtle (Chelonia mydas) - endangered • Leatherback (Dermochylys coriacea) - endangered • Olive Ridley (Lepidochelys olivacea) - endangered • Loggerhead (Caretta caretta) - threatened
Sea Birds
The MBTA and Executive Order 13186 implement various treaties and conventions between the U.S. and Canada, Japan, Mexico, and Russia for the protection of migratory birds. Under the Act, taking, killing, or possessing migratory birds is unlawful.
The USFWS is the primary federal agency responsible for seabird conservation and management. Of the multiple seabirds that can be found off the West Coast, four species are listed under the ESA, and several are identified as “species of concern”:
• Short-tail albatross (Phoebastria (=Diomedea) albatrus)- ESA listed Endangered California
• Brown pelican (Pelecanus occidentales) - ESA-listed Endangered • California least tern (Sterna antillarum browni) –ESA-listed Endangered • Marbled murrelet (Brachyramphs marmoratus) - ESA-listed Threatened • Xantus’s murrelet (Synthliboramphus hypoleucus) - ESA Listing Candidate • Ashy Storm-petrel (Oceanodroma homochroa) -species of concern • Arctic tern (Sterna paradisaea) -species of concern • Elegant tern (Sterna elegans) -species of concern • Western gull-billed tern (Sterna nilotica) -species of concern • Black skimmer (Rynchops niger) -species of concern • Xantus’s murrelet (Synthliboramphus hypoleucus) -species of concern • Cassin’s auklet (Ptychoramphus aleuticus) • Caspian tern (Sterna caspia) – species of concern • Black-footed albatross (Phoebastria nigripe) – species of concern
Table 14 and Table 15 provide the number of interactions with seabirds that have been observed in the fishery.
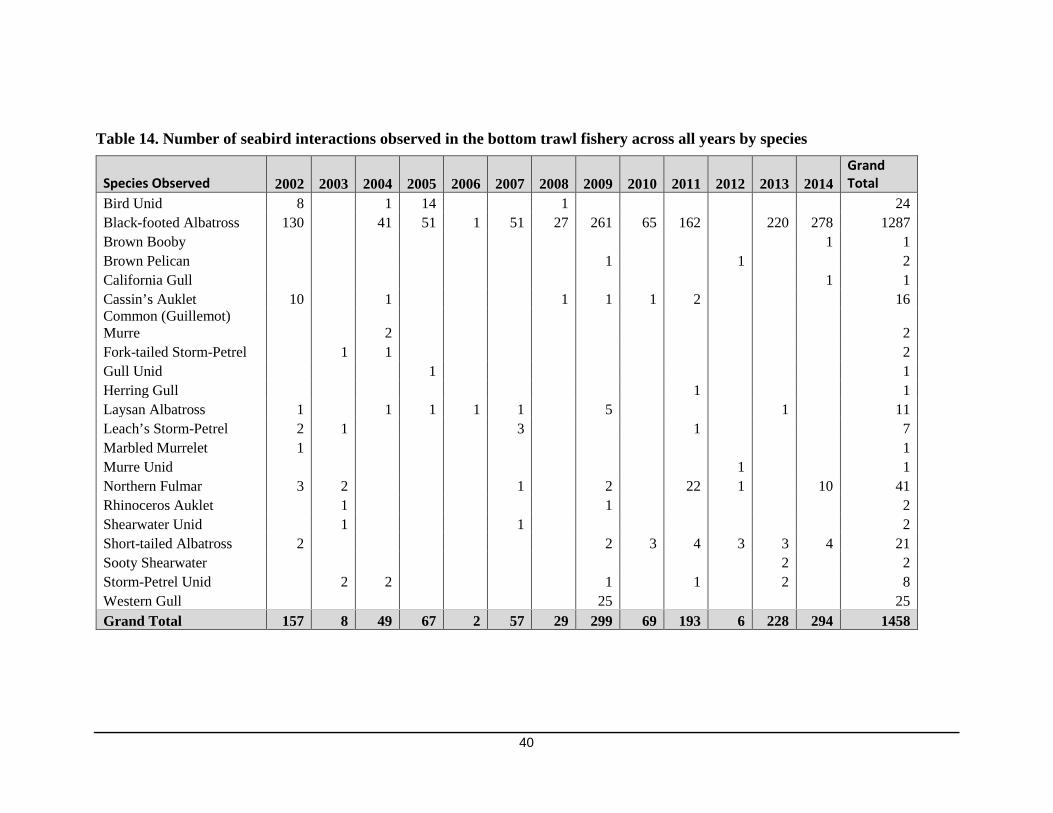
40
Table 14. Number of seabird interactions observed in the bottom trawl fishery across all years by species
Species Observed 2002 2003 2004 2005 2006 2007 2008 2009 2010 2011 2012 2013 2014 Grand Total
Bird Unid 8 1 14 1 24 Black-footed Albatross 130 41 51 1 51 27 261 65 162 220 278 1287 Brown Booby 1 1 Brown Pelican 1 1 2 California Gull 1 1 Cassin’s Auklet 10 1 1 1 1 2 16 Common (Guillemot) Murre 2 2 Fork-tailed Storm-Petrel 1 1 2 Gull Unid 1 1 Herring Gull 1 1 Laysan Albatross 1 1 1 1 1 5 1 11 Leach’s Storm-Petrel 2 1 3 1 7 Marbled Murrelet 1 1 Murre Unid 1 1 Northern Fulmar 3 2 1 2 22 1 10 41 Rhinoceros Auklet 1 1 2 Shearwater Unid 1 1 2 Short-tailed Albatross 2 2 3 4 3 3 4 21 Sooty Shearwater 2 2 Storm-Petrel Unid 2 2 1 1 2 8 Western Gull 25 25 Grand Total 157 8 49 67 2 57 29 299 69 193 6 228 294 1458

41
The bottom trawl fishery has a low interaction rate that results in mortalities; most interactions are birds feeding on catch and some boarding vessels (Table 15).
Table 15. Number of seabird interactions observed in the bottom trawl fishery across all years (2002-2014) and all species.
Interaction Type Sum of individuals Boarded vessel 148 Deterrence used 36 Entangled in gear - not trailing gear 5 Feeding on catch 1205 Killed by gear 12 Lethal removal - not trailing gear 1 Other 51 Grand Total 1458

42
3.3 Habitat and Ecosystem Elements
The marine habitats of the West Coast support living marine resources at the most fundamental level by providing the conditions necessary for populations to sustain themselves. From a broad perspective, habitat is the geographic area, and the characteristics of that area, where the species occurs at any time during its life. Habitat characteristics comprise a variety of attributes and scales, including physical (geological), biological, and chemical parameters, location, and time. Species presence and distributions are affected by habitat characteristics that include obvious structure or substrate (e.g., reefs, marshes, or kelp beds) and other structures that are less distinct (e.g., turbidity zones, thermoclines, or fronts separating water masses). Interactions can occur between the trawl fishery and the multiple environmental variables that make up habitat that determine a species’ biological niche. These variables include both physical variables such as depth, substrate, temperature range, salinity, dissolved oxygen, and biological variables such as the presence of competitors, predators, or facilitators. Fish habitat utilized by a species can change with life history stage, abundance of the species, competition from other species, environmental variability in time and space, and human-induced changes. Occupation and use of habitats by fish may change on a wide range of temporal scales: seasonally, inter- annually, inter-decadal (e.g., regime changes), or longer.
Salmon FMP stocks interact with a number of ecosystems along the Pacific Coast, including the California Current Large Marine Ecosystem (LME) (described below), numerous estuary and freshwater areas and associated riparian habitats. Salmon contribute to ecosystem function as predators on lower trophic level species, as prey for higher trophic level species, and as nutrient transportation from marine ecosystems to inland ecosystems. Because of their wide distribution in both the freshwater and marine environments, Pacific salmon interact with a great variety of habitats and other species of fish, mammals, and birds. An extensive description can be found in the EIS for groundfish harvest specifications (PFMC 2012). This section summarizes the habitats and ecosystem functions that Pacific salmon encounter, and draws primarily from PFMC 2012.
California Current Large Marine Ecosystem
The California Current is formed when the North Pacific Current splits, approximately at Vancouver Island, Canada. It varies seasonally, but generally flows southward along the West Coast to mid-Baja, Mexico. The California Current flows in a southern direction year-round off shore from the shelf break to approximately 200 miles offshore. Other coastal currents dominate along the continental shelf. These include the Davidson Current and California Undercurrent, the Southern California Countercurrent, as well as many eddies and smaller shelf currents (PFMC 2012).
The California Current also defines the outer boundary of the California Current LME that is delineated by bathymetry, productivity, and trophic interactions. The LME is an organizational unit to facilitate management of an entire ecosystem, and recognizes the complex dynamics between the biological and physical components. NOAA’s ecosystem-based management approach uses the LME concept to define ecosystem boundaries.
Several Council and NMFS documents describe the prevailing marine ecosystem functions, variations, and drivers. The CPS SAFE document (PFMC 2011a) and the Groundfish SAFE
43
document (PFMC 2008b) summarize stock assessment information as well as fishery statistics for all groundfish and CPS species. These typically include ecosystem information, bycatch, management strategies, and other fishery-related information.
Physical and Biological Oceanography
The California Current is essentially the eastern limb of the Central Pacific Gyre, and begins where the west wind drift (or the North Pacific Current) reaches the North American Continent. This occurs near the northern end of Vancouver Island, roughly between 45° and 50° N latitude and 130° to 150° W longitude (Ware and McFarlane 1989). A divergence in the prevailing wind patterns causes the west wind drift to split into two broad coastal currents, the California Current to the south and the Alaska Current to the north. As there are really several dominant currents in the region, all of which vary in geographical location, intensity, and direction with the seasons, this region is often referred to as the California Current System (Hickey 1979).
Marine Protected Areas
There are numerous Federal and state-managed Marine Protected Areas (MPAs) distributed throughout the project area. The EIS for Pacific Coast Groundfish EFH contains a complete analysis of these sites. Federally-managed areas include National Wildlife Refuges, National Parks, National Marine Sanctuaries, and National Estuarine Research Reserves. In addition, there are navigation-related managed areas, weather and scientific buoys, and hazardous and danger areas. Finally, there are federally-managed fishing areas such as the trawl RCAs, Cowcod Conservation Areas, Yelloweye Rockfish Conservation Areas, and Pacific Whiting Salmon Conservation Zones off the Klamath and Columbia Rivers, designed to minimize impacts to Pacific salmon in those areas.
Many state-managed MPAs are under varying degrees of management, ranging from no-take marine reserves to designations allowing more intensive or extractive uses. The California Marine Life Protection Act guides a system of MPAs to increase coherence and effectiveness in protecting the state's marine life and habitats, marine ecosystems, and marine natural heritage, as well as to improve recreational, educational and study opportunities provided by marine ecosystems subject to minimal human disturbance. Oregon MPAs include marine gardens, research reserves, and two pilot marine reserves. Washington State manages marine reserves, conservation easements, state parks, and other areas, all with varying levels of regulation covering passive and extractive uses.
West Coast Biogeography
The U.S. west coast contains a wide range of ecosystems and habitats, ranging from arid inland climates to alpine-dominated climates, to coastal rain forest-dominated areas. This section draws primarily from NMFS (2003). The Pacific Northwest coastal region is dominated by medium to high rainfall resulting from the interaction between marine weather systems and the coastal mountains, which reach up to 4,000 feet in elevation. Most coastal streams have relatively steep gradients with a shallow coastal plain. Forested lands are dominated by Sitka spruce, Douglas fir, western red cedar, and western hemlock. Numerous shrubs and herbaceous plants dominate the undergrowth. The southern Oregon and California coastal region typically experiences less rainfall than the Pacific Northwest, although is still influenced by marine weather.
44
Major inland river systems include the Columbia Basin, Klamath Basin, and the Sacramento/San Joaquin system (California Central Valley). These river basins provide spawning and rearing habitat for much of the Pacific Coast salmon fishery, and many smaller coastal watersheds contribute to both local and regional fisheries.
The West Coast oceanographic ecosystem is dominated by the California Current Large Marine Ecosystem, which is characterized by very high biological productivity. The California Current is formed by the bifurcation of the North Pacific Current as it approaches the West Coast. The California Current flows southward year round off shore from the shelf break to ~200 miles. Other coastal currents generally dominate along the continental shelf including the northward Davidson Current and California Undercurrent, the Southern California Countercurrent, as well as many eddies and smaller shelf currents. The biological productivity is reflected in the extensive nearshore kelp beds, large schools of CPS (e.g., sardine, anchovy, squid, etc.) and groundfish (Pacific hake) that, in turn, support large populations of marine mammals, sea birds and highly migratory species such as tuna, sharks, billfish (PFMC 2011b).

45
4. Analysis of Effects
This chapter is separated into three main sections. First, we describe analytical approach, then we provide an analysis by alternative. Finally, we provide additional analysis on a metric-by-metric basis.
4.1 Analytical Approach
This analysis will review effects of the alternatives vis a vis a range of metrics. The metrics include both environmental metrics, and socioeconomic metrics. There are five types of environmental metrics and three types of socioeconomic metrics. The metrics were calculated at four different levels – as described below.
Metrics
1. Spatial extent of closures and reopenings This metric describes the total spatial extent of the areas that would be closed to bottom trawling or reopened to bottom trawling, in square miles (mi2). It also includes the net change in area protected from bottom trawling. Proposal boundary data were provided by each proposer and are available via the EFH Data Catalog: http://efh-catalog.coas.oregonstate.edu/mapservice/
2. Substrate composition of areas proposed for closures and reopenings This metric describes the spatial extent, in mi2, and the proportion of the seafloor area covered by each of three substrate types: 1) hard bottom; 2) mixed bottom; and 3) soft bottom. The substrate data were developed or updated as part of the Groundfish EFH Synthesis by Oregon State University (OSU), referred to as v.3.6. (http://efh-catalog.coas.oregonstate.edu/synthesis/). Version 3.6 was used for areas in Central and Southern California. Some additional updates to these data were made by OSU through some work with the Bureau of Ocean and Energy Management (BOEM), referred to as v.4.0. Version 4.0 was used for areas in Northern California, Oregon, and Washington (http://bhc.coas.oregonstate.edu/boem_data/V4_0_SGH_WA_OR_NCA.zip). For areas that are not covered by the substrate data, the substrate type is listed as “unknown.”
3. Priority Habitats The priority habitats metric is comprised of five separate habitat types that were identified in Amendment 19, and confirmed by the Council during the development of Amendment 28. Using available data, we mapped areas within the trawl RCA that contain one or more of the priority habitats, and provide the spatial extent and percent of each of the following types of habitats:
• Hard substrate. This is the same as the spatial extent and percentage of hard substrate described above.

46
• Submarine canyons and gullies. Submarine canyons and gullies were delineated as part of the geologic mapping for the Groundfish EFH process in 2005 (http://marinehabitat.psmfc.org/physical-habitat.html) and updated by OSU for areas off of Northern California, Oregon, and Washington (v.4.0 described above). The boundaries for submarine canyon walls, canyon floors, and gullies were extracted from these data sets and overlayed with the EFHCA alternatives
• Seamounts. Seamounts were delineated as part of the Groundfish EFH process in 2005 (http://marinehabitat.psmfc.org/physical-habitat.html). For this metric, the boundaries from 2005 were supplemented by additional seamounts within the Pacific Coast EEZ that were delineated by GRID-Arendal (http://geonode.grida.no/layers/geonode:seamounts or http://www.grida.no/publications/story-maps/map/6596.aspx).
• Highest 20% habitat suitability probability (HSP) for overfished species. During the Groundfish EFH Synthesis process (2013), NOAA (both NWFSC and NCCOS) developed a set of gridded species models for a select group of groundfish species (http://efh-catalog.coas.oregonstate.edu/synthesis/). From these models, we used the predicted species occurrence data for the following overfished species, darkblotched rockfish, Pacific Ocean perch, and yelloweye rockfish. Any grid cell that was in the top 20% of predicted species occurrence was included. All grid cells meeting the top 20% criteria for any overfished species and from either source (NWFSC or NCCOS) was overlaid onto the alternatives and the total spatial extent (mi2) within an area was reported.
• Habitat-forming invertebrates. This metric was created from a database of records of coral, sponge and sea pen occurrence compiled by NOAA’s Deep Sea Coral Research and Technology Program (https://deepseacoraldata.noaa.gov/). The data come from a variety of sources, including visual surveys conducted by private research institutions (e.g., MBARI, Scripps Institution of Oceanography) and governmental agencies (e.g., NMFS, Sanctuaries). These presence-only data are points that represent individual in situ observations or the mid-point of underwater vehicle transects in which observations were summarized. The lack of absence or abundance data preclude the ability to determine, in a standardized way, the relative importance of individual areas to DSC&S.
Given these data limitations, the following approach was used to generate a useable measure of the presence of habitat-forming invertebrates. First, 1km x 1km grid was overlaid on the DSC database records with a locational accuracy rating of better than 1km. Two related metrics were then calculated for each polygon: the number of grid cells within, or overlapping with, each polygon that have at least one observation of DSC&S, and the proportion of the total number of grid cells within, or overlapping with, the polygon that have an observation. Figure 8 shows an example of how these metrics were calculated. In the example, 15 of the 60 cells overlapping with the polygon have observations, giving a cell count of 15 and a proportion of 0.25. For each alternative and latitudinal/depth zone, the metrics were summed across all polygons.

47
Figure 8. Calculation of habitat-forming invertebrate metric.
4. Conservation value Conservation value (Cvalue) is a metric developed to quantify how seafloor habitats support diverse and abundant demersal fish assemblages and biogenic habitat, given exposure to certain potential anthropogenic impacts. This metric was the product of the integration of eight datasets from EFH Synthesis Report data (Appendix C) as well as other published data. Other metrics were considered for inclusion, but only those that provided reliable predictions across the extent of the trawl footprint were included. Each of the eight datasets was normalized, giving values that ranged from 0 to 1. The scores were applied across a grid of 2km x 2km cells that spanned the area under consideration and used to calculate summary layers of conservation value “mean”, “variance”, and “data quality”. “Data quality” represents the number of datasets that covered the grid cell, and ranged from 0 to 8.
For each alternative, latitudinal/depth zone, and polygon, the Cvalue and variance were calculated across all of the grid cells contained therein. Only those grid cells with a data quality of at least 4 (i.e., covered by at least four of the datasets) were included in these calculations. See Appendix C for a more detailed discussion of this metric.
5. Protected resources This metric relies on data products that look at interactions between bottom trawl gear and protected resources. The analysis uses observed interactions collected by the West Coast Groundfish Observer Program. Protected resources (i.e., salmon, marine mammals, seabirds, and turtles) are those species or stocks that are regulated by one or more of the following laws: Endangered Species Act (ESA), Marine Mammal Protection Act (MMPA), and the Migratory Bird Treaty Act (MBTA) and Responsibilities of Federal Agencies to Protect Migratory Birds (EO 13186). The information will include those species that are
48
found in the area of operation of the fishery and an analysis of the historic observed interactions (2002-2014) and the potential changes in interaction rates that may occur under each alternative. Because interactions with protected species in the bottom trawl fishery are random events that are not spatially consistent or predictable, it is not possible to provide accurate projected interactions rates for an area when it is closed or newly reopened.
6. Bottom trawl effort displaced by the closures and restored by the reopenings This metric describes the anticipated impact that the closures or reopenings would have on bottom trawl effort. “Trawl effort” is defined, for the purposes of this analysis, as the total miles of trawling that occurs within the proposed closures or reopenings. Trawl effort in the proposed closures would be displaced, as it is assumed that the fishery would shift to other areas, and trawl effort in the proposed reopenings would be restored. The available data are limited to start and end points when using logbook data, and for the purposes of this analysis, the trawl track is assumed to be a straight line between those points. The effort that would be displaced or restored is the proportion of a trawl track that occurs within a polygon. For instance, if the straight-line trawl track is 10 miles, and 40% of that trawl occurred in a proposed closure, 4 miles of trawl effort would be considered displaced. The Team fully understands that trawl tracks are not linear, and considered four alternative approaches for achieving more accurate trawl tracks: bathymetry-derived tow lines, ellipse-based buffer, simple buffer, and vessel monitoring system (VMS) data. Although the VMS shows promise for future utility, these four alternative approaches were ultimately not pursued due to time, staff, and/or data limitations. Using the straight line analysis, this metric is expressed in two ways, first as the miles of trawl effort that would be displaced or restored, and second, as the percentage of the coastwide effort that would be displaced or restored. Displaced fishing effort was estimated using WCGOP data between 2011 and 2014. Restored fishing effort was estimated using, where appropriate, logbook data from 1998-2001 (EFHCAs and trawl RCA) and 2002 – 2006 (EFHCAs only). Different time periods were chosen for estimating displaced effort because EFHCAs and trawl RCAs were implemented at different times. Predicting the effort that would be restored by the reopenings is very difficult because of the limitations and availability of data, and changes to the fishery that have occurred since the EFHCAs and trawl RCAs were first implemented, in particular the catch shares program. There are virtually no effort data in the closed areas for the last 10-15 years. As such, estimates of the restored effort should be viewed with caution.
7. Catch composition displaced by the closures and restored by the reopenings. This metrics estimates the catch that would be displaced by closures and restored by reopenings, and is based on the proportion of each tow that occurred in a polygon, as described above. For example, if a particular tow caught 2 mt of flatfish, and 60% of that tow occurred in a particular polygon, then we assumed that 60% of the flatfish, or 1.2 mt,

49
were caught in that polygon. Catch was estimated for five species groups: (1) rockfishes, (2) flatfishes, (3) roundfishes2, (4) sharks3, and (5) other species, and includes discards. To quantify the anticipated impact that the closures would have on catch, we used data collected by the West Coast Groundfish Observer Program (WCGOP) for years 2011 - 2014. To estimate restored catch, we used, as appropriate, fishery-dependent catch data (state logbooks and PacFIN fish tickets) from 1998-2001 (EFHCA and trawl RCA) and 2002 – mid-2006 (EFHCAs only). Predicting the effort that would be restored by the reopenings is very difficult because of data limitations and availability and changes to the fishery that have occurred since the EFHCAs and trawl RCAs were first implemented, in particular the catch shares program. As with the effort analysis, estimates of the restored catch should be viewed with caution. Weights by species include discard weights.
8. Ex-vessel value of the catch displaced by the closures and restored by the reopenings. This metric estimates the average annual fleet-wide revenue, associated with bottom trawl effort displaced by closures or restored by reopenings using the catch composition calculated above. Net change in ex-vessel value is calculated as “restored ex-vessel value – displaced ex-vessel value”. Historical fishing behavior, calculated according to logbook data described above, may not accurately predict impacts to the current trawl fishery due to the impacts of intervening management changes, particularly the buyback which dramatically reduced fleet size, and the IFQ program which led to further declines in fishing effort in the bottom-trawl fishery, particularly in California. Confidentiality Rules: It is important to note that due to confidentiality rules, we are not able to report the socioeconomic metrics for those latitudinal/depth zones or individual EFH or trawl RCA polygons with low fishing participation. Confidentiality rules prevent the Team from reporting information when fewer than three fishing vessels are involved. Confidential information is noted as such in the tables.
Analytical Levels
The Team conducted a multi-level analysis of the EFHCA and trawl RCA alternatives. For each alternative, there are four levels of analysis, which are described in greater detail below: 1) by the net effects of the alternatives (alternative-wide); 2) by latitudinal areas and depth zones; 3)by each port or port group ; and 4) by the individual polygons in the alternative. The higher level analyses sum the metrics for the individual polygons across the appropriate level. Where possible, the net effect of the alternative on each metric is calculated. For the environmental metrics, net change in environmental protection is calculated as “areas closed – areas reopened”. Positive values indicate a net increase in habitat protections and negative values indicate a net decrease in habitat protections. For the socioeconomic metrics, net change in effects to the fishing community is calculated as “areas reopened – areas closed.” Positive values indicate a net increase in areas reopened to bottom trawling, and negative values indicate a net decrease.
2 Roundfishes include cabezon, kelp greenling, lingcod, Pacific cod, Pacific hake, sablefish, grenadiers, and morids. 3 Sharks include sharks, skates, and ratfishes

50
4.1.2.1 Alternative-Wide Analysis
The metrics at this level of analysis are the sum of the values for the individual polygons in the alternative. This is a “big picture’ analysis that broadly describes how each alternative would impact environmental and socioeconomic resources and can be used to conduct a relative comparison of the overall effects of the alternatives.
4.1.2.2 Latitudinal Zones/Depth Zones Analysis
This analysis divides the West Coast into five latitudinal zones and four depth zones, for a total of 20 separate latitudinal/depth zones (Figure 9). The latitudinal zones are based on existing latitudinal breaks currently used by the Council and the depth zones are based on the April 2015 recommendations by the Groundfish Management Team, and are the same as the trawl RCA block area closures described under Alternative 3d. This analysis sums the individual metrics within each latitudinal zone and depth zone and depicts the spatial distribution of the changes along the West Coast for each alternative. Latitudinal Zones
• US/Canada Border-Pt Chehalis • Pt Chehalis-Cape Blanco • Cape Blanco-Cape Mendocino • Cape Mendocino-Pt Conception • Pt Conception-US/Mexico border
Depth Zones*
• Nearshore (state territorial sea boundary 30fm) • Shelf (30-100fm) • Slope (100-150fm) • Slope (150-700fm)
*Areas within these depth contours that occur within state waters are excluded from analysis. Other than in Washington State, the 30 fathom line is frequently within state waters and the 100 fathom and 150 fathom lines occasionally cross into state waters, particularly in California.

51
Figure 9. Latitudinal breaks and depth zones used in the analysis.

52
4.1.2.3 Port/Port Group Analysis
This analysis will sum the socioeconomic metrics attributed to each port or port group across the alternative, and will show how the socioeconomic costs and benefits are distributed across the West Coast’s fishing communities (Figure 10). The ports and port groups used in the analysis are listed here, and shown on Figure 9.
• Puget Sound • North Washington Coast • South and Central Washington • Astoria, OR • Newport, OR • Coos Bay, OR • Brookings, OR • Crescent City • Eureka, CA • Fort Bragg, CA • Bodega Bay, CA • San Francisco, CA • Monterey, CA • Morro Bay, CA

53
Figure 10. Port groups used in the analysis.
4.1.2.4 Polygon Analysis
This analysis presents the metrics, individually, for each polygon in each alternative. The metrics for polygons in the proposals that were eliminated as stand-alone alternatives in April 2016 as well as the polygons that were not included in the final Collaborative proposal (off the Oregon Coast and in the Southern California Bight) were also generated, at the Council’s request. This analysis allows comparison of the impacts of the individual polygons within and between alternatives, and can be used by the Council to refine their PPA and/or the FPA.

54
4.2 Analysis by Alternative
Subject Area 1: EFHCA changes contained in public proposals
This Subject Area addresses modifications to EFHCAs closed to bottom trawl gear only, that were contained in the public proposals. The Council established the scope to focus on the Collaborative and the Oceana et al. proposals. Accordingly, the three alternatives in this subject area are 1a No Action, 1b Collaborative, and 1c Oceana et al. At the end of this subpart, a comparison of the three alternatives by metric is presented. The analysis by geographic/depth zones, ports, and polygons (including the polygons from the other proposals) are found in Appendices D, E, and F, respectively.
4.2.1.1 Alternative 1a: No Action
The no action alternative would maintain the configuration of the current EFHCAs closed to bottom trawl gear. While various types and combinations of bottom-contact gear are prohibited in the EFHCAs, they all prohibit bottom trawl gear (Figure 1). Therefore, this analysis considers the spatial extent and habitat types in all EFHCAs combined, with the exception of the 700 fm trawl footprint closure. The 700 fm trawl footprint closure is excluded from this analysis because no changes are being considered in this area and the fishery has historically been executed landward of that line. It is important to note that, while not all of the metrics have been calculated for this alternative, they will be for the DEIS. The environmental metrics for this alternative are in Table 16.
Habitat
As shown in Table 16, the majority of the area protected by the existing EFHCAs consists of soft substrate (71.4%). The remaining substrate types represent a far smaller percentage of the closed areas, with hard substrate being more protected than mixed substrate (14.2% and 1.8%, respectively). The No Action Alternative would not result in any additional impacts, positive or negative.

55
Table 16. Environmental metrics for Alternative 1a No Action Metrics apply to the EFHCAs shallower than 700 fm. Percent (%) is the percent of the proposed closures or reopenings made up by that metric (e.g., 14.2% of the total closed area consists of hard substrate). Net = Close – Reopen. Positive net values mean a net increase in the extent of area closed to bottom trawling. “OFS 20% HSP” highest 20% habitat suitability probability (HSP) for overfished species, DSC = deep-sea corals, DSC&S = deep-sea corals and sponges.
Spatial extent (mi2) 13,463
Subs
trat
e Ty
pe
(mi2
)
Hard* mi2 1,911 % 14.2%
Mixed mi2 241 % 1.8%
Soft mi2 9,615 % 71.4%
Unknown mi2 1,696 % 12.6%
Prio
rity
Hab
itats
Canyon/Gullies mi2 NA % NA
OFS 20% HSP mi2 NA % NA
Hab
itat-f
orm
ing
Inve
rtebr
ates
Total Grid Cells NA
DSC Grid cells NA % NA
Sponges Grid cells NA % NA
Sea pens
Grid cells 632 % NA
DSC&S Grid cells 562 % NA
Conservation Value Mean NA CV NA
*Hard substrate is also a priority habitat.
Fish Resources
The No Action Alternative would not result in any change to existing impacts on fish resources, both federally managed or not. Current EFHCAs closed to bottom trawling would remain closed, and therefore there would be no anticipated change in any impacts to fish resources.
Protected Resources
Under the No Action Alternative, protected species impacts would be similar to those observed in recent years as described in Chapter 3, Section 3.2. Since fishing inside EFHCAs is prohibited, no interactions are expected in these areas under the No Action Alternative.
Socioeconomic Resources
The No Action Alternative would result in a status quo situation with regard to groundfish bottom

56
trawl activities, and therefore would not impact socioeconomic resources. It is important to note that the trawl RCA is currently closed to bottom trawling to limit the bycatch of overfished species, and the No Action Alternative represents essentially a status quo situation with respect to all bottom trawl activities, as long as the trawl RCA remains intact. As such, the baseline information regarding landings and revenues would remain status quo.
4.2.1.2 Alternative 1b: Collaborative
This Alternative would change the current configuration of the EFHCAs closed to bottom trawls only. It includes 43 proposed closures and 16 proposed reopenings (Figure 2). The environmental metrics for this alternative are in Table 17.
Table 17. Environmental metrics for Alternative 1.b Collaborative Percent (%) is the percent of the proposed closures or reopenings made up by that metric (e.g., 10.5% of the total closed area consists of hard substrate and 2.4% of the total number of 1km grid cells contain DSC observations). Net = Close – Reopen. Net = Close – Reopen. Positive net values mean a net increase in the extent of area closed to bottom trawling. “OFS 20% HSP” highest 20% habitat suitability probability (HSP) for overfished species, DSC = deep-sea corals, DSC&S = deep-sea corals and sponges.
Metric Action Close Reopen Net
Spatial extent (mi2) 994 246 748
Subs
trat
e Ty
pe Hard* mi2 105 5 100
% 10.5% 1.8%
Mixed mi2 53 0 53 % 5.3% 0.0%
Soft mi2 836 241 595 % 84.2% 98.2%
Unknown
mi2 0 0 0 % 0.0% 0.0%
Prio
rity
Hab
itats
Canyon/Gullies mi2 255 45 210 % 25.7% 18.4%
OFS 20% HSP mi2 41 36 5 % 4.1% 14.8%
Hab
itat-f
orm
ing
Inve
rteb
rate
s
Total Grid cells 3588 956 2632
DSC Grid cells 85 5 80 % 2.4% 0.5%
Sponges Grid cells 59 1 58 % 1.6% 0.1%
Sea pens
Grid cells 67 22 45 % 1.9% 2.3%
DSC&S Grid cells 95 5 90 % 2.6% 0.5%
Conservation Value Mean 0.45 0.52 CV 0.06 0.08
*Hard substrate is also a priority habitat

57
Habitat
As shown in Table 17, the Collaborative Alternative would result in a net gain in the area closed to bottom trawling of 748 mi2. These gains occur in all substrate and priority habitat types, but the majority would occur in soft substrate (595 mi2), followed by hard and mixed substrate, respectively. The greatest gain in priority habitats would be in submarine canyons and gullies (210 mi2). These metrics indicates a net increase in conservation of EFH by this alternative. While the combined conservation value for the areas to be closed is lower than the areas to be reopened (0.45 vs 0.52), it is important to note that the area to be closed is four times as large as the area to be reopened (994 mi2 vs 246 mi2).
Fish Resources
Fish resources affected by the Collaborative Alternative include groundfish species caught in the bottom trawl fishery as well as those other species caught as bycatch. Non-FMP species include slender sole and unidentified sculpin. State-managed species incidentally caught in groundfish bottom trawl fishery include California halibut and Dungeness crab (Somers et al. 2016).
Protected Resources
Since bottom trawling is prohibited in the EFHCAs there are no observed protected species impacts to report for the existing EFHCAs. Data for observed protected species interactions in areas that were previously trawled and now proposed as a new EFHCA are reported in Table 18.
Table 18. Total (count and weight in lb.) protected fish species interactions observed in proposed EFH closed areas for each proposal
Alternative Eulachon
(count/weight)
King (Chinook) Salmon (count/weight)
Silver (Coho) Salmon (count/weight)
1b Collaborative 0.12 / 0.006 2.3 / 7.8 0
Socioeconomic Resources
The socioeconomic impacts associated with the Collaborative Alternative are compiled in terms of miles of bottom trawling, catch composition, and revenues (exvessel value) displaced by the proposed closures and restored by the proposed reopenings. (This section focuses on impacts to fishing effort. Catch and revenue data will be provided supplemental to this report). In the areas proposed for closure, 994 miles of trawling occurred between 2011 and 2014, representing 0.3% of the total coastwide trawl effort at that time. In the areas proposed for reopening, 1277 miles of trawling occurred over the last four years that it was fished, 2002-2006, representing 0.2% of the total coastwide trawl effort during that time period. Assuming these percentages are an accurate reflection of the trawl effort that would occur in the reopened areas, this alternative would result in a net displacement of less than 0.1% of the coastwide trawl effort. This assumption should be viewed with extreme caution, however, as fishery management has changed significantly since the EFHCAs were first established, in particular by implementation of the catch shares system. As

58
such these numbers should be viewed qualitatively rather than quantitatively.
Alternative 1b is essentially a status quo situation with respect to groundfish bottom trawl activities, as long as the trawl RCA remains intact. As such, the baseline information regarding landings and revenues would remain status quo. However, state-managed non-groundfish trawling within the trawl RCA (California halibut, pink shrimp, ridgeback prawn, and sea cucumber trawl) may be impacted. These fisheries are allowed to fish in the trawl RCA but are restricted from EFHCAs; therefore if the new EFHCAs are added within the trawl RCA then socioeconomic impacts could be incurred.
4.2.1.3 Alternative 1.c: Oceana et al.
This Alternative would change the current configuration of the EFHCAs closed to bottom trawls only. It includes 61 proposed closures and seven proposed reopenings (Figure 3). The environmental metrics for this alternative are in (Table 19).
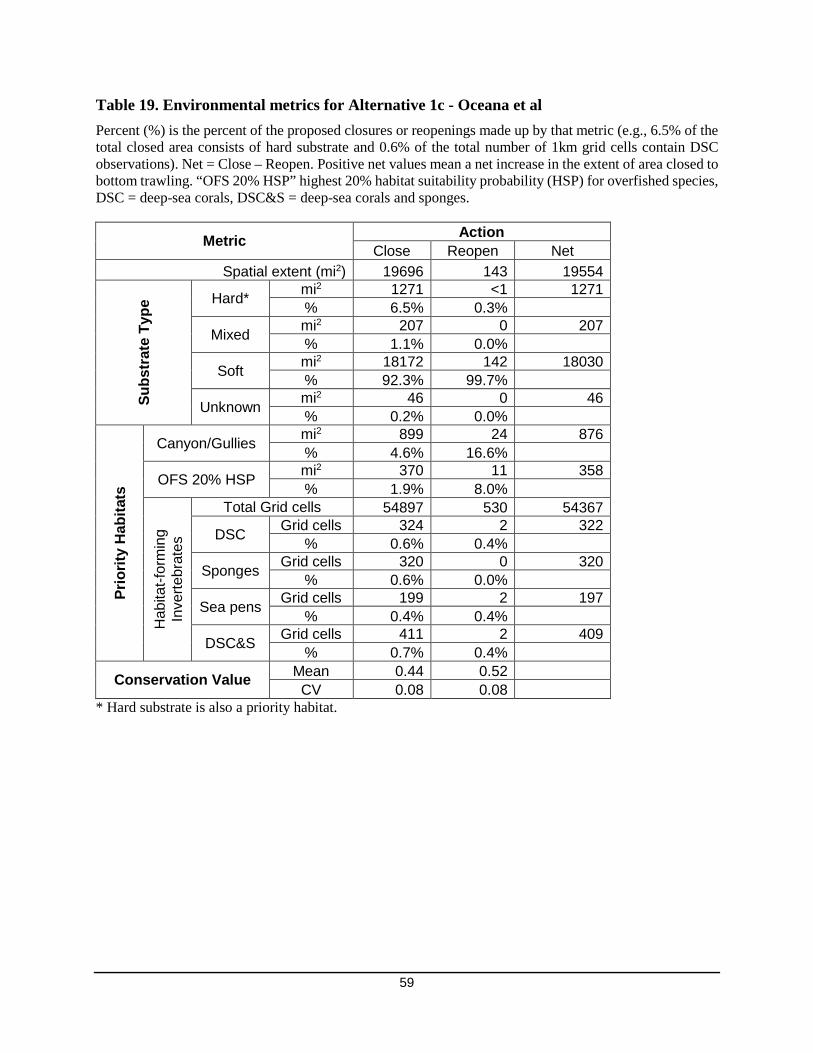
59
Table 19. Environmental metrics for Alternative 1c - Oceana et al Percent (%) is the percent of the proposed closures or reopenings made up by that metric (e.g., 6.5% of the total closed area consists of hard substrate and 0.6% of the total number of 1km grid cells contain DSC observations). Net = Close – Reopen. Positive net values mean a net increase in the extent of area closed to bottom trawling. “OFS 20% HSP” highest 20% habitat suitability probability (HSP) for overfished species, DSC = deep-sea corals, DSC&S = deep-sea corals and sponges.
Metric Action Close Reopen Net
Spatial extent (mi2) 19696 143 19554
Subs
trat
e Ty
pe Hard* mi2 1271 <1 1271
% 6.5% 0.3%
Mixed mi2 207 0 207 % 1.1% 0.0%
Soft mi2 18172 142 18030 % 92.3% 99.7%
Unknown mi2 46 0 46 % 0.2% 0.0%
Prio
rity
Hab
itats
Canyon/Gullies mi2 899 24 876 % 4.6% 16.6%
OFS 20% HSP mi2 370 11 358 % 1.9% 8.0%
Hab
itat-f
orm
ing
Inve
rtebr
ates
Total Grid cells 54897 530 54367
DSC Grid cells 324 2 322 % 0.6% 0.4%
Sponges Grid cells 320 0 320 % 0.6% 0.0%
Sea pens Grid cells 199 2 197 % 0.4% 0.4%
DSC&S Grid cells 411 2 409 % 0.7% 0.4%
Conservation Value Mean 0.44 0.52 CV 0.08 0.08
* Hard substrate is also a priority habitat.
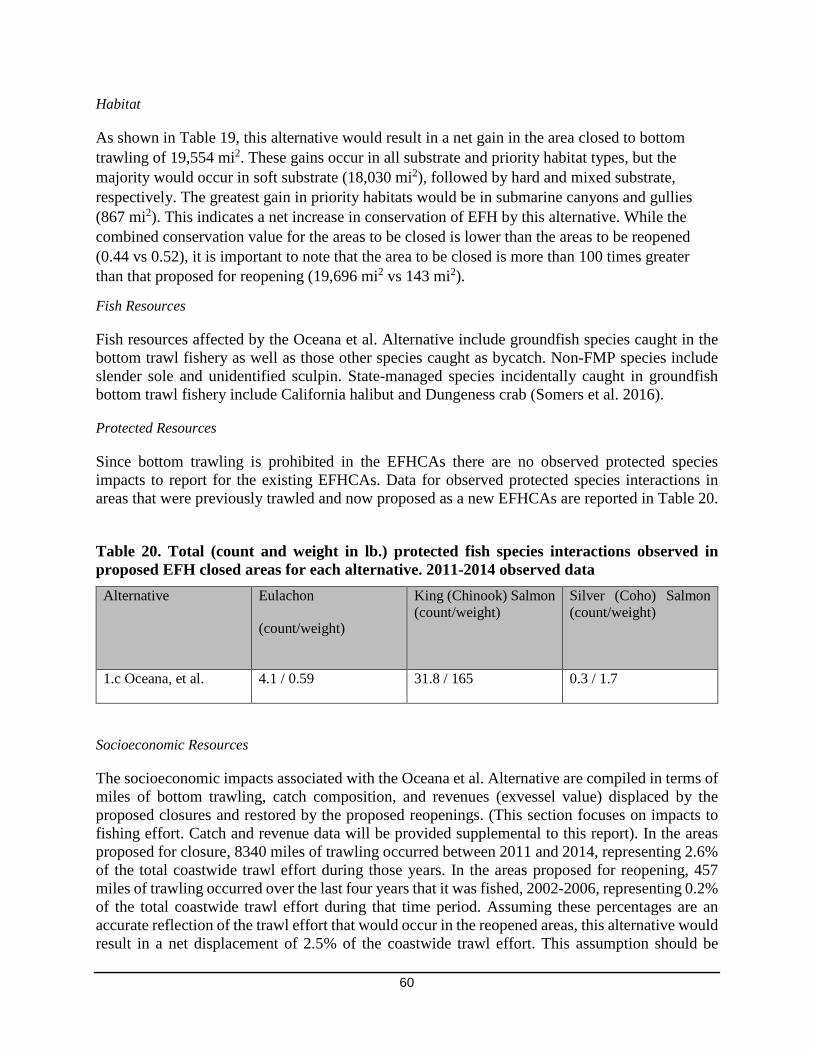
60
Habitat
As shown in Table 19, this alternative would result in a net gain in the area closed to bottom trawling of 19,554 mi2. These gains occur in all substrate and priority habitat types, but the majority would occur in soft substrate (18,030 mi2), followed by hard and mixed substrate, respectively. The greatest gain in priority habitats would be in submarine canyons and gullies (867 mi2). This indicates a net increase in conservation of EFH by this alternative. While the combined conservation value for the areas to be closed is lower than the areas to be reopened (0.44 vs 0.52), it is important to note that the area to be closed is more than 100 times greater than that proposed for reopening (19,696 mi2 vs 143 mi2).
Fish Resources
Fish resources affected by the Oceana et al. Alternative include groundfish species caught in the bottom trawl fishery as well as those other species caught as bycatch. Non-FMP species include slender sole and unidentified sculpin. State-managed species incidentally caught in groundfish bottom trawl fishery include California halibut and Dungeness crab (Somers et al. 2016).
Protected Resources
Since bottom trawling is prohibited in the EFHCAs there are no observed protected species impacts to report for the existing EFHCAs. Data for observed protected species interactions in areas that were previously trawled and now proposed as a new EFHCAs are reported in Table 20.
Table 20. Total (count and weight in lb.) protected fish species interactions observed in proposed EFH closed areas for each alternative. 2011-2014 observed data
Alternative Eulachon
(count/weight)
King (Chinook) Salmon (count/weight)
Silver (Coho) Salmon (count/weight)
1.c Oceana, et al. 4.1 / 0.59 31.8 / 165 0.3 / 1.7
Socioeconomic Resources
The socioeconomic impacts associated with the Oceana et al. Alternative are compiled in terms of miles of bottom trawling, catch composition, and revenues (exvessel value) displaced by the proposed closures and restored by the proposed reopenings. (This section focuses on impacts to fishing effort. Catch and revenue data will be provided supplemental to this report). In the areas proposed for closure, 8340 miles of trawling occurred between 2011 and 2014, representing 2.6% of the total coastwide trawl effort during those years. In the areas proposed for reopening, 457 miles of trawling occurred over the last four years that it was fished, 2002-2006, representing 0.2% of the total coastwide trawl effort during that time period. Assuming these percentages are an accurate reflection of the trawl effort that would occur in the reopened areas, this alternative would result in a net displacement of 2.5% of the coastwide trawl effort. This assumption should be

61
viewed with extreme caution, however, as fishery management has changed significantly since the EFHCAs was first established, in particular by implementation of the catch shares system. As such these numbers should be viewed qualitatively rather than quantitatively.
Alternative 1c is essentially a status quo situation with respect to groundfish bottom trawl activities, as long as the trawl RCA remains intact. As such, the baseline information regarding landings and revenues would remain status quo. However, state-managed non-groundfish trawling within the trawl RCA (California halibut, pink shrimp, ridgeback prawn, and sea cucumber trawl) may be impacted. These fisheries are allowed to fish in the trawl RCA but are restricted from EFHCAs; therefore if the new EFHCAs are added within the trawl RCA then socioeconomic impacts could be incurred. The Council is currently considering modifications to the trawl RCA (Subject Area 3). Therefore, an impacts analysis of this alternative was conducted to inform the Council in the event that the trawl RCA is eliminated or modified.
4.2.1.4 Comparison of Subject Area 1 Alternatives by Metric
This section compares the individual metrics across all three of the Subject Area 1 alternatives. There are environmental metrics – spatial extent; substrate type, priority habitat type, conservation value, and protected species; and socioeconomic metrics - bottom trawl effort, catch composition, and exvessel value.
Metric 1. Spatial extent.
The spatial extent of the changes in each of the three alternatives are shown in Table 21. While both action alternatives would increase the spatial extent of the bottom trawl closures, the Oceana et al. alternative would close more than 26 times the area than the Collaborative alternative and almost triple the area closed to bottom trawling (187%). Excluding the largest proposed polygon in the Oceana et al. proposal (Southern California Bight, 16,243 mi2), the Oceana et al. alternative would still close almost five times more area than the Collaborative alternative (3453 mi2) and increase the .
Table 21. Spatial extent (mi2) of current EFHCAs compared to the changes resulting from the other Subject Area 1 alternatives Net change = Close – Reopen. Percent Change = % relative to the area currently closed to bottom trawling landward of 700 fm. Positive values mean increase in area protection, negative values mean reduction in area protected.
Alternative Close (mi2) Reopen (mi2) Net (mi2) % Change
1.a No Action 13,463 - - -
1.b Collaborative +994 -246 +748 +5.6%
1.c Oceana, et al. +19,696 -143 +19554 +146.3%
62
Metric 2. Substrate Type
The spatial extent of the substrate types in each of the three alternatives are shown in Table 22. As seen in here, the greatest gains in protection, for both action alternatives, would be for soft sediment, followed by hard and mixed, respectively. When compared to the existing EFHCA closed to bottom trawling, the Oceana et al. Alternative would protect 30 times the area of soft substrate than would the Collaborative Alternative (18,030 mi2 vs 595 mi2). This represents a 187% increase compared to a 6% increase, respectively. This pattern holds for both hard and mixed substrates, although the differences are smaller. As with the overall spatial extent, much of the difference in soft substrate is due to the Southern California Bight (15305 mi2 of soft substrate).

63
Table 22. Comparison of the spatial extent (mi2) of the substrate types closed or reopened to bottom trawling by Subject Area 1 alternatives Net change = Close – Reopen. Percent of Net = relative percent increase in EFHCAs closed to bottom trawling. Positive values mean increase in area protection, negative values mean reduction in area protected. Unkn = unknown.
Alternative Close (mi2) Reopen (mi2) Net (mi2)
Hard Mixed Soft Unkn Hard Mixed Soft Unkn Hard Mixed Soft Unkn
1.a No Action mi2 1,911 241 9,615 1,696 - - - - - - - -
% 14.2% 1.8% 71.4% 12.6% - - - - - - - -
1.b Collaborative
mi2 105 53 836 0 5 0 241 0 100 53 595 0
% 10.5% 5.3% 84.2% 0% 1.8% 0.0% 98.2% 0.0% 5.2% 22.0% 6.2% 0.0%
1.c Oceana, et al.
mi2 1271 207 18,172 46 0 0 142 0 1271 207 18,030 46
% 6.5% 1.1% 92.3% 0.2% 0.3% 0.0% 99.7% 0.0% 66.5% 85.9% 187.5% 2.7%
Metric 3. Priority habitats
The spatial extent of the priority habitats in the Subject Area 1 alternatives is shown in Table 23. With the exception of hard bottom habitat, the priority habitat metrics for Alternative 1.a, No Action, have not yet been calculated, but will be for the DEIS. Therefore, this is largely limited to a comparison between the two action alternatives. As shown in Table 23, while both action alternatives would increase the area of each priority habitats that are protected, the Oceana et al. Alternative would protect a greater area of all types of priority habitats than would the Collaborative Alternative. The greatest difference is in the hard bottom habitat, where the Oceana et al. Alternative would protect more than 12 times the area of hard bottom habitat as would the Collaborative (66 % and 5% increase, respectively) to the existing protections. The Oceana et al. Alternative would protect over 70 times the area of OFS 20% HSP habitat, and approximately 4 times the area of submarine canyon and habitat forming invertebrate habitats than the Collaborative Alternative.
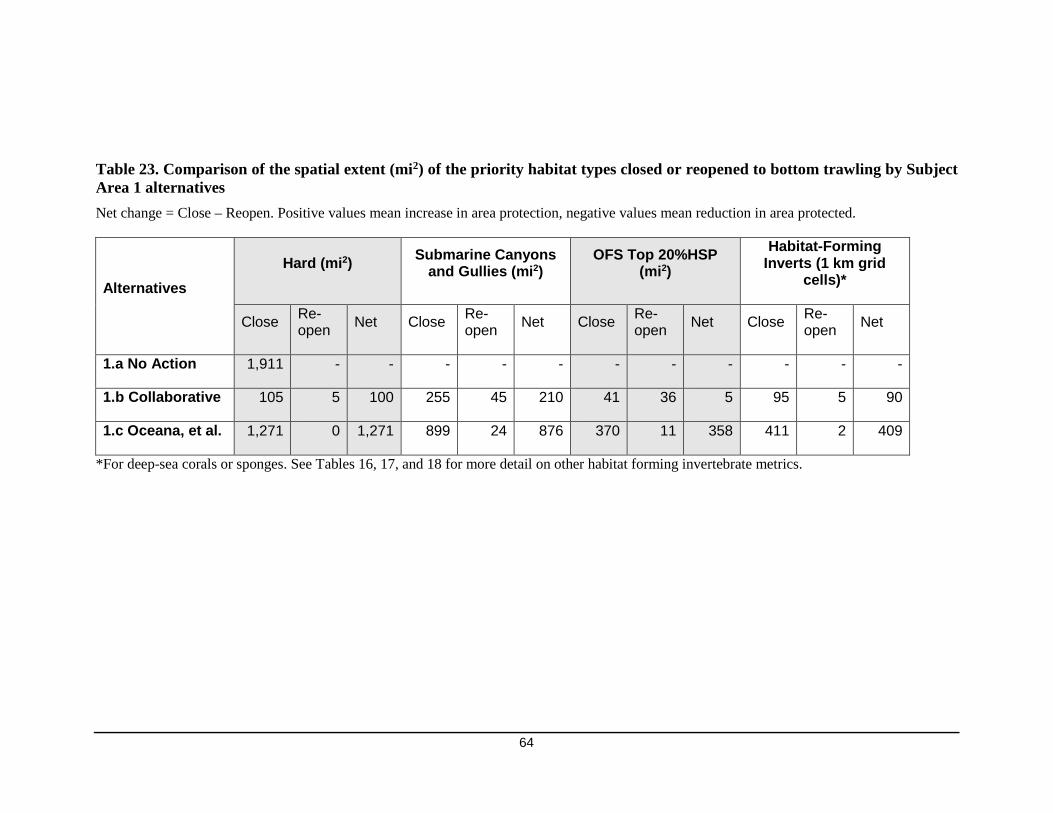
64
Table 23. Comparison of the spatial extent (mi2) of the priority habitat types closed or reopened to bottom trawling by Subject Area 1 alternatives Net change = Close – Reopen. Positive values mean increase in area protection, negative values mean reduction in area protected.
Alternatives Hard (mi2) Submarine Canyons
and Gullies (mi2) OFS Top 20%HSP
(mi2) Habitat-Forming
Inverts (1 km grid cells)*
Close Re-open Net Close Re-
open Net Close Re-open Net Close Re-
open Net
1.a No Action 1,911 - - - - - - - - - - -
1.b Collaborative 105 5 100 255 45 210 41 36 5 95 5 90
1.c Oceana, et al. 1,271 0 1,271 899 24 876 370 11 358 411 2 409
*For deep-sea corals or sponges. See Tables 16, 17, and 18 for more detail on other habitat forming invertebrate metrics.

65
Metric 4. Conservation Value
Table 24 shows the mean Cvalue, averaged across all areas proposed for closure or reopening, for the Subject Area 1 action alternatives. The conservation value for the No Action Alternative have not been calculated. As can be seen in the table, there is little to no difference between the Cvalue for the Collaborative and Oceana et al. alternatives. However, when the far greater spatial extent of the Oceana et al. Alternative is considered (19,696 vs 994 mi2), it provides greater overall conservation value than does the Collaborative Alternative.
Table 24. Mean conservation value (± 1 s.d.) for each alternative
Alternative Close Reopen
Mean ± 1 s.d. Spatial extent (mi2) Mean ± 1 s.d. Spatial
extent (mi2) 1.a No Action - - - - 1.b Collaborative 0.46 ± 0.09 994 0.52 ± 0.07 246 1.c Oceana, et al. 0.44 ± 0.08 19696 0.52 ± 0.06 143
Metric 5. Protected Species
The catch of protected fish species by the bottom trawl fishery in the areas proposed for closure by the Subject Area 1 alternatives are shown in Table 25. The information only includes areas that were previously open to trawling activity.
Table 25. Total (count and weight in pounds) protected fish species interactions observed in proposed EFHCAs for each proposal
Proposal Eulachon (count/weight)
King (Chinook) Salmon (count/weight)
Silver (Coho) Salmon (count/weight)
1.b Collaborative 0.12 / 0.006 2.3 / 7.8 0 1.c Oceana, et al. 4.1 / 0.59 31.8 / 165 0.3 / 1.7
Metric 6. Bottom trawl effort
The trawl effort that would be displaced by the closures and restored by the reopenings are shown in Table 26, as both the miles of trawling that occurred in the areas over the relevant 4-year time period (closures 2011-2014, reopenings 2002-2006), and as a percent of the coastwide trawl effort during those periods. This table should be interpreted with caution, as it compares information from two time periods and implies a level of precision that does not exist, given that some of the data are from historical records and fishery practices have changed over the intervening years. For example, although the miles of trawling that occurred in the Collaborative closures is lower than the miles that occurred in the reopenings (994 vs 1,277 miles), the percent of the coastwide effort is greater in the closures (0.3% vs 0.2%). This is because the coastwide effort was greater during 2002-2006 than in 2011-2014, after implementation of the catch shares program. Therefore, these data should be viewed qualitatively rather than quantitatively.

66
Notwithstanding these caveats, while both alternatives would negatively affect trawl effort, the impact of the Collaborative Alternative would be less than that of the Oceana et al. Alternative.
Table 26. Miles of bottom trawling and percent of coastwide bottom trawl effort displaced or restored and net change for Subject Area 1 alternatives Net = Restored Proportion- Displaced Proportion. Negative net values indicate a net displacement of trawl effort.
Alternative Close Reopen Net change % of
coastwide effort
Miles % of
coastwide effort
Miles % of
coastwide effort
1.b Collaborative 994 0.3% 1,277 0.2% trace negative 1.c Oceana, et al. 8,340 2.6% 457 <0.1% -2.5%
Subject Area 2: New EFHCAs within the current RCA
This subject areas addresses the protection of priority habitats, as defined by the Council, within the 2015 trawl RCA.
4.2.2.1 Alternative 2a: No Action
This Alternative would not apply any new EFHCAs within the trawl RCA, and would depend on existing EFHCAs for habitat protections within the trawl RCA should it be eliminated. Although this alternative, by itself, would not affect the habitats in the trawl RCA, those habitats are described here to inform the Council’s selection of a PPA (Table 27).
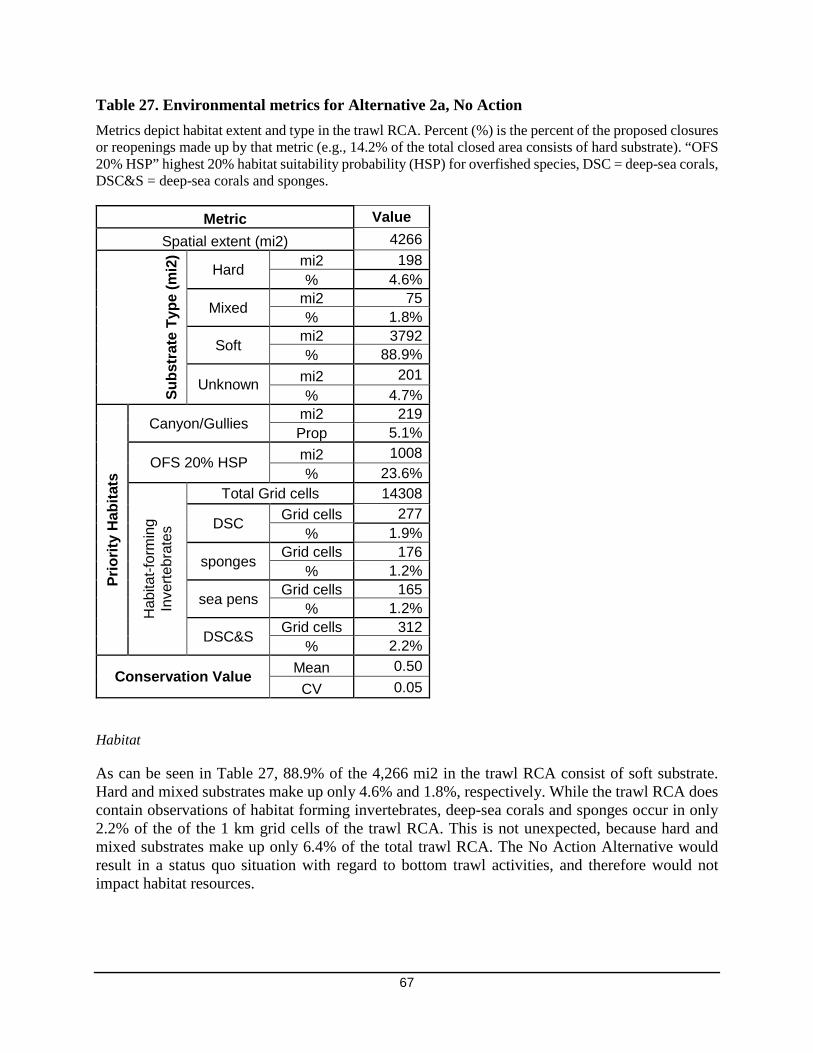
67
Table 27. Environmental metrics for Alternative 2a, No Action Metrics depict habitat extent and type in the trawl RCA. Percent (%) is the percent of the proposed closures or reopenings made up by that metric (e.g., 14.2% of the total closed area consists of hard substrate). “OFS 20% HSP” highest 20% habitat suitability probability (HSP) for overfished species, DSC = deep-sea corals, DSC&S = deep-sea corals and sponges.
Metric Value Spatial extent (mi2) 4266
Subs
trat
e Ty
pe (m
i2)
Hard mi2 198 % 4.6%
Mixed mi2 75 % 1.8%
Soft mi2 3792 % 88.9%
Unknown mi2 201 % 4.7%
Prio
rity
Hab
itats
Canyon/Gullies mi2 219 Prop 5.1%
OFS 20% HSP mi2 1008 % 23.6%
Hab
itat-f
orm
ing
Inve
rtebr
ates
Total Grid cells 14308
DSC Grid cells 277 % 1.9%
sponges Grid cells 176 % 1.2%
sea pens Grid cells 165 % 1.2%
DSC&S Grid cells 312 % 2.2%
Conservation Value Mean 0.50 CV 0.05
Habitat
As can be seen in Table 27, 88.9% of the 4,266 mi2 in the trawl RCA consist of soft substrate. Hard and mixed substrates make up only 4.6% and 1.8%, respectively. While the trawl RCA does contain observations of habitat forming invertebrates, deep-sea corals and sponges occur in only 2.2% of the of the 1 km grid cells of the trawl RCA. This is not unexpected, because hard and mixed substrates make up only 6.4% of the total trawl RCA. The No Action Alternative would result in a status quo situation with regard to bottom trawl activities, and therefore would not impact habitat resources.

68
Fish Resources
The No Action Alternative would result in a status quo situation with regard to bottom trawl activities, and therefore would not impact habitat resources.
Protected Resources
The No Action Alternative would result in a status quo situation with regard to bottom trawl activities, and therefore would not impact protected resources.
Socioeconomic Resources
The No Action Alternative would result in a status quo situation with regard to groundfish bottom trawl activities, and therefore would not impact socioeconomic resources. It is important to note that the trawl RCA is currently closed to bottom trawling to limit the bycatch of overfished species, and the No Action Alternative represents essentially a status quo situation with respect to all bottom trawl activities, as long as the trawl RCA remains intact. As such, the baseline information regarding catch and revenues would remain status quo.
4.2.2.2 Alternative 2b: Add new EFHCAs within the trawl RCA based on presence of priority habitats
This alternative identifies 36 areas within the trawl RCA that contain areas of one or more priority habitats as potential EFHCAs (Figure 4Error! Reference source not found.). It does not identify any areas to be reopened. Table 28 contains the environmental metrics for this alternative.
Table 28. Environmental metrics for Alternative 2b EFHCAs in the trawl RCA Percent (%) is the percent of the proposed closures or reopenings made up by that metric (e.g., 5.1% of the total closed area consists of hard substrate and 1.1% of the total number of 1km grid cells contain DSC observations). Net = Close – Reopen. Positive net values mean a net increase in the extent of area closed to bottom trawling. “OFS 20% HSP” highest 20% habitat suitability probability (HSP) for overfished species, DSC = deep-sea corals, DSC&S = deep-sea corals and sponges.
Metric Value Spatial extent (mi2) 1329
Subs
trat
e Ty
pe Hard* mi2 67 % 5.1%
Mixed mi2 0 % <0.1%
Soft mi2 1260 % 94.8%
Unknown mi2 1 % <0.1%
Prio
rity
Hab
itats
Canyon/Gullies mi2 125 % 9.4%
OFS 20% HSP mi2 942 % 70.9%

69
Hab
itat-f
orm
ing
Inve
rtebr
ates
Total Grid cells 4750
DSC Grid cells 53 % 1.1%
Sponges Grid cells 37 % 0.8%
Sea pens Grid cells 34 % 0.7%
DSC&S Grid cells 59 % 1.2%
Conservation Value Mean 0.55 CV 0.07
* Hard substrate is also a priority habitat.
Habitat
The Alternative would provide EFH-based protections for 1,329 mi2 within the trawl RCA (Table 28). However, since these areas are all currently closed to bottom trawling activities, there are no direct impacts to habitat so long as the trawl RCA remains in effect. These EFHCAs are comprised, mostly, of soft substrate (94.8%), but also contain small amounts of hard substrate (5.1%), and very little mixed substrate (<0.1%). All categories of priority habitats are found in the potential polygons, with OFS 20% HSP being the most abundant, covering over 70% of the total area. This is not surprising because the trawl RCA was established to protect these same overfished species. The other priority habitats are less abundant, with deep-sea corals and sponges have been observed in only 1.2% of the 1 km grid cells. This is not surprising, considering the small percentage of the trawl RCA that contains suitable habitat (<6%). The mean conservation value is 0.55 inclusive of all areas under this Alternative.
Fish Resources
The effects of this Alternative on fish resources within the trawl RCA are difficult to predict. The trawl RCA is currently closed to bottom trawling, and selection of this alternative would ensure that some portion of the trawl RCA remains closed to bottom trawling. For those areas that would remain closed (i.e., those areas containing one or more priority habitats), there would be no additional impact, positive or negative, on federally-managed groundfish fisheries. (Any effects associated with reopening portions of the trawl RCA are analyzed under Subject Area 3).
Although groundfish bottom trawling does not occur in the trawl RCA, some state-managed fisheries (e.g. pink shrimp, Dungeness crab, California halibut) do operate in parts of the trawl RCA. These fisheries are allowed to fish in the trawl RCA but are restricted from EFHCAs; therefore if the new EFHCAs are added, these state-managed fisheries may be displaced, which could potentially impacted the composition of target and non-target harvest.
Protected Resources
This alternative establishes EFH conservation areas for habitat protection purposes, in areas currently closed for species conservation purposes via trawl RCAs. Since bottom trawling would be prohibited in the proposed EFHCAs under this alternative, there are would be no impacts to
70
protected species.
Socioeconomics
Alternative 2b is essentially a status quo situation with respect to groundfish bottom trawl activities, as long as the trawl RCA remains intact. As such, the baseline information regarding landings and revenues would remain status quo. However, state-managed non-groundfish trawling within the RCA (California halibut, pink shrimp, ridgeback prawn, and sea cucumber trawl) may be impacted. These fisheries are allowed to fish in the trawl RCA but are restricted from EFHCAs; therefore if the new EFHCAs are added within the trawl RCA then socioeconomic impacts could be incurred. The Council is currently considering modifications to the trawl RCA (Subject Area 3). Therefore, an impacts analysis of this alternative was conducted to inform the Council in the event that the trawl RCA is eliminated or modified. Taken as a whole, 40,797 miles of trawling occurred in the 36 EFHCAs identified in this alternative between 1998 and 2001, representing 6.8% of the coastwide trawl effort during that time period. However, this number should be viewed with extreme caution because: 1) this alternative does not propose a specific set of EFHCAs in the RCA, but rather it provides a list of potential EFHCAs that can inform the Council’s selection of a PPA, and 2) fishery management has changed significantly since the EFHCAs was first established, in particular by implementation of the catch shares system. Comparative Analysis of Subject Area 2 Alternatives
A comparison of the individual metrics for the Subject Area 2 Alternatives was not conducted because Alternative 2.b is not a typical alternative. Unlike the other alternatives, Alternative 2b does not propose a specific configuration of EFHCAs in the trawl RCA, but instead, identifies a list of potential EFHCAs that can inform the Council during selection of the PPA.
Subject Area 3: Adjustments to the Trawl RCA
Trawl RCAs are areas closed to trawl gears bounded by lines approximating particular depth contours. Trawl RCAs were first implemented in September 2002, at the time established as a Darkblotched Rockfish Conservation Area in the area north of 40° 10' N. latitude. In 2003, trawl RCAs were expanded for use coastwide to reduce catch of several overfished species, with differing configurations north and south of 40° 10' N. latitude. In recent years, the Council has also considered trawl RCA modifications to control catch of non-overfished species (e.g., spiny dogfish, longnose skate, and rougheye rockfish).
The analysis presented in this section discusses the potential impacts to the physical, biological, and socioeconomic environments of no action (3a), as well as the three action alternatives.
4.2.3.1 Alternative 3a: No Action
Under no action, the configuration of the trawl RCA, as of 2015, would remain in place. There would be no changes to the boundaries of the trawl RCA. NMFS and the Council would still maintain their ability to

71
make routine inseason adjustments to reduce catch of a particular species or species complex while maximizing catch of target species.
Habitat
Under the No Action alternative (3a), habitat impacts would be limited to those that are have already been analyzed for the current trawl RCA, as impacts to habitat are not expected to change from impacts that have been occurring in recent years. All of the areas currently closed to groundfish bottom trawl gear (4266 mi2) would remain closed to vessels fishing with groundfish bottom trawl gear except when they’re transiting (Table 29). This includes areas that have been closed to groundfish bottom trawling since implementation of the trawl RCA in 2002.
Specifically, the no action alternative would maintain trawl RCA boundaries of either 100fm-200fm or 100fm-150fm depending on the time of year. Groundfish bottom trawling would continue to be prohibited inside the trawl RCA, and effort would continue to be limited to areas seaward and shoreward of the trawl RCA. Under the no action alternative, shoreward effort would likely continue to be concentrated in depths of 75fm-100fm between 42°N. lat. and 48°N. lat., and seaward effort would likely continue to be concentrated in depths of 175fm-375fm. The no action alternative is not anticipated to change impacts to groundfish EFH of other marine activities that occur in the action area, including groundfish fishing using fixed or pot gear, bottom trawling for pink shrimp, or research using bottom trawls.
Table 29. Physical and Biological metrics for the current Trawl RCA.
Total Area (mi2) 4266
Hard(mi2) Mixed (mi2) Soft (mi2) Unknown (mi2)
198 (4.6%)
75 (1.8%)
3792 (88.9%)
201 (4.7%)
Priority habitats Submarine
Canyons (mi2) Habitat Forming Inverts (1 km grid cells) (% of
total grid cells with invert present) Total Grid Cells
Top 20% HSP for OFS(mi2)
DSC Sponges Sea Pens DSC&S 29 277
(1.94%) 176
(1.23%) 165
(1.15%) 312
(2.18%) 14308 1008
Note: DSC=deep-sea corals, DSC&S=deep-sea coral and sponges, OFS=overfished species. Table 29 shows the total area covered by the trawl RCA is 4266 mi2. Almost 89 percent is soft bottom followed by unknown (4.7 percent) substrate, hard substrate (4.6 percent), and mixed substrate (1.8 percent) (Figure 11). The trawl RCA protects 291 mi2 of submarine canyons, as well as a small percentage of area that is home to corals, sponges, and sea pens. Additionally, 1008 mi2 of habitat in the trawl RCA is highly suitable habitat for darkblotched, yellowtail, and POP.

72
Figure 11. Habitat makeup of the current Groundfish Trawl RCA.
Fish resources
Groundfish Target Species The no action alternative would continue to prevent targeting of groundfish species with trawl gear within the boundaries of the trawl RCA. Targeting of groundfish in the shorebased trawl IFQ program with 100 percent observer coverage and 100 percent dockside monitoring, with all catch of IFQ species required to be covered by quota pounds would continue as is. The amount of quota pounds available each year is a result of the allocations established through the FMP and the harvest specifications and management measures. The harvest specifications, including ACLs, are established based on the best scientific information available about stock status and would not change as result of this proposed alternative. Under all of the alternatives, including the no action alternative, the groundfish bottom trawl fleet would continue to be held to individual accountability from the IFQ program, which has demonstrated that quota pounds can be managed within IFQ sector allocations and ACLs for target species. Impacts to target species under the no action alternative are expected to continue in a similar manner to what has been seen in recent years. Vessels will continue efforts to maximize their harvest of target species quota pounds, and keep their bycatch of overfished species low. Specifically, access to lingcod, sanddabs, yellowtail rockfish and Pacific cod in the nearshore and shelf areas could continue to be somewhat limited by the shoreward boundary of the trawl RCA remaining at the 75fm line for some parts of the year under the no action alternative. Access to petrale sole, English sole, Dover sole, sablefish and thornyheads in the shelf and slope areas continue to be somewhat limited by the seaward boundary of the trawl RCA remaining at the 200fm line for some parts of the year under the no action alternative.
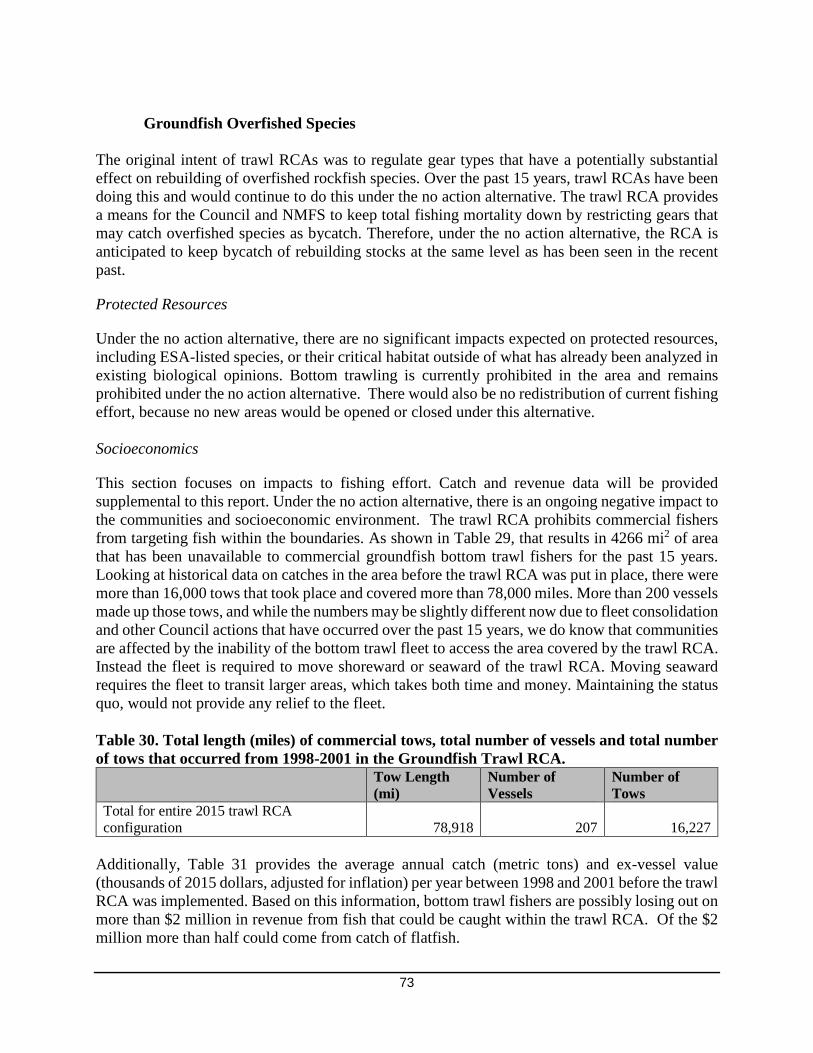
73
Groundfish Overfished Species The original intent of trawl RCAs was to regulate gear types that have a potentially substantial effect on rebuilding of overfished rockfish species. Over the past 15 years, trawl RCAs have been doing this and would continue to do this under the no action alternative. The trawl RCA provides a means for the Council and NMFS to keep total fishing mortality down by restricting gears that may catch overfished species as bycatch. Therefore, under the no action alternative, the RCA is anticipated to keep bycatch of rebuilding stocks at the same level as has been seen in the recent past.
Protected Resources
Under the no action alternative, there are no significant impacts expected on protected resources, including ESA-listed species, or their critical habitat outside of what has already been analyzed in existing biological opinions. Bottom trawling is currently prohibited in the area and remains prohibited under the no action alternative. There would also be no redistribution of current fishing effort, because no new areas would be opened or closed under this alternative. Socioeconomics
This section focuses on impacts to fishing effort. Catch and revenue data will be provided supplemental to this report. Under the no action alternative, there is an ongoing negative impact to the communities and socioeconomic environment. The trawl RCA prohibits commercial fishers from targeting fish within the boundaries. As shown in Table 29, that results in 4266 mi2 of area that has been unavailable to commercial groundfish bottom trawl fishers for the past 15 years. Looking at historical data on catches in the area before the trawl RCA was put in place, there were more than 16,000 tows that took place and covered more than 78,000 miles. More than 200 vessels made up those tows, and while the numbers may be slightly different now due to fleet consolidation and other Council actions that have occurred over the past 15 years, we do know that communities are affected by the inability of the bottom trawl fleet to access the area covered by the trawl RCA. Instead the fleet is required to move shoreward or seaward of the trawl RCA. Moving seaward requires the fleet to transit larger areas, which takes both time and money. Maintaining the status quo, would not provide any relief to the fleet. Table 30. Total length (miles) of commercial tows, total number of vessels and total number of tows that occurred from 1998-2001 in the Groundfish Trawl RCA.
Tow Length (mi)
Number of Vessels
Number of Tows
Total for entire 2015 trawl RCA configuration 78,918 207 16,227
Additionally, Table 31 provides the average annual catch (metric tons) and ex-vessel value (thousands of 2015 dollars, adjusted for inflation) per year between 1998 and 2001 before the trawl RCA was implemented. Based on this information, bottom trawl fishers are possibly losing out on more than $2 million in revenue from fish that could be caught within the trawl RCA. Of the $2 million more than half could come from catch of flatfish.
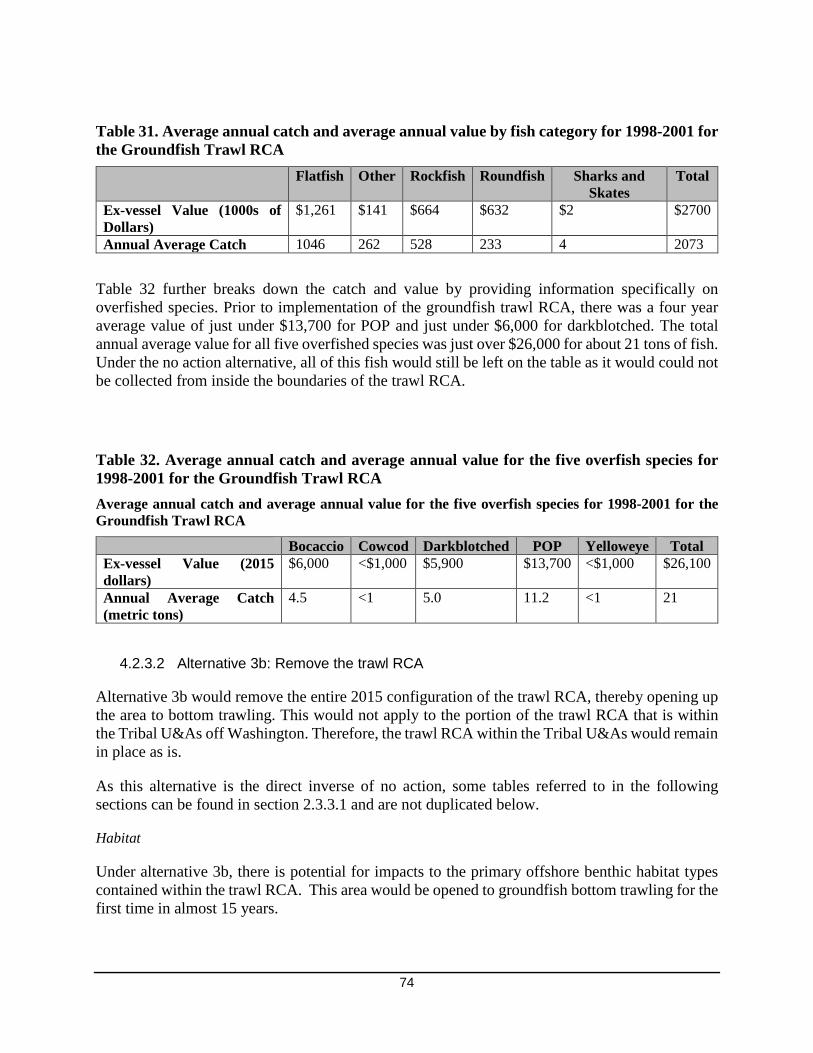
74
Table 31. Average annual catch and average annual value by fish category for 1998-2001 for the Groundfish Trawl RCA
Flatfish Other Rockfish Roundfish Sharks and Skates
Total
Ex-vessel Value (1000s of Dollars)
$1,261 $141 $664
$632 $2 $2700
Annual Average Catch 1046 262 528 233 4 2073
Table 32 further breaks down the catch and value by providing information specifically on overfished species. Prior to implementation of the groundfish trawl RCA, there was a four year average value of just under $13,700 for POP and just under $6,000 for darkblotched. The total annual average value for all five overfished species was just over $26,000 for about 21 tons of fish. Under the no action alternative, all of this fish would still be left on the table as it would could not be collected from inside the boundaries of the trawl RCA.
Table 32. Average annual catch and average annual value for the five overfish species for 1998-2001 for the Groundfish Trawl RCA Average annual catch and average annual value for the five overfish species for 1998-2001 for the Groundfish Trawl RCA
Bocaccio Cowcod Darkblotched POP Yelloweye Total Ex-vessel Value (2015 dollars)
$6,000 <$1,000 $5,900 $13,700 <$1,000 $26,100
Annual Average Catch (metric tons)
4.5 <1 5.0 11.2 <1 21
4.2.3.2 Alternative 3b: Remove the trawl RCA
Alternative 3b would remove the entire 2015 configuration of the trawl RCA, thereby opening up the area to bottom trawling. This would not apply to the portion of the trawl RCA that is within the Tribal U&As off Washington. Therefore, the trawl RCA within the Tribal U&As would remain in place as is.
As this alternative is the direct inverse of no action, some tables referred to in the following sections can be found in section 2.3.3.1 and are not duplicated below.
Habitat
Under alternative 3b, there is potential for impacts to the primary offshore benthic habitat types contained within the trawl RCA. This area would be opened to groundfish bottom trawling for the first time in almost 15 years.
75
Offshore habitat recovery from the effects of trawl fishing varies by habitat type (NMFS 2005). The current trawl RCA covers an area of 4226 mi2 (Table 29). Eighty-nine percent of the trawl RCA is made up of soft bottom, four percent hard bottom, two percent mixed, and five percent is unknown (Figure 11). Hard substrate consists of steep ridges and rocky reefs. Mixed substrate consists of low-relief, cobble and boulder. Finally, soft substrate consists of unconsolidated sediment, mud, silt, and sand.
Soft substrate has been shown to be the least susceptible to habitat impacts by various groundfish gear types, including bottom trawl. Therefore, it takes the least amount of time to recover from impacts. Offshore biogenic mixed and hard habitats generally have longer recovery times from trawl gear impact compared to offshore unconsolidated habitats such as soft substrate (NMFS 2005). Offshore mixed and hard bottom habitats may take up to 2.8 years to return to pre-fishing conditions for non-structure forming benthic habitats. This estimation does not take into account more defined habitat categories, such as slope sponge, which may take up to 10.5 years to recover (NMFS 2005, table 3-1 in the EIS), nor coral species, some of which are known to live beyond 100 years or more. It is also important to note that bottom trawlers most often avoid untrawlable fishing grounds, which include areas with high relief, corals, boulders and cobble in order to protect their gear from damage.
Removing the entire trawl RCA would have low negative impacts on the benthic habitat as more than 4,000 mi2 of habitat, which has been closed to groundfish bottom trawling, will be re-opened. Certainly, bottom trawling dramatically reduces the diversity of some kinds of habitat, particularly corals, but in other habitats, such as mud and sand bottoms, the impact on ecosystem structure and function is much less. Some areas that have been closed for long periods (i.e. core trawl RCA) of time may have had a chance for benthic habitat recovery.
It is expected that impacts to benthic species such as coral, sponges, and sea whip colonies (Table 29) have already largely occurred within trawlable fishing grounds, particularly in the height of bottom trawl effort between 1980 to 2000, since some coral species may live up to 100 years. The possibility that some trawlable areas may have escaped impact from higher effort prior to 2002 may exist, although it is expected that these areas are less trawlable with modern gear restrictions.
Fish Resources
Alternative 3b is not expected to have significant impacts on the biological resources when the entire trawl RCA is removed. As was illustrated in Figure 11, the majority of the habitat found within the trawl RCA is made up of a soft bottom. Many heavily trawled regions of the world, where there is a lot of soft substrate, continue to demonstrate record biomass abundance of target species. To the extent that the alternatives under consideration affect target and non-target species, these species will continue to be managed conservatively. Additionally, annual catch limits will continue to be established through the biennial harvest specifications and management measures. Under the Shorebased IFQ Program all catch of IFQ species (retained or discarded), including vessels using groundfish bottom trawl gear, must be covered by quota pounds. Fishermen are individually accountable for their catch of individual species (or species within a stock complex), and are subject to a 100 percent monitoring requirement. Non-IFQ species are managed by groundfish trip limits. Therefore, the proposed action alternative is not expected to impact the sustainability of any target or non-target species.

76
Groundfish Target Species
The most likely potential impacts to target species from removing the entire trawl RCA are higher attainment of the trawl allocation of those target species. However, target species catch is mainly influenced by the ACLs set for overfished species, which act as a constraint on target species catch through the management controls that must be imposed to limited overfished species catch. Thus, even if removing the trawl RCA provides additional fishing grounds, the fleet will still only be able to access their allocation of fish as this action will have no impact on the ACLs which are set biennially through the harvest specifications process.
Groundfish Overfished Species
Currently, there are five groundfish overfished species: bocaccio, cowcod, darkblotched, POP, and yelloweye. Using logbook data from 1998-2001, which was collected prior to the implementation of the trawl RCA, provides a picture of the total catch for those overfished species (Table 32).
As was mentioned previously, the purpose of the trawl RCA was originally to protect overfished species by reducing catch of overfished rockfish in fisheries that take and retain groundfish, directing harvest of healthy stocks to areas that remained open. One would surmise that by removing the entire trawl RCA there would be some negative impact to overfished species. However, overfished species area still managed through the biennial harvest specifications and management measures and the proposed action does not change these specifications or measures.
By removing the current trawl RCA, the fleet may be more susceptible to “lightning strikes” specifically if areas known to have high accumulations of overfished species are no longer protected. However, members of the fleet are likely to avoid those areas.
Protected Resources
We cannot show nor predict interaction rates if the trawl RCA is removed because there is limited data for observed protected species interactions. The WCGOP started observations of the fishery in 2002. Then the RCA was implemented in 2003; therefore, there is only 1 year of observation data in the area that is now the trawl RCA.
Socioeconomics
This section focuses on impacts to fishing effort. Catch and revenue data will be provided supplemental to this report. Removing the current trawl RCA would open the greatest amount of area to bottom trawl fishing, compared to the other action alternatives. Removing the trawl RCA would open just over 4,000 mi2 to fishing. New opportunities for trawling on grounds, currently closed to bottom trawl gear, may allow for more landings and revenue from highly valuable target species. It also may allow for more fishing closer to shore and not force vessels to move further offshore to obtain their catch. This could result in more efficient fishing and lower transiting costs. Communities could see an increased economic benefit, but only if vessels were able to obtain more of their ACL as the actual yearly allocation will not be affected by this action.

77
4.2.3.3 Alternative 3c: Discrete area closures for overfished species
Alternative 3c would open the entire trawl RCA, which could have similar impacts on the physical, biological, and socioeconomic environments as action alternative 3b. However, unlike alternative 3b, in addition to opening the trawl RCA, this alternative also proposes DACs to reduce catch of the five overfished species (Bocaccio, cowcod, darkblotched, POP, and yelloweye). The discrete area closures could be implemented pre-season or inseason, as needed, making this alternative potentially more conservative than Alternative 3b. The project team has identified 37 DACs (Figure 5). The following sections provides information on the potential impacts of alternative 3c.
4.2.3.4 Method for Development of DACs
The analysis includes fishery dependent haul data (WCGOP observations, 2011-2014) and NMFS NWFSC survey data (201-2015) for bocaccio, cowcod, darkblotched, POP, yelloweye. Catch per unit of effort was calculated for both data sets for each haul and plotted as individual points for each species. A GIS spatial analysis tool was use to analyze the distance between neighboring points for each species to find statistically significant “hot-spots” (i.e., a cluster of points representing hauls with 90% confidence interval). A GIS buffer tool was used to add a 1,000 m buffer around each cluster of points representing a hotspot (Figure 12).4 Overlapping polygons were merged to create the final discrete area closure polygons for the analysis (Figure 13).5
4 Only trawl survey points are provide in Figure 12 since the fishery-dependent data contains confidential information. 5 Discrete area closures are coded to reflect the individual species hotspots represented by the merged polygon.

78
Figure 12. Example of hotspot polygons by species. Points are individual hauls that were statistically significant in relationship to each other.

79
Figure 13. Discrete area closure polygons.
4.2.3.5 Analysis
Habitat
The habitat impacts for action alternative 3c would be similar to those for alternative 3b with some potential additional protections to the habitat from a DAC. However, the DAC would be implemented as species management and would not be expected to be in place over an extended period of time, and, therefore, would not be expected to provide much additional habitat protection. If the Council or NMFS does decide to implement any of the DAC, they could decide to keep the closures in place long-term as was done with the core trawl RCA, which may provide some de facto habitat protection if they were in place long enough.
The total area closed by all of the DACs is 2807 mi2 (Table 33). The DACs in size from 1.5 mi2 for Cowcod-3 to 385 mi2 for BOC-05. The DAC also cover very few areas which are home to corals, sponges, or sea pens, and just over 15% of the total area for all DAC is suitable for darkblotched, yelloweye, and POP.

80
Table 33. Physical and biological metrics for all discrete area closures combined
Table 34 provides information on each of the DAC groupings. The largest closure would be a single DAC which covers both POP and yelloweye. The smallest closure would be for POP (POP-01) which would only close a total of 69 mi2. The majority of priority habitats, specifically sea pens, are found in the Bocaccio, darkblotched, and cowcod areas. The cowcod areas (1-8) also had the highest rates of corals, sponges, and sea pens of all the DAC.
Total Area (mi2)
2807
Hard(mi2) Mixed (mi2) Soft (mi2) Unknown (mi2)
72
(2.56%)
104
(3.71%)
2631
(93.7%)
0
(0%)
Priority habitats
Submarine Canyons (mi2)
Habitat Forming Inverts (1 km grid cells) (% of total grid cells with invert present)
Total Grid Cells
Top 20% HSP for OFS(mi2)
DSC Sponges Sea Pens DSC&S
222 16
(<1%)
13
(<1%)
73
(<1%)
312 (<1%)
8452 448
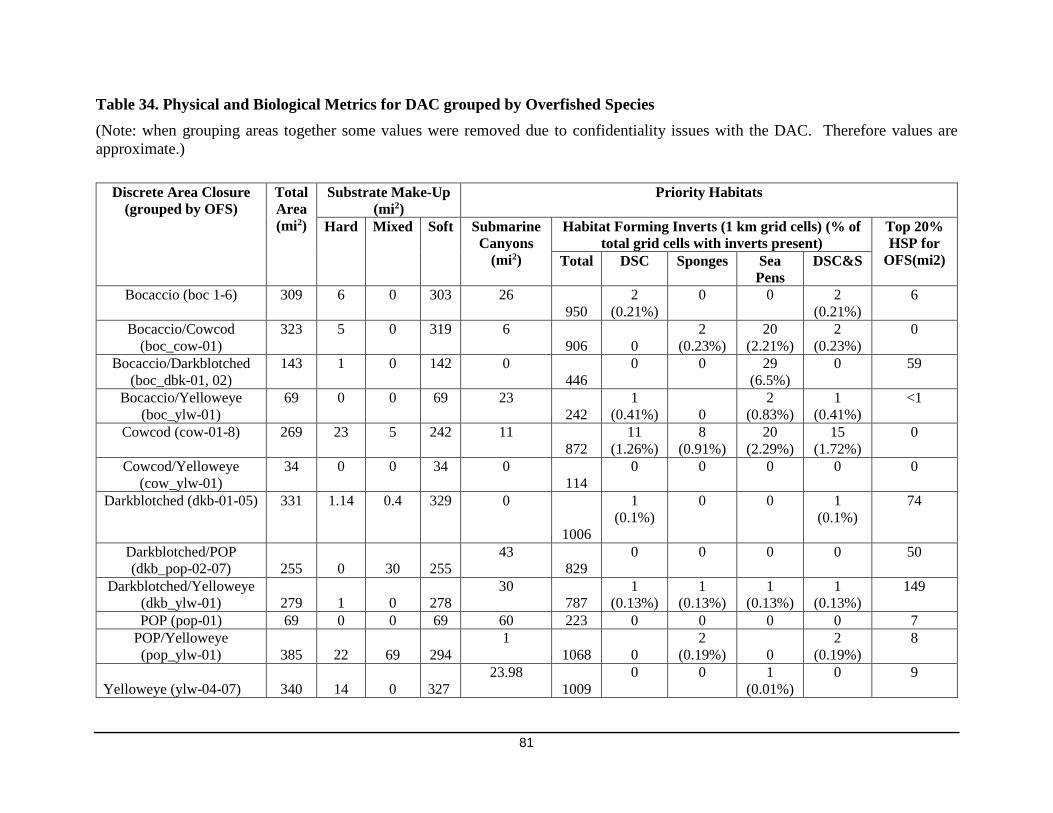
81
Table 34. Physical and Biological Metrics for DAC grouped by Overfished Species (Note: when grouping areas together some values were removed due to confidentiality issues with the DAC. Therefore values are approximate.)
Discrete Area Closure (grouped by OFS)
Total Area (mi2)
Substrate Make-Up (mi2)
Priority Habitats
Hard Mixed Soft Submarine Canyons
(mi2)
Habitat Forming Inverts (1 km grid cells) (% of total grid cells with inverts present)
Top 20% HSP for
OFS(mi2) Total DSC Sponges Sea Pens
DSC&S
Bocaccio (boc 1-6) 309 6 0 303 26 950
2 (0.21%)
0 0 2 (0.21%)
6
Bocaccio/Cowcod (boc_cow-01)
323 5 0 319 6 906 0
2 (0.23%)
20 (2.21%)
2 (0.23%)
0
Bocaccio/Darkblotched (boc_dbk-01, 02)
143 1 0 142 0 446
0 0 29 (6.5%)
0 59
Bocaccio/Yelloweye (boc_ylw-01)
69 0 0 69 23 242
1 (0.41%) 0
2 (0.83%)
1 (0.41%)
<1
Cowcod (cow-01-8) 269 23 5 242 11 872
11 (1.26%)
8 (0.91%)
20 (2.29%)
15 (1.72%)
0
Cowcod/Yelloweye (cow_ylw-01)
34 0 0 34 0 114
0 0 0 0 0
Darkblotched (dkb-01-05) 331 1.14 0.4 329 0
1006
1 (0.1%)
0 0 1 (0.1%)
74
Darkblotched/POP (dkb_pop-02-07) 255 0 30 255
43 829
0 0 0 0 50
Darkblotched/Yelloweye (dkb_ylw-01) 279 1 0 278
30 787
1 (0.13%)
1 (0.13%)
1 (0.13%)
1 (0.13%)
149
POP (pop-01) 69 0 0 69 60 223 0 0 0 0 7 POP/Yelloweye (pop_ylw-01) 385 22 69 294
1 1068 0
2 (0.19%) 0
2 (0.19%)
8
Yelloweye (ylw-04-07) 340 14 0 327 23.98
1009 0 0 1
(0.01%) 0 9
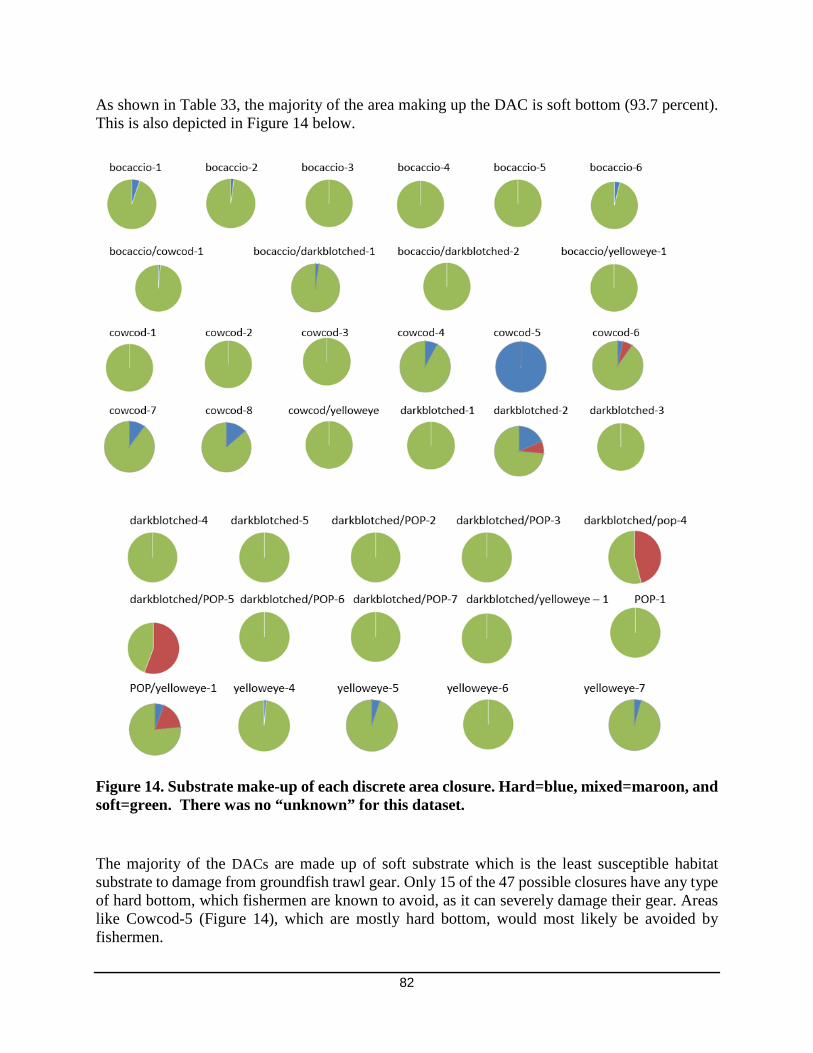
82
As shown in Table 33, the majority of the area making up the DAC is soft bottom (93.7 percent). This is also depicted in Figure 14 below.
Figure 14. Substrate make-up of each discrete area closure. Hard=blue, mixed=maroon, and soft=green. There was no “unknown” for this dataset.
The majority of the DACs are made up of soft substrate which is the least susceptible habitat substrate to damage from groundfish trawl gear. Only 15 of the 47 possible closures have any type of hard bottom, which fishermen are known to avoid, as it can severely damage their gear. Areas like Cowcod-5 (Figure 14), which are mostly hard bottom, would most likely be avoided by fishermen.

83
Only five of the 47 hotspot area closures (mostly those for POP) include mixed substrate. These areas usually provide some vertical relief as refuges for groundfish from predators. Muck like the hard substrate areas, fishermen tend to avoid mixed substrate areas as trawling in those areas can cause damage to their nets and rigging.
Therefore, much like under alternative 3b, it is unlikely that there would be significant impacts to the habitat from alternative 3c. The new areas which may be visited by the fishermen will most likely be made up of sandy or mud (soft) substrate, which is not very susceptible to damage from trawling gears.
Managed Resources
The fishery resource impacts for action alternative 3c would be similar to those in action alternative 3b for target species and non-target species, except for overfished species. This alternative provides an additional level of protection to overfished species that is not present in alternative 3b.
Groundfish Target Species The ongoing impacts on groundfish target species of action alternative 3c would be similar to alternative 3b, as the additional closures (DACs) are meant to specifically address species management concerns with overfished species. By opening the trawl RCA, the Council would open over 4000 mi2 to bottom trawling (Table 29). This may allow fishing vessels to obtain more of their trawl allocation than they have been able to obtain in the past. However, fishing would still be limited by the ACLs developed through the biennial management measures and specifications process. The potential to negatively impact habitat on which these species rely is there. However, as mentioned previously, the majority of habitat covered by DAC is soft bottom, which is not as susceptible to damage as other habitat types. Any damage to the soft substrate is not expected to significantly impact groundfish target species. If the Council chose to implement the DAC, there could be a positive impact on those target species that are also found within the DAC. As we know, several species tend to be found within the same area. If the Council or NMFS were to close a DAC or group of DAC to protect an overfished species, any target species co-occurring in that area would also be protected as long as they remained within the area of protection. This could have a small but positive impact on those target species. Groundfish Overfished Species While the impacts on groundfish target species for alternative 3c are expected to be similar to those of 3b, the impacts on overfished species is not expected to be similar. In fact, this action alternative has the potential to provide additional protection to overfished species. If the Council decided to close a DAC or group of DAC the protection to overfished species would be immediate. The DAC are designed based on hotspots of overfished species. Therefore, if the Council or NMFS decide, based on analysis, to close to an area where a specific species is threatened, then that closure would

84
have an immediate positive impact on conserving that species and preventing catch in that specific area. Positive impacts to overfished species will be in relation to the length of time of a closure. If the Council or NMFS decides preseason or inseason to close a group of areas and leaves them closed for an extended period of time, the ongoing impacts of those closures to that species would be positive. If the Council or NMFS close an area for a shortened period of time, it is expected that the reduction in time would have a proportional reduction in protection for that species. Protected Resources
Overall, the impacts to protected species under alternatives 3c would likely be neutral or similar to the No Action alternative (See Chapter 3 for current interaction rates for the bottom trawl fishery). Most protected species interactions are random and cannot be predicted spatially, therefore it’s not possible to accurately project interaction rates under Alternative 3c. However, since tow times and fishing operations are not expected to change substantially under alternative 3c and expect fisherman to still attempt to avoid further impacts to salmon when they encounter them, we do not expect the interaction rates with any protected species to change substantially. One consideration to note is that if the flatfish trawl requirement is removed, as currently being considered for implementation in 2017 under a separate action (see Cumulative Effects for further discussion), it’s possible that interaction rates may change for salmon. The analysis in this section shows the observed interactions (from 2011 to 2014) in areas that are proposed for DACs (Table 35 through Table 37). Since these areas are currently fished, we are able to provide the interaction numbers (catch by number and weight) of all protected species for each DAC. Since tow times and fishing operations are not expected to change substantially under alternative 3c, we do not expect the interaction rates with any protected species to change substantially. Observed ESA-Listed Fish in the DACs Table 35. Observed catch (count and weight lb) of protected fish species in discrete area closures
Discrete Area Closure
Eulachon (count/weight)
Green Sturgeon (count/weight)
King (Chinook) Salmon (count/weight)
Silver (Coho) Salmon (count/weight)
boc-01 0 0 4 / 16.8 0 boc-02 0 0 79 / 507.6 0 boc-03 0 0 0 0 boc-04 0 0 0 0 boc-05 0 0 0 0 boc-06 0 0 0 0 boc_cow-01 0 0 0 0 boc_dbk-01 0 0 0 0 boc_dbk-02 0 0 ** **
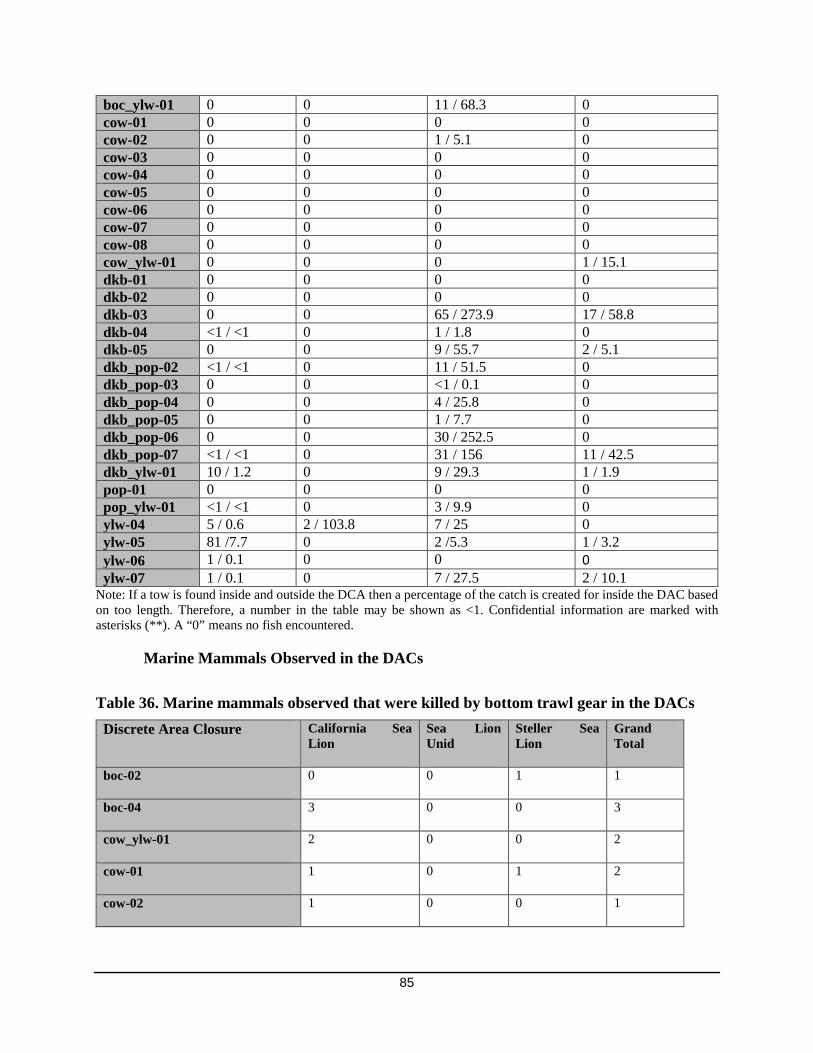
85
boc_ylw-01 0 0 11 / 68.3 0 cow-01 0 0 0 0 cow-02 0 0 1 / 5.1 0 cow-03 0 0 0 0 cow-04 0 0 0 0 cow-05 0 0 0 0 cow-06 0 0 0 0 cow-07 0 0 0 0 cow-08 0 0 0 0 cow_ylw-01 0 0 0 1 / 15.1 dkb-01 0 0 0 0 dkb-02 0 0 0 0 dkb-03 0 0 65 / 273.9 17 / 58.8 dkb-04 <1 / <1 0 1 / 1.8 0 dkb-05 0 0 9 / 55.7 2 / 5.1 dkb_pop-02 <1 / <1 0 11 / 51.5 0 dkb_pop-03 0 0 <1 / 0.1 0 dkb_pop-04 0 0 4 / 25.8 0 dkb_pop-05 0 0 1 / 7.7 0 dkb_pop-06 0 0 30 / 252.5 0 dkb_pop-07 <1 / <1 0 31 / 156 11 / 42.5 dkb_ylw-01 10 / 1.2 0 9 / 29.3 1 / 1.9 pop-01 0 0 0 0 pop_ylw-01 <1 / <1 0 3 / 9.9 0 ylw-04 5 / 0.6 2 / 103.8 7 / 25 0 ylw-05 81 /7.7 0 2 /5.3 1 / 3.2 ylw-06 1 / 0.1 0 0 0 ylw-07 1 / 0.1 0 7 / 27.5 2 / 10.1
Note: If a tow is found inside and outside the DCA then a percentage of the catch is created for inside the DAC based on too length. Therefore, a number in the table may be shown as <1. Confidential information are marked with asterisks (**). A “0” means no fish encountered.
Marine Mammals Observed in the DACs Table 36. Marine mammals observed that were killed by bottom trawl gear in the DACs
Discrete Area Closure California Sea Lion
Sea Lion Unid
Steller Sea Lion
Grand Total
boc-02 0 0 1 1
boc-04 3 0 0 3
cow_ylw-01 2 0 0 2
cow-01 1 0 1 2
cow-02 1 0 0 1

86
cow-05 1 0 0 1
dkb_pop-07 0 0 1 1
dkb-05 1 0 3 4
pop_ylw-01 1 0 0 1
ylw-05 1 0 0 1
ylw-07 1 1 4 6
Grand Total 12 1 10 23
Table 37. Marine mammal interactions by species and interaction type in the DACs Observed Interaction
California Sea Lion
Common Unid Dolphin
Dolphin Unid
Pacific White-sided Dolphin
Sea Lion Unid
Steller Sea Lion
Grand Total
deterrence used 3 0 0 0
24 27
feeding on catch 19 15 0 100 5 147 286
killed by gear 12 0 0 0 1 13 26
other 0 0 200 0 0 5 205
Grand Total 34 15 200 100 6 189 544
Seabirds Observed in the DACs
Seabirds were only observed feeding on catch in the DACs (Table 38).
Table 38. Seabirds observed that were feeding on catch near bottom trawl gear in the DACs. Discrete Area Closure Black-footed
Albatross Northern Fulmar
Short-tailed Albatross
Grand Total
cow-02 80
80 dkb_pop-05
1 1
dkb_pop-07
10
10 dkb-04 30
30
dkb-05 4
1 5 Grand Total 114 10 2 126

87
Socioeconomics
Under alternative 3c, the entire trawl RCA would be removed, which would open up just over 4,000 mi2 to bottom trawling. Additionally, under this alternative, the Council and NMFS would have the option of additional species closures through DAC to close hotspots for overfished species. This would provide an additional protection to those overfished species, but it will have a temporary negative impact on the fleet, if they are no longer able to access those areas to target their catch. However, the impact on the fleet would be much less than if NMFS or the Council had to shut a fishery or a sector due to allocations for overfished species being reached or exceeded. Table 39 provides the total tow length, number of vessels, and number of tows that have taken place in each of the DAC groupings. Between 2011 and 2014, there were just under 11,000 tows covering almost 50,000 miles within 2807 mi2 of DAC. If the Council or NMFS were to close a group of DAC to address a species conservation concern, there would be an immediate effect of displacing that effort. The impact on the fleet would be negative, and the extent of that impact would depend on the extent (size and period) of the closure. For example, if the decision was to close all bocaccio DAC, this would in turn close 309 mi2 of area, 6 mi2 of which is highly suitable for several overfished species (Table 34).

88
Table 39. Total length (miles) of commercial tows, total number of vessels and total number of tows that occurred from 2011-2014 within the boundaries of the DAC groupings
DAC Group Tow
Length (mi) Number
of Vessels Number of Tows
Bocaccio 5795 18 1259 Bocaccio/Cowcod 252 1 40 Bocaccio/ Darkblotched
313 6 115
Bocaccio/Yelloweye 1200 7 352 Cowcod 919 16 479 Cowcod/Yelloweye 518 7 117 Darkblotched 7661 70 1597 Darkblotched/POP 12691 129 3392 Darkblotched/ Yelloweye
8056 24 1002
POP 426 8 133 POP/Yelloweye 2657 15 401 Yelloweye 7253 58 2001 TOTAL 47,741 359 10,888
89
4.2.3.6 Alternative 3d: Block Area Closures
Alternative 3d would open the entire trawl RCA, which could have similar impacts on the physical, biological, and socioeconomic environments as action alternative 3b. However, this alternative goes a step further and would provide NMFS and the Council with the option of closing “block areas” to address a species management concern. “Block area” closures (BAC) utilize existing regulatory boundaries to create 20 distinct spatial “blocks.” Such an approach would allow NMFS or the Council to implement closures pre-season or inseason, as needed. Habitat
The habitat impacts for action alternative 3d would be similar to those for alternatives 3b and 3c with some additional protections to the habit from BAC. However, like the DAC, the BAC would be implemented to address a species management concern and are not expected to be in place over an extend period of time. Therefore, and positive impacts from the closure to the habitat would be short lived. The total area of all the block closures is more than 50,000 mi2. The likelihood that the Council or NMFS would choose to close all of the areas at once is very small. Instead the Council or NMFS could choose to close off a certain area based on a depth bin. For example, the Council chose to close the core trawl RCA from 100fm to 150fm. The Council or NMFS could choose to do something similar with BAC, or they could choose to close off an area by the geographic break. For example, the Council or NMFS could choose to close off all depth bins from Point Chehalis to Cape Blanco. The Council and NMFS could even decide to close of an area smaller than the actual block. Regardless of the configuration the Council or NMFS decides to close, unless that closure is in place in the long term, the impacts on the habitat are likely to be neutral. Table 40 shows the habitat related metrics for each block area closure. Figure 15 shows the habitat make-up of each block area closure. Even though this is a very large area that is covered by BAC, much larger than the 2015 configuration of the trawl RCA, the majority of the habitat is still mostly soft bottom. Areas that have more relief (i.e. more hard substrate) tend to be located closer to the southern border with Mexico and further out to sea. It is unlikely that the fleet will attempt to bottom trawl in areas where there is high relief. Table 40 also shows that there is quite a bit of habitat that is suitable for some of the overfished species, particularly from Point Conception to Cape Blanco and again from Cape Blanco to Cape Mendocino. The majority of that habitat is found in deeper than 30fm. Also looking south of Cape Mendocino, particularly in the deeper depth bins, there is a priority habitat found. However, the number of grid cells with priority habitat never exceeds four percent for any of the biogeographic areas.

90
Table 40. Physical and biological metrics for block area closures Block Area Closure
Depth Zone
Total Area
Substrate Make-up (mi2) Priority Habitats Hard Mixed Soft Unknown Canyons Habitat Forming Inverts (1 km grid cells) (%
of total grid cells with invert present) Top 20% HSP for OFS(mi2) Total
Grid Cells
DSC Sponges Sea Pens
DSC&S
Cape Flattery to Point Chehalis
0fm-30fm
5.3E-05
0 0 5.4E-05
0 0 14 0 0 0 0
0
30fm-100fm
1.8E-04
0 0 1.8E-04
0 0 39 0 0 0 0
0
100fm-150fm
3.5E-01
0 0 3.5E-01
0 0 6 0 0 0 0
0
150fm-700fm
281 0 0 281 0 182 905 0 0 0 0
7
Point Chehalis to Cape Blanco
0fm-30fm
410 2 1 406 2.0E-07 0 1380
1 (0.07%)
1 (0.07%) 0
1 (0.07%)
0
30fm-100fm
5217 466 181 4,570 2.0E-07 9 14202
25 (0.18%)
23 (0.16%)
18 (0.13%)
27 (0.19%)
1,201
100fm-150fm
928 19 9 900 0 39 3109
8 (0.26%)
4 (0.13%)
3 (0.10%)
8 (0.26%)
675
150fm-700fm
5442 22 322 5,097 9.7E-07 662 14795
14 (0.09%)
3 (0.02%)
14 (0.09%)
16 (0.11%)
229
Cape Blanco to Cape Mendocino
0fm-30fm
199 0 0 199 0 0 738 0 0 0 0
0
30fm-100fm
1281 12 0 1,269 0 15 3696 0 0 0 0
304
100fm-150fm
204 1 0 203 0 27 906
1 (0.11%) 0
1 (0.11%)
1 (0.11%)
167
150fm-700fm
3162 9 0 3,153 5.7E-03 867 8547
11 (0.13%) 0
13 (0.15%)
11 (0.13%)
99
Cape Mendocino to Point Conception
0fm-30fm
468 13 0 456 0 0 1467 0 0 4 0
0
30fm-100fm
3174 88 1 3,086 0 15 9250
79 (0.85%)
76 (0.82%)
264 (2.85%)
99 (1.07%)
156
100fm-150fm
665 25 9 631 0 21 2782
91 (3.27%)
32 (1.15%)
59 (2.12%)
99 (3.56%)
34

91
Block Area Closure
Depth Zone
Total Area
Substrate Make-up (mi2) Priority Habitats Hard Mixed Soft Unknown Canyons Habitat Forming Inverts (1 km grid cells) (%
of total grid cells with invert present) Top 20% HSP for OFS(mi2) Total
Grid Cells
DSC Sponges Sea Pens
DSC&S
150fm-700fm
8641 1,002 7 7,583 50 899 23615
149 (0.63%)
11 (0.05%)
206 (0.87%)
153 (0.65%)
24
Point Conception to US/Mexico Border
0fm-30fm
167 12 0 155 1 0 614
6 (0.98%)
2 (0.33%)
8 (1.30%)
6 (0.98%)
0
30fm-100fm
839 59 2 775 3 33 2916
54 (1.85%)
51 (1.75%)
34 (1.17%)
66 (2.26%)
0
100fm-150fm
447 28 0 417 1 24 1987
38 (1.91%)
42 (2.11%)
18 (0.91%)
44 (2.21%)
0
150fm-700fm
17225 870 93 16,230 31 340 45873
262 (0.57%)
308 (0.67%)
133 (0.29%)
347 (0.76%)
6

92
Figure 15. Habitat make-up of each block area closure. Hard=orange, mixed=yellow, soft=green, and unknown=brown.

93
Managed Resources
The fishery resource impacts for action alternative 3d would provide the most protection of all the action alternatives for target and non-target species. Additionally, BAC would provide immediate protection upon implementation to overfished species and protected species. Groundfish Target Species
The ongoing impacts on groundfish target species of action alternative 3d would be positive, because the Council and NMFS are not likely to implement BAC and maintain the closure for an extended period of time. Therefore, the positive benefit to the species would only be felt as long as the closure is in place. Under this action alternative, the trawl RCA would be removed, which would open over 4000 mi2 to bottom trawling (Table 27). This may allow fishing vessel to obtain more of their trawl allocation than they have been able to obtain in the past. However, fishing would still be limited by the ACLs developed through the biennial management measures and specifications process. If the Council chose to implement a BAC or group of BAC, there could be a positive impact on those target species that are found within the BAC. The degree of the impact would depend on which area was closed. The BAC vary in size, type of substrate, amount of priority habitat, and presence of species. The smallest areas are found off of the northern coast of Washington between 0fm and 150fm. The majority of that habitat is made up of soft bottom. Additionally, this area has also produced little catch in the past. The largest BAC is made up of 17,225 mi2, mostly soft bottom, and consists of small amount of priority habitat.

94
Groundfish Overfished Species
Unlike action alternative 3c, alternative 3d does not specifically close areas based on information on overfished species. However, the Council or NMFS could decide to close a portion of a BAC, a BAC, or a group of BAC in response to a species management need, which would include protection of overfished species. Therefore, Alternative 3d could have a beneficial impact on groundfish species, although further catch and revenue information would need to be developed.
Protected Resources
Overall, the impacts to protected species under alternatives 3d would likely be neutral or similar to the No Action alternative (See Chapter 3 for current interaction rates for the bottom trawl fishery and Table 41). Most protected species interactions are random and cannot be predicted spatially, therefore it’s not possible to accurately project interaction rates under Alternative 3d. However, since tow times and fishing operations are not expected to change substantially under alternative 3d and expect fisherman to still attempt to avoid further impacts to salmon when they encounter them, we do not expect the interaction rates with any protected species to change substantially. One consideration to note is that if the flatfish trawl requirement is removed, as currently being considered for implementation in 2017 under a separate action, it’s possible that interaction rates may change for salmon. Since tow times and fishing operations are not expected to change substantially under alternative 3d, we do not expect the interaction rates with any protected species to change substantially. Bycatch rates for protected fish species are provide in Table 41. The highest interaction rates for Eulachon have been observed in the 30 to 100 fathom depth contour for Point Chehalis to Cape Blanco. Interaction rates for salmon are highest in the 30 to 100fm depth contour and 150 to 700fm depth contour for Point Chehalis to Cape Blanco and in the 150 to 700fm depth contour Cape Blanco to Cape Mendocino. Since there is no trawl fishing from Point Conception to US/Mexico Border there are no interaction observations.
Based on information provided by the NWFSC some hot spots are seen for salmon but these areas are limited in size and limited by the short time frame of the data (2011 to 2014) to be statistically significant (Figure 7). Although gear modifications (selective flatfish trawl and small foot rope use) were implemented to reduce bycatch of certain overfished fish species and NMFS implemented trawl RCAs, it’s not clear whether the reduction in salmon bycatch seen from 2004 to 2005 was a direct result of either action, a drop in salmon abundance, or some other factor.

95
Table 41. Observed catch (counts and weight lb) of protected fish species by block area closure (2011-2014).
Block Area Closures
Depth Zone Eulachon (count/weight lb)
Green Sturgeon (count/weight lb)
King (Chinook) Salmon (count/weight lb)
Silver (Coho) Salmon (count/weight lb)
Cape Flattery to Point Chehalis
0fm-30fm 30fm-100fm <1 / 0.00001 <1 / 0.00004 100fm-150fm 150fm-700fm
Point Chehalis to Cape Blanco
0fm-30fm 157 / 6 65 / 2115.4 10 / 88.3 30fm-100fm 1440 / 167.6 24 / 937.7 332 / 778.6 38 / 78.4 100fm-150fm 3 / 0.3 3 / 10.1 150fm-700fm 22 / 2.8 288 / 1362.4 26 / 94.2
Cape Blanco to Cape Mendocino
0fm-30fm 1 / 0.1 16 / 42.6 30fm-100fm 100fm-150fm 7 / 28.1 150fm-700fm 0.1 / <1 649 / 2167.4 27 / 97.3
Cape Mendocino to Point Conception
0fm-30fm 30fm-100fm 118 / 743.3 4 / 36.9 100fm-150fm 21 / 118.3 7 / 38.4 150fm-700fm 8 / 46.3
Point Conception to US/Mexico Border
0fm-30fm 30fm-100fm 100fm-150fm 150fm-700fm
Note: If a tow is found inside and outside the DCA then a percentage of the catch is created for inside the DAC based on too length. Therefore, a number in the table may be shown as <1. Marine Mammals Table 42 shows those marine mammals that have been observed killed or entangled in gear in the proposed BACs. The interactions included in the table are: entangled in gear - not trailing gear, entangled in gear - trailing gear, killed by gear, lethal removal - not trailing gear, lethal removal - trailing gear. Less than 1/3 of the interactions resulted in death by the gear interaction. Table 42. Observed marine mammal interactions form 2011 to 2014 in the proposed BACs.
Block Area Closures
Depth Zone
California Sea Lion
Northern Elephant Seal
Pacific White-sided Dolphin
Sea Lion Unid
Seal Unid
Steller Sea Lion
Grand Total
Point Chehalis to
30fm-100fm
3 1 4 8

96
Block Area Closures
Depth Zone
California Sea Lion
Northern Elephant Seal
Pacific White-sided Dolphin
Sea Lion Unid
Seal Unid
Steller Sea Lion
Grand Total
Cape Blanco
100fm-150fm
7 24 31
Cape Blanco to Cape Mendocino
30fm-100fm
1 1
100fm-150fm
16 1 1 49 67
Cape Mendocino to Point Conception
0fm-30fm
1 1
30fm-100fm
8 3 11
150fm-700fm
12 1 4 17
Seabirds Table 43 shows those birds that have been observed killed or entangled in gear in the proposed BACs. The interactions included here are: entangled in gear - not trailing gear, entangled in gear - trailing gear, killed by gear, lethal removal - not trailing gear, lethal removal - trailing gear. Table 43 does not contain the categories of boarded vessel, deterrence used, feeding on catch, other, previously dead, and unknown. Most of the interactions with seabirds in the BAC analysis show birds feeding on catch. Table 43. Observed seabird interactions form 2011 to 2014 in the proposed BACs.
Block Area Closures
Depth Zone
California Gull
Herring Gull
Northern Fulmar
Storm-Petrel Unid
Grand Total
Pt Chehalis to Cape Blanco
150fm-700fm
0 1 1 0 2
Cape Blanco to Cape Mendocino
150fm-700fm
1 0 0 0 1
Cape Mendocino to Pt Conception
150fm-700fm
0 0 0 1 1
Socioeconomics
Under alternative 3d, the entire trawl RCA would be removed, which would open up just over 4000 mi2 to bottom trawling. Additionally, under alternative 3d, the Council and NMFS would
97
have the option of additional species closures through BAC. This would provide an additional management tool to the Council and NMFS to implement in the event that there was a species management concern. The BAC were not designed around overfished species or protected species. They were designed using biogeographic regions and depth bins. Therefore, they could be broader in their impacts than alternative 3c depending on the area closed and the length of time of the closure.

98
Table 44 provides the total tow length, number of vessels, and number of tows that have taken place in each of the BAC between 2011 and 2014. During this time period 269,331 mi were towed. There was a total of more than 31,000 trawl tows. The majority of the tows took place between 150fm and 700fm between Point Chehalis and Cape Blanco with 50 unique vessels conducting almost 11,000 commercial tows. These 50 vessels towed more than 100,000 mi during this period. Almost half of the total tows for all BAC during this time. The second and third most tows come from the same depth bin but further down the coast. The 150fm to 700fm areas between Cape Blanco and Cape Mendocino, as well as Cape Mendocino and Point Conception each had at least 5,000 tows take place from 2011 through 2014. However, in the more southern area of Cape Mendocino and Point Conception there were 10 less boats conducting the tows than in the area just north. If NMFS or the Council were to close one of these BAC that would mean displacing all of that towing effort, which is likely to have a negative impact on the fleet as they would be required to either fish shoreward of the 150fm line or seaward of the 700fm line, if they wanted to remain within a certain geographic region. Alternatively, NMFS or the Council could decide to close an area smaller than the whole BAC which would in turn result in less impacts than closing the whole BAC.

99
Table 44. Total length (miles) of commercial tows, total number of vessels and total number of tows that occurred from 2011-2014 within the boundaries of the DAC groupings
Block Area Closure Tow Length (mi)
No. of Vessels
No. of Tows
Biogeographic Region Depth Bin
Cape Flattery to Point Chehalis 0fm-30fm t 1 1 30fm-100fm t 18 98 100fm-150fm
15 2 35
150fm-700fm
551 17 232
Point Chehalis to Cape Blanco 0fm-30fm 3,144 15 812 30fm-100fm 32,011 41 5433 100fm-150fm
2,204 44 850
150fm-700fm
104,376 50 10734
Cape Blanco to Cape Mendocino 0fm-30fm 154 5 32 30fm-100fm 3,583 22 666 100fm-150fm
1,037 24 341
150fm-700fm
63,502 33 5154
Cape Mendocino to Point Conception
0fm-30fm 11 3 4 30fm-100fm 5,459 21 1444 100fm-150fm
1,273 21 603
150fm-700fm
52,012 23 5200
Point Conception to US/Mexico Border
0fm-30fm 0 0 0 30fm-100fm 0 0 0 100fm-150fm
0 0 0
150fm-700fm
0 0 0
TOTALS - 269,331 340 31,639
In addition to losing fishing grounds, which would force the fleet to avoid the area, closing a BAC would also close an area that may have been profitable to fish in.
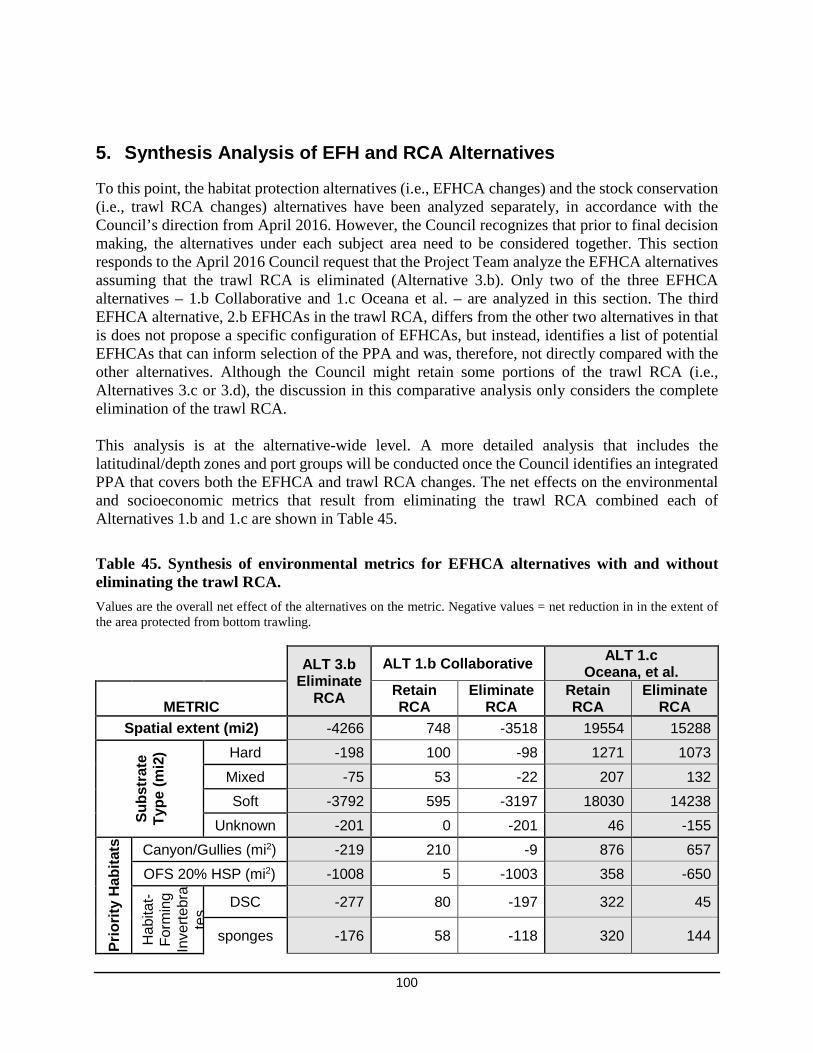
100
5. Synthesis Analysis of EFH and RCA Alternatives
To this point, the habitat protection alternatives (i.e., EFHCA changes) and the stock conservation (i.e., trawl RCA changes) alternatives have been analyzed separately, in accordance with the Council’s direction from April 2016. However, the Council recognizes that prior to final decision making, the alternatives under each subject area need to be considered together. This section responds to the April 2016 Council request that the Project Team analyze the EFHCA alternatives assuming that the trawl RCA is eliminated (Alternative 3.b). Only two of the three EFHCA alternatives – 1.b Collaborative and 1.c Oceana et al. – are analyzed in this section. The third EFHCA alternative, 2.b EFHCAs in the trawl RCA, differs from the other two alternatives in that is does not propose a specific configuration of EFHCAs, but instead, identifies a list of potential EFHCAs that can inform selection of the PPA and was, therefore, not directly compared with the other alternatives. Although the Council might retain some portions of the trawl RCA (i.e., Alternatives 3.c or 3.d), the discussion in this comparative analysis only considers the complete elimination of the trawl RCA. This analysis is at the alternative-wide level. A more detailed analysis that includes the latitudinal/depth zones and port groups will be conducted once the Council identifies an integrated PPA that covers both the EFHCA and trawl RCA changes. The net effects on the environmental and socioeconomic metrics that result from eliminating the trawl RCA combined each of Alternatives 1.b and 1.c are shown in Table 45.
Table 45. Synthesis of environmental metrics for EFHCA alternatives with and without eliminating the trawl RCA. Values are the overall net effect of the alternatives on the metric. Negative values = net reduction in in the extent of the area protected from bottom trawling.
ALT 3.b
Eliminate RCA
ALT 1.b Collaborative ALT 1.c Oceana, et al.
METRIC Retain RCA
Eliminate RCA
Retain RCA
Eliminate RCA
Spatial extent (mi2) -4266 748 -3518 19554 15288
Subs
trat
e Ty
pe (m
i2) Hard -198 100 -98 1271 1073
Mixed -75 53 -22 207 132 Soft -3792 595 -3197 18030 14238
Unknown -201 0 -201 46 -155
Prio
rity
Hab
itats
Canyon/Gullies (mi2) -219 210 -9 876 657 OFS 20% HSP (mi2) -1008 5 -1003 358 -650
Hab
itat-
Form
ing
Inve
rtebr
ate
s
DSC -277 80 -197 322 45
sponges -176 58 -118 320 144
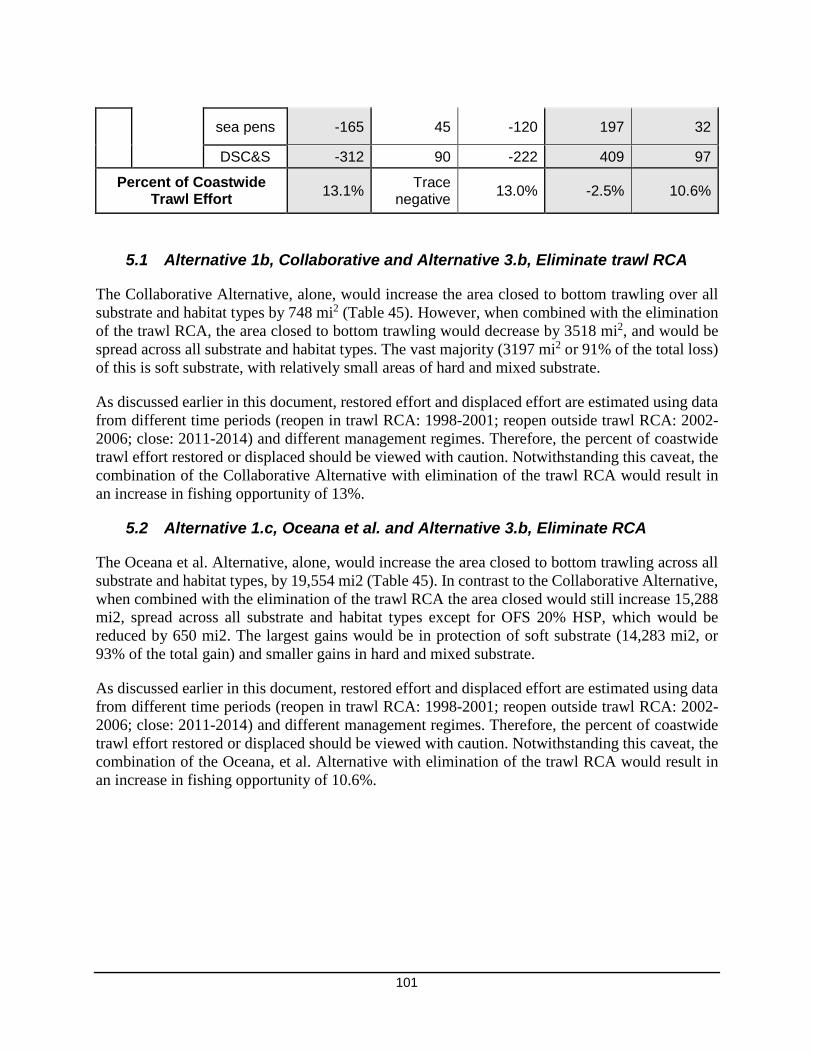
101
sea pens -165 45 -120 197 32
DSC&S -312 90 -222 409 97
Percent of Coastwide Trawl Effort 13.1% Trace
negative 13.0% -2.5% 10.6%
5.1 Alternative 1b, Collaborative and Alternative 3.b, Eliminate trawl RCA
The Collaborative Alternative, alone, would increase the area closed to bottom trawling over all substrate and habitat types by 748 mi2 (Table 45). However, when combined with the elimination of the trawl RCA, the area closed to bottom trawling would decrease by 3518 mi2, and would be spread across all substrate and habitat types. The vast majority (3197 mi2 or 91% of the total loss) of this is soft substrate, with relatively small areas of hard and mixed substrate.
As discussed earlier in this document, restored effort and displaced effort are estimated using data from different time periods (reopen in trawl RCA: 1998-2001; reopen outside trawl RCA: 2002-2006; close: 2011-2014) and different management regimes. Therefore, the percent of coastwide trawl effort restored or displaced should be viewed with caution. Notwithstanding this caveat, the combination of the Collaborative Alternative with elimination of the trawl RCA would result in an increase in fishing opportunity of 13%.
5.2 Alternative 1.c, Oceana et al. and Alternative 3.b, Eliminate RCA
The Oceana et al. Alternative, alone, would increase the area closed to bottom trawling across all substrate and habitat types, by 19,554 mi2 (Table 45). In contrast to the Collaborative Alternative, when combined with the elimination of the trawl RCA the area closed would still increase 15,288 mi2, spread across all substrate and habitat types except for OFS 20% HSP, which would be reduced by 650 mi2. The largest gains would be in protection of soft substrate (14,283 mi2, or 93% of the total gain) and smaller gains in hard and mixed substrate.
As discussed earlier in this document, restored effort and displaced effort are estimated using data from different time periods (reopen in trawl RCA: 1998-2001; reopen outside trawl RCA: 2002-2006; close: 2011-2014) and different management regimes. Therefore, the percent of coastwide trawl effort restored or displaced should be viewed with caution. Notwithstanding this caveat, the combination of the Oceana, et al. Alternative with elimination of the trawl RCA would result in an increase in fishing opportunity of 10.6%.

102
6. References
Love et al., 2002. The rockfishes of the Northeast Pacific. University of California Press, Berkeley, California.
NMFS 2005. Final Environmental Impact Statement for Pacific Coast Groundfish Fishery Management Plan Amendment 19, designating essential fish habitat and minimizing adverse impacts. National Marine Fisheries Service Northwest Region, 7600 Sand Point Way NE, Seattle, Washington, 98115-0070. December 2005.
NMFS 2015. Our living oceans: habitat. Status of the habitat of U.S. Living marine resources. U.S. Dep. Commer., noaa tech. Memo. Nmfs-f/spo-75, 327 p. Doi: 10.7755/tmspo.75 (yoklavich and wakefield)
PFMC 2008b. Pacific Fishery Management Council Pacific Coast Groundfish Fishery Stock Assessment and Evaluation, Volume 1. PFMC, Portland, Oregon. March 2008
PFMC 2012. Pacific Fishery Management Council and NMFS (National Marine Fisheries Service). 2011. Proposed Harvest Specifications and Management Measures for the 2011-2012 Pacific Coast Groundfish Fishery and Amendment 16-5 to the Pacific Coast Groundfish Fishery Management Plan to Update Existing Rebuilding Plans and Adopt a Rebuilding Plan for Petrale Sole; Final Environmental Impact Statement. Pacific Fishery Management Council, Portland, OR. February 2011.
Sommers et al. 2016. Somers, K.A., Y.-W. Lee, J. Jannot, V. Tuttle, N.B. Riley, and J. McVeigh. 2016. Estimated discard and catch of groundfish species in the 2015 U.S. west coast fisheries. NOAA Fisheries, NWFSC Observer Program, 2725. Montlake Blvd E., Seattle, WA 98112.
Ware, D. M., and G. A. McFarlane. 1989. Fisheries production domains in the Northeast Pacific Ocean. Pages 359–379 in Beamish, R. J., and G. A. McFarlane, editors. Effects of ocean variability on recruitment and an evaluation of parameters used in stock assessment models. Canadian Special Publications of Fisheries and Aquatic Sciences 10816 U.S.C. 1853 (7).

APPENDICES
Electronic only:
Appendix A (Collaborative Proposal): ftp://ftp.pcouncil.org/pub/EFH_Archives/EFH_Proposals_2013/Collaborative%20Proposal%20/Collaborative%20Package%20Final%20Nov%202016.pdf
Appendix B (Oceana, et al., original proposal): ftp://ftp.pcouncil.org/pub/EFH_Archives/EFH_Proposals_2013/H7a_Att7_Oceana_NRDC_OC_Proposal_NOV2013BB
Appendix C (Conservation Value, description and methods)
Appendix D • Table D-1b. Socioeconomic by geo break for collaborative (placeholder) • Table D-2b. Socioeconomic metrics by geo area for Alternative 1.c, Oceana,
et al. (placeholder) • Table D-3b. Socioeconomic metrics for PH in RCA by geographic area
(placeholder)
Appendix E • Table E-1. Socioeconomic effects of Alternative 1.b, Collaborative proposal,
by port group and geographic area (placeholder). • Table E-2. Socioeconomic effects of Alternative 1.c, Oceana, et al. proposal,
by port group and geographic area (placeholder). • Table E-3. Socioeconomic effects of Alternative 2.b, EFHCAs in the RCA,
by port group and geographic area (placeholder). Appendix F
• Table F-1b. Socioeconomic effects of Alternative 1.b, Collaborative proposal, by polygon (placeholder).
• Table F-2b. Socioeconomic effects of Alternative 1.c, Oceana et al. proposal, by polygon (placeholder).
• Table F-3b. Socioeconomic metrics for Alternative 2.b, EFHCAs in the RCA (placeholder).