Embed Size (px)
Citation preview

Statistical release P0142.1
PRODUCER PRICE INDEX (PPI)
MARCH 2009
Embargoed until: 30 April 2009
09:00
Enquiries: Forthcoming issue: Expected release date
Marais Kleu April 2009 28 May 2009 (012) 310 8170
Statistics South Africa 1 P0142.1
Producer Price Index, March 2009
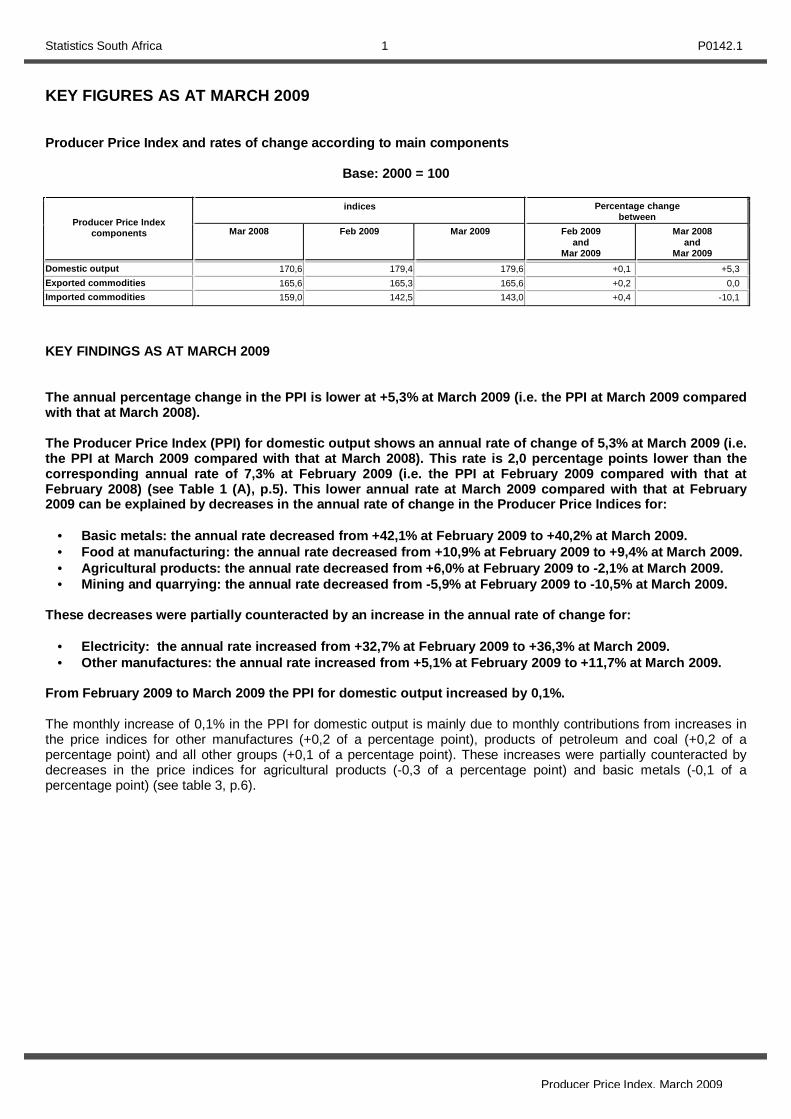
KEY FIGURES AS AT MARCH 2009 Producer Price Index and rates of change according to main components
Base: 2000 = 100
indices Percentage change between Producer Price Index
components Mar 2008 Feb 2009 Mar 2009 Feb 2009 and
Mar 2009
Mar 2008 and
Mar 2009
Domestic output 170,6 179,4 179,6 +0,1 +5,3
Exported commodities 165,6 165,3 165,6 +0,2 0,0
Imported commodities 159,0 142,5 143,0 +0,4 -10,1
KEY FINDINGS AS AT MARCH 2009 The annual percentage change in the PPI is lower at +5,3% at March 2009 (i.e. the PPI at March 2009 compared with that at March 2008). The Producer Price Index (PPI) for domestic output shows an annual rate of change of 5,3% at March 2009 (i.e. the PPI at March 2009 compared with that at March 2008). This rate is 2,0 percentage points lower than the corresponding annual rate of 7,3% at February 2009 (i.e. the PPI at February 2009 compared with that at February 2008) (see Table 1 (A), p.5). This lower annual rate at March 2009 compared with that at February 2009 can be explained by decreases in the annual rate of change in the Producer Price Indices for:
• Basic metals: the annual rate decreased from +42,1% at February 2009 to +40,2% at March 2009. • Food at manufacturing: the annual rate decreased from +10,9% at February 2009 to +9,4% at March 2009. • Agricultural products: the annual rate decreased from +6,0% at February 2009 to -2,1% at March 2009. • Mining and quarrying: the annual rate decreased from -5,9% at February 2009 to -10,5% at March 2009.
These decreases were partially counteracted by an increase in the annual rate of change for:
• Electricity: the annual rate increased from +32,7% at February 2009 to +36,3% at March 2009. • Other manufactures: the annual rate increased from +5,1% at February 2009 to +11,7% at March 2009.
From February 2009 to March 2009 the PPI for domestic output increased by 0,1%. The monthly increase of 0,1% in the PPI for domestic output is mainly due to monthly contributions from increases in the price indices for other manufactures (+0,2 of a percentage point), products of petroleum and coal (+0,2 of a percentage point) and all other groups (+0,1 of a percentage point). These increases were partially counteracted by decreases in the price indices for agricultural products (-0,3 of a percentage point) and basic metals (-0,1 of a percentage point) (see table 3, p.6).
Statistics South Africa 2 P0142.1
Producer Price Index, March 2009
The annual rate of change in the PPI for exported commodities is lower at 0,0% at March 2009 (i.e. the PPI at March 2009 compared with that at March 2008). The PPI for exported commodities shows an annual rate of change of 0,0% at March 2009 (i.e. the PPI at March 2009 compared with that at March 2008). This rate is 1,6 percentage points lower than the corresponding annual rate of 1,6% at February 2009 (i.e. the PPI at February 2009 compared with that at February 2008) (see Table 1(B), p.5). The annual change of 0,0% in the PPI for exported commodities is due to annual contributions from decreases in the price indices of mining and quarrying (-2,9 percentage points), all other groups (-0,5 of a percentage point) and products of petroleum and coal (-0,1 of a percentage point). These decreases were counteracted by increases in the price indices of basic metals (+2,9 percentage points), food at manufacturing (+0,1 of a percentage point), paper and paper products (+0,1 of a percentage point), metal products (+0,1 of a percentage point), non-electrical machinery and equipment (+0,1 of a percentage point), radio, television and communication equipment and apparatus (+0,1 of a percentage point) and transport equipment (+0,1 of a percentage point) (see Table 4, p.7).
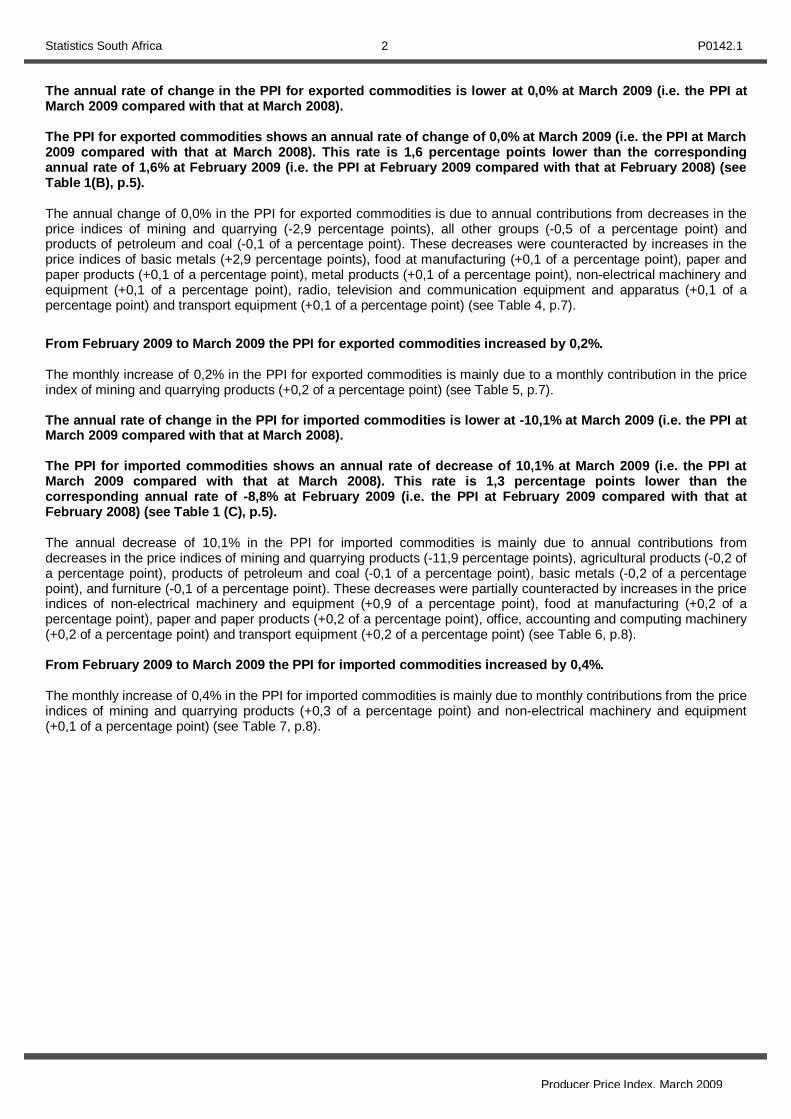
From February 2009 to March 2009 the PPI for exported commodities increased by 0,2%. The monthly increase of 0,2% in the PPI for exported commodities is mainly due to a monthly contribution in the price index of mining and quarrying products (+0,2 of a percentage point) (see Table 5, p.7). The annual rate of change in the PPI for imported commodities is lower at -10,1% at March 2009 (i.e. the PPI at March 2009 compared with that at March 2008). The PPI for imported commodities shows an annual rate of decrease of 10,1% at March 2009 (i.e. the PPI at March 2009 compared with that at March 2008). This rate is 1,3 percentage points lower than the corresponding annual rate of -8,8% at February 2009 (i.e. the PPI at February 2009 compared with that at February 2008) (see Table 1 (C), p.5). The annual decrease of 10,1% in the PPI for imported commodities is mainly due to annual contributions from decreases in the price indices of mining and quarrying products (-11,9 percentage points), agricultural products (-0,2 of a percentage point), products of petroleum and coal (-0,1 of a percentage point), basic metals (-0,2 of a percentage point), and furniture (-0,1 of a percentage point). These decreases were partially counteracted by increases in the price indices of non-electrical machinery and equipment (+0,9 of a percentage point), food at manufacturing (+0,2 of a percentage point), paper and paper products (+0,2 of a percentage point), office, accounting and computing machinery (+0,2 of a percentage point) and transport equipment (+0,2 of a percentage point) (see Table 6, p.8). From February 2009 to March 2009 the PPI for imported commodities increased by 0,4%. The monthly increase of 0,4% in the PPI for imported commodities is mainly due to monthly contributions from the price indices of mining and quarrying products (+0,3 of a percentage point) and non-electrical machinery and equipment (+0,1 of a percentage point) (see Table 7, p.8).

Statistics South Africa 3 P0142.1
Producer Price Index, March 2009
Figure 1 – Annual percentage change in the Producer Price Index:
Source: Stats SA P J Lehohla Statistician General: Statistics South Africa

Statistics South Africa 4 P0142.1
Producer Price Index, March 2009
CONTENTS Page
KEY FIGURES AS AT MARCH 2009………..…………………………………………………………………………….……..1
Figure 1 – Annual percentage change in the Producer Price Index:…………………………………………………………..3
Table 1 – The Producer Price Index (PPI) and the annual percentage change in the PPI on a monthly basis................ 5
Table 2 – Contributions to the annual percentage change in the PPI for domestic output of South African industry........6
Table 3 – Contributions to the monthly percentage change in the PPI for domestic output of South African industry…...6
Table 4 – Contributions to the annual percentage change in the PPI for exported commodities according to group....... 7
Table 5 – Contributions to the monthly percentage change in the PPI for exported commodities according to group..... 7
Table 6 – Contributions to the annual percentage change in the PPI for imported commodities according to group....... 8
Table 7 – Contributions to the monthly percentage change in the PPI for imported commodities according to group..... 8
Table 8 – Producer Price Index for domestic output of South African industry groups……………………………………...9
Table 9 – Producer Price Index for exported commodities according to group………………………………….………….11
Table 10 – Producer Price Index for imported commodities according to group…………………………………….……...13
Table 11 – Producer Price Index for materials used in certain industries…………………………………………….….…..15
Table 12 – Producer Price Index for selected materials……………………………………………………………………….16
NOTES……………………………………………………………………………………………………… …………….………..19
ADDITIONAL FORMATION…………………………………………..………………………………………………….……….22
GLOSSARY…………………………………………………………………………………………………………….… ….….…25
FOR MORE INFORMATION………………………………………………………………………………………… .…….……26
Produced by Stats SA…………………………………………………………………………………………… …………..……26

Statistics South Africa 5 P0142.1
Producer Price Index, March 2009
Table 1 The Producer Price Index (PPI) and the annual percentage change in the PPI on a monthly basis
Base: 2000 = 100
A) Domestic output
Year Jan Feb Mar Apr May Jun Jul Aug Sep Oct Nov Dec Avg
Index 149,3 150,2 152,5 154,9 157,0 160,5 161,9 162,5 160,9 162,3 162,9 163,3 158,1 2007
% +10,8 +11,3 +12,5 +13,1 +13,2 +12,6 +11,6 +9,6 +9,3 +9,4 +9,0 +9,5 +10,9
Index 164,9 167,2 170,6 174,1 182,7 187,5 192,5 193,5 186,7 185,8 183,4 181,3 180,8 2008
% +10,4 +11,3 +11,9 +12,4 +16,4 +16,8 +18,9 +19,1 +16,0 +14,5 +12,6 +11,0 +14,2
Index 180,0 179,4 179,6 .. .. .. .. .. .. .. .. .. .. 2009
% +9,2 +7,3 +5,3 .. .. .. .. .. .. .. .. .. ..
B) Exported commodities
Year Jan Feb Mar Apr May Jun Jul Aug Sep Oct Nov Dec Avg
Index 148,7 150,6 153,4 156,1 158,6 160,5 159,0 158,2 157,8 157,9 160,0 160,1 156,7 2007
% +15,0 +17,6 +18,8 +20,0 +19,9 +18,5 +14,9 +10,1 +8,3 +7,3 +6,7 +7,9 +13,7
Index 160,9 162,7 165,6 165,5 168,9 171,7 170,6 170,5 173,1 178,3 177,9 167,8 169,4 2008
% +8,2 +8,0 +8,0 +6,0 +6,5 +7,0 +7,3 +7,8 +9,7 +12,9 +11,2 +4,8 +8,1
Index 165,1 165,3 165,6 .. .. .. .. .. .. .. .. .. .. 2009
% +2,6 +1,6 0,0 .. .. .. .. .. .. .. .. .. ..
C) Imported commodities
Year Jan Feb Mar Apr May Jun Jul Aug Sep Oct Nov Dec Avg
Index 137,6 135,9 136,8 139,5 140,5 141,7 144,5 145,9 146,9 148,3 149,4 151,3 143,1 2007
% +10,9 +9,7 +9,9 +10,5 +11,7 +9,4 +9,2 +9,7 +8,5 +7,5 +7,3 +11,3 +9,6
Index 154,5 156,3 159,0 169,1 172,8 176,6 177,5 179,5 176,2 163,6 158,8 156,5 166,7 2008
% +12,3 +15,0 +16,2 +21,2 +23,0 +24,6 +22,8 +23,0 +19,9 +10,3 +6,3 +3,4 +16,5
Index 146,8 142,5 143,0 .. .. .. .. .. .. .. .. .. .. 2009
% -5,0 -8,8 -10,1 .. .. .. .. .. .. .. .. .. ..

Statistics South Africa 6 P0142.1
Producer Price Index, March 2009
Table 2 Contributions to the annual percentage change in the PPI for domestic output of South African industry groups
Group Contribution at Feb 2009
Contribution at Mar 2009
Agriculture +0,6 -0,2
Forestry +0,1 +0,1
Mining and quarrying -1,3 -2,4
Food at manufacturing +0,7 +0,6
Beverages +0,2 +0,2
Tobacco products +0,1 +0,1
Textile and made-up goods +0,1 +0,1
Wood and wood products +0,1 +0,1
Paper and paper products +0,6 +0,6
Products of petroleum and coal -1,9 -1,9
Chemicals and chemical products +0,6 +0,6
Rubber and plastic products +0,4 +0,4
Non-metallic mineral products +0,3 +0,3
Basic metals +3,1 +2,9
Metal products +0,4 +0,4
Non-electrical machinery and equipment +0,3 +0,3
Electrical machinery and apparatus +0,1 +0,1
Transport +0,4 +0,4
Furniture +0,1 +0,1
Other manufactures +0,2 +0,4
Electricity +1,5 +1,6
Gas and water +0,1 +0,1
All other groups +0,5 +0,4
All groups +7,3 +5,3
Table 3 Contributions to the monthly percentage change in the PPI for domestic output of South African industry groups
Group Contribution at Feb 2009
Contribution at Mar 2009
Agriculture -0,4 -0,3
Mining and quarrying +0,6 0,0
Products of petroleum and coal +0,1 +0,2
Basic metals -0,5 -0,1
Metal products -0,1 0,0
Other manufactures 0,0 +0,2
Electricity +0,1 0,0
All other groups -0,1 +0,1
All groups -0,3 +0,1

Statistics South Africa 7 P0142.1
Producer Price Index, March 2009
Table 4 Contributions to the annual percentage change in the PPI for exported commodities according to group
Group Contribution at Feb 2009
Contribution at Mar 2009
Mining and quarrying -1,5 -2,9
Food at manufacturing +0,1 +0,1
Paper and paper products +0,1 +0,1
Products of petroleum and coal -0,1 -0,1
Basic metals +2,9 +2,9
Metal products 0,0 +0,1
Non-electrical machinery and equipment +0,1 +0,1
Radio, television and communication equipment and apparatus +0,1 +0,1
Transport +0,1 +0,1
All other groups -0,2 -0,5
All groups +1,6 0,0
Table 5 Contributions to the monthly percentage change in the PPI for exported commodities according to group
Group Contribution at Feb 2009
Contribution at Mar 2009
Mining and quarrying 0,0 +0,2
Basic metals +0,1 0,0
Transport +0,1 0,0
All other groups -0,1 0,0
All groups +0,1 +0,2
Statistics South Africa 8 P0142.1
Producer Price Index, March 2009
Table 6 Contributions to the annual percentage change in the PPI for imported commodities according to group
Group Contribution at Feb 2009
Contribution at Mar 2009
Agriculture -0,2 -0,2
Mining and quarrying -10,8 -11,9
Food at manufacturing +0,2 +0,2
Paper and paper products +0,2 +0,2
Products of petroleum and coal -0,1 -0,1
Chemicals and chemical products +0,1 0,0
Non-metallic mineral products +0,1 +0,1
Basic metals -0,1 -0,2
Metal products +0,1 +0,1
Non-electrical machinery and equipment +0,9 +0,9
Office, accounting and computing machinery +0,2 +0,2
Radio, television and communication equipment and apparatus +0,1 0,0
Medical appliances, precision and optical instruments, watches and clocks +0,1 +0,1
Transport +0,2 +0,2
Furniture -0,1 -0,1
Other manufactures +0,1 +0,1
All other groups +0,2 +0,3
All groups -8,8 -10,1
Table 7 Contributions to the monthly percentage change in the PPI for imported commodities according to group
Group Contribution at Feb 2009
Contribution at Mar 2009
Mining and quarrying -3,0 +0,3
Products of petroleum and coal -0,1 0,0
Chemicals and chemical products -0,1 0,0
Non-electrical machinery and equipment +0,1 +0,1
All other groups +0,2 0,0
All groups -2,9 +0,4

Statistics South Africa 9 P0142.1
Producer Price Index, March 2009
Table 8 Producer Price Index for domestic output of South African industry groups Base: 2000 = 100
indices % change between
Origin/Group
weight
Mar 2008
Feb 2009
Mar 2009
Feb 2009 and
Mar 2009
Mar 2008 and
Mar 2009
All groups 100,00 170,6 179,4 179,6 +0,1 +5,3
1. Agriculture, forestry, fishing and mining
29,36 195,4 182,5 180,8 -0,9 -7,5
1.1 Agriculture 8,22 197,6 201,0 193,5 -3,7 -2,1
3,89 195,7 193,3 179,8 -7,0 -8,1
Grain 0,87 261,8 218,0 220,5 +1,1 -15,8
Vegetables 1,13 168,8 174,9 165,0 -5,7 -2,3
Fruits and nuts 1,43 138,3 151,2 128,6 -14,9 -7,0
Oil seeds 0,13 395,1 281,4 271,1 -3,7 -31,4
Sugar cane 0,30 168,8 199,4 202,9 +1,8 +20,2
1.1.1 Food
Other food 0,04 161,7 183,0 187,6 +2,5 +16,0
3,68 191,1 205,2 205,5 +0,1 +7,5
Live animals 2,91 193,5 210,4 210,3 0,0 +8,7
Milk 0,25 151,1 136,9 142,1 +3,8 -6,0
Eggs 0,35 214,0 254,4 256,4 +0,8 +19,8
1.1.2 Live animals and animal products
Other raw animal products 0,17 205,4 164,1 159,9 -2,6 -22,2
1.1.3 Other agricultural products 0,65 248,4 235,2 231,9 -1,4 -6,6
1.2 Forestry 1,48 117,4 128,0 126,9 -0,9 +8,1
1.3 Fishing 0,25 244,1 272,6 277,1 +1,7 +13,5
19,41 203,3 181,5 181,9 +0,2 -10,5
Coal and lignite 4,97 235,6 301,9 302,2 +0,1 +28,3
Crude petroleum and natural gas 0,62 94,4 64,5 64,7 +0,3 -31,5
Metal ores 11,48 203,4 150,2 151,0 +0,5 -25,8
1.4 Mining and quarrying
Other minerals 2,34 139,5 141,5 140,0 -1,1 +0,4
2. Manufacturing 62,30 166,2 182,2 183,3 +0,6 +10,3
5,87 184,5 200,8 201,8 +0,5 +9,4
Meat and meat products 0,56 194,3 218,6 221,8 +1,5 +14,2
Prepared and preserved fish 0,18 170,0 195,1 191,6 -1,8 +12,7
Fruits and vegetable products 0,56 142,4 153,1 152,8 -0,2 +7,3
Fats and oils 0,43 248,9 260,5 278,8 +7,0 +12,0
Dairy products 0,98 196,2 199,6 200,4 +0,4 +2,1
Grain mill products and bakery products 0,84 175,1 188,8 187,3 -0,8 +7,0
Sugar 0,44 135,9 145,3 147,3 +1,4 +8,4
Coffee and tea 0,16 149,5 183,8 186,0 +1,2 +24,4
2.1 Food at manufacturing
Other food products 1,72 186,4 209,7 208,2 -0,7 +11,7
3,04 172,8 182,7 184,0 +0,7 +6,5
Alcoholic beverages 1,73 182,0 191,9 192,9 +0,5 +6,0
2.2 Beverages
Non-alcoholic beverages 1,31 148,0 157,4 159,2 +1,1 +7,6
2.3 Tobacco products 0,59 193,9 218,0 218,0 0,0 +12,4
1,06 133,1 139,4 142,0 +1,9 +6,7
Yarn and thread; woven and tufted textile fabrics (prepared for spinning) 0,35 134,3 147,0 149,6 +1,8 +11,4
2.4 Textile and made-up goods
Textile articles other than apparel 0,71 133,8 137,5 140,1 +1,9 +4,7
1,48 125,4 127,5 127,5 0,0 +1,7
Knitted or crocheted fabrics 0,38 132,5 132,5 132,5 0,0 0,0
2.5 Wearing Apparel
Other wearing apparel 1,09 123,7 126,6 126,6 0,0 +2,3
2.6 Leather and leather products 0,32 109,5 111,0 111,0 0,0 +1,4
2.7 Footwear 0,27 135,2 146,5 147,8 +0,9 +9,3
2.8 Wood and wood products 1,40 179,1 193,4 193,5 +0,1 +8,0
4,96 151,8 172,8 172,4 -0,2 +13,6
Pulp, paper and paperboard 3,20 137,6 157,4 156,7 -0,4 +13,9
2.9 Paper and paper products
Printing, publishing and allied industries 1,77 162,5 183,5 183,6 +0,1 +13,0
2.10 Products of petroleum and coal
4,98 271,1 197,5 206,0 +4,3 -24,0

Statistics South Africa 10 P0142.1
Producer Price Index, March 2009
Table 8 - Producer Price Index for Domestic output of South African industry groups (concluded)
Base: 2000 = 100
indices % change between
Origin/Group
weight
Mar 2008
Feb 2009
Mar 2009
Feb 2009 and
Mar 2009
Mar 2008 and
Mar 2009
2.11 Chemicals and chemical products 6,74 153,3 168,8 168,9 +0,1 +10,2
3,81 162,7 178,5 178,8 +0,2 +9,9
Basic organic chemicals 0,73 244,2 243,9 243,8 0,0 -0,2
Basic inorganic chemicals 1,92 132,0 137,2 137,4 +0,1 +4,1
Fertilisers and pesticides 0,41 213,8 284,8 286,3 +0,5 +33,9
2.11.1 Basic Chemicals
Other basic chemicals 0,75 150,4 174,7 175,0 +0,2 +16,4
2,93 144,5 160,1 160,0 -0,1 +10,7
Paints, varnishes and related products; artists' colours; ink 1,49 181,1 201,2 201,0 -0,1 +11,0
Pharmaceutical products 0,36 129,9 130,8 131,6 +0,6 +1,3
Soap, cleaning preparations, perfumes and toilet preparations 0,63 140,9 155,9 156,1 +0,1 +10,8
2.11.2 Compound chemical products
Other compound chemical products 0,45 148,3 179,6 178,4 -0,7 +20,3
2,59 163,0 186,6 187,5 +0,5 +15,0
Rubber products 1,13 191,9 224,9 225,2 +0,1 +17,4
2.12 Rubber and plastic products
Plastic products 1,46 150,7 169,0 170,2 +0,7 +12,9
1,97 175,5 201,0 201,1 0,0 +14,6
Glass and glass products 0,04 143,8 147,8 147,8 0,0 +2,8
2.13 Non-metallic mineral products
Other non-metallic minerals products n.e.c. 1,93 186,3 213,6 213,7 0,0 +14,7
6,66 183,3 259,1 256,9 -0,8 +40,2
Basic iron and steel 4,12 201,4 327,4 323,8 -1,1 +60,8
2.14 Basic Metals
Rolled, drawn and folded products 2,54 164,4 159,3 159,3 0,0 -3,1
3,34 165,5 185,3 184,8 -0,3 +11,7
Structural metal products and parts thereof 1,27 176,9 193,9 193,1 -0,4 +9,2
2.15 Metal products
Other fabricated metal products 2,07 158,5 179,6 179,4 -0,1 +13,2
2,35 152,4 176,3 176,3 0,0 +15,7
General purpose machinery 1,99 145,2 169,3 169,3 0,0 +16,6
Special purpose machinery 0,24 145,6 156,6 156,6 0,0 +7,6
2.16 Non-electrical machinery and equipment
Domestic appliances and parts thereof 0,12 132,9 134,4 135,5 +0,8 +2,0
2.17 Office, accounting and computing machinery 0,20 100,4 100,4 100,4 0,0 0,0
1,93 207,3 215,2 214,8 -0,2 +3,6
Electric motors, generators and transformers, and parts thereof 0,07 241,3 285,2 283,7 -0,5 +17,6
Electricity distribution and control apparatus, and parts thereof 0,87 148,2 152,8 152,8 0,0 +3,1
Insulated wire and cable; optical fibre cables 0,72 289,4 298,1 297,4 -0,2 +2,8
2.18 Electrical machinery and apparatus
Other electrical machinery and apparatus 0,26 143,5 146,7 146,7 0,0 +2,2
2.19 Radio, television and communication equipments and parts thereof
0,48 131,2 133,2 131,7 -1,1 +0,4
2.20 Medical appliances, precision and optical instruments, watches and clocks
0,29 139,9 147,6 147,6 0,0 +5,5
2.21 Transport 5,83 134,9 146,2 146,1 -0,1 +8,3
2,12 135,9 144,5 144,3 -0,1 +6,2
Motor vehicles 2,11 133,0 141,3 141,1 -0,1 +6,1
2.21.1 Motor vehicles, parts and accessories thereof
Parts and accessories for motor vehicles 0,01 158,6 177,8 177,8 0,0 +12,1
0,09 120,3 121,3 121,2 -0,1 +0,7
Bodies for motor vehicles 0,03 156,9 156,8 157,2 +0,3 +0,2
Trailers, semi-trailer and containers 0,04 113,9 116,1 115,5 -0,5 +1,4
2.21.2 Bodies (coachwork) for motor vehicles, trailers and semi-trailers; parts
Parts for motor vehicles bodies, trailers, semi-trailers and containers 0,01 144,5 144,5 144,5 0,0 0,0
2.21.3 Other transport equipment 3,62 107,4 118,3 118,3 0,0 +10,1
2.22 Furniture 1,01 132,9 142,4 142,8 +0,3 +7,4
2.23 Other manufactures 4,95 128,4 135,0 143,4 +6,2 +11,7
8,33 119,1 151,5 151,7 +0,1 +27,4
Electricity 6,86 111,7 151,8 152,2 +0,3 +36,3
3. Electricity, gas, steam and water
Water and gas 1,47 208,7 219,2 219,2 0,0 +5,0
Statistics South Africa 11 P0142.1
Producer Price Index, March 2009
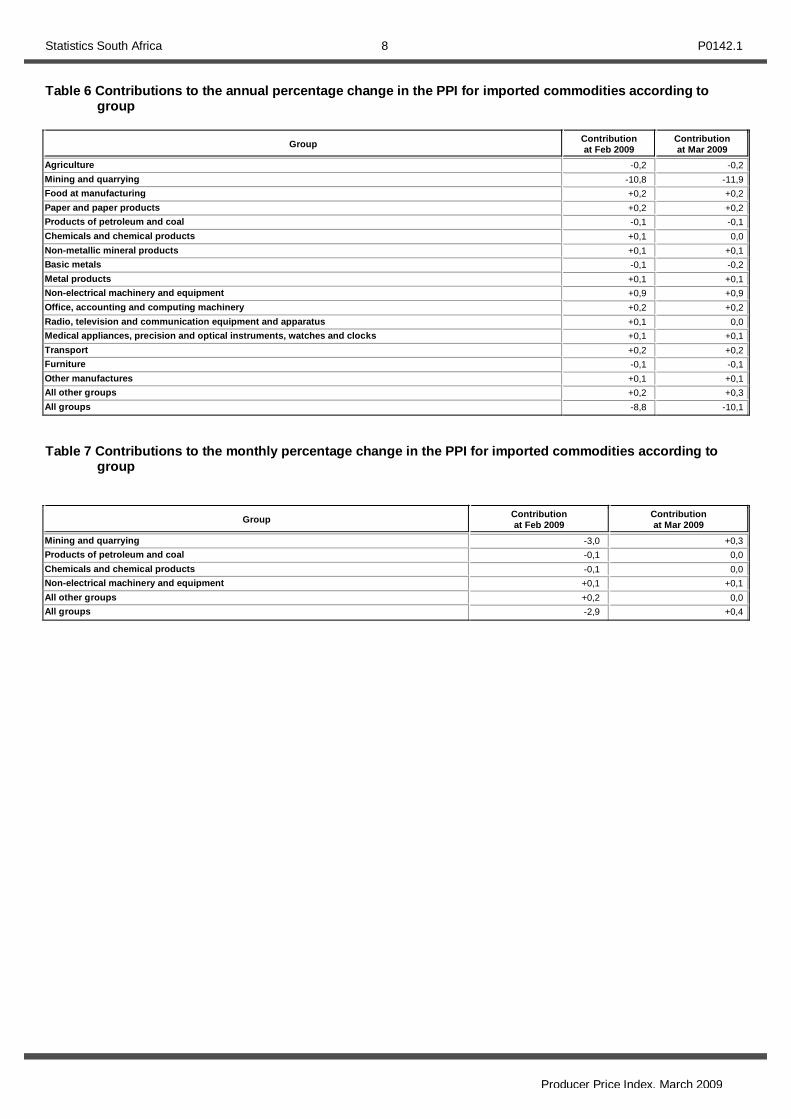
Table 9 Producer Price Index for exported commodities according to group Base: 2000 = 100
indices % change between
Origin/Group
weight
Mar 2008
Feb 2009
Mar 2009
Feb 2009 and
Mar 2009
Mar 2008 and
Mar 2009
All groups 100,00 165,6 165,3 165,6 +0,2 0,0
1. Agriculture, forestry, fishing and mining
30,34 190,4 173,7 174,6 +0,5 -8,3
1.1 Agriculture 1,62 150,3 154,2 152,8 -0,9 +1,7
1,50 148,0 153,3 152,0 -0,8 +2,7
Grain 0,19 246,7 243,7 242,1 -0,7 -1,9
Vegetables 0,31 100,0 100,0 100,0 0,0 0,0
Fruits and nuts 0,95 60,8 66,8 65,8 -1,5 +8,2
Oil seeds 0,03 100,0 100,0 100,0 0,0 0,0
1.1.1 Food
Sugar cane 0,02 100,0 100,0 100,0 0,0 0,0
0,04 186,4 100,3 98,2 -2,1 -47,3
Live animals 0,01 100,0 100,0 100,0 0,0 0,0
1.1.2 Live animals and animal products
Other raw animal products 0,03 195,2 46,1 42,5 -7,8 -78,2
1.1.3 Other agricultural products 0,08 158,8 162,2 160,4 -1,1 +1,0
1.2 Forestry 0,09 100,0 99,6 99,6 0,0 -0,4
1.3 Fishing 0,06 228,2 241,3 232,3 -3,7 +1,8
28,57 195,2 177,4 178,5 +0,6 -8,6
Coal and lignite 6,22 281,1 283,4 273,1 -3,6 -2,8
Metal ores 19,82 177,1 151,1 155,4 +2,8 -12,3
1.4 Mining and quarrying
Other minerals 2,53 133,9 142,2 141,9 -0,2 +6,0
2. Manufacturing 69,66 154,4 162,0 162,0 0,0 +4,9
2,20 147,9 151,0 153,6 +1,7 +3,9
Meat and meat products 0,09 122,0 124,8 124,8 0,0 +2,3
Prepared and preserved fish 0,24 136,8 148,0 146,3 -1,1 +6,9
Fruits and vegetable products 0,63 128,1 131,1 131,2 +0,1 +2,4
Fats and oils 0,09 199,4 199,4 199,4 0,0 0,0
Dairy products 0,03 143,1 143,1 143,1 0,0 0,0
Grain mill products and bakery products 0,07 179,7 183,8 183,8 0,0 +2,3
Sugar 0,78 140,5 142,5 145,9 +2,4 +3,8
2.1 Food at manufacturing
Other food products 0,27 163,0 166,4 172,9 +3,9 +6,1
1,55 128,0 128,4 128,4 0,0 +0,3
Alcoholic beverages 1,39 128,9 128,9 128,9 0,0 0,0
2.2 Beverages
Non-alcoholic beverages 0,16 117,6 120,3 120,3 0,0 +2,3
2.3 Tobacco products 0,19 118,4 118,4 118,4 0,0 0,0
0,56 175,7 175,9 176,1 +0,1 +0,2
Yarn and thread; woven and tufted textile fabrics (prepared for spinning) 0,03 207,3 195,4 199,2 +1,9 -3,9
2.4 Textile and made-up goods
Textile articles other than apparel 0,53 118,0 118,7 118,7 0,0 +0,6
0,19 108,5 109,4 109,4 0,0 +0,8
Knitted or crocheted fabrics 0,14 118,3 118,3 118,3 0,0 0,0
2.5 Wearing Apparel
Other wearing apparel 0,06 106,0 109,0 109,0 0,0 +2,8
2.6 Leather and leather products 0,29 98,3 98,3 98,3 0,0 0,0
2.7 Footwear 0,04 166,7 166,7 166,7 0,0 0,0
2.8 Wood and wood products 0,83 181,5 181,6 181,6 0,0 +0,1
1,80 129,8 136,0 136,0 0,0 +4,8
Pulp, paper and paperboard 1,52 132,3 139,9 139,9 0,0 +5,7
2.9 Paper and paper products
Printing, publishing and allied industries 0,28 113,4 113,4 113,4 0,0 0,0
2.10 Products of petroleum and coal
2,37 257,3 248,0 248,0 0,0 -3,6
Statistics South Africa 12 P0142.1
Producer Price Index, March 2009
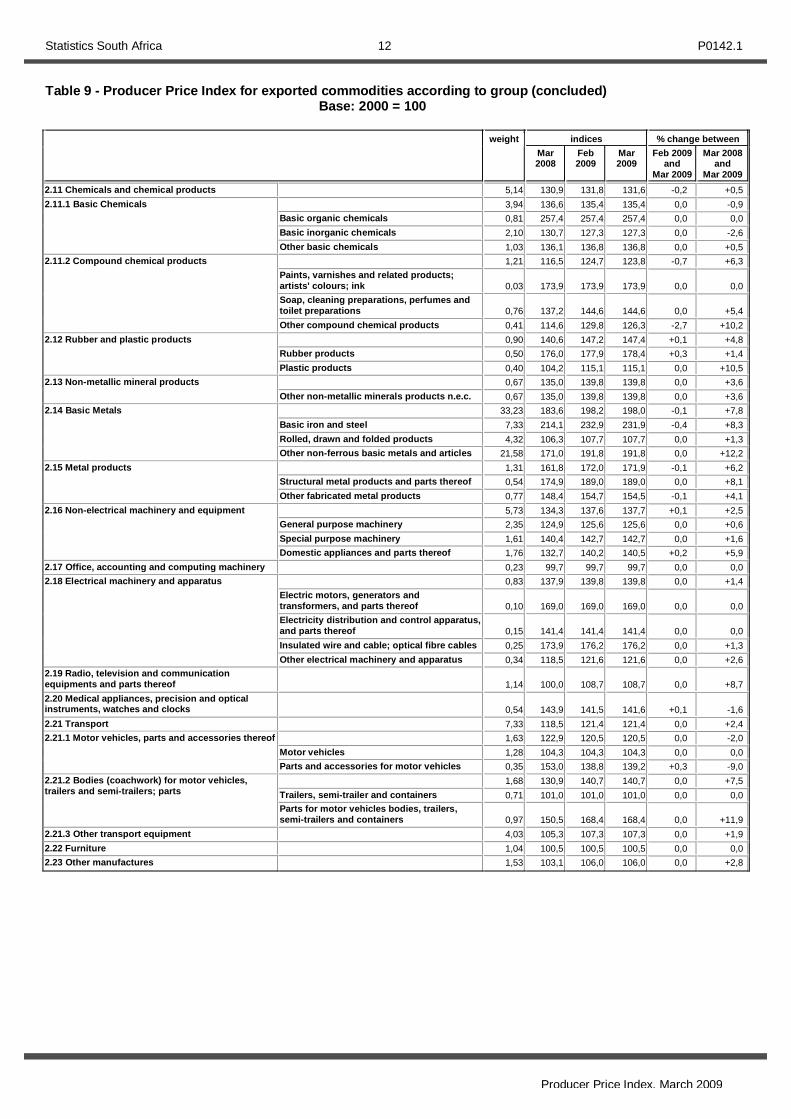
Table 9 - Producer Price Index for exported commodities according to group (concluded) Base: 2000 = 100
indices % change between
weight
Mar 2008
Feb 2009
Mar 2009
Feb 2009 and
Mar 2009
Mar 2008 and
Mar 2009
2.11 Chemicals and chemical products 5,14 130,9 131,8 131,6 -0,2 +0,5
3,94 136,6 135,4 135,4 0,0 -0,9
Basic organic chemicals 0,81 257,4 257,4 257,4 0,0 0,0
Basic inorganic chemicals 2,10 130,7 127,3 127,3 0,0 -2,6
2.11.1 Basic Chemicals
Other basic chemicals 1,03 136,1 136,8 136,8 0,0 +0,5
1,21 116,5 124,7 123,8 -0,7 +6,3
Paints, varnishes and related products; artists' colours; ink 0,03 173,9 173,9 173,9 0,0 0,0
Soap, cleaning preparations, perfumes and toilet preparations 0,76 137,2 144,6 144,6 0,0 +5,4
2.11.2 Compound chemical products
Other compound chemical products 0,41 114,6 129,8 126,3 -2,7 +10,2
0,90 140,6 147,2 147,4 +0,1 +4,8
Rubber products 0,50 176,0 177,9 178,4 +0,3 +1,4
2.12 Rubber and plastic products
Plastic products 0,40 104,2 115,1 115,1 0,0 +10,5
0,67 135,0 139,8 139,8 0,0 +3,6 2.13 Non-metallic mineral products
Other non-metallic minerals products n.e.c. 0,67 135,0 139,8 139,8 0,0 +3,6
33,23 183,6 198,2 198,0 -0,1 +7,8
Basic iron and steel 7,33 214,1 232,9 231,9 -0,4 +8,3
Rolled, drawn and folded products 4,32 106,3 107,7 107,7 0,0 +1,3
2.14 Basic Metals
Other non-ferrous basic metals and articles 21,58 171,0 191,8 191,8 0,0 +12,2
1,31 161,8 172,0 171,9 -0,1 +6,2
Structural metal products and parts thereof 0,54 174,9 189,0 189,0 0,0 +8,1
2.15 Metal products
Other fabricated metal products 0,77 148,4 154,7 154,5 -0,1 +4,1
5,73 134,3 137,6 137,7 +0,1 +2,5
General purpose machinery 2,35 124,9 125,6 125,6 0,0 +0,6
Special purpose machinery 1,61 140,4 142,7 142,7 0,0 +1,6
2.16 Non-electrical machinery and equipment
Domestic appliances and parts thereof 1,76 132,7 140,2 140,5 +0,2 +5,9
2.17 Office, accounting and computing machinery 0,23 99,7 99,7 99,7 0,0 0,0
0,83 137,9 139,8 139,8 0,0 +1,4
Electric motors, generators and transformers, and parts thereof 0,10 169,0 169,0 169,0 0,0 0,0
Electricity distribution and control apparatus, and parts thereof 0,15 141,4 141,4 141,4 0,0 0,0
Insulated wire and cable; optical fibre cables 0,25 173,9 176,2 176,2 0,0 +1,3
2.18 Electrical machinery and apparatus
Other electrical machinery and apparatus 0,34 118,5 121,6 121,6 0,0 +2,6
2.19 Radio, television and communication equipments and parts thereof
1,14 100,0 108,7 108,7 0,0 +8,7
2.20 Medical appliances, precision and optical instruments, watches and clocks
0,54 143,9 141,5 141,6 +0,1 -1,6
2.21 Transport 7,33 118,5 121,4 121,4 0,0 +2,4
1,63 122,9 120,5 120,5 0,0 -2,0
Motor vehicles 1,28 104,3 104,3 104,3 0,0 0,0
2.21.1 Motor vehicles, parts and accessories thereof
Parts and accessories for motor vehicles 0,35 153,0 138,8 139,2 +0,3 -9,0
1,68 130,9 140,7 140,7 0,0 +7,5
Trailers, semi-trailer and containers 0,71 101,0 101,0 101,0 0,0 0,0
2.21.2 Bodies (coachwork) for motor vehicles, trailers and semi-trailers; parts
Parts for motor vehicles bodies, trailers, semi-trailers and containers 0,97 150,5 168,4 168,4 0,0 +11,9
2.21.3 Other transport equipment 4,03 105,3 107,3 107,3 0,0 +1,9
2.22 Furniture 1,04 100,5 100,5 100,5 0,0 0,0
2.23 Other manufactures 1,53 103,1 106,0 106,0 0,0 +2,8
Statistics South Africa 13 P0142.1
Producer Price Index, March 2009
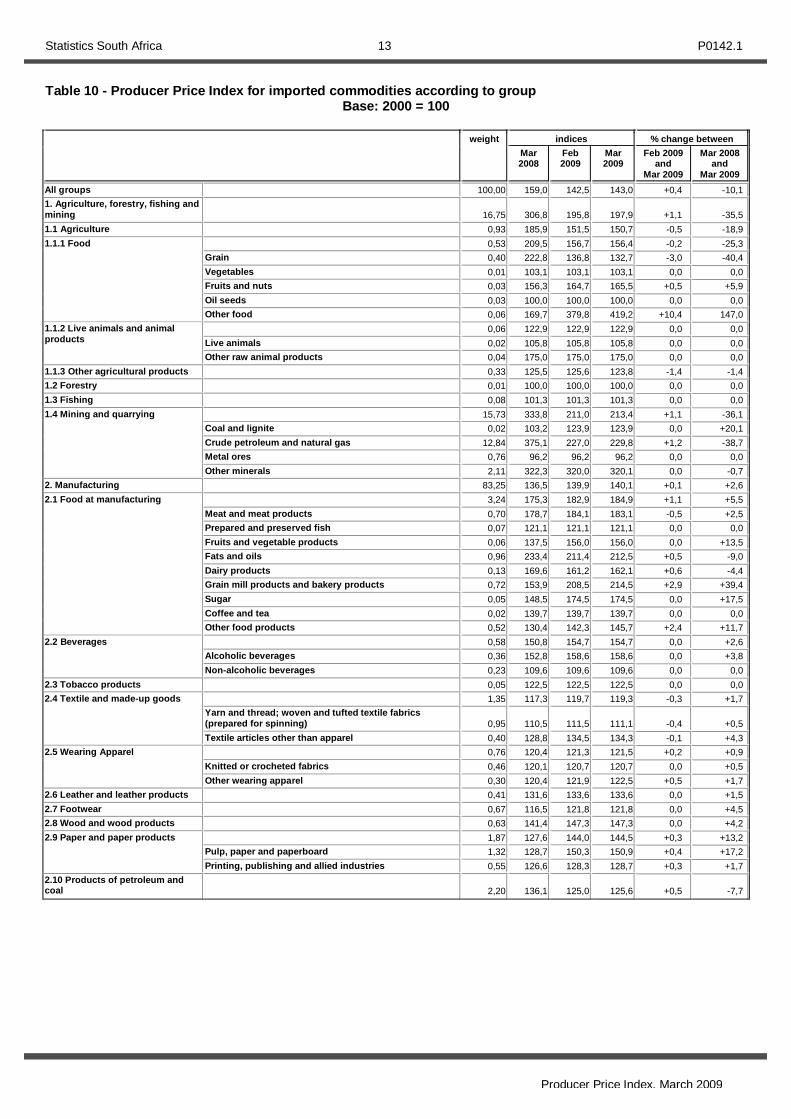
Table 10 - Producer Price Index for imported commodities according to group
Base: 2000 = 100
indices % change between
weight
Mar 2008
Feb 2009
Mar 2009
Feb 2009 and
Mar 2009
Mar 2008 and
Mar 2009
All groups 100,00 159,0 142,5 143,0 +0,4 -10,1
1. Agriculture, forestry, fishing and mining
16,75 306,8 195,8 197,9 +1,1 -35,5
1.1 Agriculture 0,93 185,9 151,5 150,7 -0,5 -18,9
0,53 209,5 156,7 156,4 -0,2 -25,3
Grain 0,40 222,8 136,8 132,7 -3,0 -40,4
Vegetables 0,01 103,1 103,1 103,1 0,0 0,0
Fruits and nuts 0,03 156,3 164,7 165,5 +0,5 +5,9
Oil seeds 0,03 100,0 100,0 100,0 0,0 0,0
1.1.1 Food
Other food 0,06 169,7 379,8 419,2 +10,4 147,0
0,06 122,9 122,9 122,9 0,0 0,0
Live animals 0,02 105,8 105,8 105,8 0,0 0,0
1.1.2 Live animals and animal products
Other raw animal products 0,04 175,0 175,0 175,0 0,0 0,0
1.1.3 Other agricultural products 0,33 125,5 125,6 123,8 -1,4 -1,4
1.2 Forestry 0,01 100,0 100,0 100,0 0,0 0,0
1.3 Fishing 0,08 101,3 101,3 101,3 0,0 0,0
15,73 333,8 211,0 213,4 +1,1 -36,1
Coal and lignite 0,02 103,2 123,9 123,9 0,0 +20,1
Crude petroleum and natural gas 12,84 375,1 227,0 229,8 +1,2 -38,7
Metal ores 0,76 96,2 96,2 96,2 0,0 0,0
1.4 Mining and quarrying
Other minerals 2,11 322,3 320,0 320,1 0,0 -0,7
2. Manufacturing 83,25 136,5 139,9 140,1 +0,1 +2,6
3,24 175,3 182,9 184,9 +1,1 +5,5
Meat and meat products 0,70 178,7 184,1 183,1 -0,5 +2,5
Prepared and preserved fish 0,07 121,1 121,1 121,1 0,0 0,0
Fruits and vegetable products 0,06 137,5 156,0 156,0 0,0 +13,5
Fats and oils 0,96 233,4 211,4 212,5 +0,5 -9,0
Dairy products 0,13 169,6 161,2 162,1 +0,6 -4,4
Grain mill products and bakery products 0,72 153,9 208,5 214,5 +2,9 +39,4
Sugar 0,05 148,5 174,5 174,5 0,0 +17,5
Coffee and tea 0,02 139,7 139,7 139,7 0,0 0,0
2.1 Food at manufacturing
Other food products 0,52 130,4 142,3 145,7 +2,4 +11,7
0,58 150,8 154,7 154,7 0,0 +2,6
Alcoholic beverages 0,36 152,8 158,6 158,6 0,0 +3,8
2.2 Beverages
Non-alcoholic beverages 0,23 109,6 109,6 109,6 0,0 0,0
2.3 Tobacco products 0,05 122,5 122,5 122,5 0,0 0,0
1,35 117,3 119,7 119,3 -0,3 +1,7
Yarn and thread; woven and tufted textile fabrics (prepared for spinning) 0,95 110,5 111,5 111,1 -0,4 +0,5
2.4 Textile and made-up goods
Textile articles other than apparel 0,40 128,8 134,5 134,3 -0,1 +4,3
0,76 120,4 121,3 121,5 +0,2 +0,9
Knitted or crocheted fabrics 0,46 120,1 120,7 120,7 0,0 +0,5
2.5 Wearing Apparel
Other wearing apparel 0,30 120,4 121,9 122,5 +0,5 +1,7
2.6 Leather and leather products 0,41 131,6 133,6 133,6 0,0 +1,5
2.7 Footwear 0,67 116,5 121,8 121,8 0,0 +4,5
2.8 Wood and wood products 0,63 141,4 147,3 147,3 0,0 +4,2
1,87 127,6 144,0 144,5 +0,3 +13,2
Pulp, paper and paperboard 1,32 128,7 150,3 150,9 +0,4 +17,2
2.9 Paper and paper products
Printing, publishing and allied industries 0,55 126,6 128,3 128,7 +0,3 +1,7
2.10 Products of petroleum and coal
2,20 136,1 125,0 125,6 +0,5 -7,7

Statistics South Africa 14 P0142.1
Producer Price Index, March 2009
Table 10 - Producer Price Index for imported commodities according to group (concluded)
Base: 2000 = 100
indices % change between
Origin/Group
weight
Mar 2008
Feb 2009
Mar 2009
Feb 2009 and
Mar 2009
Mar 2008 and
Mar 2009
2.11 Chemicals and chemical products 10,65 162,0 162,7 162,6 -0,1 +0,4
6,29 182,1 182,1 182,0 -0,1 -0,1
Basic organic chemicals 3,26 180,6 181,1 180,9 -0,1 +0,2
Basic inorganic chemicals 0,88 121,3 120,2 120,2 0,0 -0,9
Fertilisers and pesticides 0,82 209,9 209,9 209,9 0,0 0,0
2.11.1 Basic Chemicals
Other basic chemicals 1,33 181,1 180,7 180,6 -0,1 -0,3
4,36 142,2 144,1 144,1 0,0 +1,3
Paints, varnishes and related products; artists' colours; ink 0,34 137,0 146,8 146,8 0,0 +7,2
Pharmaceutical products 0,89 136,3 136,3 136,3 0,0 0,0
Soap, cleaning preparations, perfumes and toilet preparations 0,53 132,2 137,2 137,2 0,0 +3,8
2.11.2 Compound chemical products
Other compound chemical products 2,60 145,7 146,2 146,2 0,0 +0,3
2,44 120,5 121,7 121,7 0,0 +1,0
Rubber products 0,96 120,9 124,0 124,0 0,0 +2,6
2.12 Rubber and plastic products
Plastic products 1,48 120,1 120,2 120,2 0,0 +0,1
1,57 133,7 140,5 141,0 +0,4 +5,5
Glass and glass products 0,03 116,1 120,9 138,4 +14,5 +19,2
2.13 Non-metallic mineral products
Other non-metallic minerals products n.e.c. 1,54 142,3 149,5 149,7 +0,1 +5,2
3,70 187,8 181,3 181,2 -0,1 -3,5
Basic iron and steel 0,77 160,2 162,7 162,7 0,0 +1,6
Rolled, drawn and folded products 1,24 163,6 172,1 171,6 -0,3 +4,9
2.14 Basic Metals
Other non-ferrous basic metals and articles 1,69 212,3 192,3 192,4 +0,1 -9,4
2,06 135,3 141,3 141,6 +0,2 +4,7
Structural metal products and parts thereof 0,09 109,4 109,4 109,4 0,0 0,0
2.15 Metal products
Other fabricated metal products 1,97 137,6 143,9 144,2 +0,2 +4,8
14,01 132,4 141,6 142,2 +0,4 +7,4
General purpose machinery 7,98 142,1 154,9 156,0 +0,7 +9,8
Special purpose machinery 4,64 124,8 131,2 130,9 -0,2 +4,9
2.16 Non-electrical machinery and equipment
Domestic appliances and parts thereof 1,40 137,4 139,1 139,9 +0,6 +1,8
2.17 Office, accounting and computing machinery 5,42 72,9 78,5 78,6 +0,1 +7,8
2,95 127,7 129,7 129,8 +0,1 +1,6
Electric motors, generators and transformers, and parts thereof 0,58 103,0 103,8 104,3 +0,5 +1,3
Electricity distribution and control apparatus, and parts thereof 0,75 128,9 131,7 131,7 0,0 +2,2
Insulated wire and cable; optical fibre cables 0,28 197,9 199,6 199,6 0,0 +0,9
2.18 Electrical machinery and apparatus
Other electrical machinery and apparatus 1,34 128,8 130,9 131,1 +0,2 +1,8
2.19 Radio, television and communication equipments and parts thereof
9,81 98,4 99,6 99,2 -0,4 +0,8
3,34 122,6 128,2 128,2 0,0 +4,6
Medical and surgical equipment and orthopaedic appliances 3,16 122,5 127,2 127,5 +0,2 +4,1
2.20 Medical appliances, precision and optical instruments, watches and clocks
Watches and clocks, and parts thereof 0,18 123,5 143,2 138,7 -3,1 +12,3
2.21 Transport 13,45 146,1 148,0 148,1 +0,1 +1,4
2,83 149,3 155,0 155,0 0,0 +3,8
Motor vehicles 2,73 103,4 107,6 107,6 0,0 +4,1
2.21.1 Motor vehicles, parts and accessories thereof
Parts and accessories for motor vehicles 0,11 158,6 158,6 158,6 0,0 0,0
1,63 157,2 158,8 158,8 0,0 +1,0
Trailers, semi-trailer and containers 0,70 116,7 116,7 116,7 0,0 0,0
2.21.2 Bodies (coachwork) for motor vehicles, trailers and semi-trailers; parts
Parts for motor vehicles bodies, trailers, semi-trailers and containers 0,93 157,3 159,8 159,8 0,0 +1,6
2.21.3 Other transport equipment 8,99 111,4 112,2 112,2 0,0 +0,7
2.22 Furniture 0,64 107,4 93,3 93,3 0,0 -13,1
2.23 Other manufactures 1,44 116,1 122,7 123,0 +0,2 +5,9
Statistics South Africa 15 P0142.1
Producer Price Index, March 2009
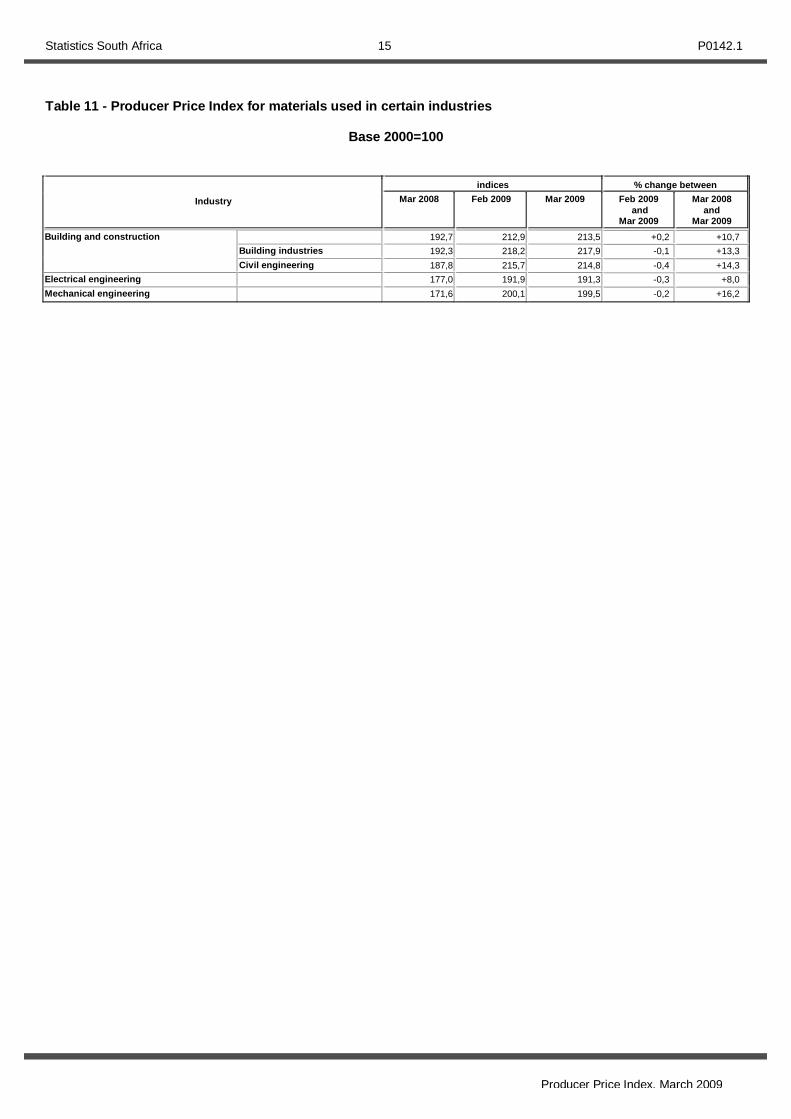
Table 11 - Producer Price Index for materials used in certain industries
Base 2000=100
indices % change between
Industry Mar 2008 Feb 2009 Mar 2009 Feb 2009 and
Mar 2009
Mar 2008 and
Mar 2009
192,7 212,9 213,5 +0,2 +10,7
Building industries 192,3 218,2 217,9 -0,1 +13,3
Building and construction
Civil engineering 187,8 215,7 214,8 -0,4 +14,3
Electrical engineering 177,0 191,9 191,3 -0,3 +8,0
Mechanical engineering 171,6 200,1 199,5 -0,2 +16,2
Statistics South Africa 16 P0142.1
Producer Price Index, March 2009
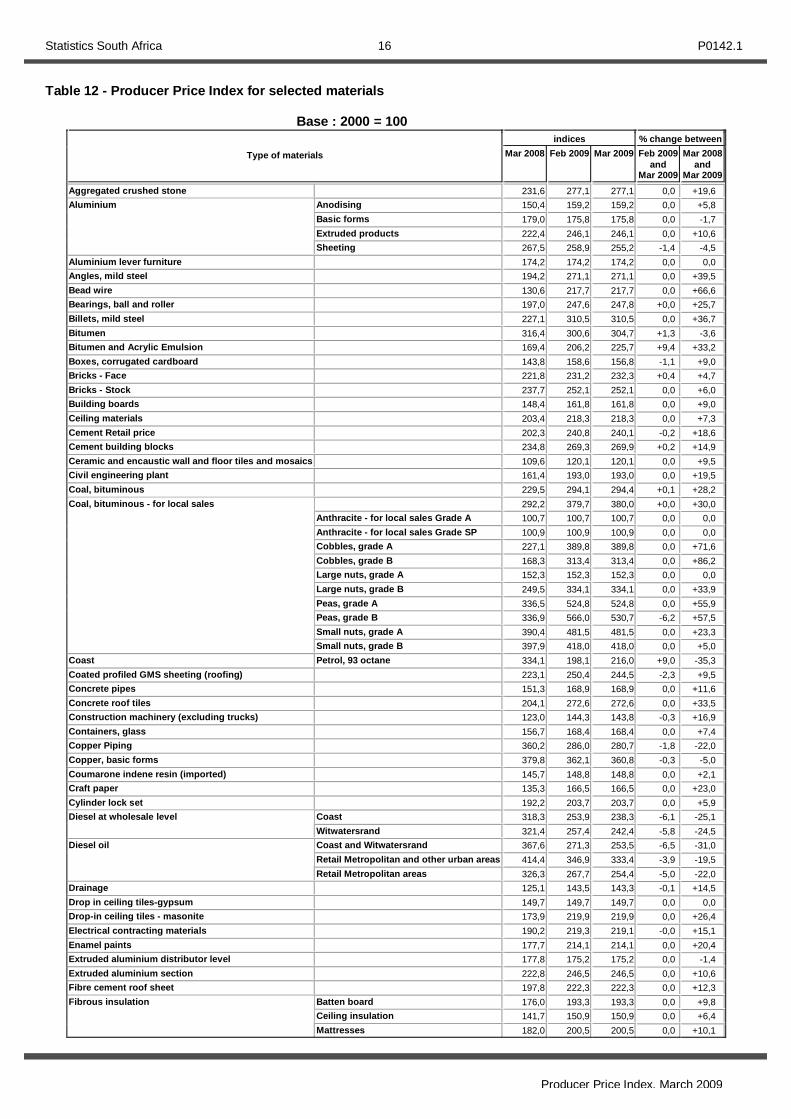
Table 12 - Producer Price Index for selected materials Base : 2000 = 100
indices % change between
Type of materials Mar 2008 Feb 2009 Mar 2009 Feb 2009 and
Mar 2009
Mar 2008 and
Mar 2009
Aggregated crushed stone 231,6 277,1 277,1 0,0 +19,6
Anodising 150,4 159,2 159,2 0,0 +5,8
Basic forms 179,0 175,8 175,8 0,0 -1,7
Extruded products 222,4 246,1 246,1 0,0 +10,6
Aluminium
Sheeting 267,5 258,9 255,2 -1,4 -4,5
Aluminium lever furniture 174,2 174,2 174,2 0,0 0,0
Angles, mild steel 194,2 271,1 271,1 0,0 +39,5
Bead wire 130,6 217,7 217,7 0,0 +66,6
Bearings, ball and roller 197,0 247,6 247,8 +0,0 +25,7
Billets, mild steel 227,1 310,5 310,5 0,0 +36,7
Bitumen 316,4 300,6 304,7 +1,3 -3,6
Bitumen and Acrylic Emulsion 169,4 206,2 225,7 +9,4 +33,2
Boxes, corrugated cardboard 143,8 158,6 156,8 -1,1 +9,0
Bricks - Face 221,8 231,2 232,3 +0,4 +4,7
Bricks - Stock 237,7 252,1 252,1 0,0 +6,0
Building boards 148,4 161,8 161,8 0,0 +9,0
Ceiling materials 203,4 218,3 218,3 0,0 +7,3
Cement Retail price 202,3 240,8 240,1 -0,2 +18,6
Cement building blocks 234,8 269,3 269,9 +0,2 +14,9
Ceramic and encaustic wall and floor tiles and mosaics 109,6 120,1 120,1 0,0 +9,5
Civil engineering plant 161,4 193,0 193,0 0,0 +19,5
Coal, bituminous 229,5 294,1 294,4 +0,1 +28,2
292,2 379,7 380,0 +0,0 +30,0
Anthracite - for local sales Grade A 100,7 100,7 100,7 0,0 0,0
Anthracite - for local sales Grade SP 100,9 100,9 100,9 0,0 0,0
Cobbles, grade A 227,1 389,8 389,8 0,0 +71,6
Cobbles, grade B 168,3 313,4 313,4 0,0 +86,2
Large nuts, grade A 152,3 152,3 152,3 0,0 0,0
Large nuts, grade B 249,5 334,1 334,1 0,0 +33,9
Peas, grade A 336,5 524,8 524,8 0,0 +55,9
Peas, grade B 336,9 566,0 530,7 -6,2 +57,5
Small nuts, grade A 390,4 481,5 481,5 0,0 +23,3
Coal, bituminous - for local sales
Small nuts, grade B 397,9 418,0 418,0 0,0 +5,0
Coast Petrol, 93 octane 334,1 198,1 216,0 +9,0 -35,3
Coated profiled GMS sheeting (roofing) 223,1 250,4 244,5 -2,3 +9,5
Concrete pipes 151,3 168,9 168,9 0,0 +11,6
Concrete roof tiles 204,1 272,6 272,6 0,0 +33,5
Construction machinery (excluding trucks) 123,0 144,3 143,8 -0,3 +16,9
Containers, glass 156,7 168,4 168,4 0,0 +7,4
Copper Piping 360,2 286,0 280,7 -1,8 -22,0
Copper, basic forms 379,8 362,1 360,8 -0,3 -5,0
Coumarone indene resin (imported) 145,7 148,8 148,8 0,0 +2,1
Craft paper 135,3 166,5 166,5 0,0 +23,0
Cylinder lock set 192,2 203,7 203,7 0,0 +5,9
Coast 318,3 253,9 238,3 -6,1 -25,1 Diesel at wholesale level
Witwatersrand 321,4 257,4 242,4 -5,8 -24,5
Coast and Witwatersrand 367,6 271,3 253,5 -6,5 -31,0
Retail Metropolitan and other urban areas 414,4 346,9 333,4 -3,9 -19,5
Diesel oil
Retail Metropolitan areas 326,3 267,7 254,4 -5,0 -22,0
Drainage 125,1 143,5 143,3 -0,1 +14,5
Drop in ceiling tiles-gypsum 149,7 149,7 149,7 0,0 0,0
Drop-in ceiling tiles - masonite 173,9 219,9 219,9 0,0 +26,4
Electrical contracting materials 190,2 219,3 219,1 -0,0 +15,1
Enamel paints 177,7 214,1 214,1 0,0 +20,4
Extruded aluminium distributor level 177,8 175,2 175,2 0,0 -1,4
Extruded aluminium section 222,8 246,5 246,5 0,0 +10,6
Fibre cement roof sheet 197,8 222,3 222,3 0,0 +12,3
Batten board 176,0 193,3 193,3 0,0 +9,8
Ceiling insulation 141,7 150,9 150,9 0,0 +6,4
Fibrous insulation
Mattresses 182,0 200,5 200,5 0,0 +10,1

Statistics South Africa 17 P0142.1
Producer Price Index, March 2009
indices % change between
Type of materials Mar 2008 Feb 2009 Mar 2009 Feb 2009 and
Mar 2009
Mar 2008 and
Mar 2009
Preformed pipe sections 162,8 144,9 144,9 0,0 -10,9
Flush doors 260,6 260,6 260,6 0,0 0,0
205,6 260,0 260,0 0,0 +26,4 Foam insulation materials
Polyurethane 205,6 260,0 260,0 0,0 +26,4
Glass for the building industry cut to size 214,5 203,5 203,5 0,0 -5,1
Glass, for building industry 103,9 135,1 135,1 0,0 +30,0
Gypsum board 170,3 174,5 174,5 0,0 +2,4
Hinges 155,4 201,6 201,6 0,0 +29,7
Imported Meranti 116,5 112,8 112,8 0,0 -3,1
Insulator, porcelain 159,3 178,0 178,0 0,0 +11,7
Ironmongery 145,0 168,5 168,7 +0,1 +16,3
Joint Sealants 152,1 164,3 202,2 +23,0 +32,9
Leather, bovine hide 135,8 179,0 179,0 0,0 +31,8
Lever locks 176,9 190,8 190,8 0,0 +7,8
Mining machinery 140,0 167,2 167,2 0,0 +19,4
Modified Bitumen sheeting 172,3 212,0 225,2 +6,2 +30,7
Natural stone, cut and sawn 127,7 153,1 153,1 0,0 +19,8
Ordinary and extended cement 239,0 289,7 292,2 +0,8 +22,2
PVC Pipes 147,7 145,6 145,6 0,0 -1,4
Paints 176,4 205,8 205,3 -0,2 +16,3
Paper, newsprint 165,4 239,5 239,5 0,0 +44,8
Partitioning materials 203,4 218,3 218,3 0,0 +7,3
Petro-chemical building materials 180,1 216,6 221,0 +2,0 +22,7
Plastic bottles 169,2 255,3 255,3 0,0 +50,8
Plastic, bulk forms 180,3 195,2 195,2 0,0 +8,2
Plate, mild steel 223,1 250,4 244,5 -2,3 +9,5
Plumbing 151,1 167,4 166,7 -0,4 +10,3
Polybutadiene 210,7 347,3 347,3 0,0 +64,8
Processing oil 169,2 153,4 153,4 0,0 -9,3
Profiled aluminium roofing 196,3 193,8 193,8 0,0 -1,2
Profiled aluminium roofing - distributor level 150,1 176,3 176,3 0,0 +17,4
Reinforcing steel 291,0 292,6 286,5 -2,0 -1,5
Resilient floor coverings 183,2 219,2 217,3 -0,8 +18,6
136,1 191,1 191,1 0,0 +40,4
Rubber crude Synthetic 171,9 244,4 244,4 0,0 +42,1
Rubber crude
Rubber crude Synthetic Local 171,9 244,4 244,4 0,0 +42,1
Carbon black - N660 217,9 293,2 293,2 0,0 +34,5
Carbon black - N774 197,5 262,5 262,5 0,0 +32,9
Rubber industry's indices
Natural rubber imported 263,1 239,7 213,5 -10,9 -18,8
SA Pine, kiln dried 237,8 264,7 264,7 0,0 +11,3
Sand 146,5 146,9 146,0 -0,6 -0,3
Self-Adhesive sheeting 146,9 149,5 201,6 +34,8 +37,2
Sementitious paints 186,8 209,2 209,2 0,0 +11,9
Sheet, galvanized 223,1 256,5 250,4 -2,3 +12,2
Sheet, uncoated 231,2 271,9 249,7 -8,1 +8,0
Small steel sections 113,4 174,3 174,3 0,0 +53,7
Stainless steel products, flat rolled 200,4 161,8 161,8 0,0 -19,2
Steel tubes, pipes and fittings 120,3 117,3 117,3 0,0 -2,4
Structural steel products 224,3 314,4 314,4 0,0 +40,1
Structural steel, unworked 235,8 333,0 308,9 -7,2 +31,0
Sulphuric acid 190,6 190,6 207,6 +8,9 +8,9
1502 210,0 322,6 322,6 0,0 +53,6 Synthetic rubber
1712 200,2 299,8 299,8 0,0 +49,7
Tar 216,2 195,8 210,4 +7,4 -2,6
Tile adhesives 189,7 219,0 219,0 0,0 +15,4
Tinplate 162,0 179,8 179,8 0,0 +10,9
Transformer oil 244,3 271,5 272,2 +0,2 +11,4
Trucks 141,4 157,9 157,9 0,0 +11,6
Trucks and buses 137,4 152,8 152,8 0,0 +11,2
Tyres and tubes 192,1 235,1 235,7 +0,2 +22,6
Vinyl sheeting flooring 164,8 177,2 177,2 0,0 +7,5
Vinyl tiles flooring 170,4 196,3 196,3 0,0 +15,1
Wash and basin 137,0 139,8 139,8 0,0 +2,0
Water-closet system (WC`s) 137,2 148,5 148,5 0,0 +8,2
Waterproofing 171,1 203,5 203,6 +0,0 +18,9

Statistics South Africa 18 P0142.1
Producer Price Index, March 2009
indices % change between
Type of materials Mar 2008 Feb 2009 Mar 2009 Feb 2009 and
Mar 2009
Mar 2008 and
Mar 2009
White glazed ceramic tiles 192,2 216,2 216,2 0,0 +12,4
Witwatersrand Petrol, 93 octane 334,1 198,1 216,0 +9,0 -35,3
Wood products, excluding mine wood 172,2 190,7 190,7 0,0 +10,7
Wool, auction prices, 18 types 259,5 180,9 183,4 +1,3 -29,3
Woven needle punch carpeting 168,6 206,5 231,7 +12,2 +37,4

Statistics South Africa 19 P0142.1
Producer Price Index, March 2009
NOTES
Forthcoming issues
Issue April 2009 May 2009 June 2009 July 2009 August 2009 September 2009 October 2009
Expected date of publication 28 May 2009 25 June 2009 30 July 2009 27 August 2008 23 September 2009 29 October 2009 26 November 2009
Purpose of the survey
The surveys of prices of commodities in domestic output (including exports), imported commodities, and exported commodities are monthly surveys covering samples of manufacturers, importers and exporters in the South African economy. The results of the survey are used to compile the Producer Price Index (PPI) which indicates changes in Producer prices of locally produced commodities (including exports), imports and exports. These statistics are used by the private sector for contract price adjustments, and as a deflator in the compilation of national accounts.
Rebasing
The base year of the Producer Price Index (PPI) is still 2000 = 100. For historical rebasing see the statistical release P0142.4.
Special Data Dissemination Standard (SDDS) of the International Monetary Fund (IMF)
South Africa’s data dissemination practices are assessed against the IMF’s Special Data Dissemination Standard (SDDS). A detailed description of the SDDS can be found on the IMF’s Dissemination Standards Bulletin Board on the internet at http://dsbb.imf.org. The SDDS prescribes two to four monitorable elements or good practice that can be observed, or monitored, by users of statistics. These include coverage, periodicity and timeliness, and access to a scheduled release calendar. The SDDS in essence sets standards for the disclosure and transparency of statistics. South Africa subscribed to the SDDS in 2 August 1996 and posted its metadata as of 27 September 1996. South Africa has met the SDDS specifications for the coverage, periodicity and timeliness of the data, and for the dissemination of advanced release calendars since 18 September 2000. Stats SA is responsible for compiling and disseminating data on the producer price index, national accounts, government accounts, industry–based statistics, social statistics, the producer price index, consumer price index, labour market and population statistics.
Reports on Observance of Standards and Codes (ROSC) of the International Monetary Fund (IMF)
The IMF has worked on producing ROSC as a step to strengthen the international financial system. The objectives of ROSC include the promotion of increased transparency, and the implementation of internationally accepted standards and codes. The data dissemination module of the ROSC provides a summary of South Africa’s practices on the coverage, periodicity and timeliness of the data categories specified in the IMF’s SDDS, and on the practices on the provision of advance release calendars for the data. The ROSC is complemented by an assessment of the quality of the Producer Price Index, using the Data Quality Assessment Framework (DQAF) as developed by the IMF’s Statistics Department. The DQAF assess data quality in terms of - ♦ Prerequisites of quality; ♦ Integrity; ♦ Methodological soundness; ♦ Accuracy and reliability; ♦ Serviceability; and ♦ Accessibility For South Africa’s compliance and performance on the quality of data see http://www.imf.org/external/np/rosc/rosc.asp.

Statistics South Africa 20 P0142.1
Producer Price Index, March 2009
Methodological notes
Stats SA released a new re-weighted PPI in January 2008 using a revised basket of indicator products.
The new basket of indicator products for locally produced commodities, import and export commodities was compiled through use of several information sources. The information sources used to select relevant indicator products in the different industries are indicated in table A. Table A – Information sources used to select products in different producer industries Main products and industries Sources Locally produced items
Agriculture Stats SA, Census of Agriculture, 2005 Fishing Fishing Industry Handbook, 2005 Forestry Commercial Timber Resources and
Roundwood Processing in South Africa, 2005
Mining and quarrying Department of Minerals and Energy Manufacturing Stats SA, Large Sample Survey, 2005 Electricity Stats SA, Department of Minerals and Energy Gas Stats SA, Economic Activity Survey, 2005 Water Department of Water Affairs and Forestry Imported items South African Revenue Services Exported items South African Revenue Services
Statistics South Africa 21 P0142.1
Producer Price Index, March 2009
The products were classified according to the relevant Central Product Classification (CPC) and at industry level were classified using Standard Industrial Classification (SIC) subgroups. At industry level, value added was used to determine industry weights. At product level, the products in each subgroup were sorted according to their value of sales. The products contributing to the top 80% of the sales in each subgroup were selected as indicator products. These are the products for which prices will be monitored periodically by Stats SA.
The questionnaire(s) for each subgroup, which are used to collect the relevant price
information from respondents, were adjusted to include the newly selected indicator products. Although the products on each questionnaire differ from the other questionnaires, their layout is identical.
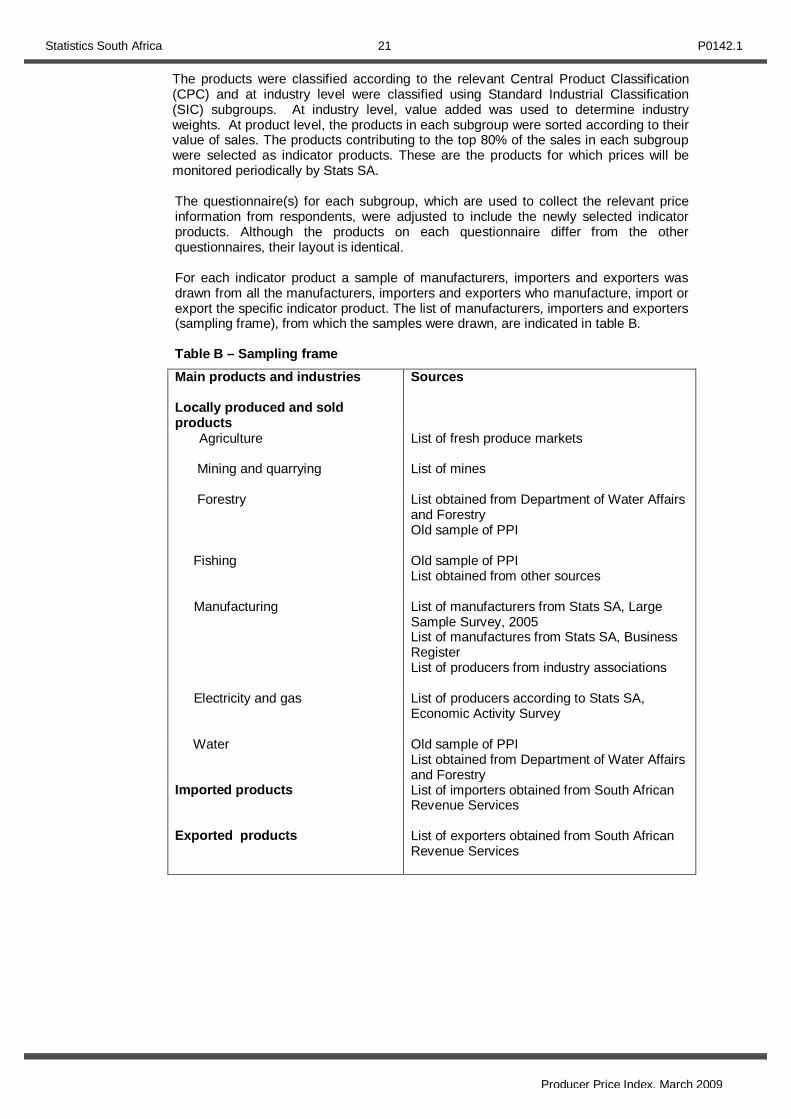
For each indicator product a sample of manufacturers, importers and exporters was drawn from all the manufacturers, importers and exporters who manufacture, import or export the specific indicator product. The list of manufacturers, importers and exporters (sampling frame), from which the samples were drawn, are indicated in table B.
Table B – Sampling frame
Main products and industries
Sources
Locally produced and sold products
Agriculture List of fresh produce markets
Mining and quarrying List of mines
Forestry List obtained from Department of Water Affairs and Forestry Old sample of PPI
Fishing Old sample of PPI List obtained from other sources
Manufacturing List of manufacturers from Stats SA, Large Sample Survey, 2005 List of manufactures from Stats SA, Business Register List of producers from industry associations
Electricity and gas List of producers according to Stats SA, Economic Activity Survey
Water
Old sample of PPI List obtained from Department of Water Affairs and Forestry
Imported products
List of importers obtained from South African Revenue Services
Exported products List of exporters obtained from South African Revenue Services
Statistics South Africa 22 P0142.1
Producer Price Index, March 2009
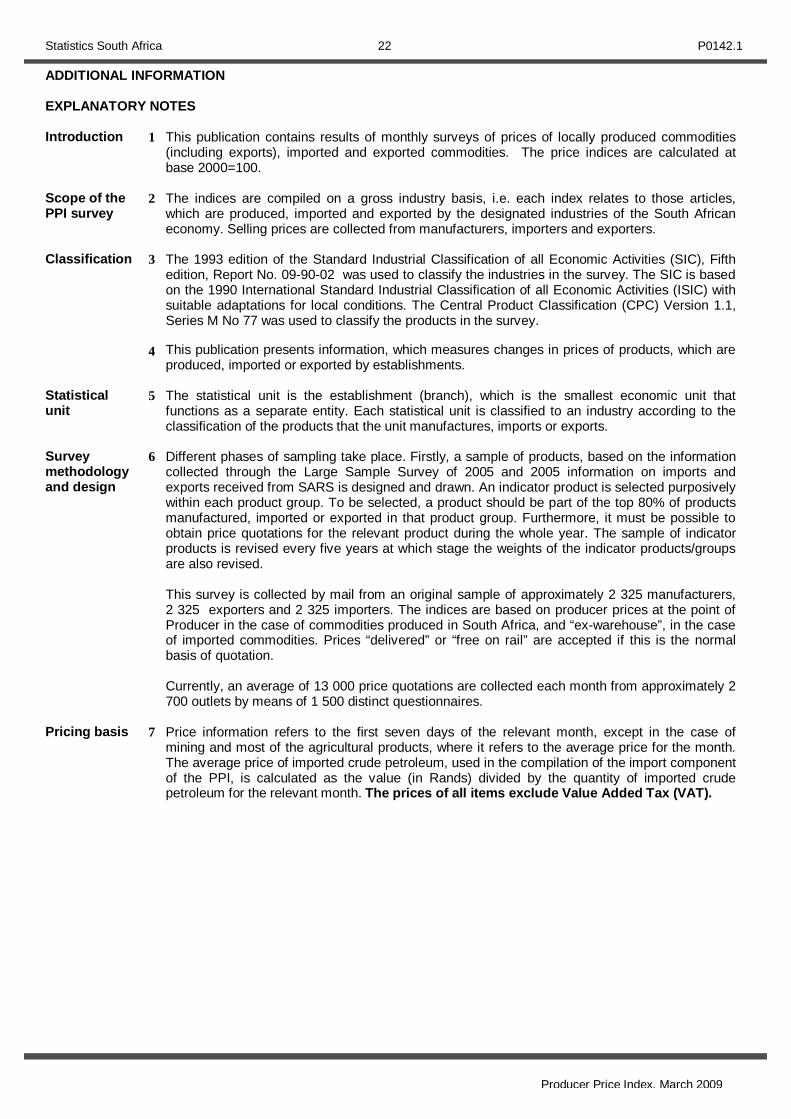
ADDITIONAL INFORMATION EXPLANATORY NOTES Introduction 1 This publication contains results of monthly surveys of prices of locally produced commodities
(including exports), imported and exported commodities. The price indices are calculated at base 2000=100.
Scope of the PPI survey
2 The indices are compiled on a gross industry basis, i.e. each index relates to those articles, which are produced, imported and exported by the designated industries of the South African economy. Selling prices are collected from manufacturers, importers and exporters.
Classification 3 4
The 1993 edition of the Standard Industrial Classification of all Economic Activities (SIC), Fifth edition, Report No. 09-90-02 was used to classify the industries in the survey. The SIC is based on the 1990 International Standard Industrial Classification of all Economic Activities (ISIC) with suitable adaptations for local conditions. The Central Product Classification (CPC) Version 1.1, Series M No 77 was used to classify the products in the survey. This publication presents information, which measures changes in prices of products, which are produced, imported or exported by establishments.
Statistical unit
5 The statistical unit is the establishment (branch), which is the smallest economic unit that functions as a separate entity. Each statistical unit is classified to an industry according to the classification of the products that the unit manufactures, imports or exports.
Survey methodology and design
6 Different phases of sampling take place. Firstly, a sample of products, based on the information collected through the Large Sample Survey of 2005 and 2005 information on imports and exports received from SARS is designed and drawn. An indicator product is selected purposively within each product group. To be selected, a product should be part of the top 80% of products manufactured, imported or exported in that product group. Furthermore, it must be possible to obtain price quotations for the relevant product during the whole year. The sample of indicator products is revised every five years at which stage the weights of the indicator products/groups are also revised.
This survey is collected by mail from an original sample of approximately 2 325 manufacturers, 2 325 exporters and 2 325 importers. The indices are based on producer prices at the point of Producer in the case of commodities produced in South Africa, and “ex-warehouse”, in the case of imported commodities. Prices “delivered” or “free on rail” are accepted if this is the normal basis of quotation.
Currently, an average of 13 000 price quotations are collected each month from approximately 2 700 outlets by means of 1 500 distinct questionnaires.
Pricing basis 7 Price information refers to the first seven days of the relevant month, except in the case of mining and most of the agricultural products, where it refers to the average price for the month. The average price of imported crude petroleum, used in the compilation of the import component of the PPI, is calculated as the value (in Rands) divided by the quantity of imported crude petroleum for the relevant month. The prices of all items exclude Value Added Tax (VAT).
Statistics South Africa 23 P0142.1
Producer Price Index, March 2009
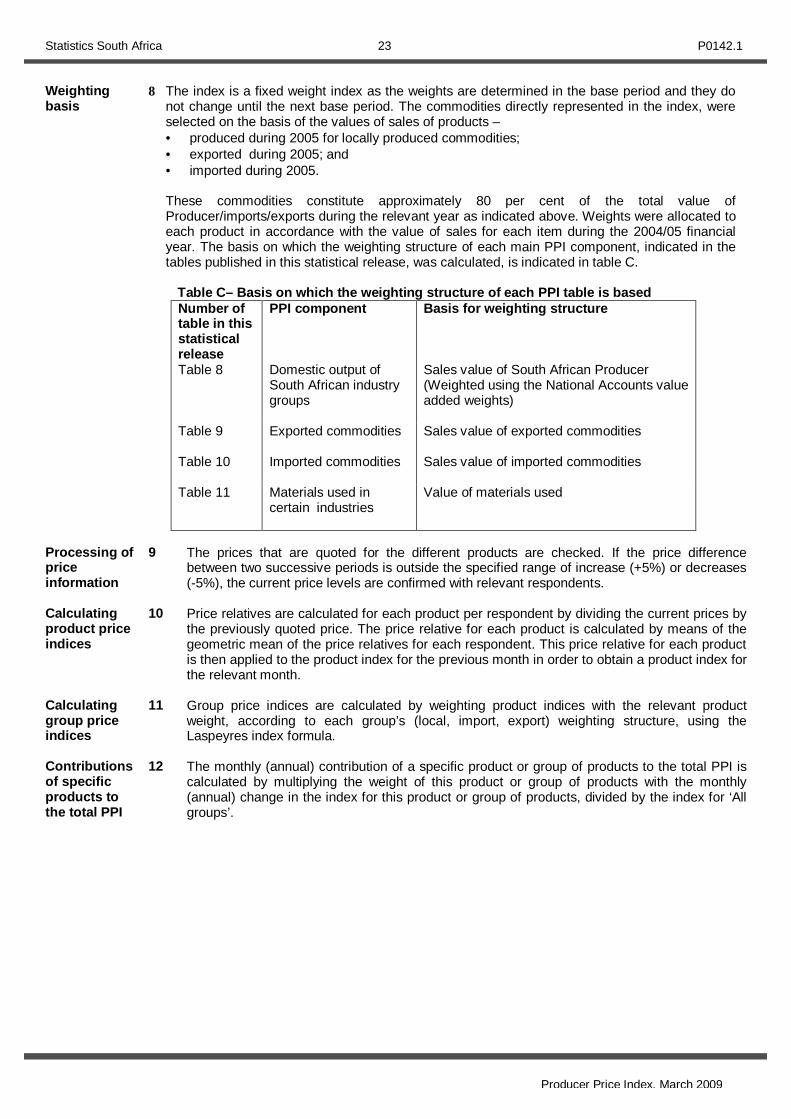
Weighting basis
8 The index is a fixed weight index as the weights are determined in the base period and they do not change until the next base period. The commodities directly represented in the index, were selected on the basis of the values of sales of products – • produced during 2005 for locally produced commodities; • exported during 2005; and • imported during 2005. These commodities constitute approximately 80 per cent of the total value of Producer/imports/exports during the relevant year as indicated above. Weights were allocated to each product in accordance with the value of sales for each item during the 2004/05 financial year. The basis on which the weighting structure of each main PPI component, indicated in the tables published in this statistical release, was calculated, is indicated in table C.
Table C– Basis on which the weighting structure of each PPI table is based Number of table in this statistical release
PPI component
Basis for weighting structure
Table 8
Domestic output of South African industry groups
Sales value of South African Producer (Weighted using the National Accounts value added weights)
Table 9
Exported commodities Sales value of exported commodities
Table 10 Imported commodities Sales value of imported commodities
Table 11 Materials used in certain industries
Value of materials used
Processing of price information
9 The prices that are quoted for the different products are checked. If the price difference between two successive periods is outside the specified range of increase (+5%) or decreases (-5%), the current price levels are confirmed with relevant respondents.
Calculating product price indices
10 Price relatives are calculated for each product per respondent by dividing the current prices by the previously quoted price. The price relative for each product is calculated by means of the geometric mean of the price relatives for each respondent. This price relative for each product is then applied to the product index for the previous month in order to obtain a product index for the relevant month.
Calculating group price indices
11 Group price indices are calculated by weighting product indices with the relevant product weight, according to each group’s (local, import, export) weighting structure, using the Laspeyres index formula.
Contributions of specific products to the total PPI
12 The monthly (annual) contribution of a specific product or group of products to the total PPI is calculated by multiplying the weight of this product or group of products with the monthly (annual) change in the index for this product or group of products, divided by the index for ‘All groups’.

Statistics South Africa 24 P0142.1
Producer Price Index, March 2009
Price indices for diesel
13 The price index for diesel (Coast and Witwatersrand) is based on the refinery prices of diesel. The retail price index for diesel (metropolitan and other urban areas) is based on retail prices obtained from a sample of 84 retail outlets throughout the country. The diesel indices for the different areas are weighted according to the diesel volume distribution as obtained from the South African Petroleum Industry Association (SAPIA). The retail price index for diesel (metropolitan areas) is based on retail prices obtained from a sample of only 48 outlets in the historical metropolitan areas of the CPI. The diesel indices for the different areas are weighted according to the diesel volume distribution in the relevant areas as obtained from the South African Petroleum Industry Association (SAPIA). The price index for diesel at wholesale level (coast and Witwatersrand) is based on the regulated wholesale prices of diesel.
Reliability of estimates
14 Inaccuracies may occur because of imperfections in reporting by establishment (branch) and errors made in collection and processing of the data. Inaccuracies of this kind are referred to as non-sampling errors. Every effort is made to reduce non-sampling errors to a minimum by careful designing the questionnaires, editing data and efficient operating procedures.
Related publications
15 Users may also wish to refer to the following publications, which are available from Stats SA - • Bulletin of Statistics; and • SA Statistics.
Unpublished statistics
16 In some cases, Stats SA can also make available information, which is not published. This information can be made available in one or more of the following ways: computer printout, diskette or CD. Generally a fee is levied for providing unpublished information.
Symbols and abbreviations
17 Stats SA Statistics South Africa .. not available - nil or not applicable * revised since previous publication avg average
Statistics South Africa 25 P0142.1
Producer Price Index, March 2009
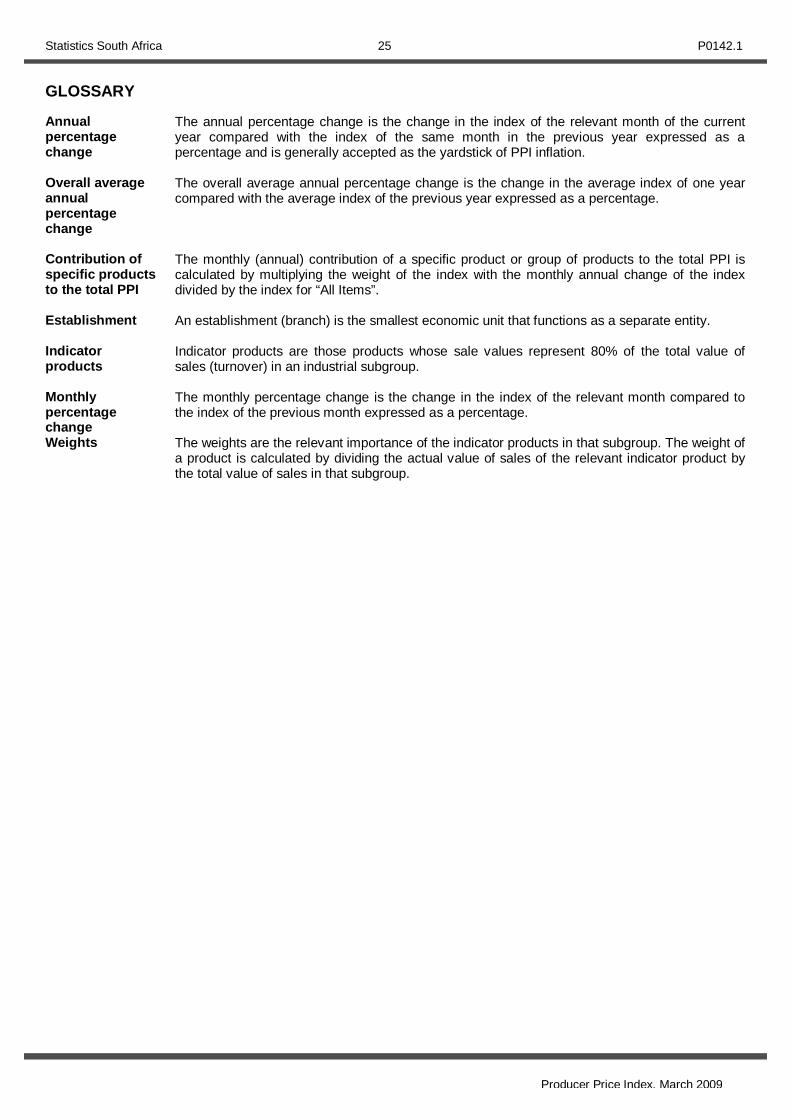
GLOSSARY Annual percentage change
The annual percentage change is the change in the index of the relevant month of the current year compared with the index of the same month in the previous year expressed as a percentage and is generally accepted as the yardstick of PPI inflation.
Overall average annual percentage change
The overall average annual percentage change is the change in the average index of one year compared with the average index of the previous year expressed as a percentage.
Contribution of specific products to the total PPI
The monthly (annual) contribution of a specific product or group of products to the total PPI is calculated by multiplying the weight of the index with the monthly annual change of the index divided by the index for “All Items”.
Establishment An establishment (branch) is the smallest economic unit that functions as a separate entity.
Indicator products
Indicator products are those products whose sale values represent 80% of the total value of sales (turnover) in an industrial subgroup.
Monthly percentage change
The monthly percentage change is the change in the index of the relevant month compared to the index of the previous month expressed as a percentage.
Weights The weights are the relevant importance of the indicator products in that subgroup. The weight of a product is calculated by dividing the actual value of sales of the relevant indicator product by the total value of sales in that subgroup.

Statistics South Africa 26 P0142.1
Producer Price Index, March 2009
FOR MORE INFORMATION Stats SA publishes approximately 300 different releases each year. It is not economically viable to produce them in more than one of South Africa’s eleven official languages. Since the releases are used extensively, not only locally but also by international economic and social-scientific communities, Stats SA releases are published in English only. Stats SA has copyright on this publication. Users may apply the information as they wish, provided that they acknowledge Stats SA as the source of the basic data wherever they process, apply, utilise, publish or distribute the data; and also that they specify that the relevant application and analysis (where applicable) result from their own processing of data. Advance release calendar An advance release calendar is disseminated on www.statssa.gov.za Stats SA products A complete set of Stats SA publications is available at the Stats SA Library and the following libraries - National Library of South Africa, Pretoria Division National Library of South Africa, Cape Town Division Natal Society Library, Pietermaritzburg Library of Parliament, Cape Town Bloemfontein Public Library Johannesburg Public Library Eastern Cape Library Services, King William’s Town Central Regional Library, Polokwane Central Reference Library, Nelspruit Central Reference Collection, Kimberley Central Reference Library, Mmabatho
Stats SA also provides a subscription service. Electronic services A large range of data are available via on-line services, diskette and computer printouts. For more details about our electronic data services, contact (012) 310 8600/8390/8351/ 4892/8496/8095. You can visit us on the Internet at: www.statssa.gov.za Enquiries Technical enquiries: Marais Kleu (012) 310 8170 For media enquiries contact: Mr T Oosterwyk, Manager, at (012) 310-8130 or 082-908-9104 Telephone number: (012) 310 6917/8137/8377 (survey area) (012) 310 8600/8390/8351/4892/8496/8095(user information services) (012) 310 8161 (orders) (012) 310 8490 (library) Fax number: (012) 321 3220/6 email: [email protected] (technical enquiries) [email protected] (user information services) [email protected] (orders) Postal address: Private Bag X 44, Pretoria, 0001
Produced by Stats SA