Embed Size (px)
Citation preview

173
UNIT NAMEPROJECT
PROJECTPROJECTPROJECTPROJECTPROJECT
AIM
To investigate whether the energy of a simple pendulum is conserved.
APPARATUS AND MATERIAL REQUIRED
A tall laboratory clamp stand with clamps, a split cork, a brick (orany heavy metallic weight) to be used as bob, strong cotton thread/string (about 1.5 m to 2.0 m), stop-watch, ticker timer, paper tape,balance, wooden block, cellotape, metre scale and graph paper.
PRINCIPLE
Energy can neither be created nor destroyed, though it can betransformed from one form to another, and the sum of all formsof energies in theuniverse remainsconstant (Law ofconservation ofenergy). In anyisolated mechanicalsystem with practicallyn e g l i g i b l e / n odissipation of energy toovercome viscousdrag/air resistance /friction, (as in case ofa pendulum), thesum of the kinetic andpotential energiesremains constant.For small angularamplitude (θ ≤ 15°), the pendulum executes simple harmonic motion(SHM) with insignificant damping, i.e., loss of energy. Hence, an oscillatingsimple pendulum provides a convenient arrangement to investigate/validate the law of conservation of energy for a mechanical system.
11111
Fig. P 1.1: An oscillating pendulum
(b)
O
xF Eh
D
L h–
A
x
PROJECTS
© NCERT
not to
be re
publi
shed

174
LABORATORY MANUALLABORATORY MANUAL
The oscillations of a simple pendulum of effective length L with meanposition at point A and extreme positions at points B and C, are shownin Fig. P 1.1. In the extreme positions, i.e., at B and C the oscillatingbob is raised to a certain height h ( = AD) above the mean positionwhere it possesses maximum potential energy but minimum kineticenergy. In the mean position, at A, it possesses maximum kineticenergy and minimum potential energy. At any intermediate positioni.e., at E and F the bob will possess energy in the form of both kineticand potential energies. The effective length L ( = l + r ) of the pendulumis taken from the point of suspension O to the centre of gravity of thebob (Fig P 1.1; also refer Experiment E 6). For small angular amplitudes(θ ) (about 8° to 10°) the arc length EA = (FA) is about the same aslinear distance ED = (FD) = x, the points E and F are symmetricallyabove point D.
From the geometry of the Fig. P 1.1, it follows
DF. DE = OD. DA
x × x = (L – h ) h
For small values of x and h (and x << L and h << x)
=2x
hL
Then the potential energy of the bob (brick) of mass m at point E (or F)
= mgh = 2mgx
L
The kinetic energy E possessed by the bob moving with velocity v at
point E (or F) is = 2mv
12
Then total energy of the bob is given by
=mg
E mv + xL
2 212
Using this relation, now investigate whether the total energy E of theoscillating simple pendulum remains constant.
DEVICE FOR MEASURING SHORT TIME INTERVALS IN THELABORATORY: TICKER TIMER
Ticker-timer is a device used for the measurement of short time-intervals in the laboratory. It can measure short time intervals ofabout 0.02s to much higher degree of accuracy as compared to thatof a stop-watch (with least count of 0.1s). Ticker-timers are availablein different designs.
(P 1.1)
(P 1.2)
(P 1.3)
(P 1.4)
© NCERT
not to
be re
publi
shed

175
UNIT NAMEPROJECT
A simple type of ticker-timer,as s hown in Fig.P1.2,consists of a steel/metallicstrip T which can be madeto vibrate at a knownfrequency with the help of anelectromagnet. The pointedhammer of the vibratingsteel strip, T strikes a smallcarbon paper disc C underwhich a paper tape, ispulled by the oscillatingobject. The dot marks aremarked on the paper tapeby the pointed hammerwhen the strip vibrates.
The dot marks are obtained on the paper tape at regular (or equal)intervals of time. Each dot mark refers to a complete vibration of thevibrating steel strip. The time interval between the two consecutive dotmarks can be taken as a unit of time for a tick. The time period of thevibrating strip is obtained from its given (known) frequency of vibration.When it is run on 6V step-down ac supply, its frequency is the same asthat of ac mains (50 Hz, in India).
In this way, the measured time interval for one tick (between the twoconsecutive dot marks) can be converted into the basic unit, second,for time measurement. Thus, the ticker-timer can be used to measureaccurately time interval of the order of 0.02 s in the laboratory.
PROCEDURE
1. Find the mass of the pendulum bob.
2. Determine r and l by metre scale.The length of the pendulumL = l + r.
3. Take the ticker-timer and place it atabout the same level as the centre ofthe bob as shown in Fig. P 1.3. Fixthe ticker-timer on a wooden blockwith tape, to ensure that its positionis not disturbed when tape is pulledthrough it.
4. Attach the tip of the paper tape ofthe ticker-timer to the bob with thehelp of cellotape such that it ishorizontal and lies in the plane inwhich centre of gravity of the bob liesin its rest position.
Fig. P1.2: Ticker-timer
Fig. P 1.3: Experimental setup for studyingconservation of energy
1
© NCERT
not to
be re
publi
shed

176
LABORATORY MANUALLABORATORY MANUAL
5. Pull the bob towards the timer such that its angulardisplacement (θ < 10o ) is about one tenth of its length from thevertical position. Take care that the ticker tape is sufficientlylight and is so adjusted that it easily moves by the pull of bobas soon as it begins to move.
6. Start the ticker-timer carefully and let the bob oscillate. Whilethe bob moves towards the other side, it pulls the paper tapethrough the ticker-timer. Ticker timer, thus, records the positionsof the bob at successive time intervals.
7. Switch off the ticker-timer when the brick reaches the otherextreme end. Take out the paper tape and examine it.Extreme dot marks on the record of the tape represent theextreme positions B and C of the pendulum. The centrepoint A of this half oscillation is the centre of the twoextreme dot marks, and may be marked by the half metrescale, as in Fig. P1.4.
AB C
Extreme Centre
r
Extreme
Fig. P 1.4: Position of the oscillating bob marked on paper tape
8. Measure the displacements of the bob corresponding toeach dot (about 10 to 12) on either sides from the centremarked A as x
1, x
2, x
3, ... Find the time t
1, t
2, t
3, ... when
each selected dot was made by counting the number of dotsfrom the central point A, representing the mean position ofthe pendulum. If central point A is not coinciding with adot marked by the ticker -timer, appropriate fraction oftime-period of ticker-timer has to be added for findingcorrect t1, t2, t3, ...
9. Record observations in the tabular form in SI units and propersignificant figures.
10. Calculate the corresponding velocity for each selected positionof the dot as v
i (= Δx
i / Δt
i ). For this take one earlier and one
later dot. The distance between these two dots is Δxi and Δti istime to cover this distance. Then find magnitude of
kinetic energy ΔΔ
⎡ ⎤⎛ ⎞⎢ ⎥⎜ ⎟⎝ ⎠⎢ ⎥⎣ ⎦
i
i
xmmv =
t
2
212 2
and potential energy
© NCERT
not to
be re
publi
shed

177
UNIT NAMEPROJECT
mghi [= mg (xi2/L) ] of the pendulum bob. Find the sum of kinetic
and potential energies in each case. Express the result in SIunits and proper significant figures.
11. Plot a graph between the displacement (xi ) of the pendulum bob(distance of dots from the central dot) against the time.
12. Find the velocity (v) from the slope of the graph at five or sixpoints on the left and also on the right of the mean position.Calculate the corresponding kinetic energy (mv2/2 ) for eachposition of the points on the graph.
13. Plot another graph between kinetic energy and the position (x) ofthe bob. Find out the position of the point for which kinetic energyis minimum.
14. Calculate also the potential energy, PE ixmg
L
⎛ ⎞=⎜ ⎟⎝ ⎠
2
, at the
corresponding points at which you have calculated the kineticenergy. Plot the graph of potential energy (PE) against thedisplacement position (x) on the same graph on which you haveplotted kinetic energy versus position graph.
15. Find the total mechanical energy E as the sum of kinetic energyand potential energy of the pendulum at each of the displacementpositions x. Express the result in SI units with proper significantfigures. Plot also a graph between the total mechanical energy Eagainst displacement position (x) of the pendulum on the samegraph on which you have plotted the graphs in Steps 13 and 14,i.e., for K.E. and P.E.
OBSERVATIONSMeasuring the mass of bob and effective length of simplependulum
(a) Effective length of the simple pendulum
Least count of the metre scale = ... mm = ... cm
Length of the top of the brick from the point of suspension, l = ... cm = ... m
Diameter of the bob, 2r = ... cm
Effective length of the simple pendulum L = ( l + r ) = ... cm = ... m
(b) Mass of the ... g
Time period (T) of ticker-timer = ... s
Fraction of T to be added for finding corrected Ti on left = ...
Fraction of T to be added for finding corrected Ti on right = ...
1
© NCERT
not to
be re
publi
shed

178
LABORATORY MANUALLABORATORY MANUAL
Table P1.1: Measuring the displacement and time usingticker-timer and the recorded tape
(c) Plotting a graph between displacement and time
Take time t along x-axis and displacement x along y-axis, using theobserved values from Table P1.1. Choose suitable scales on these axesto represent t and x. Plot a graph between t and x as shown in Fig. P1.5.What is the shape of x-t graph?
CALCULATION
(i) Find out from the graph (Fig. P1.5), thevelocity of bob at five or six differentpoints on the either side of the meanposition O of the graph.
Compute the values of kinetic energy,using Eq. (P1.3), corresponding toeach value of velocity obtained fromthe graph. Record these values inTable P1.2.
(ii) Plot a graph by taking displacement(distance) x along x-axis and kineticenergy (K.E.) along y-axis using thevalues from Table P1.2 as shown inFig. P1.6.
(iii) Compute the values of potential energyusing Eq. (P1.2), for each value ofdisplacement in Step (ii) above.
S. No. S. No. of doton tape (i)
Displacement(Distance of
dot fromcentre, xi)
(cm)
Number ofvibrations ofticker-timer
betweencentral and
ith point
T1 (s) Velocity v
(m s–1 )
1
2
3
2nd right
4th right
6th right
------
2nd left
4th left
6th left
------
Fig. P1.5: Graph between displacement andtime of the oscillating bob
(s)t
sine curve
d(c
m)
Variation of vsd t© N
CERT
not to
be re
publi
shed

179
UNIT NAMEPROJECT
Table P 1.2: Finding potential, kinetic and total energy of theoscillating bob
(iv) Plot a graph by takingdisplacement (distance) xalong x-axis and potentialenergy (P.E.) along y-axis onthe same graph (Fig. P1.6).
(v) Compute the total energyE
T as the sum of the kinetic
energy and potentialenergy at each of thedisplacement positions, x.Plot a graph by taking thedisplacement along x-axisand total energy E
T along
y-axis on the same graphFig. P1.6).
RESULTThe total energy, as the sum of kinetic and potential energies, of thebob of the simple pendulum is conserved (remains the same) at all thepoints along its path.
DISCUSSION
1. Refer to points 3 to 5 under discussion given in Experiment E 6on page 65.
2. Eq. P1.1 that expresses the relation between x, h and L for a simplependulum, holds true under the conditions h << x << L for smallangular amplitudes (θ < 10°) of the pendulum.
3. Linear displacement x of the bob, about (1/8)th to (1/10)th ofthe effective length of the pendulum corresponds to angulardisplacement (θ ) of about 8° to 10° for small angular amplitudes,
x
En
ergy
Total energy
P.E
K.E
Displacement, x
ET
y
O
Fig. P 1.6: Graph between displacement andenergy of the oscillating bob
1
2
3
4
S.No.
Total Energy =Potential Energy+ Kinetic Energy(J)
Velocity, v(ms–1)
Potential Energy,
mg x
L
2
(J)
Kinetic Energy,
mv212 (J)
1
© NCERT
not to
be re
publi
shed

180
LABORATORY MANUALLABORATORY MANUAL
the displacement (distance) of a dot mark on the paper tape fromthe central point/position truly represent correspondingdisplacement of the pendulum bob from its central (mean)position.
4. The shape of the graphs shown in Fig. P1.5 and Fig. P1.6correspond to ideal conditions in which no energy is lost due tofriction and air drag. The graph drawn on the basis of observeddata may differ due to error in data collection and friction.
SELF ASSESSMENT
1. Identify the shape of displacement time graph, you have drawnfor the oscillating simple pendulum. Interpret the graph.
2. Identify the shape of kinetic energy-displacement and potentialenergy-displacement graphs, you have drawn for the simplependulum.
Study the change in potential energy and kinetic energy at eachof the displacement positions. Interpret these graphs and see howthese compare.
3. What is the shape of the graph between the total (mechanical)energy and displacement you have drawn for the simplependulum? Interpret the graph to show what it reveals?
© NCERT
not to
be re
publi
shed

181
UNIT NAMEPROJECT
PROJECTPROJECTPROJECTPROJECTPROJECT 22222
AIM
To determine the radius of gyration about the centre of mass of ametre scale used as a bar pendulum.
APPARATUS AND MATERIAL REQUIRED
A metre scale with holes at regular intervals, knife edge shaped axle,a rigid support, two glass plates (to be used for suspension plane),spring balance, spirit level, telescope fixed on a stand, stop-watchand graph paper.
PRINCIPLE
A rigid body oscillating in a vertical plane about a horizontal axispassing through it is known as compound pendulum. The point inthe body through which the axis of rotation passes is known as centreof suspension.
The time period of a compound pendulum is given by
IT
mgl= π2
where m is the mass of the rigid body, l is the distance of the point ofsuspension from the centre of gravity, I is the moment of inertia ofthe body about the axis of oscillation and g is the acceleration dueto gravity.
If K is the radius of gyration of the body about an axis through thecentre of gravity, then the moment of inertia about the centre ofsuspension is
I = m (K2 + l2)
2K
m l ll
⎛ ⎞= +⎜ ⎟⎝ ⎠
(P 2.2)
(P 2.1)
© NCERT
not to
be re
publi
shed

182
LABORATORY MANUALLABORATORY MANUAL
Hence
K Kml l l
l lT
mgl g
⎛ ⎞ ⎛ ⎞+ +⎜ ⎟ ⎜ ⎟
⎝ ⎠ ⎝ ⎠= π = π
2 2
2 2
or L
Tg
= π2
where L = (l + K2/l)
Eq. (P 2.4) can be written as
l . L = (l2 + K2) ⇒l2 – l L + K2 = 0
Eq. (P 2.5) is quadratic in l and therefore has two roots, say l1 and
l2 then
l1 + l
2 = L and l
1 l
2 = K 2
or K l l= 1 2
PROCEDURE1. Take a metre scale. Draw a line in the
middle along its length. Drill holes ofabout 1.6 mm diameter on this lineseparated by a distance of 2 cm,starting from one end to the other.
2. Determine the centre of gravityof the scale by balancing it overa wedge.
3. Pass the knife edge shaped axle inthe hole near one of the ends of themetre scale and let it rest on thesuspension base having glass platesat its top.
4. Ensure that the glass plates fixedon the suspension plane behorizontal and in the same level sothat when we suspend the metrescale by placing the knife edge wemay be sure that the scale hangsvertically (Fig. P2.1).
5. Make a reference line, drawn on thepaper strip, near the lower end of thependulum and focus it with atelescope. Adjust the telescope untilits vertical crosswire focuses on thereference line.
(P 2.3)
(P 2.4)
(P 2.5)
Fig. P 2.1: A metre scale oscillating about a pointclose to C.G.
© NCERT
not to
be re
publi
shed

183
UNIT NAMEPROJECT
6. Displace the lower end of the scale horizontally through a smalldistance from its equilibrium position and then release it. Thependulum (metre scale) will begin to oscillate. Take care that theangular amplitude of oscillation is within 5° or 6° and pendulumoscillates in a vertical plane without any jerk.
7. Count zero when the reference mark on oscillating pendulumpasses across the vertical crosswire of telescope and start the stop-watch at that instant (The counting of oscillations could be donevisually, in case a telescope is not available).
8. Continue counting 2, 3, 4,... successively when the reference lineprogressively passes the vertical crosswire from the same side andnote the time for 20 oscillations. Repeat the observations at leastthree times.
9. Measure from the lower end, the distance of the pointof suspension.
10.Repeat Steps 7 and 9 after shifting the knife edge to the successiveholes leaving two holes on either side of the centre of gravity of thependulum. Take length of pendulum on one side of C. G. as positivewhile on the other side as negative. Record your observations intabular form.
OBSERVATIONSTable P. 2.1: Measurement of time period of compound pendulum
HoleNo.
One side of C.G.
Distancefrom C.G.,
l1
(cm)
Other side of C.G.
Time for 20oscillations
t1 t2 t3
Time period
T =t + t + t1 2 3
3
(s)
HoleNo.
Distancefrom C.G.,
l2
(cm)
Time for 20oscillations
t ′1 t′2 t′3
Time period
T =t + t + t′ ′ ′
′ 1 2 3
3
(s)
CALCULATION1. Plot a graph between l and T by taking the l along x-axis
and T along y-axis. The graph will consist of two symmetricalcurves Fig. P 2.2. The point on the x-axis about which thegraph is symmetrical is the centre of gravity of the metrescale pendulum.
2
© NCERT
not to
be re
publi
shed

184
LABORATORY MANUALLABORATORY MANUAL
2. Draw a line parallel to x-axis cutting the graphat points, P, Q, R and S
(a) From the graph, CP= ... cm, CS= ... cm
1
CP +CSl = = ...cm
2
(b) From the graph, CQ = ... cm, CR = ... cm
2
CQ +CRl = = ...cm
2
(c) The radius of gyration K = 1 2l l
x
y
P Q C R S
O
Fig. P 2.2: Graph between distance fromC.G. and time period
RESULTThe radius of gyration about the axis passing through the centre ofmass of the metre scale is found as K = ... cm.
PRECAUTIONS1. Pendulum should be hung vertically and knife edge be kept
horizontal so that the pendulum oscillates in a vertical plane.
2. Note the time by the stop-watch leaving 5 or 6 initial oscillationsso that effect of any irregularities in the oscillations get subsided.
3. Increase the number of observations for a given length ofpendulum if time for 20 oscillations is to be measured withoutusing a telescope.
4. Keep the fans off or else air droughts will shift the position of thescale and its oscillations will not remain in the same plane.
SOURCES OF ERROR1. The metre scale may not have uniform mass distribution.
2. The wedge may not be sharp.
3. The holes drilled may not be colinear or have equally smooth innersurface.
DISCUSSION
1. If a metallic bar is used in place of wooden scale we would havebetter results as its inertia will hold it in position in a better way.
© NCERT
not to
be re
publi
shed

185
UNIT NAMEPROJECT
Moreover a metallic bar of homogeneous material and uniformcross-section can be easily made.
2. To draw smooth symmetrical graphs, we may make use of curvedsurface on the inside of set squares or by suitably bending plastictongue cleaners or broomsticks.
SELF ASSESSMENT
1. How would you establish that the compound pendulum executesSHM?
2. By knowing the radius of gyration of the metre scale about itscentre of mass, determine the moment of inertia of the same scaleabout an axis passing through the centre of mass.
3. Why do we get two L – T plots symmetrical about y-axis?
SUGGESTED ADDITIONAL EXPERIMENTS/ACTIVITIES
1. Increase the angular amplitude slowly and see how your resultchanges.
2. Note the angular amplitude at which the variation in your results isappreciable. How will you explain the changes?
2
© NCERT
not to
be re
publi
shed

186
LABORATORY MANUALLABORATORY MANUAL
Fig.P 3.1: Dots on tape
PROJECTPROJECTPROJECTPROJECTPROJECT33333
AIMTo investigate changes in the velocity of a body under the action of aconstant force and to determine its acceleration.
APPARATUS AND MATERIAL REQUIRED
Ticker-timer, a horizontal table, a bumper (a heavy rectangularblock of wood), a trolley, three G-clamps, long paper tape, a pulley,strong thread, a few bricks, hanger, slotted weights, plug-key anda spring balance.
PRINCIPLE
The acceleration of a moving body is constant when force acting on itis kept constant. The principle and working of a ticker-timer hasalready been discussed in Project P1. Suppose the experimentalarrangment allows you to mark the position of a moving object as adot on the tape of the ticker-timer. The time interval between twosuccessive dots is the same but the dots may not be necessarily equallyspaced. Equally spaced dots would represent uniform motion whileunequally spaced dots would represent non-uniform motion.
For calculation of speed of a given object from the tape, take one of thetapes used in the experiment. Let S1, S2, S3, ..... be the distancesbetween two successive dots, say of ten dots, on the tape measuredfrom point A by a metre scale as shown in the Fig. P 3.1.
The frequency of the vibrator of ticker-timer
= Frequency of the A.C. supply
= 50 Hz.
© NCERT
not to
be re
publi
shed

187
UNIT NAMEPROJECT
The time interval between two successive dots = 150
s
The time taken for covering 10 dots i.e., for displacements S1, S2, S3, ...
= 150 × 10 = 0.2 s
The average speed v1 over the distance 11
S (cm)S
0.2s= = ... cm s–1
The average speed v2 over the distance =
SS 2
2
(cm)0.2s
= ... cm s–1
So, the increase in speed in the time interval of 0.2 s
= 2 1S S0.2s 0.2s
– = ... cm s–1
The average acceleration = ( )S – S
×2 1
0.2 0.2 = ... cm s–2
PROCEDURE
1. Setup the ticker-timer at one end of a long horizontal table andfix the bumper at its other end with the help of G-clamps as shownin Fig. P 3.2.
2. Place the trolley between the timer and the bumper. Attach oneend of a strong thread of suitable length to the trolley and pass itover a frictionless pulley fixed on the bumber. Attach a hanger atthe free end of the thread.
3. Adjust the length of the thread in such a manner that when thetrolley is brought near the timer, the hanger stands at its highestposition near the pulley.
4. Bring the trolley near the ticker-timer and release it, observeits motion.
5. Place one or two small bricks on the trolley if it moves too fast.Adjust the weights on the hanger so that the trolley moves with amoderate speed.
6. Hold the trolley in position near the timer. Check that thetape is passing under the carbon paper disc. Switch theticker-timer on and release the trolley. Ensure that the trolleygains speed till the pan touches the ground, thereafter it isstopped by the bumper.
7. Encircle the mark on the tape which was under the point ofthe vibrator of the timer at the instant when the pan touchesthe ground because there after the force ceases to act on the
3
© NCERT
not to
be re
publi
shed

188
LABORATORY MANUALLABORATORY MANUAL
trolley, label this mark as P. Encircled markP is the limiting position upto which thetrolley was accelerated by constant forcebefore it touched the ground.
Fig. P 3.3: Graph between speed and timeunder a constant force
S.No.
Time interval (inunits of tickinterval) (s)
Distance, s(cm)
Average velocityvav = s/t (cm s–1 )
Time (in midof interval), t
(tickinterval) (s)
1
2
3
0 – 10
10 – 20
20 – 30
S1
S2
S3
...
...
...
5
15
25
8. Remove the part of tape where dots are marked,from the timer.
9. Choose a dot, close to the starting point, mark itas A and take it as the reference point formeasurement of displacements.
10. Divide the entire motion of the trolley in about10 equal intervals of time. To do this, count thetotal number of dots marked on the tape duringthe motion of trolley. From A, mark the positionsas B, C, D etc. at the end of 10 ticks on the paper.
11. Measure the distance AB, BC, CD etc. and record them as shownin Table P 3.1. Compute average speed between different timeintervals (Table P 3.1). This can be taken as instantaneousvelocity at the mid point of the time interval tabulate. Thecomputed values of the average speeds against the mid point ofthe time intervals.
12. The instantaneous speed at the mid point of time intervals wouldbe nearly the same as the average speed during the interval ineach case.
13. Plot a graph showing the values of speed against time whichdepicts the motion of the trolley under a constant force. Find theslope of speed-time graph to calculate the instantaneousaccleration (Fig. P 3.3).
OBSERVATIONS
(a) Mass of the pan ... g.
(b) Mass of the pan + Mass of the weights in the pan = ... g.
(c) Mass of the trolley + mass placed in the trolley = ... g.
Table P 3.1: Instantaneous speed of the body
© NCERT
not to
be re
publi
shed

189
UNIT NAMEPROJECT
Table P 3.2: Acceleration of the body
SUGGESTED ADDITIONAL EXPERIMENTS/ACTIVITIES
1. Study the variation of acceleration for different masses placed onthe trolley for constant force.
2. Study the variation of acceleration for different forces, by changingthe mass placed on the pan.
S.No.
Point chosen Time, t (No. ofticks)
Interval Slope, MLNM
=
accelerationcm/ tick–2
ML (cm/tick)
NM(tick)
RESULT1. The speed of the trolley increases with time as constant force acts
on it.
2. The acceleration of the trolley is found to be ... roughly constantwithin the limitations of the experiment.
PRECAUTIONS
1. Make sure that the ticker-timer and bumper are rigidly fixed.
2. The ticks in the beginning when the trolley just begins to moveand at the time when the force ceases to act, be encircled properlyfor the purpose of measurement of distances and calculation ofvelocity and acceleration.
SELF ASSESSMENT
Is the acceleration calculated equal to ‘g’ ? If not, why? With increasein mass in the pan, does the acceleration approach to accelerationdue to gravity?
3
© NCERT
not to
be re
publi
shed
190
LABORATORY MANUALLABORATORY MANUAL
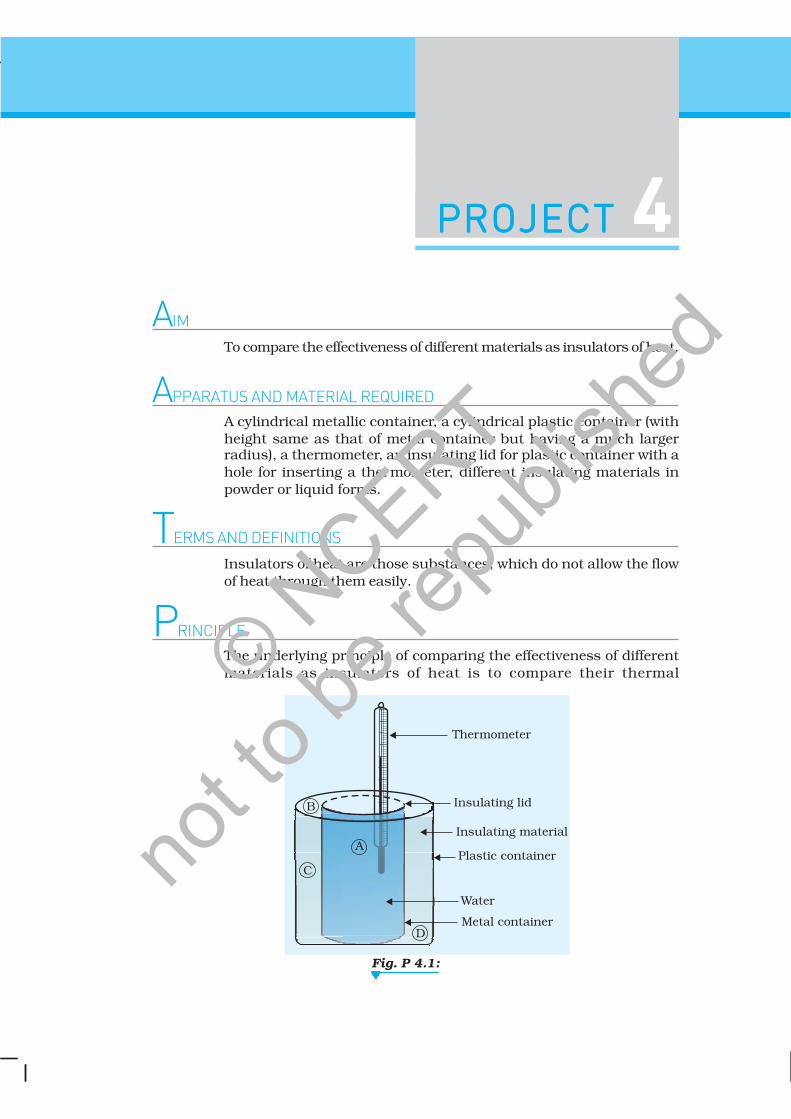
Fig. P 4.1:
PROJECTPROJECTPROJECTPROJECTPROJECT 44444AIM
To compare the effectiveness of different materials as insulators of heat.
APPARATUS AND MATERIAL REQUIREDA cylindrical metallic container, a cylindrical plastic container (withheight same as that of metal container but having a much largerradius), a thermometer, an insulating lid for plastic container with ahole for inserting a thermometer, different insulating materials inpowder or liquid forms.
TERMS AND DEFINITIONS
Insulators of heat are those substances, which do not allow the flowof heat through them easily.
PRINCIPLEThe underlying principle of comparing the effectiveness of differentmaterials as insulators of heat is to compare their thermal
Thermometer
Water
Plastic container
Insulating lid
Metal container
A
D
B
C
Insulating material
© NCERT
not to
be re
publi
shed

191
UNIT NAMEPROJECT
conductivities. A material having a lower thermal conductivity will bemore effective as an insulator.
PROCEDURE
1. Place the metal container A inside the plastic container B leavingequal gap all around it. Fill the gap, between the two containerswith the insulating material you want to study (Fig P4.1).
2. Pour in container A hot water (having temperature nearly 60 °C).
3. Cover both the containers with a non-conducting lid.
4. Fix a thermometer, in a hole provided in the lid, in such a waythat the thermometer bulb is well within the water.
5. Record time for every 5 °C fall in temperature.
6. Repeat the above procedure for different insulating materials.
7. Plot temperature v/s time graph for different materials on thesame graph paper.
OBSERVATIONS
Least count of the thermometer = ... °C
Table P 4.1: Fall in temperature with time for differentmaterials as insulators
4
1.
Temparature
Time
Temparature
Time
Temparature
Time
Temparature
Time
2.
3.
4.
S. No.Name of
theMaterial
Variation of temparature with time© NCERT
not to
be re
publi
shed

192
LABORATORY MANUALLABORATORY MANUAL
PLOTTING OF GRAPH AND INTERPRETATION
Plot a graph between time t and temperature θ for different materialson the same graph paper, taking time on x-axis and temperatureon y-axis.
Steeper the graph, faster the rate of cooling of water thereby implyinglower efficiency of the material used as thermal insulator.
RESULT
From the cooling curves of water drawn for different insulatingmaterials surrounding it can be inferred that the effectiveness ofdifferent materials as insulators of heat in decreasing order is
(a)
(b)
(c)
(d)
PRECAUTIONS1. Make sure that the gaps C and D are kept the same for all the
materials.
2. This method can be used only for the insulating materials availablein the powdered/liquid form as the effect of trapped air can beminimised for them.
3. Packing of insulating material in the gaps C and D should be equallyuniform in all the cases.
4. Insulating lid should fit tightly to minimise heat loss.
SUGGESTED ADDITIONAL EXPERIMENTS/ACTIVITIES
1. Repeat the same procedure with the cold water (instead of hot water).
2. Repeat the same procedure with other insulating materials otherthan the ones you have used in this Activity.
© NCERT
not to
be re
publi
shed

193
UNIT NAMEPROJECT
PROJECTPROJECTPROJECTPROJECTPROJECT 55555
AIM
To compare the effectiveness of different materials as absorbersof sound.
APPARATUS AND MATERIALS REQUIRED
An audio frequency oscillator, cathode ray oscilloscope (CRO),two transformers, a microphone, a speaker (8 Ω), absorbingmaterials such as glass sheet, cardboard, plywood and fibreboard having roughly the same thickness, 4 cardboard sheets ofdifferent thicknesses, screw gauge, vernier calipers anda metre scale.
PRINCIPLEWhen sound waves travel through a material, part of its mechanicalenergy is absorbed by the material. The degree of absorption of soundenergy by a material depends upon
(i) the nature of material and
(ii) the thickness of the material through which sound waves are madeto pass.
PROCEDURE
1. Take sheets of different absorbing materials such as glass sheet,cardboard, plywood and fibre board sheets.
2. Measure the thickness of each material with the help of screwgauge/vernier calipers/metre scale.
3. Make the circuit arrangement of various components as shown inFig. P 5.1. High impedence coils L1 and L4 of the two transformersare to be connected to an audio frequency oscillator and a CROrespectively. Speaker and the microphone are to be connected tothe low resistance coils L
2 and L
3 of the two transformers in order
to achieve impedence-matching of the coils.
© NCERT
not to
be re
publi
shed

194
LABORATORY MANUALLABORATORY MANUAL
4. Adjust the CRO such that a suitable wave form appears onthe screen.
5. Feed an audio signal of known frequency from the audio oscillatorto the speaker and note the amplitude of the corresponding audiosignal on the CRO, without any sheet between the speaker andmicrophone.
6. Without changing the distance between speaker and microphone,insert one by one sheets of different materials, i.e., glass, cardboard,plywood, fibreboard (having same thickness) in between thespeaker and the microphone and each time note the amplitude ofthe corresponding audio signal on the CRO graduated screen.
7. Record the observations in tabular form to analyse the relationbetween the degree of absorption of sound energy and the natureof the absorbing material.
8. Insert four sheets of different thicknesses of the same material (saycardboard) one by one in between the speaker and the microphone.
9. Repeat Steps 5 and 6 of the experiment.
10.Record the observations in tabular form to analyse the degree ofabsorption of sound with the thickness of the absorbing material.
OBSERVATIONS
1. Least count of screw gauge/vernier valipers = ... mm
2. Thickness of cardboard = ... mm
Thickness of glass sheet = ... mm
Thickness of fireboard = ... mm
Thickness of plywood = ... mm
3. Frequency of the audio signal used = ... Hz
Fig. P. 5.1: Circuit arrangement for comparing effectiveness of differentmaterials as absorbers of sound
© NCERT
not to
be re
publi
shed

195
UNIT NAMEPROJECT
Table P 5.1: Degree of absorption of sound in differentabsorbing materials of same thickness.
Table P 5.2: Variation in degree of absorption of sound fordifferent thicknesses of the same absorbing material
CALCULATION1. Find the ratio of amplitude of the waveform before and after
insertion of the absorbing material from the experiment datarecorded in Table P 5.1.
2. Find the ratio of amplitude of the waveform before and afterinsertion of the absorbing material of different thicknesses andinfer its dependence on absorption of sound.
RESULT
1. Degree of absorption of sound waves is maximum in .... (material)and minimum in ... (material).
1. Glass
Card board
Fibre board
Plywood
2.
3.
4.
No. ofobservations
Name ofabsorbingmaterial
Amplitude of wave on CRO (mm)
Before insertionof absorbingmaterial A
0
After insertionof absorbingmaterial A
1
1
0
AA
1.
2.
3.
4.
No. ofobservations
Thicknessof
absorbingmaterial
Amplitude of wave on CRO (mm)
Before insertionof absorbingmaterial A
0
After insertionof absorbingmaterial A
1
1
0
AA
5
© NCERT
not to
be re
publi
shed

196
LABORATORY MANUALLABORATORY MANUAL
SUGGESTED ADDITIONAL EXPERIMENTS/ACTIVITIES
1. Plot a graph between the density (along x-axis) and the ratio of theamplitudes of the waveform (along y-axis) after and before insertionof the absorbing material (Table P 2.1). Study the nature of thegraph and interpret it.
2. Plot a graph between the thickness (along x-axis) of theabsorbing material and the ratio of the amplitude of the waveform (along y-axis) after and before insertion of the absorbingmaterial (Table P 5.2). Study the nature of the graph andinterpret it.
2. Degree of absorption of sound waves increases/decreases withincrease in the thickness of absorbing material (cardboard).
PRECAUTIONS
1. The amplitude of the input audio signal is kept constant whileperforming the experiment, with different absorbing materials ofsame thickness.
2. The thickness of absorbing material should not be so highthat the corresponding output signal on the screen of CRO is nolonger measurable.
3. The respective positions of the speaker, microphone andabsorbing material sheets for all sets of experiment should bekept unchanged.
© NCERT
not to
be re
publi
shed

197
UNIT NAMEPROJECT
PROJECTPROJECTPROJECTPROJECTPROJECT66666
AIM
To compare the Young’s modules of elasticity of different specimen ofrubber and compare them by drawing their elastic hysteresis curve.
APPARATUS AND MATERIAL REQUIRED
Two samples of rubber bands of about 10 cm length, a rigid support,number of slotted weights (10 g), a hanger (10 g), a scale and a fine pointer.
TERMS AND DEFINITIONS
1. Elastic hysteresis: When the stress-strain curve is not retraced onreversing the strain, the phenomenon is known as elastic hysteresis.
2. Residual strain: On removing the deforming force, if the length ofthe specimen does not reduce to its original length, this results inresidual strain.
PRINCIPLE
1. The graph of stress versus strain (or elongation) for rubber is nota straight line. Hence, the Young’s modules of elasticity for rubbercannot be defined uniquely. For a given stress, it is defined as theslope of the stress-strain curve at particular stress-strain point.
2. The area enclosed by the hysteresis curve is a measure of energyloss during the loading and unloading cycle.
PROCEDURE1. Suspend a rubber band from a rigid support and attach a hanger
of mass (10 g) along with a fixed pointer at the lower end.
2. Fix a scale S vertically such that the pointer moves freely on thescale and note the reading on the scale.
3. Place 10g slotted weight in the hanger and wait till the rubberband becomes stationary. Read the position of the pointer.
© NCERT
not to
be re
publi
shed

198
LABORATORY MANUALLABORATORY MANUAL
4. Repeat Step 3 by increasing load in Steps of 10 g till the totalweight is 80-100 g.
5. Start removing the weight in Steps of 10 g and note thecorresponding reading of the pointer (Give time for the rubber tostabilise before taking the reading).
6. Repeat Steps 1 to 5 for different samples of rubber bands.
OBSERVATIONS
(i) Least count of the scale = ... cm
(ii) Original length of unstreched rubber band, L = ... cm
Table P 6.1: Extension of rubber band on loading
CALCULATIONS
1. Plot a graph between the load and extension by takingextension along x-axis and load along y-axis for loadingand unloading.
2. The area of hysteresis loop for specimen A = ...
The area of hysteresis loop for specimen B = ...
(This can be done by counting the squares enclosed in thehysteresis loop).
RESULT
Hysteresis of specimen A ... is (greater or less than the) hysteresis ofspecimen B.
1
2
3
Specimen A
Specimen B
S.No.
Loadsuspended =
applied force =F (N)
Extension
Loading
Reading of pointer r (cm)
Unloading Loading Unloading
1
2
3© NCERT
not to
be re
publi
shed

199
UNIT NAMEPROJECT
PRECAUTIONS
1. The weights must be added or removed gently.
2. One should wait for some time after adding or removing the weightsbefore reading is taken.
EVALUATION
1. What does the area of hysteresis curve depict?
2. Interpret the hysteresis curves obtained for the specimen A and B.
3. When do the curves obtained while loading and unloadingcoincide?
4. When do the curves obtained while loading and unloadingnot coincide?
5. For which purpose is the rubber with large hysteresis loop used?
6. For which purpose is the rubber with small hysteresis loop used?
7. Is the stress-strain graph for rubber a straight line asexpected by Hooke’s law? What would happen if the elasticlimit is exceeded?
8. How would you known that elastic limit has been crossed?
6
© NCERT
not to
be re
publi
shed

200
LABORATORY MANUALLABORATORY MANUAL
PROJECTPROJECTPROJECTPROJECTPROJECT77777
AIM
To study the collision of two balls in two-dimensions.
APPARATUS AND MATERIAL REQUIRED
Apparatus for collision in two dimensions, metre scale, tracing paper,carbon paper, G-clamp, a screw, cellotape, protractor, two identicalsteel spheres or marble spheres and a plumbline.
DESCRIPTION OF APPARATUS
A scale or ruler with a groove (or analuminium channel) which is bentto act as a ramp so that a steel ballcan be rolled from the top. At thelower end of the ruler a set screw isfixed that has a depression on itstop. This is the resting place for thetarget steel ball. The ruler rests ona metal base which can be clampedat the edge of a laboratory table.From the set screw, a plumbline issuspended as shown in Fig. P 7.1.Fig. P 7.1: Setup to study the collision of two
balls in two-dimensions
TableWoodensupport
Aluminiumchannel
Plumb line
Depression
Carbon paper
B
A
PRINCIPLEWhen two steel spheres of mass m and m′ moving with velocities uand u′′′′′ respectively collide, their velocities change after collision. Iftheir velocities after collision are v and v′′′′′ respectively, then accordingto the law of conservation of momentum
mu + mu′′′′′ = mv + mv′′′′′
In this Activity, we study collision of two balls in two-dimensions usingthe apparatus described above and verify the law of conservation ofmomentum in two-dimensions. We allow one steel ball to roll down
© NCERT
not to
be re
publi
shed

201
UNIT NAMEPROJECT
the ramp and collide with a target ball (at rest) placed at the lower endof the ramp. For simplicity, we take two identical balls.
After collision the two balls moving in different directions fall downand strike the ground. The horizontal velocity of each sphere isproportional to the horizontal distance travelled by each sphere (Whythis should be so?). The horizontal distance is the distance from pointon the floor just below the initial position of the stationary ball to thepoint where it lands. This same horizontal distance can also be usedto represent the magnitude of the momentum of each ball as theyhave the same mass.
PROCEDURE
1. Arrange the apparatus as shown in Fig. P 7.1. Adjust the set screwso that the depression in it is directly in front of the groove andabout one radius of the steel ball away from the groove end. Roll asteel ball down the ramp and adjust the set screw by movingupward/downward so that the ball just clears it as it falls freely.Place the target ball on the depression in the screw. Suspend theplumb line with it.
2. Next adjust the position of the set screw so that the bullet ball willcollide with the target ball at an angle. Mark the incident and targetballs as 1 and 2. Ensure that the two balls are exactly at the sameheight from the floor at the time of collision.
3. Spread on the floor a large sheet of tracing paper on a similarsized carbon paper. The steel balls would be falling on thiscombination to make their imprints. In case large sheets of carbonpaper or plain paper are not available tape together their pieces(A-4 size) to make a large sheet.
4. Put the carbon paper on the floor, with its inked side facingup. Place the tracing paper directly over it. Place the sheetssuch that the centre of one end of the paper lies just belowthe plumb line.
5. Without placing a target ball on the set screw, roll the ball marked1. Mark the point on the tracing paper where the ball lands (P
0).
Repeat it several times and mark the cluster P0 1, P0 2, P0 3, etc. ...Find the centre of the cluster and mark it P
0.
6. Using identical steel ball (2) to act as a target ball, try a fewcollisions. Ensuring that the incident ball (1) is always releasedfrom the same height. Circle and label the clusters of points wherethe incident ball and the target ball hit the paper.
(You can find the centre of cluster points, by drawing a quadrilateraland intersecting diagonals to find the location of mean point.)
7
© NCERT
not to
be re
publi
shed

202
LABORATORY MANUALLABORATORY MANUAL
7. Mark point ‘O’ on the paper where the plumb line touches the paper.Draw vectors from the point O to the mean point P0, P1 and P2.
8. (a) Add the two vectors uuur
1OP and uuur
2OP representing themomentum of the incident ball and target ball to determinethe total momentum P after the collision (Fig. P7.2).
(b) Relate the total momentum P after the collision with the initial
momentum of the incident ball represented by vector uuur
0OPand the target ball.
RESULT
The total momentum of the two ball after collision is ... g cms–1 whichis almost equal to the initial momentum of the incident ball.
PRECAUTIONS1. Adjust the set screw and ensure that the two balls are exactly at
the same height from the floor at the time of collision.
2. In each trial, the incident ball should be rolled down from thesame height.
SOURCES OF ERROR
Friction between the ball and surface may introduce an error.
SELF ASSESSMENT
1. For each trial, measure the angle between the two final momentumvectors. Can you make any generalisation?
2. Suppose the target ball is replaced by a glass marble of same sizeand we carry out the experiment using the same incident ball. In
Fig. P 7.2: To find location of mean print
© NCERT
not to
be re
publi
shed

203
UNIT NAMEPROJECT
SUGGESTED ADDITIONAL EXPERIMENTS/ACTIVITIES
This experiment can also be used to verify the law of conservation ofmomentum quantitatively, the momentum of a ball can be calculatedknowing its mass and velocity. Measure the mass of each ball with abalance. The horizontal velocity is equal to the horizontal distance travelleddivided by the time taken. Note that this time is equal to the time takenby the ball to hit the floor. This time can be determined by measuring thedistance (d) from the top of the set screw to the floor and using theequation d = (gt2)/2. Further, note that t will be the same for all calculations.
Calculate the original momentum of the incident ball and final momentaof the incident and target balls for the case with balls of (1) equal massand (2) unequal mass. Find the resultant of the two final momenta ineach case and compare it with the initial momentum.
ALTERNATE METHOD FOR MAKING CHANNEL
Take plastic pipe having internal diameter slightly more than the diameterof the balls.
Cut the pipe lengthwise into two equal parts (two halves). Bend slightlyone part of the cut pipe by gently warming it and fix it on a table top asshown in the figure below.
Make a small depression near end B of the pipe with the help of a heatedthick nail/rod for resting the target ball.
this case, the horizontal distances, would represent velocityvectors? Do they still represent momentum vectors? How will youdraw momentum vectors in this case and verify the law ofconservation of momentum?
3. What happens to the momentum components corresponding toOP1 and OP2 in Fig. P7.2 in the direction perpendicular to OP0?
7
© NCERT
not to
be re
publi
shed

204
LABORATORY MANUALLABORATORY MANUAL
PROJECTPROJECTPROJECTPROJECTPROJECT88888
Fig. P 8.1: Fortin’s barometer
AIM
To study Fortin’s Barometer and use it to measure theatmospheric pressure.
APPARATUS AND MATERIAL REQUIRED
Fortin’s Barometer and a thermometer.
DESCRIPTION OF APPARATUS
Fortins’s Barometer
It consists of a uniform glass tube about 80 cmlong, open at one end. It is filled with mercuryand turned upside down carefully in a troughof mercury C. The lower part of the trough ismade of leather and the level of mercury in thetrough can be adjusted by means of screw A[Fig. P 8.1 (a)]. The upper side of the trough isclosed by a leather patch L in such a way that thecontact is maintained between the outside air andthe mercury in the trough. There is a small ivorypin P fixed with its pointed tip touching themercury in the trough. The function of the pin Pis to adjust the zero of the scale at the same levelas the mercury in the trough. The glass tube isenclosed in a brass tube for protection. There aretwo vertical slits diametrically opposite each otherso that the level of mercury in the tube can beseen [Fig. P 8.1 (b)]. A scale graduated incentimetre is engraved on the brass tube on bothsides along the edges of the front slit. The scalegraduation does not start from zero but from 68cm to 85 cm, as the atmospheric pressureremainswithin these limits. A brass vernier scale slidesalong the front slit and can be adjusted usingscrew B.
© NCERT
not to
be re
publi
shed

205
UNIT NAMEPROJECT
PRINCIPLEWhen a completely filled mercury tube is turned upside down in thetrough C, some mercury flows out of the tube in the trough leaving avacuum on the top.
The level of mercury stabilises when the atmospheric pressure exertedon the surface of mercury in the trough equalises that due to themercury column in the tube. The height of the mercury column inthe tube is proportional to atmospheric pressure under normalconditions, Column of mercury in the glass tube stands at a height ofabout 76 cm at sea level.
From theoretical point of view, a barometer could be made of anyliquid. Mercury is chosen for many reasons mainly it is so dense(13600 kg/m3) that column supported by air pressure is of amanagable height.
A water barometer would be more than 10 m in height.
PROCEDURE1. Use the plumb line to hang the barometer vertically on a wall.
2. Examine the screws A, B, pin P and vernier V.
3. Determine the least count of the vernier scale.
4. Adjust the level of mercury surface in the trough of the barometer
Fig. P 8.2: Correct adjustment of mercury surface in the reservoir
8
© NCERT
not to
be re
publi
shed

206
LABORATORY MANUALLABORATORY MANUAL
with the help of screw A and by looking at the ivory pin andits image on the mercury surface in the trough (Fig. P 8.2).
Fig. P 8.3: Eye should be at the level ofmeniscus of mercury in the tube
Vernier V
R
Correctadjustmentof Vernier Scale
OBSERVATIONS(i) Vernier constant or least count = ...
No. of divisions on the vernier = ...
No. of divisions on the main scale = ...
Least count of main scale (1 MSD) = ... cm
Least count of vernier scale
= = ...1 MSD
cmNo. of divisions on vernier scale
(ii) Room Temperature = ... °C
Table P 8.1: Measuring height of mercury columnin a barometer
RESULTAtmospheric pressure in the laboratory on dd/mm/yr (date) at ... am/pm at room temperature ...°C was measured as ...cm of Hg.Atmospheric pressure = ...N/m2
5. Adjust the vernier using screw B such that the zero of the verniertouches the convex meniscus of mercury in the tube. The eyeshould be kept at the level of the meniscus (Fig. P 8.3).
6. Note the reading on the main scale and the vernier.
7. Record the room temperature using a thermometer.
8. Repeat the procedure two more times and determine theaverage atmospheric pressure.
1
2
3
S.No.
Main scale readingbelow zero mark of
vernier scale, S (cm)
Vernier scalereading n
Height of mercurycolumn
h = (S + n × least count)
© NCERT
not to
be re
publi
shed

207
UNIT NAMEPROJECT
PRECAUTIONS1. The barometer is a fragile instrument and should be handled
carefully.
2. The wall mount should be firm in a room of a laboratory and notin any passage.
3. Adequate light must fall on the ivory pin and the vernier scale.
4. Least count should be calculated with care.
5. Screw A should be moved slowly and gently.
SOURCES OF ERROR1. There may be air bubbles in the barometer tube.
2. Ivory pin may not be fixed properly.
3. Room temperature may change, affecting the observations.
DISCUSSION1. The barometer should be placed in such a way on the wall that screw
A can easily be adjusted by viewing the ivory pin P. A suitable platformcan be used to stand and see the vernier reading at eye level.
2. Why does the barometer require adjustment everytime one has touse it?
SELF ASSESSMENT1. What effect would there be of the following:
(a) Ivory pin not adjusted as advised?
(b) Barometer is not vertical but tilted?
(c) The pin P and scale S not viewed at eye level?
2. If water is used instead of mercury, what problems would youencounter?
SUGGESTED ADDITIONAL EXPERIMENTS/ACTIVITIES
1. Take barometer readings and temperature readings at different timesduring school hours. Study the pattern for the change in atmosphericpressure over a week.
2. Plot a graph between atmospheric pressure and humidity (as givenin the newspaper) for a month. Can we relate humidity to atmosphericpressure?
8
© NCERT
not to
be re
publi
shed