Embed Size (px)
Citation preview
POLITICAL ECONOMY OF DEVELOPMENT
THE POLITICS OF RAPID ECONOMIC GROWTH
Gov 1255
Politics of India
Prof Prerna Singh
Facts:From ‘Hindu rate of growth’ to economic boomGrowth rate of approx 5-6% for past 25 years
Conventional Explanation:Pro-Market Economic liberalization circa 1991

PROBLEMS WITH CONVENTIONAL PRO-MARKET INTERPRETATION
Economic growth started accelerating in 1980s - a full decade prior to liberalization of 1991.

Economic Performance in India, 1960-2004
02000400060008000
100001200014000
1950
-51
1960
-61
1970
-71
1980
-81
1990
-91
2000
-200
1
2003
-200
4Years
Per
Cap
ita
Net
Nat
ion
al
Pro
du
ct in
Ru
pee
s
Per Capita Netnational product in Rupees

SOME BASIC GROWTH DATA, 1950-2004(ALL FIGURES IN PERCENTAGE PER ANNUM)
1950-1964
1965-1979
1980-
1990
1991-
2004
1980-
2004GDP Growth
3.7 2.9 5.8 5.6 5.7
Industrial Growth
7.4 3.8 6.5 5.8 6.1
Agricultural Growth
3.1 2.3 3.9 3.0 3.4
Gross Investment/GDP
13 18 22.8 22.3 22.5

PROBLEMS WITH CONVENTIONAL PRO-MARKET INTERPRETATION
Economic growth started accelerating in 1980s - a full decade prior to liberalization of 1991.
Industrial production in India—a key object of reforms—did not accelerate (and in fact declined) following the liberalizing reforms.

SOME BASIC GROWTH DATA, 1950-2004(ALL FIGURES IN PERCENTAGE PER ANNUM)
1950-
1964
1965-
1979
1980-
1990
1991-
2004
1980-2004
GDP Growth
3.7 2.9 5.8 5.6 5.7
Industrial Growth
7.4 3.8 6.5 5.8 6.1
Agricultural Growth
3.1 2.3 3.9 3.0 3.4
Gross Investment/GDP
13 18 22.8 22.3 22.5

PROBLEMS WITH CONVENTIONAL PRO-MARKET INTERPRETATION
Economic growth started accelerating in 1980s - a full decade prior to liberalization of 1991.
Industrial production in India—a key object of reforms—did not accelerate (and in fact declined) following the liberalizing reforms.
India’s record in a broader comparative context “Modest” embrace of the global economy For example, mixed record of other liberalized,
developing countries (Latin America & Sub-saharan Africa)

ALTERNATIVE EXPLANATION: PRO-BUSINESS
Emphasizes the state’s changing role since 1980:
the abandonment of populism, prioritizing of economic growth, and a slow but steady embrace of Indian capital
as the main ruling ally.

Minimal State Intervention
Free play of markets will lead to efficient allocation of resources, as well as promote competitiveness, hence boosting production and growth (‘Washington Consensus’)
Supports new entrants and consumers
Derived from strands of neoclassical economics
Emphasizes quality and not degree of state intervention
State commitment to high economic growth by developing trade & industry with well-deigned and thoroughly implemented state intervention
Supports established producers
Developed via real-world experience, especially success of East Asian tigers.
Pro-market Pro-Business

THREE PHASES IN THE POLITICAL ECONOMY OF DEVELOPMENT IN INDIA
Pre-1980s-: Pro-redistribution 1980s: Pro- growth/ Pro-business
1991- Pro-business + Pro-market

THREE PHASES IN THE POLITICAL ECONOMY OF DEVELOPMENT IN INDIA
Pre-1980s-: Pro-redistribution 1980s: Pro- growth/ Pro-business
1991- Pro-business + Pro-market

THE PRE-EMERGENCY, LEFT-LEANING INDIRA GANDHI VS.THE POST-EMERGENCY, RIGHT-LEANING INDIRA GANDHI

THE POST-EMERGENCY, RIGHT-LEANING INDIRA GANDHI
Prioritizing of economic growth as a state goal.
Supporting big business to achieve this goal
Taming labor as a necessary aspect of this strategy

THE POST-EMERGENCY, RIGHT-LEANING INDIRA GANDHI
Prioritizing of economic growth as a state goalNew industrial policy statement Top priority: Maximization of
productionGrowth first development

THE POST-EMERGENCY, RIGHT-LEANING INDIRA GANDHI
Supporting big business to achieve this goal
Withdrawal of important constraints on expansion & encouragement to big business to enter areas that had hitherto been reserved for the public sector
Financing the expansion.Liberalized creditTax relief Altered the legal framework to
encourage private sector to finance new investments by raising resources directly from the public

THE POST-EMERGENCY, RIGHT-LEANING INDIRA GANDHI
Taming labor as a necessary aspect of this strategy
Especially difficult for champion of poor & workers – Mrs Gandhi
But did curtail labor unrest, esp strikes

THE POST-EMERGENCY, RIGHT-LEANING INDIRA GANDHI
Prioritizing of economic growth as a state goal.
Supporting big business to achieve this goal
Taming labor as a necessary aspect of this strategy
Government restructured its own role: Halted the growth of public sector industries Demoted the significance of economic planning and the
planning commission.

THE POST-EMERGENCY, RIGHT-LEANING INDIRA GANDHI
Prioritizing of economic growth as a state goal.
Supporting big business to achieve this goal
Taming labor as a necessary aspect of this strategy
Government restructured its own role
Changes in India’s economic relations with the world

RAJIV GANDHI “Break from the past” Government's commitment first and
foremost to economic growth and only in abstract notions to openness or laissez faire.
Policy pattern much more pro-business, specially pro big Indian business, rather than anything else

RESULTS OF PRO-BUSINESS GROWTH STRATEGY
Positive:High rates of investment + in efficiency of
investment Growth rate, esp in industry
Negative:Political ProblemsPolitical Economy problems

ECONOMIC “CRISIS” OF 1991 & NEOLIBERAL REFORMS
Growth rate of manufacturing industry not influenced all that greatly by the reforms.

INDUSTRIAL GROWTH IN INDIA (1950-2004)
0
1
2
3
4
5
6
7
8
1950-1964
1965-1979
1980-1990
1991-2004
1980-2004
Rate of Industrial Growth (in percentage per annum)

ECONOMIC “CRISIS” OF 1991 & NEOLIBERAL REFORMS
Growth rate of manufacturing industry not influenced
Rate of capital formation not significantly influenced

PATTERNS OF CAPITAL FORMATION IN INDIA, BY SECTOR (1970-2002)
0
5
10
15
20
25
30
1970-1975
1975-1980
1980-1985
1985-1990
1990-1995
1995-2000
2000-2002
Total Gross CapitalFormation
Private CorporateSector
Public Sector
Household Sector

ECONOMIC “CRISIS” OF 1991 & NEOLIBERAL REFORMS
Growth rate of manufacturing industry not influenced
Rate of capital formation not significantly influenced
Changing composition of investment

REFORMS OF THE 1990S Delicensing Tax concessions Opening of yet newer areas hitherto reserved for
the public sector Taming labour unrest

REFORMS OF THE 1990SContinuation of reforms of the 1980s: Not surprising Delicensing Tax concessions Opening of yet newer areas hitherto reserved for
the public sector Taming labour unrest

REFORMS OF THE 1990SBreak from reforms of the 1980s: Surprising Opening up of the economy Import quotas were reduced Tariffs came down slowly but surely Currency was devalued Foreign investment regime was liberalized Restrictions on external financial transactions
were eased.

WHY DID THE SAME SET OF REFORMS THAT PROVED DIFFICULT TO PURSUE DURING THE 1980S BECOME MORE LIKELY IN THE EARLY 1990S?
External factors: Decline and the disintegration of the Soviet Union
Decline of a model of development Loss of most important trading partner Loss of most important political & military ally
Growing availability of investible sources in foreign exchange
WTO coming
Internal factors: Softening of resistance of Indian business to
opening of economy Split of position of Indian business over
opening of the economy in 1980s

REFORMS Internal deregulation of IndustryGone the furthest
Attempts to tame budgetary deficitLeast successful
External openingControversial but slow & steady

Why distinguish Pro-market vs Pro-Business policies?
What is at stake? Scholarly – Get Causal Arrows Right Normative – What is Fair & Just

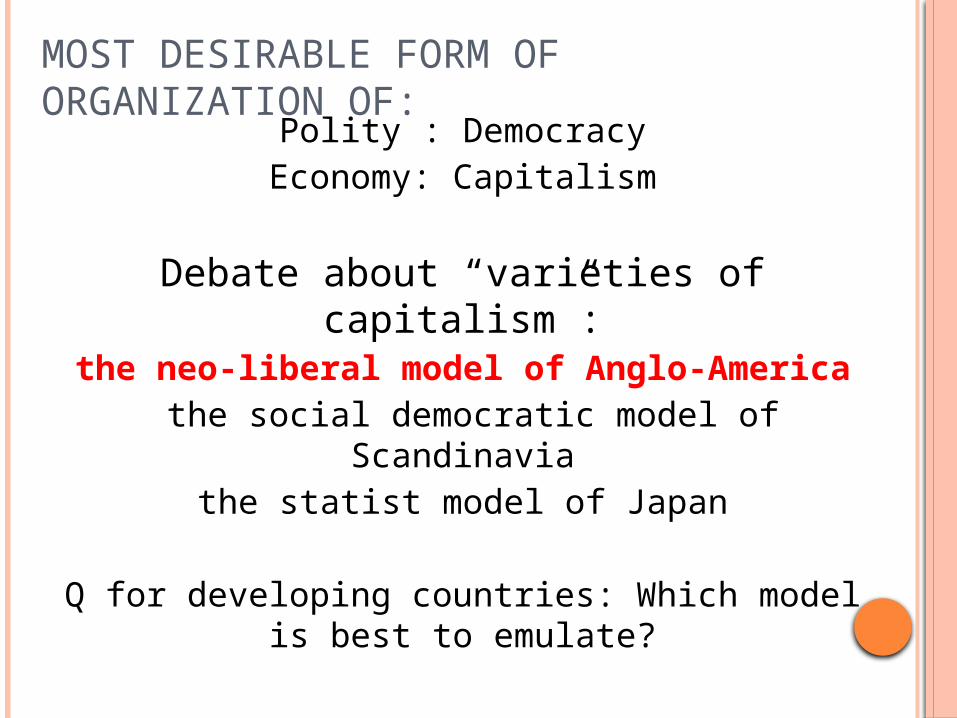
MOST DESIRABLE FORM OF ORGANIZATION OF:
Polity : DemocracyEconomy: Capitalism
Debate about “varieties of capitalism”:the neo-liberal model of Anglo-America
the social democratic model of Scandinaviathe statist model of Japan
Q for developing countries: Which model is best to emulate?
MOST DESIRABLE FORM OF ORGANIZATION OF:
Polity : DemocracyEconomy: Capitalism
Debate about “varieties of capitalism”:the neo-liberal model of Anglo-America the social democratic model of Scandinavia
the statist model of Japan
Q for developing countries: Which model is best to emulate?

MOST DESIRABLE FORM OF ORGANIZATION OF:
Polity : DemocracyEconomy: Capitalism
Debate about “varieties of capitalism”:
the neo-liberal model of Anglo-America
the social democratic model of Scandinavia
the statist model of Japan
Q for developing countries: Which model is best to emulate?
How successful have these policies been?

BOOMING INDIA
Neoliberals Statist scholars(Atul Kohli)
All good things go together
Trade-offs of development

DIFFICULT QS FOR INDIA’S MODEL OF DEVELOPMENT
Why should the common people in a democracy accept a narrow ruling alliance at the helm?
Is ethnic mobilization a substitute for pro-poor politics?
Is India increasingly stuck with a two track democracy, in which common people are only needed at the time of elections, and then it is best that they all go home, forget politics, and let the “rational” elite quietly run a pro-business show?
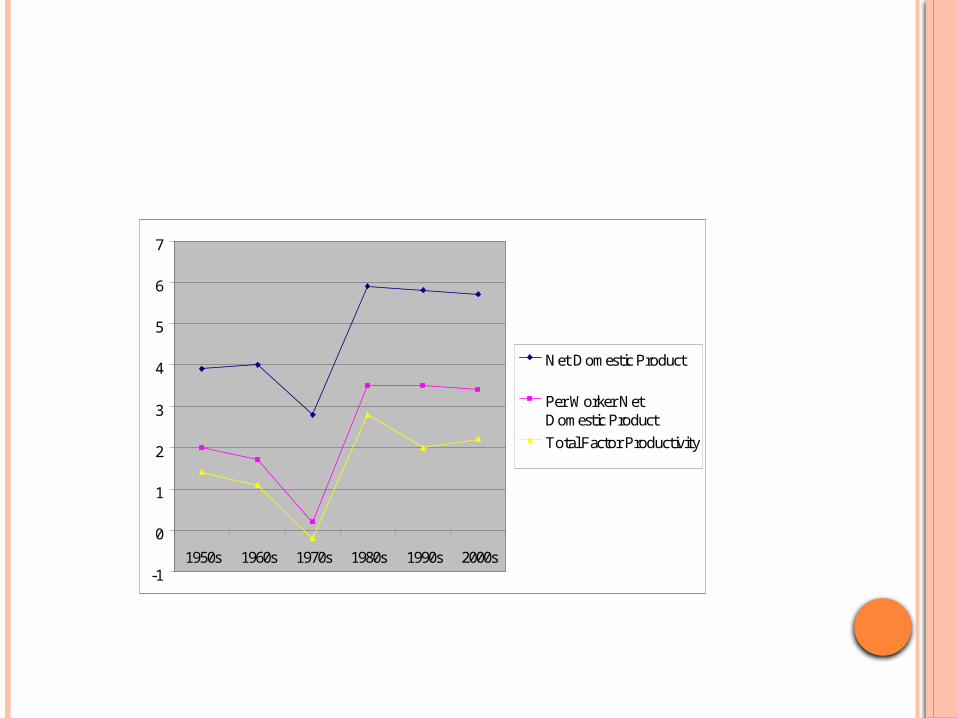
-1
0
1
2
3
4
5
6
7
1950s 1960s 1970s 1980s 1990s 2000s
Net Domestic Product
Per Worker NetDomestic Product
Total Factor Productivity
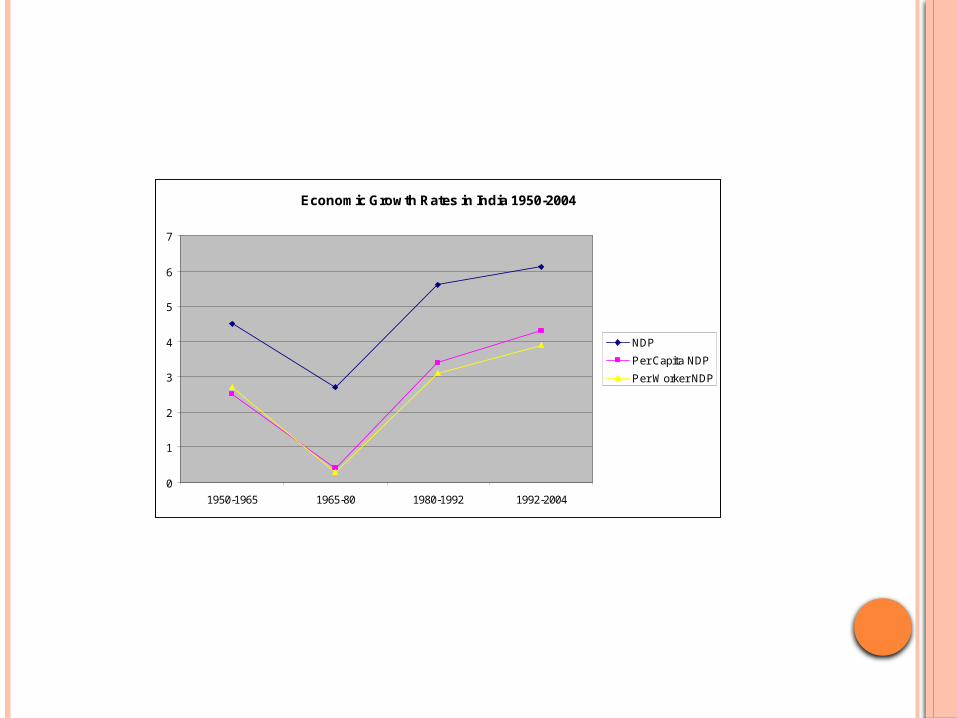
Economic Growth Rates in India 1950-2004
0
1
2
3
4
5
6
7
1950-1965 1965-80 1980-1992 1992-2004
NDP
Per Capita NDP
Per Worker NDP

Capital Formation in India (1950-2004)
0
5
10
15
20
25
30
1950-51 1960-61 1970-71 1980-81 1990-91 1999-00 2000-01 2001-02 2002-03 2003-04
Gross DomesticCapital Formation(as percentage ofGDP)

Gross Fixed Capital Formation in India 1950-2004 (as percentage of GDP)
0
5
10
15
20
25
30
1950
-51
1956
-57
1962
-63
1968
-69
1974
-75
1980
-81
1986
-87
1992
-93
1998
-99
Public sector
Private sector
Total

0
1
2
3
4
5
6
7
8
1950-1965 1965-1980 1980-2005
Industrial Growth in India (1950-2005)
Rate of Industrial Growth(in percentage perannum)