Embed Size (px)
Citation preview

November 7, 2018
Mr. Jolin E. Kieling, CliiefNew Mexico Environinental Department2905 RodeoParkDriveEast,Bldg. 1Santa Fe, NM 87SOS-6303
! P-! '7
'o REC-EIVED
NOV - 8 2013
RE: RF,SPONSE TO DISAPPROV AL
HYDROCARBON SEEP INTERIM MEASURES 2018 2"n QUARTER ST ATUS REPORTWESTERN REFINING SOUTHWEST INC., GALLUP REFINERYEPA ID # NMDOOO333211HWB-WRG-18-006
Dear Mr. Kieling:
Westem Refining Southwest, h'ic. ("Western") (aka Marathon Petroleum Company, LP) is in receipt ofyour letter of October 5, 2018, which provided comments on the referenced repoit, dated July 3 0, 2018.The following responses address eacli of your comments and provide a cross-reference to associatedrevisions to tlie Repoit.
In addition, your letter notes tliat responses liad not yet been received by NMED all October 5, 2018 (date
of your letter) to address previous comments in tl'ie Marcli 2, 2018 and May 25, 2018 Approval with
Modifications letters. Tlie response to tlie Marcli 2, 2018 letter was submitted all September 30,2018 and tlie response to the May 25, 2018 letter was provided on October 25, 2018.
NMED Comment 1
In tlte Activities Conducted During Second Quarter 2018 Section, tlie Peri'nittee states,
"[r]ecovety was discontinued at tlie retention ditcli, wliicli was previorisly excavated noitli of the
standpipes (S 1-S6), as product was no longer observed to be entering tlie retention ditcli." Tlie Report
includes a table showing tbe recovery vokunes from tlie retention ditcli. According to tl'ie table, 20
gallons of oil were recovered fi"om tlie retention ditcl'i at tlie last pumping event of tlie 2018 1st
quatter (Marcli 22, 2018). Tlie volume of recovered oil (20 gallons) was consistent witli tlie recoveiy
volumes previously recorded. During the entire 2018 2nd quaiter, tlie recoveiy voku'nes for water/oil
mixture and oil were recorded as zero, indicating tliat no pru'nping event took place. The sudden
disappearance of oil in tlie 2018 2nd qriaiter must be documented by photographs of the retention
ditch showing grorindwater witliout a visible oil slieen. hiclude tlie pliotograplis in tlie revised
Repott. In addition, discuss wliether tlie Peri'nittee intends to keep tlie recovery ditcli open in tlie
future in tlie revised Repoit.
Gallup Refinery Response: Pliotographs of the retention ditc)i and nearby area l'iave been inclrided witlithe revised Report. The current plan is to leave tlie retention ditch open to monitor whether any
recoverable hydrocarbons return to the ditch. As NMED notes below, there iriay be temporary conditionscausing tlie product to not enter tlie ditch t)iat may cliance again in the future.
NMED Comment 2
In the Activities Conducted During Secorid Quarter 2018 Section, tlie Pennittee states,"[ a]
pproximately 9 gallons of [separate phase liydrocarbons] SPH and 28,491 gallons of groundwater

were recovered during the second quarter, which represents a significant reduction of SPH from 153
gallons recovered during the last quarter (1st Qtr 2018)," and "[t]he reduction in the volumes of SPH
recovered in the second quarter of 2018 as compared to the previous quarterly volumes is not
attributed to any changes in the methods used to estimate the recovery volumes." The reduction of
recovered SPH volume may be caused by (1) apparent reduction of SPH within the soil matrix or (2)
changes in the depth to groundwater (DTW). The SPH column will appear thinner when groundwater
elevations increase while SPH column will appear thicker when groundwater elevations decrease.
The recoverable SPH volume will easily fluctuate depending on the DTW; however, SPH volume
present within soil matrix is often unchanged. In the revised Report, include a table that compares the
measured DTW for monitoring wells located in the vicinity of the standpipes and retention ditch
during 1st, 2nd and 3rd quarters of 2018.
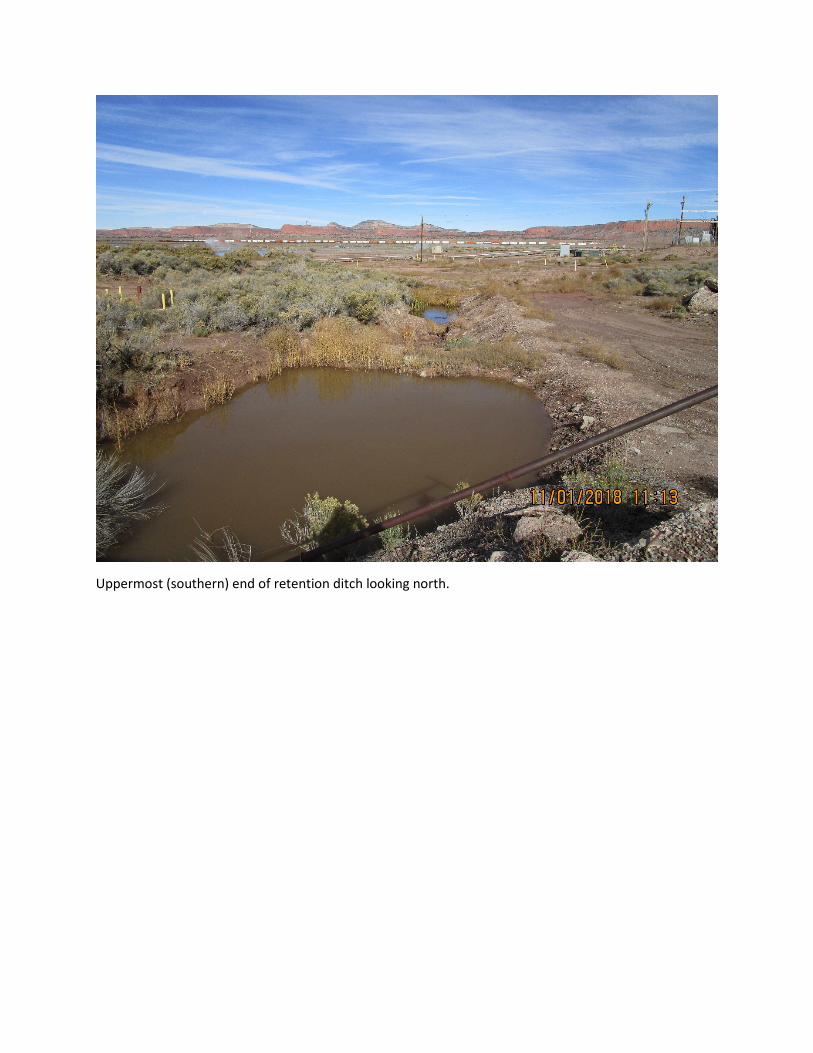
Gallup Refinery Response: A table has been included that shows fluid level measurements (2016
through 3rd Quarter 2018) for MKTF wells in the area of the sumps and retention ditch that have
contained SPH. The data is also presented in a graph. Overall, the measured thickness of SPH has
decreased in most wells with the exception of MKTF-06, which showed a decrease through March 2017
and then an increase with the thickness stabilizing in February 2018. Measurable SPH first appears in
September 2016 in MKTF-26 and then decreases by March 2017 with measurements stabile since that
time without a noticeable decline. Also presented is the potentiometric surface measured in the same
wells. In some cases, there does appear to a possible correlation between the potentiometric surface and
the measured SPH thickness, such as shown in well MKTF-06, where the measured SPH thickness
increase as the potentiometric surface decreases.
NMED Comment 3
In the Activities Conducted During Second Quarter 2018 Section, the Permittee states, "[n]ew dye
tracer test were conducted related to an assessment of the sanitary lagoon, which is located west of
the hydrocarbon seep area, and this information is presented under [separate] cover, as it was not
focused on the hydrocarbon seeps." Provide a reference to the document that reports the results of
new dye tracer test in a response letter. The hydrocarbon seep area may coincide with the location of
the underground sewer pipe extending to the sanitary lagoon. The pipe may be a conduit for SPH.
Propose to investigate whether the hydrocarbon seep area coincides with the location of the
underground sewer pipe in the revised Report.
Gallup Refinery Response: The referenced document is the February 1, 2018 letter with reference to
Sanitary Lagoon Investigation. NMED has already requested an Investigation Work Plan for the Sanitary
Lagoon Area, including the underground sewer pipeline. The Investigation Work Plan was first
submitted to NMED in May 2018, revised per NMED comments received in August 2018, and
subsequently resubmitted in October 2018. We believe that implementation of that Investigation Work
Plan will address this comment.
NMED Comment 4
In the Activities Planned for Third Quarter 2018 Section, the Permittee states, "Western will
continue current recovery operations at the standpipe sumps and the retention ditch, if hydrocarbons
are present, using a vacuum truck to pump SPH and groundwater from each of the sumps and the
downstream retention ditch." NMED has not received recent data regarding SPH levels in the MKTF
wells. Discuss any correlation between the reduction in recovery volume and groundwater and SPH


QUARTERLY STATUS REPORT HYRODROCARBON SEEP INTERIM MEASURES
WESTERN REFINING SOUTHWEST, INC – GALLUP REFINERY Second Quarter 2018 (Revised November 2018)
Activities conducted during second quarter 2018
• Source Control – Western continued to remove separate-phase hydrocarbon (SPH) and groundwater from the standpipe sumps (S1 - S6). Approximately 9 gallons of SPH and 28,491 gallons of groundwater were recovered during the second quarter, which represents a significant reduction in SPH from 153 gallons recovered during the last quarter (1st Qtr 2018). The percent of SPH recovered of the total volume was approximately, 0.03% which is significantly less than the previous quarter of 0.16%. This represents a fairly continuous reduction in the amount of SPH recovered since 2016. Recovery was discontinued at the retention ditch, which was previously excavated north of the standpipes (S1-S6), as product was no longer observed to be entering the retention ditch.
The reduction in the volumes of SPH recovered in the second quarter of 2018 as compared to the previous quarterly volumes is not attributed to any changes in the methods used to estimate the recovery volumes. The reduction in recovery volumes as compared to previous quarters is reflected the measured SPH thickness in nearby monitoring wells (see the enclosed table and graphs showing fluid level measurements). For example, the SPH thickness in MKTF-01, which is immediately west of the sumps, was measured at 1.5 feet in September 2016 vs. 0.30 feet in April 2018. Up-gradient of sumps, at MKTF-03, the measured SPH thickness decreased from 4.28 feet in June 2016 to 0.92 feet in April 2018. Further away from the sumps and retention ditch, the reduction in measured SPH has been less apparent, such as in well MKTF-05, where the SPH thickness reduced from maximum measurements of 0.77 feet in October 2016 and November 2017 to 0.23 feet in April 2018. Obviously, individual measurements of SPH in any given monitoring well may be influenced by fluctuations in the potentiometric surface in addition to any effects of hydrocarbon recovery at the sumps and/or retention ditch.
• Camera Surveys – Western is evaluating the reliance upon dye tracer tests instead of more camera surveys, as earlier camera surveys were not as useful as tracer tests in locating leaks from subsurface pipelines.
• Dye Tracer Tests – Western previously conducted dye tracer tests at several locations near the Truck Loading Rack. The earlier test methods and results were reviewed to determine if it is possible to refine the earlier tests by locating additional points where a tracer may be introduced to the wastewater pipelines/sump. New dye tracer tests were conducted related to an assessment of the sanitary lagoon, which is located west of the hydrocarbon seep area, and this information is presented under separate cover (letter dated February 1, 2018 with reference to Sanitary Lagoon Investigation), as it was not focused on the hydrocarbon seeps.
• Photos of the retention ditch are included that show hydrocarbon staining on the vegetation surrounding the ditch but no significant accumulation of hydrocarbon on the water surface.

• A table is included that shows fluid level measurements (2016 through 3rd Quarter 2018) for MKTF wells in the area of the sumps and retention ditch that have contained SPH. The data is also presented in a graph. Overall, the measured thickness of SPH has decreased in most wells with the exception of MKTF-06, which showed a decrease through March 2017 and then an increase with the thickness stabilizing in February 2018. Measurable SPH first appears in September 2016 in MKTF-26 and then decreases by March 2017 with measurements stabile since that time without a noticeable decline. Also presented is the potentiometric surface measured in the same wells. In some cases, there does appear to a possible correlation between the potentiometric surface and the measured SPH thickness, such as shown in well MKTF-06, where the measured SPH thickness increase as the potentiometric surface decreases.
Activities planned for third quarter 2018
• Source Control – Western will continue current recovery operations at the standpipe sumps and the retention ditch, if hydrocarbons are present, using a vacuum truck to pump SPH and groundwater from each of the sumps and the downstream retention ditch.

PHOTOS OF RETENTION DITCH LOCATED NORTH OF HYDROCARBON SEEP
PHOTOS PROGRESS FROM LOWER (NORTHERN) END TO HIGHEST (SOUTHERN) END OF DITCH
Photo of lowermost (northern) end of retention ditch. Oil stained vegetation shown around edges of ditch but no recoverable product on water.

Looking south along retention ditch, midway between north and south ends. Some hydrocarbon staining along perimeter of ditch, but very little hydrocarbon present on water. Location of concentrated hydrocarbon discharge at upper (southern) end of this ponded area.
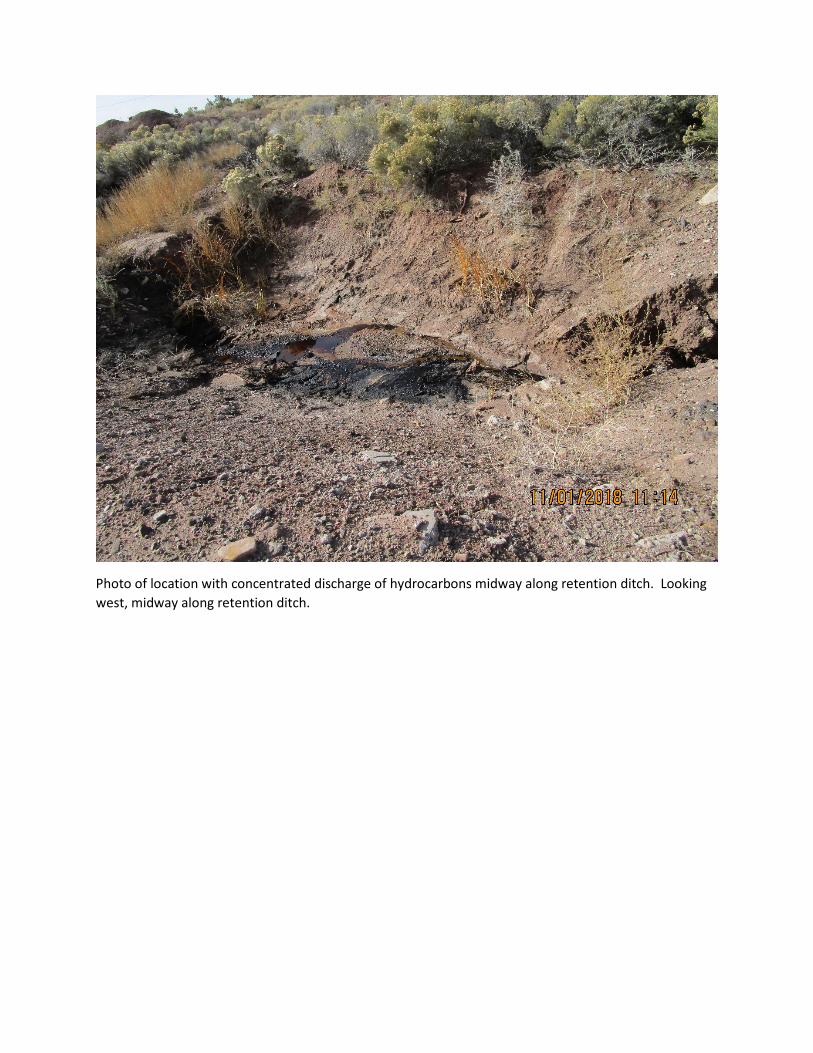
Photo of location with concentrated discharge of hydrocarbons midway along retention ditch. Looking west, midway along retention ditch.

Photo of pond along retention ditch immediately downstream from concentrated hydrocarbon discharge point. Photo taken looking north. Very little potentially recoverable hydrocarbon present on water.
Uppermost (southern) end of retention ditch looking north.

Page 1 of 8
Date of Survey ¹
Well ID Number
Inspection or Sample Date
Casing Diameter
(Inch)
Ground Level
Elevations (ft)
Well Casing
Rim Elevations
(ft)
Ground Elevation
Inside Steel Sleeve
(ft)
Stick-up length
(ft)
Well Casing Bottom
Elevation (ft)
Total Well Depth
(ft)
Depth to ² SPH (ft)
SPH ³ Column
Thickness (ft)
Depth to Water
(ft)
Ground water
Elevation (ft)
Corrected ⁴ Water Table
Elevation (Factor 0.8) (ft)
Screened Interval
Depth Top to Bottom
(ft)
Stratigraphic unit in which screen exists
2/24/2016 4.00 6,918.28 6,920.67 6,920.67 2.39 6,903.25 17.42 ND NA 5.84 6,914.83 NA 5 - 156/10/2016 4.00 6,918.28 6,920.67 6,920.67 2.39 6,903.25 17.42 7.02 1.16 8.18 6,912.49 6913.42 5 - 159/7/2016 4.00 6,918.28 6,920.67 6,920.67 2.39 6,903.25 17.42 7.12 1.50 8.62 6,912.05 6913.25 5 - 15
10/28/2016 4.00 6,918.28 6,920.67 6,920.67 2.39 6,903.25 17.42 7.53 1.35 8.88 6,911.79 6912.87 5 - 1503/14/17 4.00 6,918.28 6,920.67 6,920.67 2.39 6,903.25 17.42 4.65 0.16 4.81 6,915.86 6915.99 5 - 15 Chinle/Alluvium Interface06/07/17 4.00 6,918.28 6,920.67 6,920.67 2.39 6,903.25 17.42 4.89 0.53 5.42 6,915.25 6915.67 5 - 15 Chinle/Alluvium Interface10/03/17 4.00 6,918.28 6,920.67 6,920.67 2.39 6,903.25 17.42 6.20 0.36 6.56 6,914.11 6914.40 5 - 15 Chinle/Alluvium Interface11/20/17 4.00 6,918.28 6,920.67 6,920.67 2.39 6,903.25 17.42 4.62 0.33 4.95 6,915.72 6915.98 5 - 15 Chinle/Alluvium Interface02/07/18 4.00 6,918.28 6,920.67 6,920.67 2.39 6,903.25 17.42 5.05 0.35 5.40 6,915.27 6915.55 5 - 15 Chinle/Alluvium Interface04/25/18 4.00 6,918.28 6,920.67 6,920.67 2.39 6,903.25 17.42 6.22 0.30 6.52 6,914.15 6914.39 5 - 15 Chinle/Alluvium Interface08/15/18 4.00 6,918.28 6,920.67 6,920.67 2.39 6,903.25 17.42 6.40 0.31 6.71 6,913.96 6914.21 5 - 15 Chinle/Alluvium Interface
2/24/2016 4.00 6,915.00 6,917.45 6,917.18 2.45 6,896.97 20.48 ND NA 7.22 6,910.23 NA 7 - 176/10/2016 4.00 6,915.00 6,917.45 6,917.18 2.45 6,896.97 20.48 ND NA 8.09 6,909.36 NA 7 - 179/7/2016 4.00 6,915.00 6,917.45 6,917.18 2.45 6,896.97 20.48 ND NA 8.28 6,909.17 NA 7 - 17
10/28/2016 4.00 6,915.00 6,917.45 6,917.18 2.45 6,896.97 20.48 ND NA 8.55 6,908.90 NA 7 - 1703/16/17 4.00 6,915.00 6,917.45 6,917.18 2.45 6,896.97 20.48 ND NA 7.34 6,910.11 NA 7 - 17 Chinle/Alluvium Interface06/07/17 4.00 6,915.00 6,917.45 6,917.18 2.45 6,896.97 20.48 7.10 0.01 7.11 6,910.34 6910.35 7 - 17 Chinle/Alluvium Interface10/03/17 4.00 6,915.00 6,917.45 6,917.18 2.45 6,896.97 20.48 ND NA 6.67 6,910.78 NA 7 - 17 Chinle/Alluvium Interface11/20/17 4.00 6,915.00 6,917.45 6,917.18 2.45 6,897.10 20.35 ND NA 7.00 6,910.45 NA 7 - 17 Chinle/Alluvium Interface02/06/18 4.00 6,915.00 6,917.45 6,917.18 2.45 6,897.10 20.35 ND NA 7.44 6,910.01 NA 7 - 17 Chinle/Alluvium Interface04/25/18 4.00 6,915.00 6,917.45 6,917.18 2.45 6,897.10 20.35 ND NA 7.95 6,909.50 NA 7 - 17 Chinle/Alluvium Interface08/15/18 4.00 6,915.00 6,917.45 6,917.18 2.45 6,897.10 20.35 ND NA 8.40 6,909.05 NA 7 - 17 Chinle/Alluvium Interface
2/24/2016 4.00 6,931.73 6,931.69 6,930.85 -0.04 6,913.24 18.45 8.30 0.10 8.40 6,923.29 6923.37 3 - 18 Chinle/Alluvium Interface6/10/2016 4.00 6,931.73 6,931.69 6,930.85 -0.04 6,913.24 18.45 7.55 4.28 11.83 6,919.86 6923.28 3 - 18 Chinle/Alluvium Interface9/7/2016 4.00 6,931.73 6,931.69 6,930.85 -0.04 6,913.24 18.45 7.92 2.40 10.32 6,921.37 6923.29 3 - 18 Chinle/Alluvium Interface
10/28/2016 4.00 6,931.73 6,931.69 6,930.85 -0.04 6,913.24 18.45 8.30 1.10 9.40 6922.29 6923.17 3 - 18 Chinle/Alluvium Interface03/02/17 4.00 6,931.73 6,931.69 6,930.85 -0.04 6,913.24 18.45 6.42 1.17 7.59 6,924.10 6925.04 3 - 18 Chinle/Alluvium Interface06/07/17 4.00 6,931.73 6,931.69 6,930.85 -0.04 6,913.24 18.45 6.95 1.30 8.25 6,923.44 6924.48 3 - 18 Chinle/Alluvium Interface09/26/17 4.00 6,931.73 6,931.69 6,930.85 -0.04 6,913.24 18.45 6.35 0.80 7.15 6,924.54 6925.18 3 - 18 Chinle/Alluvium Interface11/28/17 4.00 6,931.73 6,931.69 6,930.85 -0.04 6,913.24 18.45 7.00 0.95 7.95 6923.74 6924.50 3 - 18 Chinle/Alluvium Interface02/08/18 4.00 6,931.73 6,931.69 6,930.85 -0.04 6,913.24 18.45 7.40 0.85 8.25 6923.44 6924.12 3 - 18 Chinle/Alluvium Interface04/25/18 4.00 6,931.73 6,931.69 6,930.85 -0.04 6,913.24 18.45 7.30 0.92 8.22 6923.47 6924.21 3 - 18 Chinle/Alluvium Interface08/16/18 4.00 6,931.73 6,931.69 6,930.85 -0.04 6,913.24 18.45 7.30 0.95 8.25 6923.44 6924.20 3 - 18 Chinle/Alluvium Interface
MKTF WELLS FLUID LEVEL MEASUREMENTSMARATHON PETROLEUM COMPANY - GALLUP REFINERY
MKTF-0101/21/14
MKTF-0201/21/14
MKTF-0301/21/14

Page 2 of 8
Date of Survey ¹
Well ID Number
Inspection or Sample Date
Casing Diameter
(Inch)
Ground Level
Elevations (ft)
Well Casing
Rim Elevations
(ft)
Ground Elevation
Inside Steel Sleeve
(ft)
Stick-up length
(ft)
Well Casing Bottom
Elevation (ft)
Total Well Depth
(ft)
Depth to ² SPH (ft)
SPH ³ Column
Thickness (ft)
Depth to Water
(ft)
Ground water
Elevation (ft)
Corrected ⁴ Water Table
Elevation (Factor 0.8) (ft)
Screened Interval
Depth Top to Bottom
(ft)
Stratigraphic unit in which screen exists
MKTF WELLS FLUID LEVEL MEASUREMENTSMARATHON PETROLEUM COMPANY - GALLUP REFINERY
2/24/2016 4.00 6,939.49 6,942.22 6,941.95 2.73 6,924.47 17.75 13.33 0.29 13.62 6,928.60 6928.83 4 - 14 Chinle/Alluvium Interface6/10/2016 4.00 6,939.49 6,942.22 6,941.95 2.73 6,924.47 17.75 13.79 0.46 14.25 6,927.97 6928.34 4 - 14 Chinle/Alluvium Interface9/7/2016 4.00 6,939.49 6,942.22 6,941.95 2.73 6,924.47 17.75 13.01 0.49 13.50 6,928.72 6929.11 4 - 14 Chinle/Alluvium Interface
10/28/2016 4.00 6,939.49 6,942.22 6,941.95 2.73 6,924.47 17.75 13.98 0.77 14.75 6,927.47 6928.09 4 - 14 Chinle/Alluvium Interface03/02/17 4.00 6,939.49 6,942.22 6,941.95 2.73 6,924.47 17.75 13.33 0.29 13.62 6,928.60 6928.83 4 - 14 Chinle/Alluvium Interface06/07/17 4.00 6,939.49 6,942.22 6,941.95 2.73 6,924.47 17.75 13.79 0.46 14.25 6,927.97 6928.34 4 - 14 Chinle/Alluvium Interface09/26/17 4.00 6,939.49 6,942.22 6,941.95 2.73 6,924.47 17.75 13.01 0.49 13.50 6,928.72 6929.11 4 - 14 Chinle/Alluvium Interface11/28/17 4.00 6,939.49 6,942.22 6,941.95 2.73 6,924.47 17.75 13.98 0.77 14.75 6,927.47 6928.09 4 - 14 Chinle/Alluvium Interface02/08/18 4.00 6,939.49 6,942.22 6,941.95 2.73 6,924.47 17.75 14.78 0.42 15.20 6,927.02 6927.36 4 - 14 Chinle/Alluvium Interface04/25/18 4.00 6,939.49 6,942.22 6,941.95 2.73 6,924.47 17.75 14.96 0.23 15.19 6,927.03 6927.21 4 - 14 Chinle/Alluvium Interface08/16/18 4.00 6,939.49 6,942.22 6,941.95 2.73 6,924.47 17.75 14.61 0.19 14.80 6,927.42 6927.57 4 - 14 Chinle/Alluvium Interface
2/24/2016 6,946.81 6,946.63 6,946.81 6,923.04 23.77 18.30 0.97 19.27 6,927.54 6928.32 8 - 20 Chinle/Alluvium Interface6/10/2016 6,946.81 6,946.63 6,946.81 6,923.04 23.77 18.02 0.94 18.96 6,927.85 6928.60 8 - 20 Chinle/Alluvium Interface9/7/2016 6,946.81 6,946.63 6,946.81 6,923.04 23.77 17.40 1.08 18.48 6,928.33 6929.19 8 - 20 Chinle/Alluvium Interface
10/28/2016 6,946.81 6,946.63 6,946.81 6,923.04 23.77 18.04 0.74 18.78 6,928.03 6928.62 8 - 20 Chinle/Alluvium Interface03/15/17 4.00 6,944.24 6,946.81 6,946.63 2.57 6,923.04 23.77 15.95 0.10 16.05 6,930.76 6930.84 8 - 20 Chinle/Alluvium Interface06/12/17 4.00 6,944.24 6,946.81 6,946.63 2.57 6,923.04 23.77 16.60 0.64 17.24 6,929.57 6930.08 8 - 20 Chinle/Alluvium Interface09/26/17 4.00 6,944.24 6,946.81 6,946.63 2.57 6,923.04 23.77 16.01 0.71 16.72 6,930.09 6930.66 8 - 20 Chinle/Alluvium Interface11/28/17 4.00 6,944.24 6,946.81 6,946.63 2.57 6,923.04 23.77 16.55 1.15 17.70 6,929.11 6930.03 8 - 20 Chinle/Alluvium Interface02/08/18 4.00 6,944.24 6,946.81 6,946.63 2.57 6,923.04 23.77 17.14 1.38 18.52 6,928.29 6929.39 8 - 20 Chinle/Alluvium Interface04/25/18 4.00 6,944.24 6,946.81 6,946.63 2.57 6,923.04 23.77 17.29 1.32 18.61 6,928.20 6929.26 8 - 20 Chinle/Alluvium Interface08/16/18 4.00 6,944.24 6,946.81 6,946.63 2.57 6,923.04 23.77 16.83 1.17 18.00 6,928.81 6929.75 8 - 20 Chinle/Alluvium Interface
2/24/2016 6,947.18 6,947.06 6,947.18 6,929.56 17.62 12.65 2.88 15.53 6,931.65 6933.95 4 - 14 Chinle/Alluvium Interface6/10/2016 6,947.18 6,947.06 6,947.18 6,929.56 17.62 12.01 2.59 14.60 6,932.58 6934.65 4 - 14 Chinle/Alluvium Interface9/7/2016 6,947.18 6,947.06 6,947.18 6,929.56 17.62 12.20 2.41 14.61 6,932.57 6934.50 4 - 14 Chinle/Alluvium Interface
10/28/2016 6,947.18 6,947.06 6,947.18 6,929.56 17.62 12.90 1.98 14.88 6,932.30 6933.88 4 - 14 Chinle/Alluvium Interface03/15/17 4.00 6,944.40 6,947.18 6,947.06 2.78 6,929.56 17.62 10.63 1.97 12.60 6,934.58 6936.16 4 - 14 Chinle/Alluvium Interface06/12/17 4.00 6,944.40 6,947.18 6,947.06 2.78 6,929.56 17.62 10.20 1.30 11.50 6,935.68 6936.72 4 - 14 Chinle/Alluvium Interface09/26/17 4.00 6,944.40 6,947.18 6,947.06 2.78 6,929.56 17.62 9.80 1.30 11.10 6,936.08 6937.12 4 - 14 Chinle/Alluvium Interface11/28/17 4.00 6,944.40 6,947.18 6,947.06 2.78 6,929.56 17.62 10.40 1.40 11.80 6,935.38 6936.50 4 - 14 Chinle/Alluvium Interface02/08/18 4.00 6,944.40 6,947.18 6,947.06 2.78 6,929.56 17.62 11.33 1.22 12.55 6,934.63 6935.61 4 - 14 Chinle/Alluvium Interface04/25/18 4.00 6,944.40 6,947.18 6,947.06 2.78 6,929.56 17.62 10.84 1.18 12.02 6,935.16 6936.10 4 - 14 Chinle/Alluvium Interface08/16/18 4.00 6,944.40 6,947.18 6,947.06 2.78 6,929.56 17.62 11.42 1.08 12.50 6,934.68 6935.54 4 - 14 Chinle/Alluvium Interface
MKTF-0601/21/14
MKTF-0701/21/14
MKTF-0501/21/14
Page 3 of 8
Date of Survey ¹
Well ID Number
Inspection or Sample Date
Casing Diameter
(Inch)
Ground Level
Elevations (ft)
Well Casing
Rim Elevations
(ft)
Ground Elevation
Inside Steel Sleeve
(ft)
Stick-up length
(ft)
Well Casing Bottom
Elevation (ft)
Total Well Depth
(ft)
Depth to ² SPH (ft)
SPH ³ Column
Thickness (ft)
Depth to Water
(ft)
Ground water
Elevation (ft)
Corrected ⁴ Water Table
Elevation (Factor 0.8) (ft)
Screened Interval
Depth Top to Bottom
(ft)
Stratigraphic unit in which screen exists
MKTF WELLS FLUID LEVEL MEASUREMENTSMARATHON PETROLEUM COMPANY - GALLUP REFINERY
2/24/2016 6,947.09 6,942.67 6,947.09 6,925.11 21.98 13.85 0.75 14.60 6,932.49 6933.09 8 - 18 Chinle/Alluvium Interface6/10/2016 6,947.09 6,942.67 6,947.09 6,925.11 21.98 13.48 0.70 14.18 6,932.91 6933.47 8 - 18 Chinle/Alluvium Interface9/7/2016 6,947.09 6,942.67 6,947.09 6,925.11 21.98 13.63 0.66 14.29 6,932.80 6933.33 8 - 18 Chinle/Alluvium Interface
10/28/2016 6,947.09 6,942.67 6,947.09 6,925.11 21.98 13.84 1.48 15.32 6,931.77 6932.95 8 - 18 Chinle/Alluvium Interface03/15/17 4.00 6,944.02 6,947.09 6,942.67 3.07 6,925.11 21.98 11.99 0.61 12.60 6,934.49 6934.98 8 - 18 Chinle/Alluvium Interface06/12/17 4.00 6,944.02 6,947.09 6,942.67 3.07 6,925.11 21.98 11.98 0.42 12.40 6,934.69 6935.03 8 - 18 Chinle/Alluvium Interface09/26/17 4.00 6,944.02 6,947.09 6,942.67 3.07 6,925.11 21.98 12.15 0.45 12.60 6,934.49 6934.85 8 - 18 Chinle/Alluvium Interface11/28/17 4.00 6,944.02 6,947.09 6,942.67 3.07 6,925.11 21.98 12.68 0.52 13.20 6,933.89 6934.31 8 - 18 Chinle/Alluvium Interface02/08/18 4.00 6,944.02 6,947.09 6,942.67 3.07 6,925.11 21.98 13.29 0.34 13.63 6,933.46 6933.73 8 - 18 Chinle/Alluvium Interface04/25/18 4.00 6,944.02 6,947.09 6,942.67 3.07 6,925.11 21.98 13.00 0.33 13.33 6,933.76 6934.02 8 - 18 Chinle/Alluvium Interface08/16/18 4.00 6,944.02 6,947.09 6,942.67 3.07 6,925.11 21.98 12.96 0.39 13.35 6,933.74 6934.05 8 - 18 Chinle/Alluvium Interface
2/24/2016 6,946.50 6,945.90 6,946.50 6,923.80 22.70 ND NA 14.15 6,932.35 NA 7 - 19 Chinle/Alluvium Interface6/10/2016 6,946.50 6,945.90 6,946.50 6,923.80 22.70 ND NA 13.92 6,932.58 NA 7 - 19 Chinle/Alluvium Interface9/7/2016 6,946.50 6,945.90 6,946.50 6,923.80 22.70 ND NA 14.20 6,932.30 NA 7 - 19 Chinle/Alluvium Interface
10/28/2016 6,946.50 6,945.90 6,946.50 6,923.80 22.70 ND NA 14.10 6,932.40 NA 7 - 19 Chinle/Alluvium Interface03/15/17 4.00 6,943.57 6,946.50 6,945.90 2.93 6,923.80 22.70 ND NA 12.64 6,933.86 NA 7 - 19 Chinle/Alluvium Interface06/12/17 4.00 6,943.57 6,946.50 6,945.90 2.93 6,923.80 22.70 ND NA 12.64 6,933.86 NA 7 - 19 Chinle/Alluvium Interface09/28/17 4.00 6,943.57 6,946.50 6,945.90 2.93 6,923.80 22.70 ND NA 12.69 6,933.81 NA 7 - 19 Chinle/Alluvium Interface11/29/17 4.00 6,943.57 6,946.50 6,945.90 2.93 6,923.75 22.75 ND NA 13.15 6,933.35 NA 7 - 19 Chinle/Alluvium Interface02/14/18 4.00 6,943.57 6,946.50 6,945.90 2.93 6,923.75 22.75 ND NA 13.76 6,932.74 NA 7 - 19 Chinle/Alluvium Interface04/25/18 4.00 6,943.57 6,946.50 6,945.90 2.93 6,923.75 22.75 ND NA 13.42 6,933.08 NA 7 - 19 Chinle/Alluvium Interface08/16/18 4.00 6,943.57 6,946.50 6,945.90 2.93 6,923.75 22.75 ND NA 13.49 6,933.01 NA 7 - 19 Chinle/Alluvium Interface
2/24/2016 4.00 6,937.51 6,937.16 6,936.63 -0.35 6,921.17 15.99 ND NA 8.60 6,928.56 NA 7 - 17 Chinle/Alluvium Interface6/10/2016 4.00 6,937.51 6,937.16 6,936.63 -0.35 6,921.17 15.99 ND NA 8.20 6,928.96 NA 7 - 17 Chinle/Alluvium Interface9/7/2016 4.00 6,937.51 6,937.16 6,936.63 -0.35 6,921.17 15.99 ND NA 8.45 6,928.71 NA 7 - 17 Chinle/Alluvium Interface
10/28/2016 4.00 6,937.51 6,937.16 6,936.63 -0.35 6,921.17 15.99 ND NA 8.25 6,928.91 NA 7 - 17 Chinle/Alluvium Interface03/02/17 4.00 6,937.51 6,937.16 6,936.63 -0.35 6,921.17 15.99 ND NA 7.47 6,929.69 NA 7 - 17 Chinle/Alluvium Interface06/07/17 4.00 6,937.51 6,937.16 6,936.63 -0.35 6,921.17 15.99 ND NA 7.02 6,930.14 NA 7 - 17 Chinle/Alluvium Interface09/27/17 4.00 6,937.51 6,937.16 6,936.63 -0.35 6,921.17 15.99 ND NA 6.78 6,930.38 NA 7 - 17 Chinle/Alluvium Interface11/29/17 4.00 6,937.51 6,937.16 6,936.63 -0.35 6,921.17 15.99 ND NA 7.00 6,930.16 NA 7 - 17 Chinle/Alluvium Interface02/14/18 4.00 6,937.51 6,937.16 6,936.63 -0.35 6,921.17 15.99 ND NA 7.30 6,929.86 NA 7 - 17 Chinle/Alluvium Interface04/25/18 4.00 6,937.51 6,937.16 6,936.63 -0.35 6,921.17 15.99 ND NA 7.05 6,930.11 NA 7 - 17 Chinle/Alluvium Interface08/16/18 4.00 6,937.51 6,937.16 6,936.63 -0.35 6,921.17 15.99 ND NA 7.08 6,930.08 NA 7 - 17 Chinle/Alluvium Interface
MKTF-0901/21/14
MKTF-1001/21/14
MKTF-0801/21/14

Page 4 of 8
Date of Survey ¹
Well ID Number
Inspection or Sample Date
Casing Diameter
(Inch)
Ground Level
Elevations (ft)
Well Casing
Rim Elevations
(ft)
Ground Elevation
Inside Steel Sleeve
(ft)
Stick-up length
(ft)
Well Casing Bottom
Elevation (ft)
Total Well Depth
(ft)
Depth to ² SPH (ft)
SPH ³ Column
Thickness (ft)
Depth to Water
(ft)
Ground water
Elevation (ft)
Corrected ⁴ Water Table
Elevation (Factor 0.8) (ft)
Screened Interval
Depth Top to Bottom
(ft)
Stratigraphic unit in which screen exists
MKTF WELLS FLUID LEVEL MEASUREMENTSMARATHON PETROLEUM COMPANY - GALLUP REFINERY
2/24/2016 4.00 6,931.61 6,931.34 6,930.86 -0.27 6,913.20 18.14 ND NA 8.80 6,922.54 NA 8 - 18 Chinle/Alluvium Interface6/10/2016 4.00 6,931.61 6,931.34 6,930.86 -0.27 6,913.20 18.14 ND NA 8.66 6,922.68 NA 8 - 18 Chinle/Alluvium Interface9/7/2016 4.00 6,931.61 6,931.34 6,930.86 -0.27 6,913.20 18.14 ND NA 8.70 6,922.64 NA 8 - 18 Chinle/Alluvium Interface
10/28/2016 4.00 6,931.61 6,931.34 6,930.86 -0.27 6,913.20 18.14 ND NA 8.65 6,922.69 NA 8 - 18 Chinle/Alluvium Interface03/02/17 4.00 6,931.61 6,931.34 6,930.86 -0.27 6,913.20 18.14 ND NA 6.96 6,924.38 NA 8 - 18 Chinle/Alluvium Interface06/07/17 4.00 6,931.61 6,931.34 6,930.86 -0.27 6,913.20 18.14 ND NA 7.39 6,923.95 NA 8 - 18 Chinle/Alluvium Interface09/26/17 4.00 6,931.61 6,931.34 6,930.86 -0.27 6,913.20 18.14 ND NA 6.70 6,924.64 NA 8 - 18 Chinle/Alluvium Interface11/29/17 4.00 6,931.61 6,931.34 6,930.86 -0.27 6,913.20 18.14 ND NA 8.00 6,923.34 NA 8 - 18 Chinle/Alluvium Interface02/08/18 4.00 6,931.61 6,931.34 6,930.86 -0.27 6,913.20 18.14 ND NA 7.87 6,923.47 NA 8 - 18 Chinle/Alluvium Interface04/25/18 4.00 6,931.61 6,931.34 6,930.86 -0.27 6,913.20 18.14 ND NA 7.85 6,923.49 NA 8 - 18 Chinle/Alluvium Interface08/16/18 4.00 6,931.61 6,931.34 6,930.86 -0.27 6,913.20 18.14 ND NA 7.48 6,923.86 NA 8 - 18 Chinle/Alluvium Interface
2/24/2016 4.00 6,939.70 6,942.11 6,941.88 2.41 6,916.51 25.60 19.80 0.65 20.45 6,921.66 6922.18 12 - 22 Chinle/Alluvium Interface6/10/2016 4.00 6,939.70 6,942.11 6,941.88 2.41 6,916.51 25.60 18.23 1.32 19.55 6,922.56 6923.62 12 - 22 Chinle/Alluvium Interface9/7/2016 4.00 6,939.70 6,942.11 6,941.88 2.41 6,916.51 25.60 19.23 0.32 19.55 6,922.56 6922.82 12 - 22 Chinle/Alluvium Interface
10/28/2016 4.00 6,939.70 6,942.11 6,941.88 2.41 6,916.51 25.60 19.33 0.29 19.62 6,922.49 6922.72 12 - 22 Chinle/Alluvium Interface03/15/17 4.00 6,939.70 6,942.11 6,941.88 2.41 6,916.51 25.60 17.75 0.06 17.81 6,924.30 6924.35 12 - 22 Chinle/Alluvium Interface06/07/17 4.00 6,939.70 6,942.11 6,941.88 2.41 6,916.51 25.60 18.60 0.19 18.79 6,923.32 6923.47 12 - 22 Chinle/Alluvium Interface10/03/17 4.00 6,939.70 6,942.11 6,941.88 2.41 6,916.51 25.60 17.30 0.13 17.43 6,924.68 6924.78 12 - 22 Chinle/Alluvium Interface11/27/17 4.00 6,939.70 6,942.11 6,941.88 2.41 6,916.51 25.60 18.43 0.13 18.56 6,923.55 6923.65 12 - 22 Chinle/Alluvium Interface02/07/18 4.00 6,939.70 6,942.11 6,941.88 2.41 6,916.51 25.60 19.11 0.17 19.28 6,922.83 6922.97 12 - 22 Chinle/Alluvium Interface04/25/18 4.00 6,939.70 6,942.11 6,941.88 2.41 6,916.51 25.60 19.11 0.12 19.23 6,922.88 6922.98 12 - 22 Chinle/Alluvium Interface08/15/18 4.00 6,939.70 6,942.11 6,941.88 2.41 6,916.51 25.60 19.01 0.19 19.20 6,922.91 6923.06 12 - 22 Chinle/Alluvium Interface
2/24/2016 4.00 6,933.67 6,935.18 6,934.83 1.51 6,913.93 21.25 14.42 0.87 15.29 6,919.89 NA 8 - 18 Chinle/Alluvium Interface6/10/2016 4.00 6,933.67 6,935.18 6,934.83 1.51 6,913.93 21.25 12.99 1.20 14.19 6,920.99 NA 8 - 18 Chinle/Alluvium Interface9/7/2016 4.00 6,933.67 6,935.18 6,934.83 1.51 6,913.93 21.25 13.88 0.98 14.86 6,920.32 NA 8 - 18 Chinle/Alluvium Interface
10/28/2016 4.00 6,933.67 6,935.18 6,934.83 1.51 6,913.93 21.25 14.01 0.96 14.97 6,920.21 NA 8 - 18 Chinle/Alluvium Interface03/15/17 4.00 6,933.67 6,935.18 6,934.83 1.51 6,913.93 21.25 ND NA 12.60 6,922.58 NA 8 - 18 Chinle/Alluvium Interface06/07/17 4.00 6,933.67 6,935.18 6,934.83 1.51 6,913.93 21.25 13.35 0.06 13.41 6,921.77 6921.82 8 - 18 Chinle/Alluvium Interface10/03/17 4.00 6,933.67 6,935.18 6,934.83 1.51 6,913.93 21.25 11.91 0.03 11.94 6,923.24 6923.26 8 - 18 Chinle/Alluvium Interface11/27/17 4.00 6,933.67 6,935.18 6,934.83 1.51 6,913.93 21.25 13.14 0.01 13.15 6,922.03 6922.04 8 - 18 Chinle/Alluvium Interface02/07/18 4.00 6,933.67 6,935.18 6,934.83 1.51 6,913.93 21.25 13.77 0.01 13.78 6,921.40 6921.41 8 - 18 Chinle/Alluvium Interface04/25/18 4.00 6,933.67 6,935.18 6,934.83 1.51 6,913.93 21.25 ND NA 13.25 6,921.93 NA 8 - 18 Chinle/Alluvium Interface08/15/18 4.00 6,933.67 6,935.18 6,934.83 1.51 6,913.93 21.25 ND NA 13.68 6,921.50 NA 8 - 18 Chinle/Alluvium Interface
MKTF-1201/21/14
MKTF-1301/21/14
MKTF-1101/21/14

Page 5 of 8
Date of Survey ¹
Well ID Number
Inspection or Sample Date
Casing Diameter
(Inch)
Ground Level
Elevations (ft)
Well Casing
Rim Elevations
(ft)
Ground Elevation
Inside Steel Sleeve
(ft)
Stick-up length
(ft)
Well Casing Bottom
Elevation (ft)
Total Well Depth
(ft)
Depth to ² SPH (ft)
SPH ³ Column
Thickness (ft)
Depth to Water
(ft)
Ground water
Elevation (ft)
Corrected ⁴ Water Table
Elevation (Factor 0.8) (ft)
Screened Interval
Depth Top to Bottom
(ft)
Stratigraphic unit in which screen exists
MKTF WELLS FLUID LEVEL MEASUREMENTSMARATHON PETROLEUM COMPANY - GALLUP REFINERY
2/24/2016 4.00 6,925.65 6,928.02 6,927.80 2.37 6,910.56 17.46 7.81 0.44 8.25 6,919.77 6920.12 4 - 14 Chinle/Alluvium Interface6/10/2016 4.00 6,925.65 6,928.02 6,927.80 2.37 6,910.56 17.46 7.13 2.33 9.46 6,918.56 6920.42 4 - 14 Chinle/Alluvium Interface9/7/2016 4.00 6,925.65 6,928.02 6,927.80 2.37 6,910.56 17.46 7.31 1.69 9.00 6,919.02 6920.37 4 - 14 Chinle/Alluvium Interface
10/28/2016 4.00 6,925.65 6,928.02 6,927.80 2.37 6,910.56 17.46 7.45 1.10 8.55 6,919.47 6920.35 4 - 14 Chinle/Alluvium Interface03/08/17 4.00 6,925.65 6,928.02 6,927.80 2.37 6,910.56 17.46 5.77 0.98 6.75 6,921.27 6922.05 4 - 14 Chinle/Alluvium Interface06/07/17 4.00 6,925.65 6,928.02 6,927.80 2.37 6,910.56 17.46 6.68 0.84 7.52 6,920.50 6921.17 4 - 14 Chinle/Alluvium Interface10/03/17 4.00 6,925.65 6,928.02 6,927.80 2.37 6,910.56 17.46 5.70 0.41 6.11 6,921.91 6922.24 4 - 14 Chinle/Alluvium Interface11/27/17 4.00 6,925.65 6,928.02 6,927.80 2.37 6,910.56 17.46 6.56 0.37 6.93 6,921.09 6921.39 4 - 14 Chinle/Alluvium Interface02/07/18 4.00 6,925.65 6,928.02 6,927.80 2.37 6,910.56 17.46 6.98 0.41 7.39 6,920.63 6920.96 4 - 14 Chinle/Alluvium Interface04/26/18 4.00 6,925.65 6,928.02 6,927.80 2.37 6,910.56 17.46 7.01 0.38 7.39 6,920.63 6920.93 4 - 14 Chinle/Alluvium Interface08/15/18 4.00 6,925.65 6,928.02 6,927.80 2.37 6,910.56 17.46 6.95 0.35 7.30 6,920.72 6921.00 4 - 14 Chinle/Alluvium Interface
2/24/2016 2.00 6,943.74 6,943.48 6,943.19 -0.26 6,924.00 19.48 12.23 0.17 12.40 6,931.08 NA 9 - 19 Chinle/Alluvium Interface6/10/2016 2.00 6,943.74 6,943.48 6,943.19 -0.26 6,924.00 19.48 12.60 0.22 12.82 6,930.66 NA 9 - 19 Chinle/Alluvium Interface9/7/2016 2.00 6,943.74 6,943.48 6,943.19 -0.26 6,924.00 19.48 ND ND 13.00 6,930.48 NA 9 - 19 Chinle/Alluvium Interface
10/28/2016 2.00 6,943.74 6,943.48 6,943.19 -0.26 6,924.00 19.48 ND ND 12.90 6,930.58 NA 9 - 19 Chinle/Alluvium Interface03/02/17 2.00 6,943.74 6,943.48 6,943.19 -0.26 6,924.00 19.48 ND NA 12.15 6,931.33 NA 9 - 19 Chinle/Alluvium Interface06/07/17 2.00 6,943.74 6,943.48 6,943.19 -0.26 6,924.00 19.48 ND NA 11.93 6,931.55 NA 9 - 19 Chinle/Alluvium Interface09/26/17 2.00 6,943.74 6,943.48 6,943.19 -0.26 6,924.00 19.48 12.00 0.10 12.10 6,931.38 6931.46 9 - 19 Chinle/Alluvium Interface11/29/17 2.00 6,943.74 6,943.48 6,943.19 -0.26 6,924.00 19.48 ND NA 12.13 6,931.35 NA 9 - 19 Chinle/Alluvium Interface02/08/18 2.00 6,943.74 6,943.48 6,943.19 -0.26 6,924.00 19.48 12.40 0.07 12.47 6,931.01 6931.07 9 - 19 Chinle/Alluvium Interface04/25/18 2.00 6,943.74 6,943.48 6,943.19 -0.26 6,924.00 19.48 ND NA 12.20 6,931.28 NA 9 - 19 Chinle/Alluvium Interface08/16/18 2.00 6,943.74 6,943.48 6,943.19 -0.26 6,924.00 19.48 ND NA 12.40 6,931.08 NA 9 - 19 Chinle/Alluvium Interface03/14/17 2.00 6,950.97 6,950.65 6,950.17 -0.32 6,925.27 25.38 ND NA 8.34 6,942.31 NA 17 - 27 Chinle/Alluvium Interface06/07/17 2.00 6,950.97 6,950.65 6,950.17 -0.32 6,925.27 25.38 ND NA 11.85 6,938.80 NA 17 - 27 Chinle/Alluvium Interface09/26/17 2.00 6,950.97 6,950.65 6,950.17 -0.32 6,925.27 25.38 ND NA 7.75 6,942.90 NA 17 - 27 Chinle/Alluvium Interface11/28/17 2.00 6,950.97 6,950.65 6,950.17 -0.32 6,925.27 25.38 ND NA 7.50 6,943.15 NA 17 - 27 Chinle/Alluvium Interface03/01/17 2.00 6,950.97 6,950.65 6,950.17 -0.32 6,925.27 25.38 ND NA 7.81 6,942.84 NA 17 - 27 Chinle/Alluvium Interface06/14/17 2.00 6,950.97 6,950.65 6,950.17 -0.32 6,925.27 25.38 ND NA 6.30 6,944.35 NA 17 - 27 Chinle/Alluvium Interface09/27/17 2.00 6,950.97 6,950.65 6,950.17 -0.32 6,925.27 25.38 6.35 0.02 6.37 6,944.28 6944.30 17 - 27 Chinle/Alluvium Interface11/30/17 2.00 6,950.97 6,950.65 6,950.17 -0.32 6,925.27 25.38 6.29 0.01 6.30 6,944.35 6944.36 17 - 27 Chinle/Alluvium Interface02/15/18 2.00 6,950.97 6,950.65 6,950.17 -0.32 6,925.27 25.38 ND NA 6.47 6,944.18 NA 17 - 27 Chinle/Alluvium Interface04/26/18 2.00 6,950.97 6,950.65 6,950.17 -0.32 6,925.27 25.38 ND NA 8.22 6,942.43 NA 17 - 27 Chinle/Alluvium Interface08/16/18 2.00 6,950.97 6,950.65 6,950.17 -0.32 6,925.27 25.38 ND NA 7.12 6,943.53 NA 17 - 27 Chinle/Alluvium Interface
MKTF-1501/21/14
MKTF-1801/21/14
MKTF-1401/21/14

Page 6 of 8
Date of Survey ¹
Well ID Number
Inspection or Sample Date
Casing Diameter
(Inch)
Ground Level
Elevations (ft)
Well Casing
Rim Elevations
(ft)
Ground Elevation
Inside Steel Sleeve
(ft)
Stick-up length
(ft)
Well Casing Bottom
Elevation (ft)
Total Well Depth
(ft)
Depth to ² SPH (ft)
SPH ³ Column
Thickness (ft)
Depth to Water
(ft)
Ground water
Elevation (ft)
Corrected ⁴ Water Table
Elevation (Factor 0.8) (ft)
Screened Interval
Depth Top to Bottom
(ft)
Stratigraphic unit in which screen exists
MKTF WELLS FLUID LEVEL MEASUREMENTSMARATHON PETROLEUM COMPANY - GALLUP REFINERY
02/25/16 2.00 6,927.23 6,929.98 6,925.79 2.75 6,909.62 20.36 ND NA 14.67 6,915.31 NA 7 - 17 Chinle/Alluvium Interface06/10/16 2.00 6,927.23 6,929.98 6,925.79 2.75 6,909.62 20.36 ND NA 14.64 6,915.34 NA 7 - 17 Chinle/Alluvium Interface09/10/16 2.00 6,927.23 6,929.98 6,925.79 2.75 6,909.62 20.36 15.04 0.11 15.15 6,914.83 6914.92 7 - 17 Chinle/Alluvium Interface11/01/16 2.00 6,927.23 6,929.98 6,925.79 2.75 6,909.62 20.36 14.80 0.12 14.92 6,915.06 6915.16 7 - 17 Chinle/Alluvium Interface03/08/17 2.00 6,927.23 6,929.98 6,925.79 2.75 6,909.62 20.36 ND NA 14.20 6,915.78 NA 7 - 17 Chinle/Alluvium Interface06/07/17 2.00 6,927.23 6,929.98 6,925.79 2.75 6,909.62 20.36 14.20 0.70 14.90 6,915.08 6915.64 7 - 17 Chinle/Alluvium Interface10/03/17 2.00 6,927.23 6,929.98 6,925.79 2.75 6,909.62 20.36 14.19 0.06 14.25 6,915.73 6915.78 7 - 17 Chinle/Alluvium Interface11/27/17 2.00 6,927.23 6,929.98 6,925.79 2.75 6,909.62 20.36 13.93 0.01 13.94 6,916.04 6916.05 7 - 17 Chinle/Alluvium Interface02/07/18 2.00 6,927.23 6,929.98 6,925.79 2.75 6,909.62 20.36 14.11 0.09 14.20 6,915.78 6915.85 7 - 17 Chinle/Alluvium Interface04/26/18 2.00 6,927.23 6,929.98 6,925.79 2.75 6,909.62 20.36 14.07 0.02 14.09 6,915.89 6915.91 7 - 17 Chinle/Alluvium Interface08/15/18 2.00 6,927.23 6,929.98 6,925.79 2.75 6,909.62 20.36 15.48 0.10 15.58 6,914.40 6914.48 7 - 17 Chinle/Alluvium Interface02/25/16 2.00 6,926.07 6,928.72 6,924.62 2.65 6,898.25 30.47 ND NA 21.34 6,907.38 NA 18 - 28 Chinle/Alluvium Interface06/10/16 2.00 6,926.07 6,928.72 6,924.62 2.65 6,898.25 30.47 ND NA 21.23 6,907.49 NA 18 - 28 Chinle/Alluvium Interface09/10/16 2.00 6,926.07 6,928.72 6,924.62 2.65 6,898.25 30.47 ND NA 22.69 6,906.03 NA 18 - 28 Chinle/Alluvium Interface11/01/16 2.00 6,926.07 6,928.72 6,924.62 2.65 6,898.25 30.47 ND NA 22.34 6,906.38 NA 18 - 28 Chinle/Alluvium Interface03/06/17 2.00 6,926.07 6,928.72 6,924.62 2.65 6,898.25 30.47 ND NA 20.61 6,908.11 NA 18 - 28 Chinle/Alluvium Interface06/05/17 2.00 6,926.07 6,928.72 6,924.62 2.65 6,898.25 30.47 ND NA 21.07 6,907.65 NA 18 - 28 Chinle/Alluvium Interface10/03/17 2.00 6,926.07 6,928.72 6,924.62 2.65 6,898.25 30.47 ND NA 21.52 6,907.20 NA 18 - 28 Chinle/Alluvium Interface11/20/17 2.00 6,926.07 6,928.72 6,924.62 2.65 6,897.90 30.82 ND NA 21.53 6,907.19 NA 18 - 28 Chinle/Alluvium Interface02/06/18 2.00 6,926.07 6,928.72 6,924.62 2.65 6,897.90 30.82 ND NA 21.60 6,907.12 NA 18 - 28 Chinle/Alluvium Interface04/25/18 2.00 6,926.07 6,928.72 6,924.62 2.65 6,897.90 30.82 ND NA 21.76 6,906.96 NA 18 - 28 Chinle/Alluvium Interface08/15/18 2.00 6,926.07 6,928.72 6,924.62 2.65 6,897.90 30.82 ND NA 22.65 6,906.07 NA 18 - 28 Chinle/Alluvium Interface02/25/16 2.00 6,912.55 6,915.31 6,911.35 2.76 6,898.16 17.15 ND NA 8.17 6,907.14 NA 4 - 14 Chinle/Alluvium Interface06/10/16 2.00 6,912.55 6,915.31 6,911.35 2.76 6,898.16 17.15 ND NA 9.60 6,905.71 NA 4 - 14 Chinle/Alluvium Interface09/10/16 2.00 6,912.55 6,915.31 6,911.35 2.76 6,898.16 17.15 9.44 1.37 10.81 6,904.50 6905.60 4 - 14 Chinle/Alluvium Interface11/01/16 2.00 6,912.55 6,915.31 6,911.35 2.76 6,898.16 17.15 9.36 1.39 10.75 6,904.56 6905.67 4 - 14 Chinle/Alluvium Interface03/06/17 2.00 6,912.55 6,915.31 6,911.35 2.76 6,898.16 17.15 7.44 0.75 8.19 6,907.12 6907.72 4 - 14 Chinle/Alluvium Interface06/05/17 2.00 6,912.55 6,915.31 6,911.35 2.76 6,898.16 17.15 8.03 0.96 8.99 6,906.32 6907.09 4 - 14 Chinle/Alluvium Interface10/03/17 2.00 6,912.55 6,915.31 6,911.35 2.76 6,898.16 17.15 7.77 0.83 8.60 6,906.71 6907.37 4 - 14 Chinle/Alluvium Interface11/20/17 2.00 6,912.55 6,915.31 6,911.35 2.76 6,898.16 17.15 8.09 0.84 8.93 6,906.38 6907.05 4 - 14 Chinle/Alluvium Interface02/07/18 2.00 6,912.55 6,915.31 6,911.35 2.76 6,898.16 17.15 8.53 0.83 9.36 6,905.95 6906.61 4 - 14 Chinle/Alluvium Interface04/25/18 2.00 6,912.55 6,915.31 6,911.35 2.76 6,898.16 17.15 8.56 0.81 9.37 6,905.94 6906.59 4 - 14 Chinle/Alluvium Interface08/15/18 2.00 6,912.55 6,915.31 6,911.35 2.76 6,898.16 17.15 8.73 0.84 9.57 6,905.74 6906.41 4 - 14 Chinle/Alluvium Interface
MKTF-2404/30/14
MKTF-2604/30/14
MKTF-2304/30/14

Page 8 of 8
Date of Survey ¹
Well ID Number
Inspection or Sample Date
Casing Diameter
(Inch)
Ground Level
Elevations (ft)
Well Casing
Rim Elevations
(ft)
Ground Elevation
Inside Steel Sleeve
(ft)
Stick-up length
(ft)
Well Casing Bottom
Elevation (ft)
Total Well Depth
(ft)
Depth to ² SPH (ft)
SPH ³ Column
Thickness (ft)
Depth to Water
(ft)
Ground water
Elevation (ft)
Corrected ⁴ Water Table
Elevation (Factor 0.8) (ft)
Screened Interval
Depth Top to Bottom
(ft)
Stratigraphic unit in which screen exists
MKTF WELLS FLUID LEVEL MEASUREMENTSMARATHON PETROLEUM COMPANY - GALLUP REFINERY
DEFINITIONS:DTB - Depth to Bottom Negative number in Stick up Length column indicates well is flush mount and located at or below ground levelDTW - Depth to Water Depth to Water Column - if a measurement of 0.00 is indicated - means water level is at top of casing - Full. ND - Not Dectected Dry indicates no water was detected in the well.NA - Not ApplicableSPH - Separate Phase Hydrocarbons
NOTES:1) Wells surveyed by a licensed professional surveyor-Hammon Enterprises, Inc. (HEI)2) "0" indicates no SPH level.3) Depth to SPH - Depth to Water Measurement = SPH Column Thickness.4) Corrected Water Table Elevaton applies only if SPH thickness column measurement exists. (0.8 X SPH thickness + Groundwater Elevation)5) 10/3/17 - Samples collected after end of third quarter due to rain storms and monitor well accessibility

0
0.5
1
1.5
2
2.5
3
3.5
4
4.5
PSH Measured Thickness (ft)
Measurement Date
PSH MEASURED THICKNESS
MKTF‐01
MKTF‐03
MKTF‐05
MKTF‐06
MKTF‐07
MKTF‐08
MKTF‐12
MKTF‐13
MKTF‐14
MKTF‐15
MKTF‐23
MKTF‐26
6905
6910
6915
6920
6925
6930
6935
6940
Potentiometric
Surface (ft‐msl)
Measurement Date
POTENTIOMETRIC SURFACE
MKTF‐01
MKTF‐03
MKTF‐05
MKTF‐06
MKTF‐07
MKTF‐08
MKTF‐12
MKTF‐13
MKTF‐14
MKTF‐15
MKTF‐23
MKTF‐26

QUARTERLY STATUS REPORT HYRODROCARBON SEEP INTERIM MEASURES
WESTERN REFINING SOUTHWEST, INC – GALLUP REFINERY Second Quarter 2018 (Revised November 2018)
Activities conducted during second quarter 2018
Source Control – Western continued to remove separate-phase hydrocarbon (SPH) and groundwater from the standpipe sumps (S1 - S6). Approximately 9 gallons of SPH and 28,491 gallons of groundwater were recovered during the second quarter, which represents a significant reduction in SPH from 153 gallons recovered during the last quarter (1st Qtr 2018). The percent of SPH recovered of the total volume was approximately, 0.03% which is significantly less than the previous quarter of 0.16%. This represents a fairly continuous reduction in the amount of SPH recovered since 2016. Recovery was discontinued at the retention ditch, which was previously excavated north of the standpipes (S1-S6), as product was no longer observed to be entering the retention ditch.
The reduction in the volumes of SPH recovered in the second quarter of 2018 as compared to the previous quarterly volumes is not attributed to any changes in the methods used to estimate the recovery volumes. The reduction in recovery volumes as compared to previous quarters is reflected the measured SPH thickness in nearby monitoring wells (see the enclosed table and graphs showing fluid level measurements). For example, the SPH thickness in MKTF-01, which is immediately west of the sumps, was measured at 1.5 feet in September 2016 vs. 0.30 feet in April 2018. Up-gradient of sumps, at MKTF-03, the measured SPH thickness decreased from 4.28 feet in June 2016 to 0.92 feet in April 2018. Further away from the sumps and retention ditch, the reduction in measured SPH has been less apparent, such as in well MKTF-05, where the SPH thickness reduced from maximum measurements of 0.77 feet in October 2016 and November 2017 to 0.23 feet in April 2018. Obviously, individual measurements of SPH in any given monitoring well may be influenced by fluctuations in the potentiometric surface in addition to any effects of hydrocarbon recovery at the sumps and/or retention ditch.
Camera Surveys – Western is evaluating the reliance upon dye tracer tests instead of more camera surveys, as earlier camera surveys were not as useful as tracer tests in locating leaks from subsurface pipelines.
Dye Tracer Tests – Western previously conducted dye tracer tests at several locations near the Truck Loading Rack. The earlier test methods and results were reviewed to determine if it is possible to refine the earlier tests by locating additional points where a tracer may be introduced to the wastewater pipelines/sump. New dye tracer tests were conducted related to an assessment of the sanitary lagoon, which is located west of the hydrocarbon seep area, and this information is presented under separate cover, (letter dated February 1, 2018 with reference to Sanitary Lagoon Investigation), as it was not focused on the hydrocarbon seeps.
Photos of the retention ditch are included that show hydrocarbon staining on the vegetation surrounding the ditch but notno significant accumulation of hydrocarbon on the water surface.

A table is included that shows fluid level measurements (2016 through 3rd Quarter 2018)
for MKTF wells in the area of the sumps and retention ditch that have contained SPH. The data is also presented in a graph. Overall, the measured thickness of SPH has decreased in most wells with the exception of MKTF-06, which showed a decrease through March 2017 and then an increase with the thickness stabilizing in February 2018. Measurable SPH first appears in September 2016 in MKTF-26 and then decreases by March 2017 with measurements stabil since that time without a noticeable declinestabile since that time without a noticeable decline. Also presented is the potentiometric surface measured in the same wells. In some cases, there does appear to a possible correlation between the potentiometric surface and the measured SPH thickness, such as shown in well MKTF-06, where the measured SPH thickness increase as the potentiometric surface decreases.
Activities planned for third quarter 2018
Source Control – Western will continue current recovery operations at the standpipe sumps and the retention ditch, if hydrocarbons are present, using a vacuum truck to pump SPH and groundwater from each of the sumps and the downstream retention ditch.
Formatted: Indent: Left: 0.5", No bullets or numbering


![Ol41-6588 ' .~ , , - Digital Himalaya: Homehimalaya.socanth.cam.ac.uk/collections/journals/chowkidar/pdf/... · Sit Jolin '.CPl,ton. ICCMG. OB[ Mr'. ] ,.1:. l{i. ... job it, be the](https://img.dokumen.tips/doc/110x75/5cc289dc88c99315158e0202/ol41-6588-digital-himalaya-sit-jolin-cplton-iccmg-ob-mr.jpg)