Embed Size (px)
Citation preview

TCD8, 2403–2424, 2014
Surface depressions(Lacunas) on Bering
Glacier, Alaska
P. J. Fleisher
Title Page
Abstract Introduction
Conclusions References
Tables Figures
J I
J I
Back Close
Full Screen / Esc
Printer-friendly Version
Interactive Discussion
Discussion
Paper
|D
iscussionP
aper|
Discussion
Paper
|D
iscussionP
aper|
The Cryosphere Discuss., 8, 2403–2424, 2014www.the-cryosphere-discuss.net/8/2403/2014/doi:10.5194/tcd-8-2403-2014© Author(s) 2014. CC Attribution 3.0 License.
Open A
ccess
The CryosphereDiscussions
This discussion paper is/has been under review for the journal The Cryosphere (TC).Please refer to the corresponding final paper in TC if available.
Surface depressions (Lacunas) on BeringGlacier, Alaska: a product of downwastingthrough differential ablationP. J. Fleisher
Earth Sciences, SUNY-Oneonta, Oneonta, NY 13820, USA
Received: 1 March 2014 – Accepted: 24 March 2014 – Published: 12 May 2014
Correspondence to: P. J. Fleisher ([email protected])
Published by Copernicus Publications on behalf of the European Geosciences Union.
2403

TCD8, 2403–2424, 2014
Surface depressions(Lacunas) on Bering
Glacier, Alaska
P. J. Fleisher
Title Page
Abstract Introduction
Conclusions References
Tables Figures
J I
J I
Back Close
Full Screen / Esc
Printer-friendly Version
Interactive Discussion
Discussion
Paper
|D
iscussionP
aper|
Discussion
Paper
|D
iscussionP
aper|
Abstract
Bering Glacier lacunas are steep-sided, flat-floored hollows ranging in size from 40 to60 m wide, 80 to 120 m long, and 35 to 50 m in deep. They are confined within a band ofclean ice (1.5 km wide, 5 km long) paralleling the eastern margin of the Bering piedmontlobe. The 1993–1995 surge displaced the lacuna band several kilometers onto the5
foreland. Specifically significant is the formation of a new band of lacunas 5–6 yearslater in the same location occupied by the displaced band prior to the surge.
Conditions essential to lacuna formation were initiated during the surge as overridingice was thrust into position across the trend of a subglacial trough, leading to stagnationof ice within the trough. Stagnation combined with saturation at depth altered ice texture10
and density. Exposure of this ice through normal ablation led to areas of differentialablation and the formation of lacunas.
1 Introduction
The term “lacuna” seldom appears in the literature. Sturm (1987) suggests lacunasmay be associated with glaciers that surge, which would apply to the Bering where15
an anomalous band of more than one hundred lacunas appears on a segment ofdebris-free ice confined between folded debris bands near the eastern terminus of thepiedmont lobe
∫. Although similar in size and shape to sink-holes that develop within
debris-covered, stagnant-ice commonly referred to a “glacier karst”, Bering Glacier la-cunas form within clean ice and are not associated with any collapse features typical20
of glacier karst (Clayton, 1964). They are steep-walled, bowl-shaped cavities that lackthe vertical conduit drainage typical of moulin. Instead they have gently sloping floorsthrough which melt water seeps downward via fractures.
Of specific significance here is that after being displaced several kilometers bya surge event, the lacuna band forms anew within 5–6 years in exactly the same origi-25
2404

TCD8, 2403–2424, 2014
Surface depressions(Lacunas) on Bering
Glacier, Alaska
P. J. Fleisher
Title Page
Abstract Introduction
Conclusions References
Tables Figures
J I
J I
Back Close
Full Screen / Esc
Printer-friendly Version
Interactive Discussion
Discussion
Paper
|D
iscussionP
aper|
Discussion
Paper
|D
iscussionP
aper|
nal location as the previously existing displaced band. During this interval, downwastingremoved 55 m (182 feet) of surge-thickened ice.
The purpose of this paper is to explain the emergence of newly formed lacunas andto propose conditions favorable for their formation.
2 Lacuna band location and description5
The eastern margin of the Bering piedmont lobe contains multiple debris bands tightlyfolded and kinked by past surge events (Post, 1972). Between folds, and in conspicuouscontrast to the glacier surface elsewhere, is a linear band of lacunas (1.5 km wideand 5 km long). The lacunas occupy ice that is entirely free of debris, unlike similardepressions found within the heavily mantled, massive medial moraine between the10
Steller and Bering lobes (Fig. 1). The lacuna band is prominent and conspicuous onthe up-glacier side of Arrowhead Island between Vitus Lake and Tsiu Lake.
A review of US Geological Survey aerial photos, early photos by Bradford Washburn,and subsequent photos by Austin Post indicate the persistence of a lacunas band dat-ing back to the surge of 1938–1940. When fully developed the band consists of ap-15
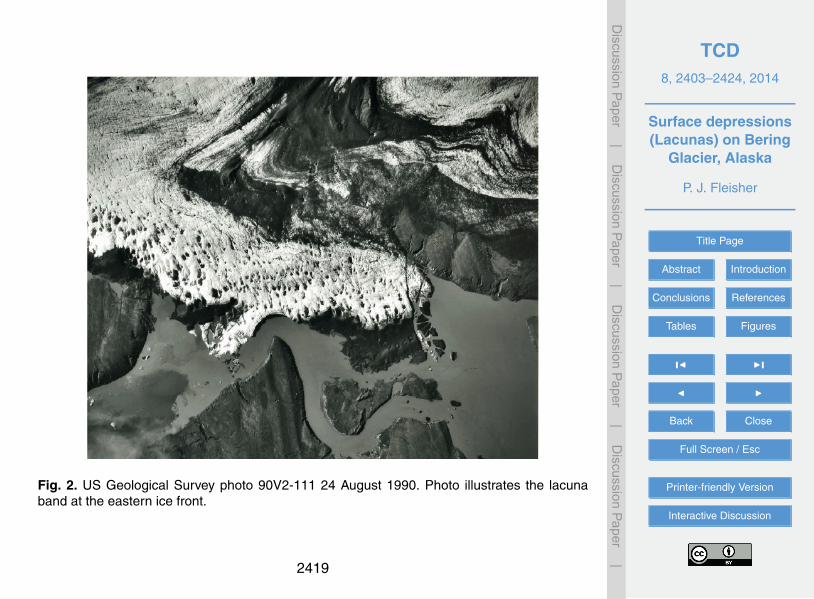
proximately 150 lacunas, each large enough to be prominent on aerial photos (Fig. 2).Although the general distribution appears random, groups of 10–15 are locally alignedalong a SW–NE trend, whereas others favor a subtle NW–SE trend. The entire bandencompasses an area of 6 to 7 km2. Nowhere else on the entire 100 km2 of the activeBering piedmont lobe are lacunas present.20
Many lacunas appear circular, although the majority are slightly oblate with the longaxis oriented in the up-glacier direction and parallel to a prominent fracture pattern.Although they vary significantly in size and relief, they are commonly 40 to 60 m wide,80 to 120 m long, and 35 to 50 m deep. Lacuna walls are steeply inclined between 20◦
and 40◦ descending from a broad crowning rim to a gently concave floor (Fig. 3).25
Englacial structures are clearly represented 3-dimentionally within lacuna walls, in-cluding normal foliation, surge-related thrust planes, fractures, and sparse debris filled
2405

TCD8, 2403–2424, 2014
Surface depressions(Lacunas) on Bering
Glacier, Alaska
P. J. Fleisher
Title Page
Abstract Introduction
Conclusions References
Tables Figures
J I
J I
Back Close
Full Screen / Esc
Printer-friendly Version
Interactive Discussion
Discussion
Paper
|D
iscussionP
aper|
Discussion
Paper
|D
iscussionP
aper|
hydrofractures (Fleisher et al., 2010). Foliation strikes NE–SW and dips moderatelyup-glacier, averaging 41. Thrust planes, conspicuous due to traces of fine debris dis-tributed on the surface by meltwater, are semi-parallel to foliation and dip 24 to 41up-glacier. Fractures that appear to be remnant crevasses strike NW–SE and also dipsteeply (68) (Fig. 4). Debris-filled hydrofractures strike to the NE and SE and dip be-5
tween 37 and 47 up-glacier. Some occupy foliation planes. All structures are laterallycontinuous without interruption within each lacuna and throughout the entire lacunaband. Thus indicating collapse is not involved in the formation of lacunas.
3 Glacier karst distinction
As described by Clayton (1964), the term “glacier karst” implies a configuration of10
glacier features formed on stagnant, debris covered ice that resemble those on lime-stone karst. Most prominent are funnel-shaped sink-holes formed by the collapse ofice cave roofs, tunnels, sinking springs and blind valleys as found on the Martin RiverGlacier, Alaska. Their formation requires localized ablation provided by a debris coverof variable thickness followed by backwasting and slope retreat (Embleton and King,15
1968). Clayton considers moulin as part of glacier karst, but acknowledges the largervariety of vertical shafts into which large meltwater streams plunge are most commonon active ice.
According to Clayton, sink-holes within glacier karst are steep-walled, conical de-pressions that commonly contain ponds at a common water level which is taken to rep-20
resent the position of the local water table, implying saturation at depth. No definitivemechanism other than collapse has been offered to explain their origin. However, theirnon-angular, symmetrical surface expression and lack of associated tilted ice blocksdue to subsidence suggest otherwise. Similarly, englacial structural continuity withinlacunas and their circular to oblate surface expression rule out an origin related to sub-25
sidence. Benn and Evans (1998) attribute sink-hole enlargement to backwasting of iceslopes too steep to support debris cover, but do not offer an initiating mechanism for
2406

TCD8, 2403–2424, 2014
Surface depressions(Lacunas) on Bering
Glacier, Alaska
P. J. Fleisher
Title Page
Abstract Introduction
Conclusions References
Tables Figures
J I
J I
Back Close
Full Screen / Esc
Printer-friendly Version
Interactive Discussion
Discussion
Paper
|D
iscussionP
aper|
Discussion
Paper
|D
iscussionP
aper|
their formation. An area of glacier karst is well developed on the debris covered dis-tal end of the broad medial moraine separating the actively moving Bering and Stellerpiedmont lobes. While the lacunas at Bering Glacier are similar in size and shape tosink-holes, and share an affinity for passive to stagnant ice, they are most conspicuouswithin a band of debris-free ice on the opposite side of the piedmont lobe, although5
some may indeed also appear in the area of glacier karst.
4 Lacuna band saturation
As surging advance pressed the ice front onto all eastern sector islands and into all ice-contact lakes in 1993, the narrows at the western tip of Bentwood Island was closedand Tsiu and Tsivat Lakes rose 14 m thus forcing the reoccupation of a pre-surge outlet10
(Abandoned River). An upwelling fountain of turbid water that had been active for sev-eral years at the Lake Vitus ice front adjacent to Arrowhead Island during the surge wasconspicuous as plumes of silty water entered the clear, slightly brackish water of LakeVitus. Discharge here progressively increased after the surge ended (1995) that clearlyestablished an enlarging englacial hydrologic connection between Tsiu Lakes and Vi-15
tus Lake, which is interpreted to suggest increased saturation beneath the lacuna band(Fleisher et al., 2013). Saturation persisted at depth here for several years as the icefront slowly retreated from the surge limit and downwasting progressed. During theinterval that followed, water from the adjacent elevated Tsiu Lake continued to gaininternal access to the ice beneath the lacuna band, until in 2006 turbid water began to20
appear within some lacunas indicating the filling of englacial cavities (Crossen et al.,2012) and a rising water table. During the summer of 2006 a surface channel formedfrom Tsiu Lake to a conduit opening on the glacier and supraglaciel drainage began(personal communication Chris Noyes, BLM, Anchorage, Alaska; Fleisher et al., 2006).The connecting englacial drainage system was gradually enlarged sufficiently to cause25
the beginning of a week-long breakout into Vitus Lake (Crossen, 2012) as Tsiu andTsivat Lakes were lowered to pre-surge elevations. The breakout lowered the surface
2407

TCD8, 2403–2424, 2014
Surface depressions(Lacunas) on Bering
Glacier, Alaska
P. J. Fleisher
Title Page
Abstract Introduction
Conclusions References
Tables Figures
J I
J I
Back Close
Full Screen / Esc
Printer-friendly Version
Interactive Discussion
Discussion
Paper
|D
iscussionP
aper|
Discussion
Paper
|D
iscussionP
aper|
of Tsiu Lake sufficiently to expose ice front tunnel openings through which turbid lakewater had gained access to englacial passageways beneath the lacuna band. Even-tually, in mid summer 2007, the englacial conduits were enlarged sufficiently to causeceiling collapse resulting in the formation of an open channel outlet between Tsiu Lakeand Lake Vitus. The length of time during which the lacunas remained flooded, and5
presumably the water table within the trough was elevated, is unknown.
5 Surge deformation related to lacuna band location
Surface deformation of the piedmont lobe during the 1993–1995 surge, as well asearlier surges, as observed in over-flights and on US Geological Survey aerial photos(Post, 1972), formed heavily crevassed domes separated by crevasse-free troughs.10
The domes are assumed to coincide with ice movement above subglacial topographichighs, whereas sagging ice and troughs form above areas of subglacial lows (Fig. 5).
5.1 Surface expression of subglacial trough
A particularly conspicuous trough formed at the glacier surface where the Tsiu Lakebasin is projected to extend beneath the ice. Here, well-developed, large ephemeral15
linear ponds formed within the trough, thus emphasizing its size, extent and orientationdue to subsidence above a subglacial low. In contrast, heavy crevassed ice movingover the adjacent Peat Falls and Arrowhead Islands served to further emphasize thecrevasse-free ice sagging into the trough (Fig. 5).
Surging advance was accompanied by the eastward thrusting of multiple, gently in-20
clined wedges of ice stacked one on another. By July 1994, mid way through the surgeafter the majority of ice displacement had occurred, the ice had thickened between 50–70 m (150–210 feet) at the eastern margin (Fleisher et al., 2010). These values provedto be slightly too high, as determined by initial post-surge ablation estimates that wouldhave removed an estimated 45 m by 1998 and a total of 65 m by 2000 when all of the25
2408

TCD8, 2403–2424, 2014
Surface depressions(Lacunas) on Bering
Glacier, Alaska
P. J. Fleisher
Title Page
Abstract Introduction
Conclusions References
Tables Figures
J I
J I
Back Close
Full Screen / Esc
Printer-friendly Version
Interactive Discussion
Discussion
Paper
|D
iscussionP
aper|
Discussion
Paper
|D
iscussionP
aper|
surge related thickening had been removed by downwating. Pre- and post-surge iceflow data indicate that ice movement toward the margin between surges within thispart of the piedmont lobe is normally very slow, less than the average retreat rate of170 myear−1 (Muller and Fleisher, 1995). However, during the surge the ice here ad-vance 3 to 7 mday−1 in a direction primarily across the trend of the trough (Fig. 5)5
(Fleisher et al., 1995, 2010). Thrusting ice movement across the trend of the troughwould effectively separate overriding ice from ice held deep within the trough.
The azimuth of the trough suggests a continuation of the Tsiu Lake basin beneath theglacier, where it shifts from a westward trend at the to the southwest as it skirts the up-glacier side of Arrowhead Island. Tsiu Lake bathymetric data indicate a minimum water10
depth of 40 to 43 m (130 to 140 feet) at the ice front prior to the surge (Fleisher et al.,1993, 2003). Adding the average relief of adjacent Peat Falls Island (30 m determinedfrom field survey data) to the depth of Tsiu Lake, places the local relief of the troughat approximately 70 m. Ice penetrating radar data (Trabant and Molina, 1992) indicatean anomalous ice thickness along this trend at −161 m relative to sea level. Lesser ice15
thickness beneath adjacent parts of the glacier confirms the continuation of Tsiu Lakebasin beneath the glacier along a trend toward Lake Vitus. The southwest orientationof the trough persists and extends to the ice front at Vitus Lake where the water depthis 50 m (Molnia and Post, 1995), which matches the water depth at the ice front of TsiuLake, thus establishing the trough as a continuous subglacial feature between Lake20
Vitus and Tsiu Lake.
5.2 Lacuna band coincides with trough location
It is particularly significant to note that after the lacuna band was displaced 2 km ontothe foreland by the 1993–1995 surge (Fleisher, et. al, 2010), new lacunas began toappear within 5–6 years in a location that coincides with the original position of the25
lacuna band prior to surge displacement. Furthermore, the location of newly formedlacunas coincides with the position of the trough formed above the subglacial low,a fact that links lacuna formation to the ice within the trough.
2409

TCD8, 2403–2424, 2014
Surface depressions(Lacunas) on Bering
Glacier, Alaska
P. J. Fleisher
Title Page
Abstract Introduction
Conclusions References
Tables Figures
J I
J I
Back Close
Full Screen / Esc
Printer-friendly Version
Interactive Discussion
Discussion
Paper
|D
iscussionP
aper|
Discussion
Paper
|D
iscussionP
aper|
For all practical purposes ice held deep within the trough persisted in a passive tostagnant condition beneath overriding ice throughout the surge only to be exposed atthe glacier surface years later by downwasting due to ablation (Fig. 6).
6 Rates of ablation
6.1 Initial post-surge accelerated ablation5
When the surge ended in September 1995, much of the glacier surface was intenselybroke by chaotic crevasses. Debris bands that were conspicuous prior to the surgewere completely eradicated as virtually all debris fell into crevasses. As would be an-ticipated, increased surface area of the broken ice surface led to accelerated melting,so that by 1997–1998 most of the heavily crevassed ice was lost to ablation. Annual10
field observations indicate the minimum amount of time required for the debris withinthe crevasses to appear again at the surface as re-formed debris bands was 2–3 years(Mase et al., 1997). This indicates initial post-surge lowering of the broken glacier sur-face was equal to the depth at which most debris would lodge within open crevasses,which is estimated to be 35 m (Hooke, 2005), thus establishing an initial post-surge15
minimum ablation rate of approximately 12–18 myear−1.
6.2 Normal rate of ablation
After initial post-surge ablation removed the heavily crevassed ice and reduced theglacier surface to a safe gradient, annual ice surface surveys were conducted at four dif-ferent locations along the eastern sector between 1998 and 2006. The surveys started20
at the ice front and progressing 1 km up-glacier across clean ice. A plot of the 9 yearsurvey record from a representative segment of the eastern sector (Fig. 7) indicatesthe clean ice surface was lowered at a normal rate of 10 myear−1 (Fleisher et al., 2005,2010). By 2000 the initial 35 m, plus 2 years at 10 myear−1 would have lowered theglacier surface a total of approximately 55 m (182 feet). At this time ice held deep within25
2410

TCD8, 2403–2424, 2014
Surface depressions(Lacunas) on Bering
Glacier, Alaska
P. J. Fleisher
Title Page
Abstract Introduction
Conclusions References
Tables Figures
J I
J I
Back Close
Full Screen / Esc
Printer-friendly Version
Interactive Discussion
Discussion
Paper
|D
iscussionP
aper|
Discussion
Paper
|D
iscussionP
aper|
the trough would have been exposed at the surface. Photos taken in 2000 indicate thatby this time an entirely new band of lacunas had fully formed.
Figure 7. Annual ice surface profiles 1998–2006 from Weeping Peat Island surveystation indicate a general downwasting rate of 10 myear−1 (from Fleisher et al., 2010)
7 Discussion5
7.1 Lacuna association with stagnant ice
Pre- and post-surge ice flow data indicate that within this segment of the piedmontlobe movement is consistently very slow. However during the 1993–1995 surge, theice front advanced 3–7 mday−1 as it was thrust across the trend of a subglacial troughexpressed by ice surface deformation (Fleisher et al., 2010). Deep within the overrid-10
den trough the ice would have persisted in a passive-to-stagnant condition. During the5–6 years following the surge downwasting lowered the glacier surface sufficiently toremove all of the surge-thickened ice and eventually exposed the ice held deep withinthe trough. The location of the Bering lacuna band that forms anew after each surgecoincides exactly with the location and orientation of this subglacial trough. This asso-15
ciation links the trough to the lacuna band and suggests the properties of the ice withinthe trough are important to lacuna development.
Features similar to lacunas form within a zone of glacier karst that characterizesthe stagnant interlobate ice separating the Bering and Steller piedmont lobes. Lar-son (1977) in his investigation of stagnant ice associated with the wasting Burroughs20
Glacier, Alaska characterized the internal drainage of stagnant ice to be similar to thatof a karst setting, pointing out that infiltrating meltwater is temporary stored in satu-rated zones prior to being discharging into moulin-like surface cavities and releasedto englacial drainageways. Therefore, it is suggested that the stagnant conditions ofglacier karst and the stagnant ice trapped within the subglacial trough would be sub-25
ject to similar hydrologic conditions, including saturation at depth, and that ablation at
2411

TCD8, 2403–2424, 2014
Surface depressions(Lacunas) on Bering
Glacier, Alaska
P. J. Fleisher
Title Page
Abstract Introduction
Conclusions References
Tables Figures
J I
J I
Back Close
Full Screen / Esc
Printer-friendly Version
Interactive Discussion
Discussion
Paper
|D
iscussionP
aper|
Discussion
Paper
|D
iscussionP
aper|
the surface would produce similar depressions, such as sink-holes in one area and la-cunas in the other. It is suggested that properties developed within saturated stagnantice, eventually leads to the development of these similar features.
7.2 Saturation of stagnant ice
In the case for active ice, surface meltwater flows along fractures and within crevasses5
to depths where it either refreezes or encounters englacial conduits through whichdrainage may be rapid (Fountain and Walder, 1998). This has been noted at BeringGlacier where surface melting and infiltration keeps pace with an annual downwastingof 10 myear−1. Although the Burroughs Glacier, Alaska has been in rapid retreat formore than a century (Mickelson, 1971) and ice movement is generally retarded and10
active flow persists at depth (Taylor, 1962), which accounts for a local perched wa-ter above less permeable ice (Syverson and Mickelson, 2009), thus suggesting a lackof persistent saturation. In contrast, water movement within stagnant ice is sluggish,thus contributing to the potential for saturation. Indeed, standing water at a commonelevation in glacier karst sink-holes suggests limited drainage and a water table be-15
low which saturation would exist, as suggested by Larson (1977) for regions of Bur-roughs Glacier. Within the stagnant ice of glacier karst there is the additional influenceof surface meltwater storage within channels and open fractures as on the stagnantBurroughs (Larson, 1978), and a fluctuating water table that rises and falls seasonally,thereby subjecting the ice at depth to episodic saturation. As noted earlier, ice held20
deep within the subglacial trough would be retained in a passive to stagnant condi-tion as surging ice was thrust across the trend of the trough. This ice would then besusceptible to conditions of saturation and eventually the development of lacunas.
Indeed, during each documented surge event at the Bering a similar episodic sat-uration takes place at depth beneath the lacuna band. As surging ice pressed onto25
the foreland the normal outlet drainage of Tsiu Lake was blocked causing the lake torise 14 m. At this elevated position turbid water gained access to lacuna band ice asindicated by the rising encroachment of these waters into lacunas and storage of water
2412

TCD8, 2403–2424, 2014
Surface depressions(Lacunas) on Bering
Glacier, Alaska
P. J. Fleisher
Title Page
Abstract Introduction
Conclusions References
Tables Figures
J I
J I
Back Close
Full Screen / Esc
Printer-friendly Version
Interactive Discussion
Discussion
Paper
|D
iscussionP
aper|
Discussion
Paper
|D
iscussionP
aper|
at depth (Crossen et al., 2012). This situation ended with the drainage of turbid waterfrom lacunas after a breakout opened surface drainage into Lake Vitus and Tsiu Lakereturned to its pre-surge level, thus causing the water table beneath the lacuna bandto be lowered.
7.3 Lacunas form in stagnant not active ice5
An additional factor for consideration in the development of lacunas is ice density. La-cunas and sink-hole are not found within actively flowing ice, a situation that may beexplained by considering the components of active ice deformation. In defining the rateof active ice deformation, Nye’s Flow Law assumes active ice is isotropic (Hooke, 2005)and ice temperature influences shear stress, which in turn determines rate of deforma-10
tion (Embleton and King, 1968). Unlike several other factors that define the physicalproperties of glacier ice, density is conventionally assigned a uniform value in quanti-tative calculations of active ice flow and intracryatlline deformation. Therefore, it is rea-sonable to assume that active ice flow maintains a relatively uniform density at depth(Meier, 1972; Benn and Evans, 1998). Should flow within the glacier cease or become15
passive, as it may for a variety of reasons, the ice will stagnate. Consequently, infil-trating meltwater will eventually reach a temporary water table and saturate the ice atdepth. In the absence of ongoing intracrystalline deformation, migration of water withina zone of saturation will result in the compromising of englacial texture (Raymond andHarrison, 1975). Lacking established literature on the specific effects of saturation, one20
can only speculate on how the properties of stagnant ice would be altered. A reason-able modification would be the development of randomly distributed zones of slightlylower density. The logical outcome would eventually be expressed when normal down-wasting exposes this ice at the glacier surface and the less dense ice would ablate atan accelerated rate, thereby resulting in differential ablation. With continued downwast-25
ing, such conditions would be expressed by the development of local depressions orsurface cavities, such as ponded lacunas. The same may also take place within areasof glacier karst, thus forming some sink-holes. Darker pond water with a lower albedo
2413

TCD8, 2403–2424, 2014
Surface depressions(Lacunas) on Bering
Glacier, Alaska
P. J. Fleisher
Title Page
Abstract Introduction
Conclusions References
Tables Figures
J I
J I
Back Close
Full Screen / Esc
Printer-friendly Version
Interactive Discussion
Discussion
Paper
|D
iscussionP
aper|
Discussion
Paper
|D
iscussionP
aper|
would absorb increased solar radiation leading to increased melting and lacuna growth(Jeffries et al., 2013). Furthermore, enlargement appears to be controlled by englacialstructures, such as fractures inherited from old crevasses, foliation and healed thrustplans. The result would be asymmetric lacunas as noted in Fig. 2.
8 Summary and conclusions5
After hundreds of lacunas, limited within a 7.5 km2 band of clean ice, are displacedseveral kilometers by the 1993–1995 surge, a new band formed 5–6 years later in thesame location as the previous band. The location and orientation of the new lacunaband coincides with a subglacial trough expressed during the surge as a linear trenchat the glacier surface. The horizontal thrust mechanism involved in surge displacement10
forced ice across the trend of the trough. This process effectively trapped ice deepwithin the trough causing it to become passive and eventually stagnant. Stagnant con-ditions led to englacial saturation that compromised ice texture resulting in randomlydistributed pockets of diminished density. After this ice is exposed at the glacier surfacethrough 5–6 years of normal ablation and downwasting, a new lacuna band began to15
form. This progression of events links lacuna formation to the ice within the trough andaccounts for the appearance of a new lacuna band following each surge. Stagnationand saturation at depth are key components in the development of conditions leadingto differential ablation and the lacuna forming process.
Acknowledgements. The results of field work cited in this investigation were collected by the20
Bering Research Group (BERG) spanning several summers. Key members of the BERG groupare Palmer K. Bailey and Eric Natal, plus more than a dozen students from the State Universityof New York, College at Oneonta. Prominent among the students were Dan Nierenberg andDave Mase. The author is also grateful for the cooperation and assistance by the Prince WilliamScience Center, Cordova, Alaska, namely Nancy Bird and Penny Oswalt.25
2414

TCD8, 2403–2424, 2014
Surface depressions(Lacunas) on Bering
Glacier, Alaska
P. J. Fleisher
Title Page
Abstract Introduction
Conclusions References
Tables Figures
J I
J I
Back Close
Full Screen / Esc
Printer-friendly Version
Interactive Discussion
Discussion
Paper
|D
iscussionP
aper|
Discussion
Paper
|D
iscussionP
aper|
References
Benn, D. I. and Evans, D. J. A.: Glaciers and Glaciation, Arnold, London, 734 pp., 1998.Clayton, L.: Karst topography on stagnant glaciers, J. Glaciol., 5, 107–112, 1964.Crossen, K. J., Fleisher, P. J., and Bailey, P. K.: Glacial outburst flood: 15-year cycle of the ice-
contact Tsiu Lake, Bering Glacier, Alaska, vol. 44, Geological Society of America Abstracts5
with Programs, Denver, Colorado, USA, 186 pp., 2012.Embleton, C. and King, C. A. M.: Glacial and Periglacial Geomorphology, St. Martin’s Press,
New York, 608 pp., 1968.Fleisher, P. J., Gardner, J. A., and Franz, J. M.: Bathymetry and Sedimentary Environment
in Proglacial Lakes at the Eastern Bering Piedmont Glacier of Alaska, J. Geol. Educ., 41,10
267–274, 1993.Fleisher, P. J., Muller, E. H., Cadwell, D. H., Rosenfeld, C. I., Bailey, P. K., Pelton, J. M., and
Puglisi, M. A.: The surging advance of Bering Glacier, Alaska, A progress report, J. Glaciol.,41, 207–213, 1995.
Fleisher, P. J., Bailey, P. K., and Cadwell, D. H.: A decade of sedimentation in ice-contact,15
proglacial lakes, Bering Glacier, Alaska, J. Sediment. Geol., 60, 309–324, 2003.Fleisher, P. J., Bailey, P. K., Natel, E. M., Miller, J. R., and Tracy, M. W.: Post-surge field mea-
surements of ablation and retreat, Eastern sector, Bering Glacier, Alaska, Abstracts withProgram, Geological Society of America, Salt Lake City, Utah, USA, 37, p. 423, 2005.
Fleisher, P. J., Bailey, P. K., and Natel, E. M.: Ice dam breakout at Bering Glacier, Alaska,20
Abstracts with Program, Geological Society of America, Philadelphia, Pennsylvania, USA,38, p. 236, 2006.
Fleisher, P. J., Bailey, P. K., Muller, E. H., Cadwell, D. H., Natel, E. M., and Russell, A. J.: The1993–95 Surge and Associated Outburst Floods, Bering Glacier, Alaska; in: Bering Glacier:Interdisciplinary Studies of Earth’s Largest Temperate Surging Glacier, edited by: Shuch-25
man, R. A., and Josberger, E. G., Geological Society of America, Special Paper, Boulder,Colorado, USA, 462, 193–216, 2010.
Fleisher, P. J., Bailey, P. K., Nierenberg, D. R., Mase, D., and Natel, E. S.: Imagery in the analysisof enigmatic differential ablation, Bering Glacier, Alaska, Abstracts with Program, GeologicalSociety of America, Denver, Colorado, USA, 45, p. 267, 2013.30
Fountain, A. G. and Walder, J. S.: Water flow through glaciers, Rev. Geophys., 36, 299–328,1998.
2415

TCD8, 2403–2424, 2014
Surface depressions(Lacunas) on Bering
Glacier, Alaska
P. J. Fleisher
Title Page
Abstract Introduction
Conclusions References
Tables Figures
J I
J I
Back Close
Full Screen / Esc
Printer-friendly Version
Interactive Discussion
Discussion
Paper
|D
iscussionP
aper|
Discussion
Paper
|D
iscussionP
aper|
Hooke, R. B.: Principles of Glacier Mechanics, Prentice Hall, Upper Saddle River, NJ, 429 pp.,2005.
Jeffries, M. O., Overland, J. E., and Perovich, D. K.: The arctic shifts to a new normal, PhysicsToday, 66, 35–40, 2013.
Larson, G. J.: Internal drainage of stagnant ice: Burroughs Glacier, Southeast Alaska, Institute5
of Polar Studies Report No. 65 and Department of Geology and Mineralogy, The Ohio StateUniversity, Columbus, 33 pp., 1977.
Larson, G. J.: Meltwater Storage in a Temperate Glacier, Burroughs Glacier, Southeast Alaska;Institute of Polar Studies Report No. 66, Institute of Polar Studies, The Ohio State University,Columbus, 56 pp., 1978.10
Mase, D. F., Nierenber, D. R., Fleisher, P. J., Bailey, P. K., and Natel, E. M.: The enigmaticoccurrence of glacial lacunas, Bering Glacier, Alaska, Abstracts with Program, GeologicalSociety of America, Durham, New Hampshire, USA, 38, p. 423, 2007.
Meier, M. F.: Hydraulics and hydrology of glaciers, in: The role of snow and ice in hydrology, in:Proceedings of the Banff Symposium, 1 September 1972, Unesco – WMO (World Meteoro-15
logical Organization) – IAHS (International Association of the Hydrological Sciences, Banff,British Columbia, Canada, 353–370, 827 pp., 1972.
Mickelson, D. M.: Glacial Geology of the Burroughs Glacier Area, Southeastern Alaska, Instituteof Polar Studies Report No. 40, Research Foundation and the Institute of Polar Studies, TheOhio State University, Columbus, Ohio, USA, 149 pp., 1971.20
Muller, E. H. and Fleisher, P. J.: Surge history and potential for renewed retreat, Bering Glacier,Alaska, Arctic Alpine Res., 27, 81–88, 1995.
Molina, B. F. and Post, A.: Holocene history of Bering Glacier, Alaska: a prelude to the 1993–95surge, Phys. Geogr., 16, 87–117, 1995.
Post, A.: Periodic surge origin of folded medial moraines on Bering Piedmont Glacier, Alaska,25
J. Glaciol., 11, 219–226, 1972.Raymond, C. F. and Harrison, W. D.: Some observations on the behavior of the liquid and gas
phases in temperate glacier ice, J. Glaciol., 14, 213–233, 1975.Sturm, M.: Observations and characteristics of potholes on surging glaciers, J. Geophys. Res.,
92, 9015–9022, 1987.30
Syverson, K. M. and Mickelson, D. M.: Origin and significance of lateral meltwater channelsformed along a temperate glacier margin, Glacier Bay, Alaska, Boreas, 38, 132–145, 2009.
2416

TCD8, 2403–2424, 2014
Surface depressions(Lacunas) on Bering
Glacier, Alaska
P. J. Fleisher
Title Page
Abstract Introduction
Conclusions References
Tables Figures
J I
J I
Back Close
Full Screen / Esc
Printer-friendly Version
Interactive Discussion
Discussion
Paper
|D
iscussionP
aper|
Discussion
Paper
|D
iscussionP
aper|
Taylor, L. D.: Ice Structures, Burroughs Glacier, Southeast Alaska, Institute of Polar Studies Re-port No. 3, Research Foundation and the Institute of Polar Studies, The Ohio State University,Columbus, Ohio, USA, 80 pp., 1962.
Trabant, D. C. and Molina, B. F.: Ice thickness measurements of Bering Glacier, Alaska and theirrelation to satellite and airborne SAR image patterns; EOS, Transactions of the American5
Geophysical Union, Washington, D.C., USA, 73, 1992.
2417

TCD8, 2403–2424, 2014
Surface depressions(Lacunas) on Bering
Glacier, Alaska
P. J. Fleisher
Title Page
Abstract Introduction
Conclusions References
Tables Figures
J I
J I
Back Close
Full Screen / Esc
Printer-friendly Version
Interactive Discussion
Discussion
Paper
|D
iscussionP
aper|
Discussion
Paper
|D
iscussionP
aper|
Fig. 1. Index map (A) and location of lacuna band relative to key eastern sector (B) physio-graphic features.
2418
TCD8, 2403–2424, 2014
Surface depressions(Lacunas) on Bering
Glacier, Alaska
P. J. Fleisher
Title Page
Abstract Introduction
Conclusions References
Tables Figures
J I
J I
Back Close
Full Screen / Esc
Printer-friendly Version
Interactive Discussion
Discussion
Paper
|D
iscussionP
aper|
Discussion
Paper
|D
iscussionP
aper|
Fig. 2. US Geological Survey photo 90V2-111 24 August 1990. Photo illustrates the lacunaband at the eastern ice front.
2419

TCD8, 2403–2424, 2014
Surface depressions(Lacunas) on Bering
Glacier, Alaska
P. J. Fleisher
Title Page
Abstract Introduction
Conclusions References
Tables Figures
J I
J I
Back Close
Full Screen / Esc
Printer-friendly Version
Interactive Discussion
Discussion
Paper
|D
iscussionP
aper|
Discussion
Paper
|D
iscussionP
aper|
Figure 2. U. S. Geological Survey photo 90V2-‐111 24 August 1990. Photo illustrates the lacuna band at the eastern ice front.
Figure 3 Typical lacuna morphology. Foliation expressed in lacuna walls is not deformed by collapse. Scale implied by people on crown of far wall and ice axe in foreground. Note linear fracture on lacuna floor fracture through which surface melt drains. Photo by author, J-‐19-‐90.
Fig. 3. Typical lacuna morphology. Foliation expressed in lacuna walls is not deformed by col-lapse. Scale implied by people on crown of far wall and ice axe in foreground. Note linearfracture on lacuna floor fracture through which surface melt drains. Photo by author, J-19-90.
2420

TCD8, 2403–2424, 2014
Surface depressions(Lacunas) on Bering
Glacier, Alaska
P. J. Fleisher
Title Page
Abstract Introduction
Conclusions References
Tables Figures
J I
J I
Back Close
Full Screen / Esc
Printer-friendly Version
Interactive Discussion
Discussion
Paper
|D
iscussionP
aper|
Discussion
Paper
|D
iscussionP
aper|
Figure 4 Oblique view along trend of lacuna band (October 20, 1993). Dark streaks passing through the lacunas are the product of fine debris ablating from pre-‐1993-‐95 surge thrust planes, which are semi parallel to foliation. Photo by author, 10-‐10-‐93.
Fig. 4. Oblique view along trend of lacuna band (20 October 1993). Dark streaks passingthrough the lacunas are the product of fine debris ablating from pre-1993–1995 surge thrustplanes, which are semi parallel to foliation. Photo by author, 10 October 1993.
2421

TCD8, 2403–2424, 2014
Surface depressions(Lacunas) on Bering
Glacier, Alaska
P. J. Fleisher
Title Page
Abstract Introduction
Conclusions References
Tables Figures
J I
J I
Back Close
Full Screen / Esc
Printer-friendly Version
Interactive Discussion
Discussion
Paper
|D
iscussionP
aper|
Discussion
Paper
|D
iscussionP
aper|
Fig. 5. Subglacial relief expressed along the eastern Bering piedmont lobe during the surge.Heavily crevassed domes separated by depressions depict the relief of overridden subglacialterrain. The Tsiu Lake basin extends beneath the glacier as a subglacial trough above whicha linear surface depression has formed. Arrow indicates ice movement direction across thetrend of the subglacial trough. Photo by author (20 November 1993) 5 months after surgebegan. Photo by author, R-5-93.
2422

TCD8, 2403–2424, 2014
Surface depressions(Lacunas) on Bering
Glacier, Alaska
P. J. Fleisher
Title Page
Abstract Introduction
Conclusions References
Tables Figures
J I
J I
Back Close
Full Screen / Esc
Printer-friendly Version
Interactive Discussion
Discussion
Paper
|D
iscussionP
aper|
Discussion
Paper
|D
iscussionP
aper|
Figure 6. Schematic diagram illustrating passive ice trapped within the subglacial trough during the surge.
Figure 7. Annual ice surface profiles 1998-‐2006 from Weeping Peat Island survey station indicate a general downwasting rate of 10 m/year (from Fleisher, et al, 2010).
Fig. 6. Schematic diagram illustrating passive ice trapped within the subglacial trough duringthe surge.
2423

TCD8, 2403–2424, 2014
Surface depressions(Lacunas) on Bering
Glacier, Alaska
P. J. Fleisher
Title Page
Abstract Introduction
Conclusions References
Tables Figures
J I
J I
Back Close
Full Screen / Esc
Printer-friendly Version
Interactive Discussion
Discussion
Paper
|D
iscussionP
aper|
Discussion
Paper
|D
iscussionP
aper|
Figure 6. Schematic diagram illustrating passive ice trapped within the subglacial trough during the surge.
Figure 7. Annual ice surface profiles 1998-‐2006 from Weeping Peat Island survey station indicate a general downwasting rate of 10 m/year (from Fleisher, et al, 2010).
Fig. 7. Annual ice surface profiles 1998–2006 from Weeping Peat Island survey station indicatea general downwasting rate of 10 myear−1 (from Fleisher et al., 2010).
2424


![Monitoring Glacier Surface Seismicity in Time and Space ... · observed seismic signals with glacier dynamic events (e.g., a draining glacier lake as in Walter et al. [2008] and Roux](https://img.dokumen.tips/doc/110x75/5e856d9aeed7230f6f4f0d14/monitoring-glacier-surface-seismicity-in-time-and-space-observed-seismic-signals.jpg)