Embed Size (px)
Citation preview

Ozone Formation from VOC Sources at New Haven, CT
Kurt KebschullState of Connecticut, Department of Energy and Environmental
Protection

Introduction
• Research project: use PAMS data to make policy relevant conclusions about source-specific emission reduction programs
• Recent OTC sensitivity modeling emphasizes the need to find local emission reductions to meet increasingly tighter ozone standards
• CT DEEP runs 3 PAMS monitors at East Hartford (class 2 - max conc.), New Haven (class 2), and Westport (class 1 – max downwind)

New Haven, CT (industrialized port city) Highways and Stationary Source Locations
MONITOR
GAS TANKS
Metal finishing
PSE&G peaking generating station

What is the emissions profile of New Haven city?
• Transportation hub- planes, trains, and automobiles (many trucks)
• Nearly a million people in New Haven MSA (cars, consumer products)
• Industry (metal finishing, plastics manufacturing (solvents))
• Fuel terminal/transfer (evaporating gasoline)• Power generation (new generation peaking)
http://www.pseg.com/family/power/fossil/stations/connecticut/newhaven_peaker.jsp

Timing of emissions/formation: Diurnal Variation on ozone and precursors at New
Haven, CT during an ozone event
-Diurnal patterns show meteorology, chemistry and emissions all play a role in variation-Source emissions timing-a maximum for motor vehicles i.e. AM, PM rush hour (NOx red line) -TNMOC, NOx are anti-correlated w/ozone-Questions: How fast is ozone forming photochemically as TNMOC, NOx drop?-If it’s the lifting inversion diluting the TNMOC/NOx, where is the ozone being formed?-If being formed aloft and mixing down, isn’t the NOx being diluted too fast?

What sources indicated by PAMS are the most abundant?
What does this say?-PERCENTAGES ARE BASED ON MARKER SPECIES (C-refers to the # of carbon atoms, e.g. C5s are pentanes, suffix -ane means alkane = paraffin PAR; alkene=olefin OLE, model splits aromatics TOL-toluene, XYL-xylene, most benzenes are relatively inert w/r/t O3 formation-(C4,5), (C5) are evaporating gasoline profiles (cars and gas stations and gasoline storage tanks- contributing 47%-(C8-12) diesel combustion; MVCAR (light alkanes, alkenes, aromatics) ; (C2,3) aged combustion: contributions to on-road, off road mobile, 123 TB (trimethylbenzene-ethanol blend gasoline evaporation or combustion - 40% contribution. Total 87% is related to mobile sources and combustion-Biogenic- 3% lowest of all PAMS sites (see satellite imagery)-VOC in New Haven are the highest of all PAMS sites in OTR. (due to monitor placement)-Styrene profile-includes many industrial solvents (aromatics-few alkanes) -10% contribution-VOCs in many consumer products/solvents & degreasers species are not in PAMS (i.e. ethanol, mineral spirits)

What sources contain the most reactive species?
• 10 most abundant VOCs at New Haven
• 10 most reactive VOCs at New Haven ozone formation potential
compound voc cas no. carter mir09concentration
ppbcconcentration
rankIsopentane 43221 1.36 46.776 1n-Butane 43212 1.08 18.131 2n-Pentane 43220 1.22 17.208 3Toluene 45202 3.81 14.785 4
2-Methylpentane 43285 1.41 11.156 5Propane 43204 0.46 9.357 6
n-Hexane 43231 1.15 8.038 7Ethane 43202 0.26 7.370 82,2,4-
Trimethylpentane 43250 1.2 7.336 93-Methylpentane 43230 1.74 7.222 10
The most abundant are seldom the most reactive. Low concentration species make more ozone (except iso-pentane and toluene). Six of the top ten reactive compounds (OLEs) can be attributed to MV combustion.
compound voc cas no. carter mir09 concentration
concentration
rankuing
ozone formation potential
trans-2-Butene 43216 14.79 1.704 33 63.611,3,5-Trimethylbenzene 45207 11.44 1.091 47 56.33
1-Butene 43280 9.42 0.708 50 46.72Isopentane 43221 1.36 46.776 1 33.34Ethylene 43203 8.76 3.536 17 30.98Isobutane 43214 1.17 6.216 13 25.19Toluene 45202 3.81 14.785 4 22.48Isoprene 43243 10.26 1.628 36 20.99Propylene 43205 11.37 1.658 35 19.58
m-Ethyltoluene 45212 7.21 1.861 30 18.85

COMPARISON OF 3 CT SITES- most reactive species in boxes, end in “e”- note logarithmic scale

MODELING RESULTS

NHDES modeling shows modest benefit to VOC reductions, but downwind (not in)of the target box. Greenwich, CT is a part of the NYC box. Long Island Sound appears to magnify the ozone
reductions- few VOC sources over the water, most VOC from inland.

Top categories of the NY box (2008 NEI)… where do you reduce 30 tons-total 820 tons/day? How
do you cut by 50%
category tpd pctMobile - Aircraft 2.713355 0.330391Mobile - Commercial Marine Vessels 3.493895 0.425433Mobile - Non-Road Equipment - Other 4.135679 0.50358Industrial Processes - Storage and Transfer 4.849065 0.590446Mobile - On-Road Diesel Heavy Duty Vehicles 7.791052 0.948676Industrial Processes - NEC 9.515763 1.158685Mobile - Non-Road Equipment - Diesel 9.536044 1.161155Solvent - Graphic Arts 10.67514 1.299856Solvent - Dry Cleaning 11.55697 1.407233Bulk Gasoline Terminals 14.32614 1.74442Fuel Comb - Residential - Wood 14.77802 1.799443Waste Disposal 19.15764 2.332727Miscellaneous Non-Industrial NEC 26.47158 3.223307Gas Stations 26.75161 3.257405Biogenics - Vegetation and soil 44.73789 5.447502Solvent - Non-Industrial Surface Coating 47.03166 5.726802Solvent - Industrial Surface Coating & Solvent Use 65.46493 7.971326Solvent - Degreasing 66.60728 8.110424Solvent - Consumer & Commercial Solvent Use 138.4929 16.86356Mobile - On-Road Gasoline Light Duty Vehicles 139.5318 16.99007Mobile - Non-Road Equipment - Gasoline 142.1657 17.31078
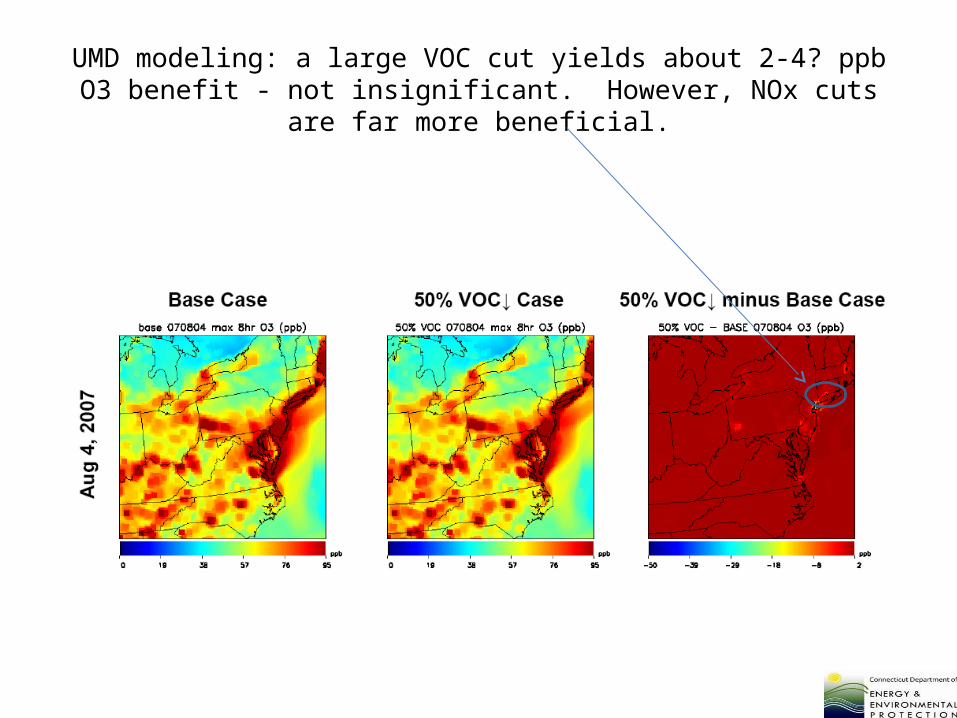
UMD modeling: a large VOC cut yields about 2-4? ppb O3 benefit - not insignificant. However, NOx cuts are far more beneficial.

A COMPARISON OF OFP BY VARIOUS VOC SOURCES-OTC STRATEGIES

Using the speciation-MIR (g of O3 formed/ g of VOC emitted)/methodology to evaluate OTC reduction strategies
• OTC strategy: consumer products, 9,728 tpy reduction, most species not detectable by PAMS. OFP= 8,093tpy. Most abundant species are not highly reactive, i.e. ethanol.
consumer products 9728TPY9728 mir TPY*MIR fraction mir*tpy*fractionethanol 1.45 14105.6 0.2245 3166.7072methanol 0.69 6712.32 0.0528 354.410496mineral spirits 1.69 16440.32 0.0523 859.828736isopropyl alcohol 0.59 5739.52 0.0443 254.260736isobutane 1.17 11381.76 0.0434 493.968384acetone 0.35 3404.8 0.0387 131.76576toluene 3.88 37744.64 0.0288 1087.045632aromatic 100 7.88 76656.64 0.0268 2054.397952isomersof xylene 9.52 92610.56 0.0258 2389.352448total yr. 264796.16 10791.73734total o3 yr 198597.12 8093.803008

Using the speciation-MIR methodology to evaluate OTC reduction strategies
• OTC strategy: large tank farm gasoline, 2,055 tpy. The cost/benefit ratio magnitude led the OTC ADs not to pursue this strategy? OFP=1,842tpy. . Most abundant species are not highly reactive, i.e. PARs.
large tank farm gasoline 2035TPY2035 mir tpy*mir mass fr. mir*tpy*mass fr.unidentified 0.14nbutane 1.08 2197.8 0.1093 240.21954isopentane 1.35 2747.25 0.1045 287.087625other 0.0671 npentane 1.23 2503.05 0.0638 159.69459toluene 3.77 7671.95 0.0488 374.39116xylene 9.52 19373.2 0.0403 780.73996total yr 34493.25 1842.132875

Using the speciation-MIR methodology to evaluate OTC reduction strategies
• OTC strategy Solvents and Degreasers: 32,485 tpy reduced- I’m not sure what profile SMOKE uses for this category. OFP= 28,806tpy- too much, 52% not id’d . Most abundant species are not highly reactive, i.e. heavy PARs
Column1 28806.59351 ofp total Column2Pollutant Percent mir tpy ofpUNIDENTIFIED 52.93 32485 0METHYLCYCLOHEXANE 10.81 1.58 32485 5548.37303N-HEPTANE 5.63 0.99 32485 1810.61645N-UNDECANE 4.93 0.72 32485 1153.08756N-DECANE 4.79 0.71 32485 1104.78237TOLUENE 4.58 3.88 32485 5772.71444N-OCTANE 4.25 0.82 32485 1132.102252-METHYLHEPTANE 2.4 0.99 32485 771.8436M-XYLENE AND P-XYLENE 1.62 7.33 32485 3857.463811,2,4-TRIMETHYLBENZENE 1.53 8.64 32485 4294.257123-METHYLHEPTANE 1.52 1.33 32485 656.716762-METHYLHEXANE 1.42 1.1 32485 507.4157N-NONANE 1.29 0.71 32485 297.530115P-ETHYLTOLUENE 0.49 3.75 32485 596.911875ETHYLBENZENE 0.48 2.93 32485 456.86904O-XYLENE 0.35 7.44 32485 845.9094

EXAMPLES OF PARTICULAR SOURCES ALREADY BEING CONTROLLED

Gas station emissions (2008 NEI for OTC states)
• Stage II has a 95% control efficiency- 0.05*77,687(nei estimate for gas stations)~4000 tpy emitted if operating as designed. Not as many highly reactive compounds here. OFP~4500. Stage II controls are being phased out Benefit above Stage II is yet to be determined. . Most abundant species are not highly reactive, i.e. C4,5 PARs , butanes, pentanes.
pollutant Pollutant percent mir tpyozone formation potential
BENZENE 0.75 0.69 77637 402N-BUTANE 31.21 1.08 77637 261692,3-DIMETHYLPENTANE 2.58 1.26 77637 25242,4-DIMETHYLPENTANE 0.64 1.46 77637 725ETHANE 0.01 0.26 77637 2ETHYLBENZENE 0.13 2.93 77637 296N-HEXANE 2.52 1.15 77637 2250ISOBUTANE 7.15 1.17 77637 6495ISOPENTANE 28.77 1.36 77637 303773-METHYLPENTANE 1.59 1.7 77637 2099N-PENTANE 10.61 1.23 77637 10132PROPANE 2.05 0.46 77637 732PROPYLENE 0.01 11.37 77637 88TOLUENE 1.67 3.88 77637 5031UNIDENTIFIED 9.85 77637 0M/p XYLENE 0.35 7.33 77637 1992O-XYLENE 0.11 7.44 77637 635
89948

Light duty vehicles. 2008 NEI emissions for OTC states
Pollutant Percent TPY mir OZONE FORMATION POTENTIALETHYLENE 8.9 458106 8.76 357157.7269ISOPENTANE 8.9 458106 1.36 55449.14481TOLUENE 8.78 458106 3.88 156060.2071OTHER 6.59 458106 0M/p-XYLENE 6.5 458106 7.33 218264.5823BENZENE 5.67 458106 0.69 17922.47928PROPYLENE 3.56 458106 11.37 185428.4637N-PENTANE 3.35 458106 0.46 7059.4127691,2,4-TRIMETHYLBENZENE 3.27 458106 8.64 129427.75931-BUTENE 3.23 458106 9.42 139386.0665N-BUTANE 3.1 458106 1.08 15337.38738
NEI 2008 light duty gasoline vehicles emissions=458,106 TPY. Total OFP=1,873,579TPY. 6-10 of the top species highly reactive for ozone (cars create more ozone/g of VOC) . ~ 4X more reactive than consumer products & solvents and degreasers. . Most abundant species are highly reactive, i.e. OLEs , AROMATICS

Heavy-duty diesels, 2008 NEI emissions for OTC states
• 2008 NEI HDD OTR emissions = 33,490 TPY. Total OFP= 133,405 TPY, 6 of the top 10 compound are moderate-highly reactive for ozone. . Most abundant species are highly reactive, i.e. OLE, AROMATICS
Pollutant Percent tpd mir OFPOTHER 11.36 33490ETHYLENE 9.3 33490 9.07 28250ISOPENTANE 8.1 33490 1.36 3689TOLUENE 5.87 33490 3.88 7628M-XYLENE AND P-XYLENE 4.59 33490 7.33 11268PROPYLENE 4.27 33490 11.57 16546BENZENE 3.66 33490 0.69 8462,2-DIMETHYLBUTANE 3.22 33490 1.11 11971-BUTENE 3.08 33490 9.42 97171,2,4-TRIMETHYLBENZENE 2.83 33490 11.66 11051N-UNDECANE 2.71 33490 0.55 499

Both VOC and NOx from onroad vehicles are expected to drop by 2/3 from 2007-2020 (MARAMA inventory report)

CT-TABLE FROM MARAMA GRAPH 2007 BASE AND 2020 PROJECTED INVENTORIESSpatial map tnmoc, nox isop home
CT nox 2007yr 2020yrPCT REDUCTION
Nonroad 4-stroke gasoline 31 11Nonroad LPG 30 5Stationary fuel combustion commercial and industrial 32 29Solid waste disposal government 33 44Stationary fuel comb. Comm/industrial 39 26External combustion/egu 82 70ONROAD/ gasoline vehicles 385 142NONROAD/ diesel vehicles 91 43ONROAD / diesel vehicles 152 50Total nox ct 875 420 0.52
VOCSolvent/use degreasing 29 8Storage/petroleum products 35 20NONROAD/ 2-stroke gasoline vehicles 58 45NONROAD/pleasure craft 60 20Stationary fuel combustion/residential 71 59NONROAD/ 4-stroke gasoline 71 39Solvent use/ graphic arts 85 71Solvent use/ surface coating 138 115Solvent use/ consumer and commercial 155 145ONROAD/gasoline vehicles 385 142Total voc ct 702 522 0.25641026

OTC states (VA-ME)reductions due to OTC model rules and FMVCP
21pct<50 pct in the modeling
Column1 2008 tpy 2015tpy 2018tpy Column2CHEMICAL & ALLIED PRODUCT MFG 3350 3350 3350FUEL COMB. ELEC. UTIL. 4479 4479 4479FUEL COMB. INDUSTRIAL 10368 10368 10368FUEL COMB. OTHER 101839 101839 101839
HIGHWAY VEHICLES* 500159 208400 83360"7/12,10/12"
METALS PROCESSING 3445 3445 3445MISCELLANEOUS 60635 60635 60635OFF-HIGHWAY 557220 557220 557220OTHER INDUSTRIAL PROCESSES 31807 31807 31807PETROLEUM & RELATED INDUSTRIES 2522 2522 2522
SOLVENT UTILIZATION* 666337 626337 626337"-32000" otc
STORAGE & TRANSPORT 178004 178004 178004WASTE DISPOSAL & RECYCLING 42616 42616 42616
2162781 1831022 1705982 342.57474
0.1533949 0.2112092
voc reduction due to current proposed measures

23%
22%
18%
16%
7%
5%
2%
2%1% 1% 1%
1%1%
0%
2008 NEI OTC
Mobile - On-Road Gasoline Light Duty Vehicles
Biogenics - Vegetation and soil
Mobile - Non-Road Equipment - Gasoline
Solvent - Consumer & Commercial Solvent Use
Fuel Comb - Residential - Wood
Solvent - Non-Industrial Surface Coating
Gas Stations
Solvent - Dry Cleaning
Mobile - On-Road Diesel Heavy Duty Vehicles
Miscellaneous Non-Industrial NEC
Mobile - Non-Road Equipment - Diesel
Mobile - On-Road Gasoline Heavy Duty Vehicles
Mobile - Non-Road Equipment - Other
Bulk Gasoline Terminals

SUMMARY• When adopting VOC reduction, the reactivity of the species should be
considered• Not all VOCs are created equal-unlike NO• Domestic/industrial VOC sources appear to pale in comparison to mobile
sources w/r/t ozone formation• Densely populated cities like NYC have more emissions of consumer
products /solvents per capita than LDGV combustion• Getting 50% VOC reductions from other than mobile sources would be
difficult (OTC measures reduce only 32,000 of 600,00 tpy (7%))• 50% (anthropogenic) VOC reductions do not seem to give large reductions
in ozone.• NOx reductions ABOVE FMVCP, might require fuel changes, HEDD
regulations on hot days and NOx controls on upwind EGUs• Reductions of 30 tpd in the boxes looks doable