Embed Size (px)
Citation preview

Ozarks Regional Economic Partnership Regional Ozarks Regional Economic Partnership Regional Labor Skills Assessment - 2002Labor Skills Assessment - 2002
University CenterUniversity Center
for Survey Research for Survey Research
By By
Mike Walker, M.S. Mike Walker, M.S.
Research ScientistResearch Scientist
and and
Brett Zollinger, Ph.D.Brett Zollinger, Ph.D.
DirectorDirector
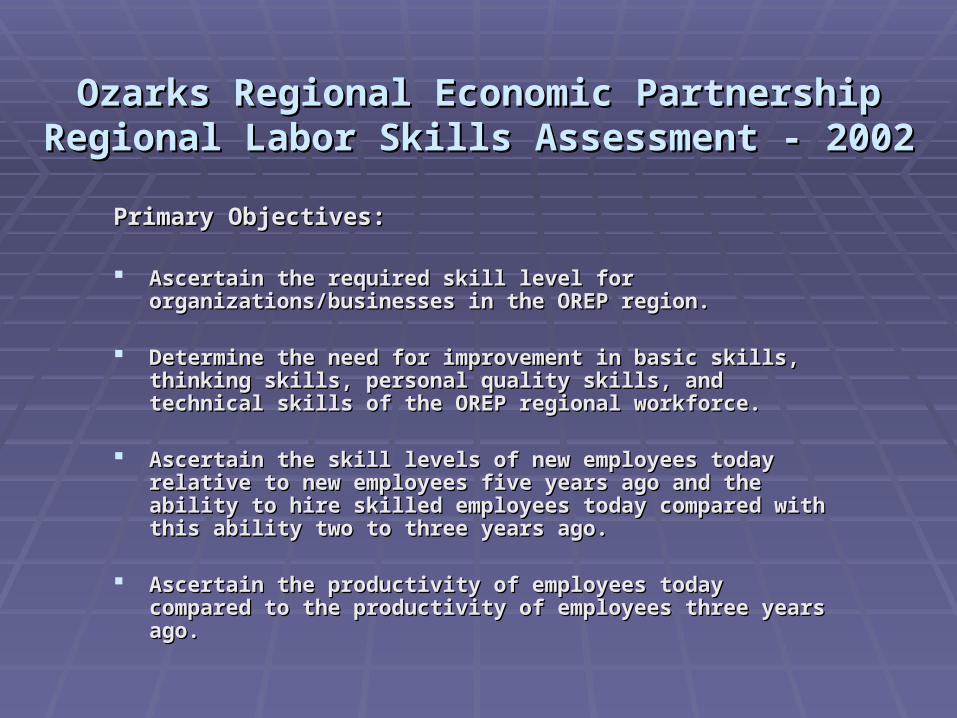
Primary Objectives:Primary Objectives:
Ascertain the required skill level for organizations/businesses in Ascertain the required skill level for organizations/businesses in the OREP region.the OREP region.
Determine the need for improvement in basic skills, thinking skills, Determine the need for improvement in basic skills, thinking skills, personal quality skills, and technical skills of the OREP regional personal quality skills, and technical skills of the OREP regional workforce.workforce.
Ascertain the skill levels of new employees today relative to new Ascertain the skill levels of new employees today relative to new employees five years ago and the ability to hire skilled employees employees five years ago and the ability to hire skilled employees today compared with this ability two to three years ago.today compared with this ability two to three years ago.
Ascertain the productivity of employees today compared to the Ascertain the productivity of employees today compared to the productivity of employees three years ago.productivity of employees three years ago.
Ozarks Regional Economic Partnership Regional Ozarks Regional Economic Partnership Regional Labor Skills Assessment - 2002Labor Skills Assessment - 2002

Primary Objectives (cont.):Primary Objectives (cont.):
Determine the level of underemployment among employees of Determine the level of underemployment among employees of organizations/businesses in the OREP region.organizations/businesses in the OREP region.
Determine the need fro training on basic skills, thinking skills Determine the need fro training on basic skills, thinking skills personal quality skills, technical skills, and computer skills in the personal quality skills, technical skills, and computer skills in the OREP regional workforce.OREP regional workforce.
Determine the importance of the public education system in the Determine the importance of the public education system in the OREP region for local business investment and expansion, and OREP region for local business investment and expansion, and ascertain the strength of the public school system for the business ascertain the strength of the public school system for the business environment of the region.environment of the region.
Estimate prevailing wage levels and benefit levels associated with Estimate prevailing wage levels and benefit levels associated with common occupational categories.common occupational categories.
Ozarks Regional Economic Partnership Regional Ozarks Regional Economic Partnership Regional Labor Skills Assessment - 2002Labor Skills Assessment - 2002
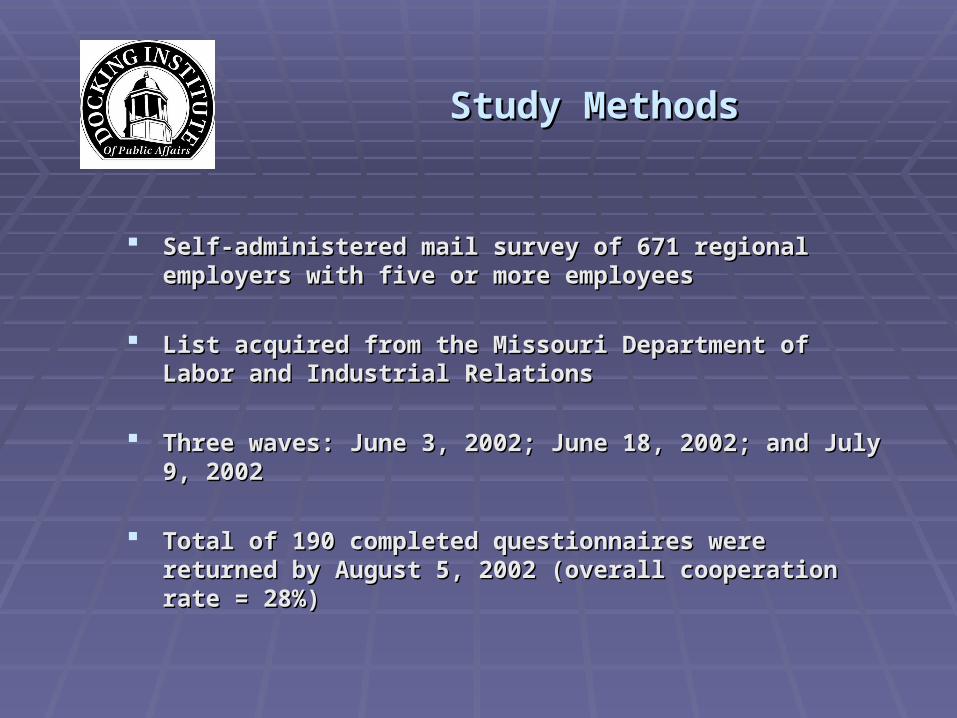
Study MethodsStudy Methods
Self-administered mail survey of 671 regional employers with Self-administered mail survey of 671 regional employers with five or more employeesfive or more employees
List acquired from the Missouri Department of Labor and List acquired from the Missouri Department of Labor and Industrial RelationsIndustrial Relations
Three waves: June 3, 2002; June 18, 2002; and July 9, 2002Three waves: June 3, 2002; June 18, 2002; and July 9, 2002
Total of 190 completed questionnaires were returned by August Total of 190 completed questionnaires were returned by August 5, 2002 (overall cooperation rate = 28%)5, 2002 (overall cooperation rate = 28%)

Ozarks Regional Economic PartnershipOzarks Regional Economic Partnership(Region consists of four subregions)(Region consists of four subregions)
Barry and Lawrence County SubregionBarry and Lawrence County Subregion
Dade, Dallas and Polk County SubregionDade, Dallas and Polk County Subregion
Springfield Metro Subregion (Greene, Webster and Christian)Springfield Metro Subregion (Greene, Webster and Christian)
Taney and Stone County SubregionTaney and Stone County Subregion

Ozarks Regional Economic PartnershipOzarks Regional Economic Partnership(Regional Results)(Regional Results)
Full time employeesFull time employees
Median = 11Median = 11 Minimum = 0Minimum = 0 Maximum = 1,495Maximum = 1,495
Part time employeesPart time employees
Median = 2Median = 2 Minimum = 0Minimum = 0 Maximum = 411Maximum = 411
Total employeesTotal employees
Median = 15Median = 15 Minimum = 2Minimum = 2 Maximum = 1,893Maximum = 1,893

Ozarks Regional Economic PartnershipOzarks Regional Economic Partnership(Regional Results)(Regional Results)
Figure 1: Percentage of Employees by Occupational Category
Cust Serv Staff11.6%
Unskilled Labor18.7%
Truck/Heavy Equip Op
4.0%
Skilled Trades/Crafts
15.1%
Business/Mgmt
11.3%
Desig/Draftsmen0.9%Engineers
0.4%
Lic Care P rov1.7%
Chem P roc/Lab Tech0.8%
Sales Operatives
13.2%
Computer Support
2.3%
Clerical12.7%Other Adv P rof
7.3%

Ozarks Regional Economic PartnershipOzarks Regional Economic Partnership(Regional Results)(Regional Results)
Figure 2: Employer Hiring Plans Over the Next Year
1-5 Additional44.7%
Same Number39.9%
Over 50 Additional2.3%
Reduce6.1%
6-10 Additional6.0%
26-50 Additional0.2%11-25 Additional
0.8%

Ozarks Regional Economic PartnershipOzarks Regional Economic Partnership(Regional Results)(Regional Results)
Figure 3: Required Skill Level for Most Employees
Use Low Skills7.4%
Use Average Skills63.5%
Use High Skills29.0%
Figure 4: Change in Needed Entry Level Skills Past Five Years
Stayed Same31.1%
Increased Slightly42.1%
Decreased Signif2.8%
Decreased Slightly3.0%
Increased Signif21.0%
Ozarks Regional Economic PartnershipOzarks Regional Economic Partnership(Regional Results)(Regional Results)
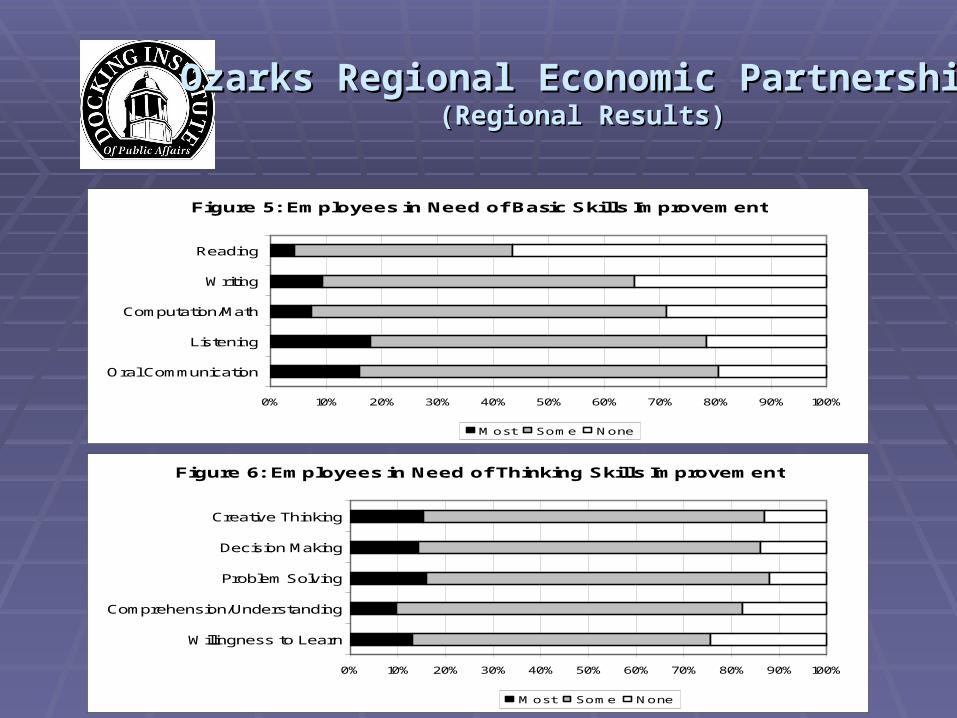
Figure 5: Employees in Need of Basic Skills Improvement
0% 10% 20% 30% 40% 50% 60% 70% 80% 90% 100%
Oral Communication
Listening
Computation/Math
Writing
Reading
Most Some None
Figure 6: Employees in Need of Thinking Skills Improvement
0% 10% 20% 30% 40% 50% 60% 70% 80% 90% 100%
Willingness to Learn
Comprehension/Understanding
Problem Solving
Decision Making
Creative Thinking
Most Some None

Ozarks Regional Economic PartnershipOzarks Regional Economic Partnership(Regional Results)(Regional Results)
Figure 7: Employees in Need of Personal Quality Skills Improvement
0% 10% 20% 30% 40% 50% 60% 70% 80% 90% 100%
Work Attitude/Habits
Adaptability/Flexibility
Leadership
Goal-Setting/P ersonal Motivation
Teamwork
Minority Relations
Gender Relations
Interpersonal Relations
Most Some None

Ozarks Regional Economic PartnershipOzarks Regional Economic Partnership(Regional Results)(Regional Results)
Figure 8a: Employees in Need of Technical Skills Improvement
0% 10% 20% 30% 40% 50% 60% 70% 80% 90% 100%
Business/Mgmt.
Technical/Electrical
Software Competency
Basic Use of a Computer
Technical Language
Typing/Keyboarding
Most Some None
Figure 8b: Employees in Need of Technical Skills Improvement
0% 10% 20% 30% 40% 50% 60% 70% 80% 90% 100%
Other General Labor
Governmental Reg. Compliance
Sales
Skilled Trades/Crafts
Machine Operation
Most Some None
Ozarks Regional Economic PartnershipOzarks Regional Economic Partnership(Regional Results)(Regional Results)
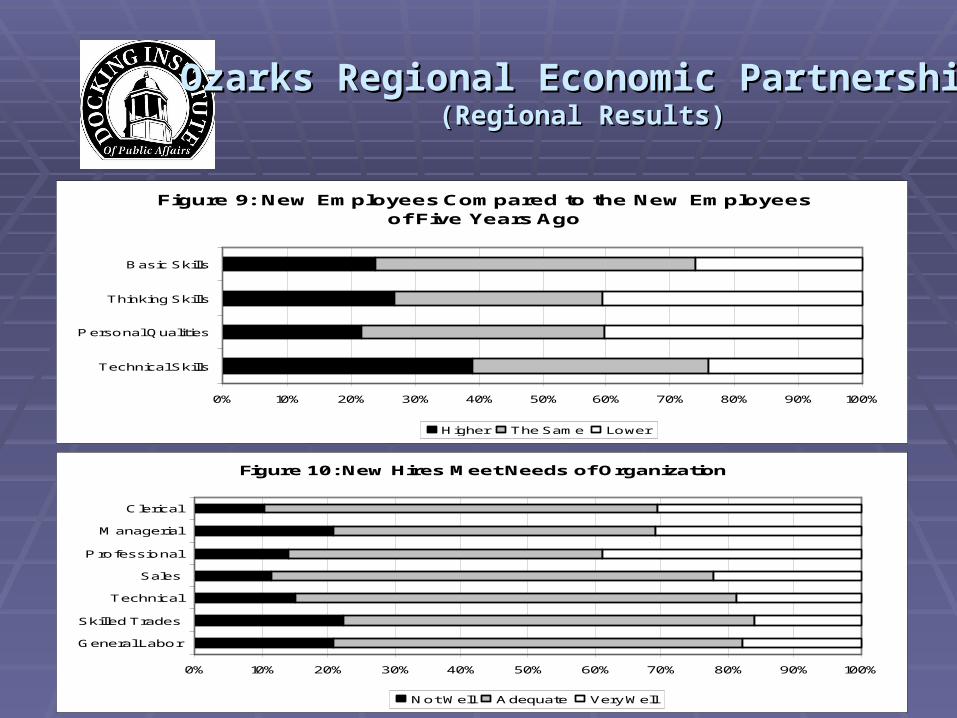
Figure 9: New Employees Compared to the New Employees of Five Years Ago
0% 10% 20% 30% 40% 50% 60% 70% 80% 90% 100%
Technical Skills
P ersonal Qualities
Thinking Skills
Basic Skills
Higher The Same Lower
Figure 10: New Hires Meet Needs of Organization
0% 10% 20% 30% 40% 50% 60% 70% 80% 90% 100%
General Labor
Skilled Trades
Technical
Sales
P rofessional
Managerial
Clerical
Not Well Adequate Very Well

Ozarks Regional Economic PartnershipOzarks Regional Economic Partnership(Regional Results)(Regional Results)
Figure 11: Skilled Employee Productivity Compared to Three
Years Ago
More P roductive
Today31.0%
About the Same40.6%
Less P roductive
Today28.4%
Figure 12: Unskilled Employee Productivity Compared to Three
Years Ago
More P roductive
Today12.7%
About the Same53.3%
Less P roductive
Today34.0%

Ozarks Regional Economic PartnershipOzarks Regional Economic Partnership(Regional Results)(Regional Results)
Percent of Business/Company Employees Underemployed
# of Employers Valid Percent
0-5% 70 41.3%
6-10% 26 15.3%
11-15% 16 9.3%
16-20% 18 10.5%
21-25% 13 7.5%
26-30% 14 8.1%
More than 30% 13 7.9%
Total 170 100.0%

Ozarks Regional Economic PartnershipOzarks Regional Economic Partnership(Regional Results)(Regional Results)
Figure 13: Ease in Hiring Full Time Skilled Employees Compared to Two or Three Years Ago
Slightly More Difficult44.0%
About the Same24.0%
Much More Difficult25.0%
Much Less Difficult
0.9%Slightly
LessDifficult6.2%
Figure 14: Potential for Finding Good Skilled Employees in the Region Over the Next Two to Three Years
Improving14.9%
Staying the Same50.8%
Declining34.3%

Ozarks Regional Economic PartnershipOzarks Regional Economic Partnership(Regional Results)(Regional Results)
Figure 15: Ease in Hiring Full Time Unskilled Employees Compared to Two or Three Years Ago
Much More Difficult
8.1%
Slightly More Difficult28.2%
About the Same44.3%
Slightly LessDifficult
9.8%
Much Less Difficult
9.5%
Figure 16: Potential for Finding Good Unskilled Employees in the Region Over the Next Two to Three
Years
Improving8.5%
Staying the Same60.8%
Declining30.7%

Ozarks Regional Economic PartnershipOzarks Regional Economic Partnership(Regional Results)(Regional Results)
Figure 17: Employees Will Need More Basic Skills Training
0% 10% 20% 30% 40% 50% 60% 70% 80% 90% 100%
Oral Communication
Listening
Computation/Math
Writing
Reading
Yes No
Figure 18: Employees Will Need More Thinking Skills Training
0% 10% 20% 30% 40% 50% 60% 70% 80% 90% 100%
Willingness to Learn
Comprehension/Understanding
P roblem Solving
Decision Making
Creative Thinking
Yes No
Ozarks Regional Economic PartnershipOzarks Regional Economic Partnership(Regional Results)(Regional Results)
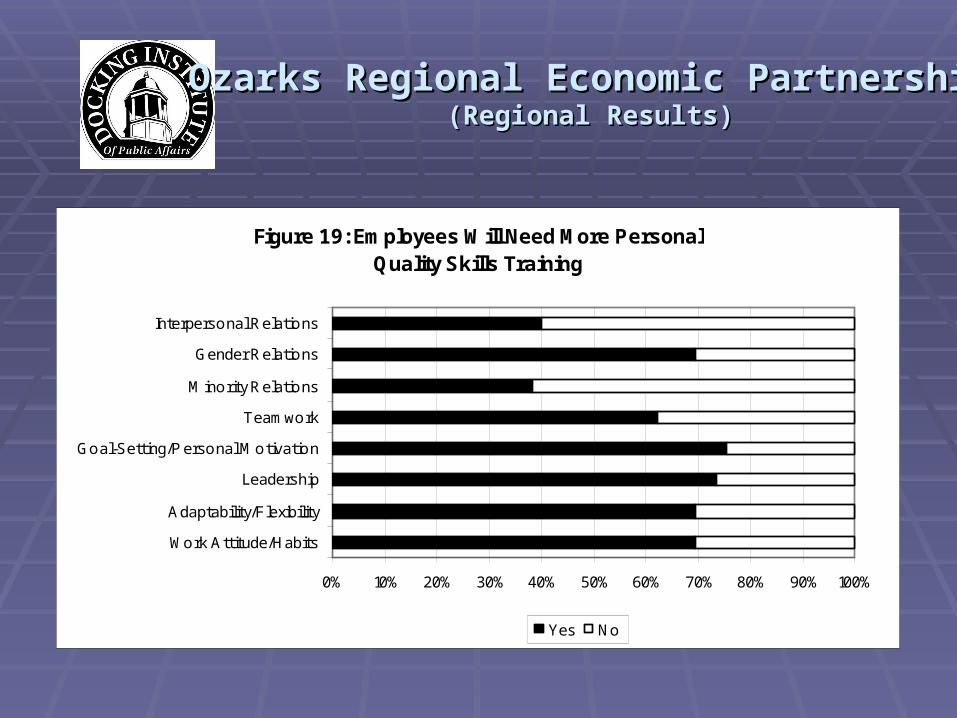
Figure 19: Employees Will Need More Personal Quality Skills Training
0% 10% 20% 30% 40% 50% 60% 70% 80% 90% 100%
Work Attitude/Habits
Adaptability/Flexibility
Leadership
Goal-Setting/P ersonal Motivation
Teamwork
Minority Relations
Gender Relations
Interpersonal Relations
Yes No

Ozarks Regional Economic PartnershipOzarks Regional Economic Partnership(Regional Results)(Regional Results)
Figure 20a: Employees Will Need More Technical Skills Training
0% 10% 20% 30% 40% 50% 60% 70% 80% 90% 100%
Business/Mgmt.
Technical/Electrical
Software Competency
Basic Use of Computer
Technical Language
Typing/Keyboarding
Yes No
Figure 20b: Employees Will Need More Technical Skills Training
0% 10% 20% 30% 40% 50% 60% 70% 80% 90% 100%
Other General Labor
Governmental Reg.Compliance
Sales
Skilled Trades/Crafts
Machine Operation
Yes No

Ozarks Regional Economic PartnershipOzarks Regional Economic Partnership(Regional Results)(Regional Results)
Figure 21: Employee Need for Computer Software Training
0% 10% 20% 30% 40% 50% 60% 70% 80% 90% 100%
Industry Specific Software
Scheduling Software
P resentations Software
CAM Systems
CAD Systems
Computer Languages
Operating Systems
Data Bases
Spread Sheets
Word P rocessing
Need Much Training Need Some Training Need No Training

Ozarks Regional Economic PartnershipOzarks Regional Economic Partnership(Regional Results)(Regional Results)
Figure 23: Importance of Public Education for Organization Expansion and Investment
Unimportant19.4%
Somewhat Important
31.3%
Very Important
49.3%
Figure 24: Public Education in Region as a Strength of the Local Business Environment
Very Much Weakness
5.7%
Somewhat Weakness
23.4%
Neither (neutral)24.3%
Very Much Strength18.2%
Somewhat Strength28.5%
Ozarks Regional Economic PartnershipOzarks Regional Economic Partnership(Regional Results)(Regional Results)
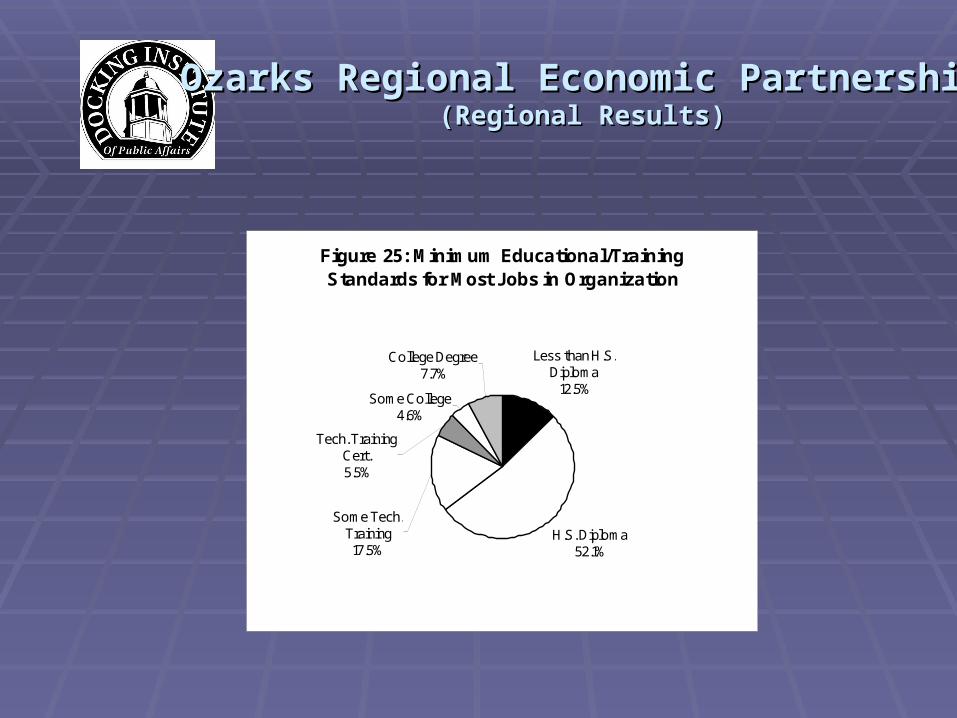
Figure 25: Minimum Educational/Training Standards for Most Jobs in Organization
Less than H.S. Diploma
12.5%
H.S. Diploma52.1%
Some College4.6%
College Degree7.7%
Some Tech. Training17.5%
Tech. Training Cert.5.5%

Ozarks Regional Economic PartnershipOzarks Regional Economic Partnership(Regional Results)(Regional Results)
Wage and Benefit Levels by Occupational Category
Position Average Range of Hourly Vacation Health Care
Retirement
Hourly Wage Wage Rate Benefits Benefits Benefits
($/hour) ($/hour) (%) (%) (%)
Clerical $9.37 $5.50 - $16.00 90.6% 76.6% 65.0%
Computer Support $12.28 $6.00 - $20.00 92.8% 88.1% 77.0%
Sales Operatives $14.09 $2.13 - $45.00 84.7% 86.8% 64.3%
Business/Mgmt $19.86 $6.25 - $121.00 93.1% 86.8% 73.9%
Chem Proc/Lab Tech $11.95 $7.50 - $16.00 86.3% 86.3% 62.0%
Lic Care Prov $13.40 $6.00 - $30.00 84.7% 71.8% 53.1%
Designer/Draftsmen $14.21 $8.00 - $30.00 94.5% 81.0% 57.3%
Engineers $22.43 $10.00 - $40.00 92.7% 92.7% 66.7%
Skilled Trades/Crafts $12.46 $6.00 - $21.00 90.5% 84.5% 61.0%
Truck/Heavy Equip Op $11.30 $7.75 - $20.00 96.0% 89.5% 69.9%
Unskilled Labor $7.78 $5.30 - $14.00 75.8% 67.8% 51.3%
Cust Serv Staff $8.20 $2.13 - $16.00 78.2% 72.2% 59.3%
Other Adv Prof $21.81 $8.00 - $100.00 89.2% 92.6% 75.3%

Summary of FindingsSummary of Findings
Major skill improvement needs include:Major skill improvement needs include: Oral communication and ListeningOral communication and Listening Decision-making and problem-solvingDecision-making and problem-solving Goal-setting/motivation and leadershipGoal-setting/motivation and leadership Software competency and business-Software competency and business-
managementmanagement

Summary of FindingsSummary of Findings
35% of employers find it “slightly more difficult” to find full-time skilled 35% of employers find it “slightly more difficult” to find full-time skilled employees than it was 2 to 3 years ago, while 24% find it “much more employees than it was 2 to 3 years ago, while 24% find it “much more difficult” to do sodifficult” to do so
38% of employers find the workforce a 38% of employers find the workforce a strengthstrength to the business to the business environment, while 38% the workforce a environment, while 38% the workforce a weaknessweakness..
Advertising, referrals, and work-of-mouth are some of the most preferred Advertising, referrals, and work-of-mouth are some of the most preferred practices for recruiting good employees.practices for recruiting good employees.
53% of employers require high school diplomas.53% of employers require high school diplomas.
47% of employers find the public education system a 47% of employers find the public education system a strengthstrength to the to the business environment, while 34% find the workforce a business environment, while 34% find the workforce a weaknessweakness..
The greatest barriers to employee productivity are “childcare availability” The greatest barriers to employee productivity are “childcare availability” and “access to healthcare.”and “access to healthcare.”

Southwest Missouri Labor Basin Southwest Missouri Labor Basin AssessmentAssessment
Southwest Missouri Workforce Skills Southwest Missouri Workforce Skills Assessment SurveyAssessment Survey
Mike WalkerMike Walker
785-628-5563785-628-5563
[email protected]@fhsu.edu
Brett ZollingerBrett Zollinger
785-628-5881785-628-5881
[email protected]@fhsu.edu
www.fhsu.edu/docking www.fhsu.edu/docking