Embed Size (px)
Citation preview
1
Oxon Run
Watershed Implementation Plan (WIP)
August 2010
District Department of the Environment
Office of Natural Resource
Watershed Protection Division

2
TABLE OF CONTENTS
1. DESCRIPTION OF OXON RUN .................................................................................................. 6
1.1. Geology and Soil Conditions .......................................................................................... 6
1.2. Flow Characteristics........................................................................................................ 7
1.3. Water Quality.................................................................................................................. 8
1.4. Land Use ....................................................................................................................... 11
1.5. City Infrastructure ......................................................................................................... 12
1.6. Terrestrial Habitat and Riparian Buffer ........................................................................ 13
1.7. Instream Habitat ............................................................................................................ 15
1.8. Tributaries ..................................................................................................................... 15
2. CURRENT AND PROPOSED MANAGEMENT MEASURES......................................... 17
2.1. Pollution Prevention Plans............................................................................................ 17
2.2. Catch Basin Cleaning.................................................................................................... 18
2.3. Street Sweeping ............................................................................................................ 19
2.4. Public Roads and Alleyways......................................................................................... 20
2.5. Catch Basin Inserts and Screens and Water Quality Catch Basins ............................... 20
2.6. Leaf Collection.............................................................................................................. 21
2.7. RiverSmart Homes Program ......................................................................................... 21
2.8. Rain Leader Disconnect Program ................................................................................. 22
2.9. Green Roof Retrofit Program........................................................................................ 22
2.10. Permeable Pavement ..................................................................................................... 22
2.11. Education of Public on Pet Wastes/Enforcement of Pet Waste Regulations................ 23
2.12. Household Hazardous Waste Collection and Disposal................................................. 24
2.13. Integrated Pest Management and Nutrient Management .............................................. 24
2.14. Tree Planting................................................................................................................. 25
2.15. Erosion and Sediment Control ...................................................................................... 25
2.16. Illicit Discharge and Industrial Facility Inspection and Enforcement........................... 26
2.17. Coal Tar Ban ................................................................................................................. 27
2.18. Skip the Bag Save the River ......................................................................................... 28
3. PUBLIC OUTREACH AND EDUCATION........................................................................ 28
4. LOAD REDUCTIONS ......................................................................................................... 31
4.1. Methodology for Achieving Load Reductions.............................................................. 32
4.2. Metals............................................................................................................................ 33
4.2.1. Metals Reductions..................................................................................................... 34
4.2.2. Metals Conclusion .................................................................................................... 37
4.3. Bacteria ......................................................................................................................... 37
4.3.1. Bacteria Reductions .................................................................................................. 39
4.3.2. Sanitary Sewer Main Repair ..................................................................................... 39
4.3.3. Bacteria Reductions through Identified Projects....................................................... 39
4.3.4. Bacteria Conclusion .................................................................................................. 40
3
4.4. Organics ........................................................................................................................ 40
4.5. Nitrogen ........................................................................................................................ 43
4.6. Phosphorous.................................................................................................................. 44
4.7. Total Suspended Solids (TSS) ...................................................................................... 44
4.8. Reduction Scenarios...................................................................................................... 45
5. IMPLEMENTATION STRATEGY ..................................................................................... 50
5.1. Stakeholders.................................................................................................................. 51
5.1.1. EPA Chesapeake Bay Program................................................................................. 52
5.1.2. District Department of the Environment................................................................... 53
5.1.3. DC Department of Parks and Recreation (DPR) ...................................................... 55
5.1.4. DC Public Schools (DCPS) and Office of Public Education Facilities Modernization
(OPEFM)................................................................................................................................... 55
5.1.5. DC Department of Transportation (DDOT).............................................................. 56
5.1.6. District Department of Public Works (DPW)........................................................... 57
5.1.7. DC Water and Sewer Authority (DC Water) ............................................................ 57
5.1.8. National Park Service (NPS) National Capital Parks East (NCPE).......................... 57
5.1.9. Washington Parks and People (WPP)....................................................................... 58
5.1.10. Casey Trees ............................................................................................................... 58
5.1.11. Neighborhood Advisory Commissions (ANC)......................................................... 58
5.1.12. Oxon Run Community Alliance (ORCA)................................................................. 58
5.1.13. Prince Georges County Department of Environmental Resources ........................... 59
5.1.14. Washington Suburban Sanitary Commission (WSSC)............................................. 59
5.2. Specific Projects............................................................................................................ 59
5.2.1. Low Impact Development......................................................................................... 60
5.2.2. Stream Restoration.................................................................................................... 61
5.2.3. Reforestation and Riparian Buffers........................................................................... 62
5.2.4. Wetland Creation and Rehabilitation........................................................................ 63
5.2.5. Removal of Barriers to Fish Passage ........................................................................ 64
5.2.6. Trash Removal .......................................................................................................... 64
5.3. Implementation Schedule.............................................................................................. 65
5.4. Indicators for Tracking Progress ................................................................................... 74
5.5. Financial and Technical Resources Needed for Management Measures ...................... 80
6. MONITORING..................................................................................................................... 82
6.1. Current Monitoring Strategy......................................................................................... 84
6.2. Enhanced Monitoring Strategy ..................................................................................... 86
7. REFERENCES ..................................................................................................................... 89
TABLE OF TABLES
Table 1: Designated Use “Classes” not supported by Oxon Run water quality (DDOE 305b, 2004)
......................................................................................................................................................... 8
Table 2: Oxon Run watershed sediment production estimates (USFWS, 2003) ......................... 10
4
Table 4: Percent of Land Use in the District of Columbia and Maryland sections of Oxon Run
Watershed (DDOE TMDL, 2004) ................................................................................................... 12
Table 5: Summary of Education and Outreach Materials (also see Appendix B) ........................ 30
Table 6: Oxon Run (DC), Average Annual Existing Metals Loads and TMDLs (lbs./year)............. 34
Table 7: Oxon Run (MD), Existing Loads and Necessary Reductions (lbs./year).......................... 34
Table 8: Load Reductions for Metals from Identified Retrofit Projects....................................... 35
Table 9: Example of Metals Reduction Chart for Bioretention.................................................... 36
Table 10: Expected Copper Load Reductions from Identified Retrofit Projects.......................... 36
Table 11: Oxon Run (DC), Average Annual Existing Bacteria Loads and TMDL (MPN/year) ....... 38
Table 12: Oxon Run (MD), Existing Bacteria Loads and Necessary Reductions (MPN/year)....... 39
Table 13: Bacteria Reductions from Projects Identified in Appendix C ....................................... 40
Table 14 : Oxon Run (DC), Average Annual Existing Organics Loads and TMDLs (lbs./year)....... 41
Table 15: Oxon Run (MD), Existing Organics Loads and Necessary Reductions (lbs./year)......... 41
Table 16: Expected Load Reductions for Projects Identified in Appendix C ................................ 42
Table 17: Expected DDT Removal Rates....................................................................................... 42
Table 18: Load Reduction from Projects Identified in Appendix C. ............................................. 44
Table 19: Load Reductions due to Reforestation Projects........................................................... 45
Table 20: Scenario 1 - Moderate Stormwater Control and Extensive Vacuum Sweeping .......... 47
Table 21: Scenario 2 - Intensive Stormwater Control and Moderate Vacuum Sweeping ........... 48
Table 22: Scenario 3 - Intensive Stormwater Control and Intensive Street Sweeping................ 49
Table 23: Implementation Strategy Phases and Timeline............................................................ 50
Table 24: Temporal Implementation Strategy ............................................................................. 51
Table 25: Outreach Priority Agencies and Timeline ..................................................................... 52
Table 26: Project Prioritization cumulative Score Groupings ...................................................... 65
Table 27: Ranking Factors for Project Prioritization and Assigned Numerical Values................ 66
Table 28: Project Priority List........................................................................................................ 67
Table 29: Percentage of Watershed Treated Per Project Phase.................................................. 74
Table 30: Load Reductions Associated with Near Term Projects................................................. 75
Table 31: Load Reductions Associated with Medium Term Projects........................................... 76
Table 32: Load Reductions Associated with Far Term Projects and Cumulative Reductions...... 77
Table 33: Bacteria Reductions per Project Phase......................................................................... 79
Table 34: Cost of Implementing Identified Restoration Projects................................................. 81
Table 35: Designated Use Indicators ............................................................................................ 84
Table 36: Summary of Current Monitoring Activities .................................................................. 85
TABLE OF FIGURES
Figure 1: Projected Pollutant Reductions…………………………………………………………………………………78
Figure 2: Percent Reductions of Bacteria per Project Phase (MPN/yr)…………………………………….80

5
APPENDICES
Appendix A – Maps
Appendix B – Educational Materials & Outreach Materials
Appendix C – Projects List
Appendix D – Reduction Charts
Appendix E – Other LID & Stream Restoration
Appendix F – Trash & Pollution Preventions Sites
Appendix G – Reforestation Project Summaries
Appendix H – MS4 DMR Stormwater Outfall Monitoring Data for Oxon Run
Appendix I – Oxon Run WASA Sewer Line Replacement Maps
Appendix J – US FWS Stream Restoration Concept Design

6
1. DESCRIPTION OF OXON RUN
Oxon Run is a tributary of the Potomac River with a watershed measuring approximately 7,906
acres, or 12.4 square miles. Oxon Run’s Potomac River confluence is marked by Oxon Cove, a
feature located along the east bank of the Potomac River, just south of the District’s
southeastern boundary with Maryland Prince Georges County. Oxon Run begins its roughly
eight mile course in the Oakland Area in Prince Georges County Maryland, north east of
Pennsylvania Avenue, with the headwaters emanating from a storm drain pipe that drains a
shopping center parking lot. From here, Oxon Run roughly parallels Pennsylvania Avenue up to
the District line. Upon entering the District, Oxon Run flows naturally through National Park
Service land. At 13th Street SE, an almost 1.5 mile section of concrete-lined channel begins.
The stream, after crossing South Capitol Street, enters a natural reach that is bounded on
either side by National Park Service and District Department of Recreation property, before
crossing the Prince George’s County line again. Oxon Run is tidally influenced from its mouth in
Oxon Cove to a flood control drop structure in Prince George’s County near the downstream
border with the District.
The majority of the District’s portion of Oxon Run flows through a trapezoidal concrete-lined
channel, measuring up to 50 feet in width. Within the entire watershed, there are 15.3 miles
of natural channel. Almost all of Oxon Run’s feeder streams have been converted to
subterranean stormwater pipes that discharge into the stream throughout its reach. Riparian
forest buffer is essentially nonexistent along the channelized sections of Oxon Run’s main
stem. Approximately 33 percent of the Oxon Run watershed consists of impervious surface
(USFWS, 2003). In the District portion of Oxon Run watershed, however, approximately 37
percent of the watershed is covered in impervious surface.
1.1. Geology and Soil Conditions
Oxon Run’s geology and soils are typical of the coastal plain ecoregion. Stratified alluvial sand
of the Patapsco formation and Arundel Clay sediments dominate the stream valley’s lowest
areas, while more gravel is found in the uplands (USFWS, 2003). The following is a list of all of
the watershed’s geological formations, in order of prevalence, with their associated geologic
age:
Patapsco formation and Arundel Clay (Upper Cretaceous)
Brandywine Gravel (Pliocene)
Pamlico Formation and Recent Alluvium (Pleistocene/recent)
Wicomico Formation (Pleistocene)
Chesapeake Group (Miocene Coastal Plain)
Aquia Greensand (Eocene)
Monmouth Formation (Upper Cretaceous)

7
The soils found in the District’s portion of the watershed are dominated by three major
associations, that due to development, all contain a significant urban land component. Urban
land consists of areas that are occupied by structures and works. Commonly, these soils have
been cut or graded. Furthermore, the materials around building foundations generally consist
of a mix of parent soil material from the surrounding area and construction and demolition
debris (USDA, 1976).
Urban Land – Beltsville-Chillum:
The most prevalent general soil association in the District portion of the watershed is the
Urban Land Beltsville-Chillum association. It is found perched above the valley floor on Oxon
Run’s broad uplands. These soils are deep, underlain by sandy or gravelly deposits and range
from nearly level to steep, and from well drained to moderately well drained.
Urban Land – Christiana Sunnyside:
The Christiana-Sunnyside association is comprised of predominantly upland soils that are deep,
well-drained, underlain by unstable clayey sediment and range from nearly level to steep.
Luka – Lindside Codorus:
Oxon Run’s channel is cut through the soils of this association. These soils are deep, nearly
level to moderately sloping, and somewhat excessively drained. Since they are part of sandy,
old, unconsolidated terraces, they are also highly erodible.
The remaining soil associations of the Oxon Run watershed are listed below.
Urban Land – Galestown-Rumsford
Urban Land – Sassafras-Chillum
Udorthents
Landfill
1.2. Flow Characteristics
Within the entire Oxon Run watershed there are a total of 15.3 miles of natural channel
amongst Oxon Run and its tributaries. This amount represents only about 60 percent of the
natural channel found in the watershed prior to development. The remaining 40 percent has
been relegated to either pipe or concrete-lined channel. As a result of this reduction in natural
channel and the high percentage of impervious surface in the watershed, the stream tends to
witness flashy, intense flows. Bankfull estimates made by the USFWS during their stream and
watershed assessment range between 375 and 450 cfs for Oxon Run’s lower District reach
(USFWS, 2003).
In the District portion of Oxon Run, the majority of the watershed is comprised of piped
stormwater sewers that are part of the District’s Municipal Separated Storm Sewer System

8
(MS4). While there are some unpiped sections of the watershed, mainly in areas owned by the
National Park Service, overland sheet flow during storm events in these areas is likely a minimal
contributor to the overall flow regime for the stream. The MS4, on the other hand, is the most
significant National Pollutant Discharge Elimination System (NPDES) permitted facility in the
District portion of the Oxon Run watershed and the major contributor to degraded water
quality in Oxon Run. There are no fewer than 38 stormwater
outfalls on the District’s portion of Oxon Run. A high ratio of
impervious surface cover within MS4 areas is linked to the
dense urban land use that characterizes the watershed. The
radically altered flow regime, when compared with
predevelopment hydrology, has contributed to down cutting,
channel widening and stream bank erosion in the portions of
the stream without channels. Surprisingly, certain sections of
the concrete lined trapezoidal channel have been severely
degraded, presumably due to persistent high volume and high
velocity flows. This flow regime and the associated water
quality degradation are typical of urban streams. (Urban
Stormwater Management in the US, NRC 2008) Eroded stream bank in Oxon Run
1.3. Water Quality
Environmental health information regarding Oxon Run’s water quality is derived from the
District’s 2002 Clean Water Act §305(b) - Water Quality Report to U.S. EPA and Congress. Data
used in the report was gathered and analyzed by the District Department of the Environment
(DDOE) Water Quality Division. According to the report, pathogenic and toxic effects, delivered
by urban runoff and stormwater discharges, have severely degraded Oxon Run’s water quality,
and as a result, the stream does not support any of its designated use “classes” (see Table 1).
This non-support of use-classes led to Oxon Run’s presence on the District of Columbia’s 1998
through 2004 Section 303(d) List of Impaired Waters, which triggered the 2004 preparation of
Total Maximum Daily Loads (TMDLs) for the pollutants responsible for this impairment.
Table 1: Designated Use “Classes” not supported by Oxon Run water quality (DDOE 305b,
2004)
Class Use
A Primary Contact Recreation (Recreation “in” the water)
B Secondary Contact Recreation (Recreation “on” the water)
C Protection and propagation of fish, shellfish, and wildlife
D Protection of human health related to fish and shellfish consumption
9
While Oxon Run certainly has degraded water quality and wildlife habitat, it should be noted
that there is a paucity of data to support the TMDL designations, in particular for organic
pollutants. Due to a lack of data for total metals and organic pollutants, the Oxon Run TMDLs
for these two pollutants where developed using fish tissue and sediment data collected in the
Anacostia River. It was assumed that a relatively homogenous distribution of urban land
located throughout the District would lead to similar pollutant loading rates between the
Anacostia and Oxon Run. Pollutants associated with urban land uses, such as the application of
coal tar sealants to parking lots (now banned under District law), vehicular traffic, and
atmospheric deposition, are indeed similar between the two watersheds. The relative
distribution of land uses is also similar between the two watersheds, however, in aggregate the
Anacostia River watershed has many more historic and present day sources, of both point and
non-point pollution. The Anacostia Watershed has a much larger land area and has historic
industrial land uses (e.g., the Washington DC Navy Yard). In addition, the tidal Anacostia is
dominated by low flow regimes with an estimated water residence time between 23 to 28
days, while the free flowing Oxon Run has a highly abbreviated water residence time that
minimizes the possibility for the accumulation of contaminated sediments. In other words,
Oxon Run TMDLs may be flawed, and at a minimum require more robust data collection to
support the assumptions.
Monitoring data does exist, however, for bacteria and dissolved metals. Fecal Coliform and
dissolved metals data were collected from 1990 to 2002 at a downstream monitoring station in
Oxon Run. The Department of Health, Water Quality Division (later to become part of DDOE)
used a modified version of the Interstate Commission on the Potomac River Basin small
tributaries model. The DC Small Tributaries TMDL model is a simple mass balance model which
predicts daily water column concentrations of each modeled constituent in Oxon Run. The
model is composed of three sub-models: an organic chemicals sub-model, an inorganic
chemicals sub-model, and a bacteria sub-model. Data incorporated into the model included:
DDOE 1990 to 2002 fecal coliform and dissolved metals monitoring data for Oxon Run, the
1995 to 1996 ICPRB Anacostia River toxics study, District Water and Sewer Authority Long Term
Control Plan outfall monitoring data, and MS4 outfall monitoring data. (DC Oxon Run TMDL,
2004) The only monitoring data actually collected on Oxon Run did not measure total metals or
organics. Moreover, the Oxon Run monitoring data was collected at one downstream location
and it is not clear whether this data was collected under wet or dry conditions. The
downstream location also complicates the attribution of the bacteria waste load allocation to
the MS4. There are no fewer than ten sewer line crossings throughout the District portion of
Oxon Run, which may contribute to point sources of bacteria. During their watershed survey,
US Fish and Wildlife Services (USFWS) noted broken sewer line crossings in Maryland Prince
George’s County that may also be point sources of bacteria, if they remain unrepaired. While
the DDOE monitoring data is valuable, more robust and broad spectrum monitoring is required
to help determine if the actual listed pollutants are affecting water quality and preventing the
Oxon Run from achieving designated uses.

10
In addition to bacterial and chemical pollutants, there
are other pollutants not included on the EPA 303(d)
list, that affect water quality in Oxon Run and
ultimately the Potomac River and beyond. One of
these non-point sources of pollution in Oxon Run is
sediment. As estimated in the US Fish and Wildlife
Service’s Oxon Run, Washington, DC Watershed and
Stream Assessment (2003), stream bank erosion in
the Oxon Run watershed contributes over 18,000
tons of sediment to the Potomac River every year, 6
percent of which comes from the District’s portion.
USFWS’s complete estimates can be found in Table 2. Degraded Sewer System infrastructure in Oxon Run
Table 2: Oxon Run watershed sediment production estimates (USFWS, 2003)
Watershed Sediment Load
Oxon Run (DC) 1,032 tons/year
Oxon Run and tributaries (Prince George’s
County)
5,909 tons/year
Barnaby Run and tributaries 8,717 tons/year
Forest Heights Tributary 2,565 tons/year
Watershed Total 18,224 tons/year
Besides sediment, Oxon run is also impacted by trash. Investigators noticed high levels of litter
distributed throughout the watershed
and in the stream. Litter accumulates
in catch basins and along streets, and
is conveyed via the MS4 during storm
events to the receiving water, in this
case Oxon Run. Litter may also be
blown by wind, or directly dumped
into the stream. Levels of trash in the
stream, deposited along stream banks
or accumulated in snags, was
observed to be very high. The
elimination of trash from District
waterways is a tangible indicator of Plastic bottles and other debris entrained in a snag along Oxon Run
water quality improvement. Trash free streams and rivers enhance both the aesthetic benefits
and the environmental health of District waterways. In signing the Trash Free Potomac River
11
Treaty, the Mayor committed the District to the elimination of trash from the Potomac River by
2013. This goal also includes the elimination of trash from Oxon Run. Recently, the EPA has
begun the process of regulating trash under the clean water act, and is in the process of issuing
a trash TMDL for the Anacostia River. More investigation into the effects of trash on the
designated uses of Oxon Run is warranted.
While no TMDLs exist for nitrogen, phosphorus, or total suspended solids (TSS) in the District
portion of the Oxon Run watershed, the District is still committed to reducing these pollutants
in accordance with the Chesapeake Bay Agreement. As the EPA moves to enforce the
Chesapeake Bay TMDL, it is expected that load reductions for nitrogen, phosphorus and TSS
will be assigned to the Potomac’s tributaries, which may mean required reductions for Oxon
Run. At this time, however, data for nitrogen and phosphorus appear to indicate that they do
not impair water quality in Oxon Run.
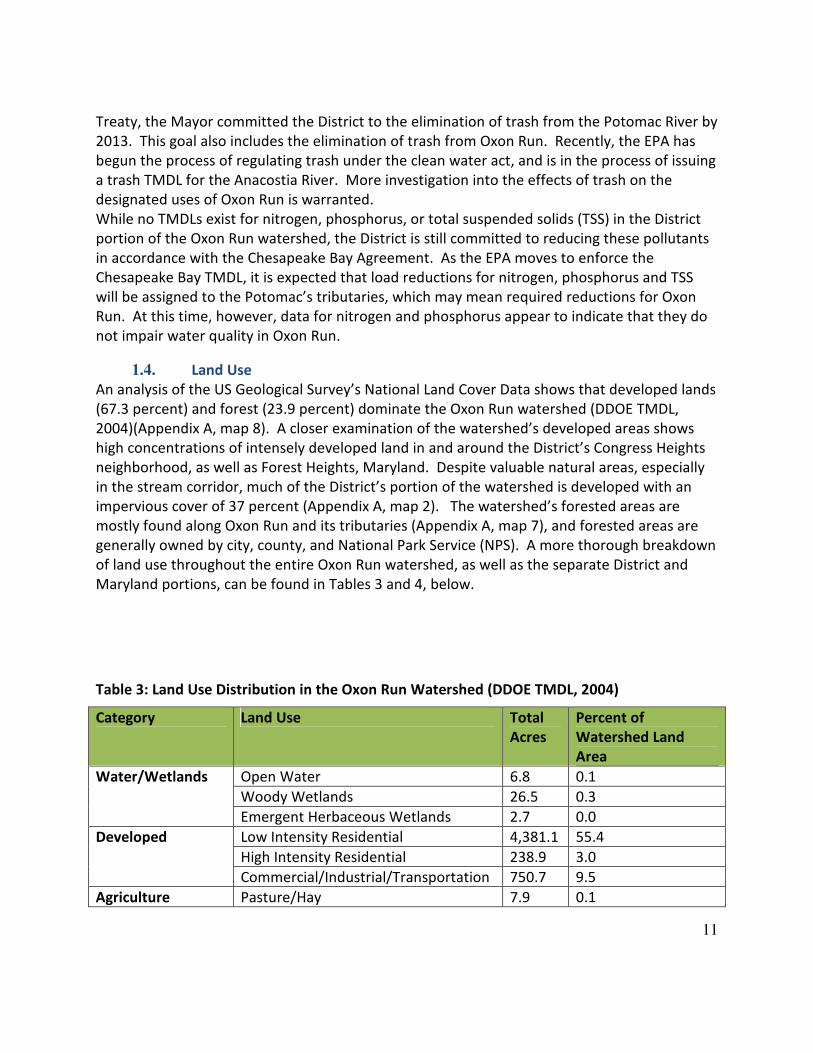
1.4. Land Use
An analysis of the US Geological Survey’s National Land Cover Data shows that developed lands
(67.3 percent) and forest (23.9 percent) dominate the Oxon Run watershed (DDOE TMDL,
2004)(Appendix A, map 8). A closer examination of the watershed’s developed areas shows
high concentrations of intensely developed land in and around the District’s Congress Heights
neighborhood, as well as Forest Heights, Maryland. Despite valuable natural areas, especially
in the stream corridor, much of the District’s portion of the watershed is developed with an
impervious cover of 37 percent (Appendix A, map 2). The watershed’s forested areas are
mostly found along Oxon Run and its tributaries (Appendix A, map 7), and forested areas are
generally owned by city, county, and National Park Service (NPS). A more thorough breakdown
of land use throughout the entire Oxon Run watershed, as well as the separate District and
Maryland portions, can be found in Tables 3 and 4, below.
Table 3: Land Use Distribution in the Oxon Run Watershed (DDOE TMDL, 2004)
Category Land Use Total
Acres
Percent of
Watershed Land
Area
Open Water 6.8 0.1
Woody Wetlands 26.5 0.3
Water/Wetlands
Emergent Herbaceous Wetlands 2.7 0.0
Low Intensity Residential 4,381.1 55.4
High Intensity Residential 238.9 3.0
Developed
Commercial/Industrial/Transportation 750.7 9.5
Agriculture Pasture/Hay 7.9 0.1
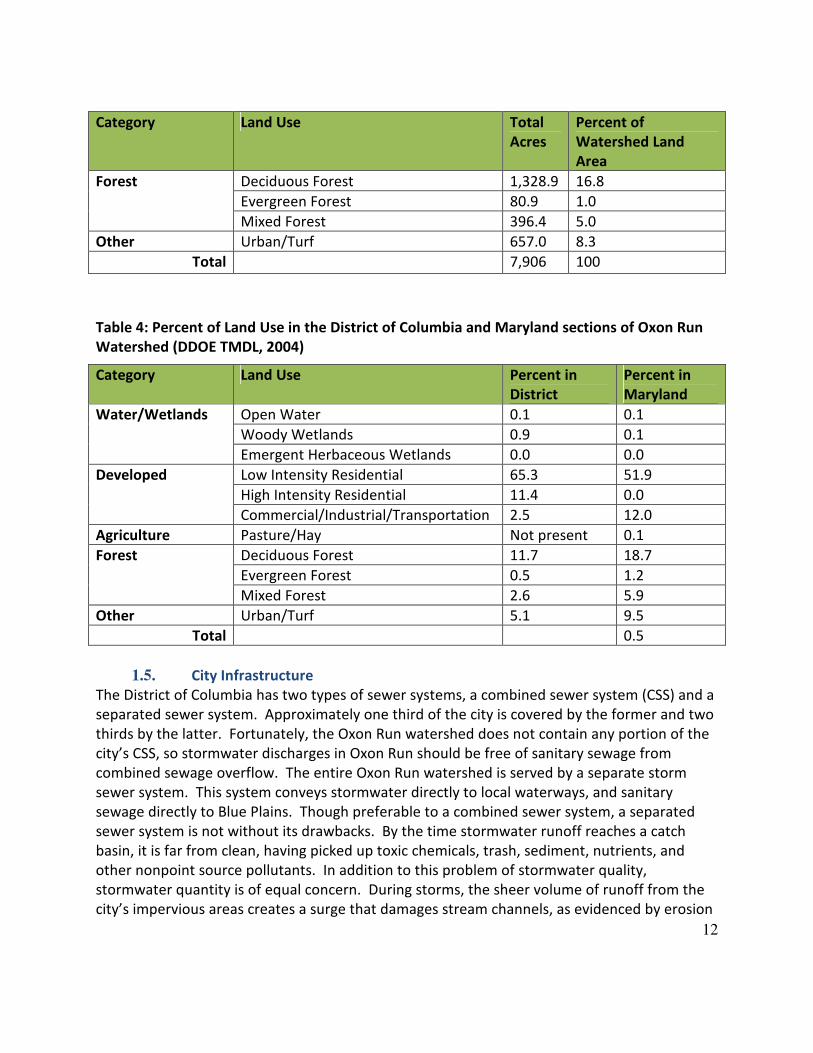
12
Category Land Use Total
Acres
Percent of
Watershed Land
Area
Deciduous Forest 1,328.9 16.8
Evergreen Forest 80.9 1.0
Forest
Mixed Forest 396.4 5.0
Other Urban/Turf 657.0 8.3
Total 7,906 100
Table 4: Percent of Land Use in the District of Columbia and Maryland sections of Oxon Run
Watershed (DDOE TMDL, 2004)
Category Land Use Percent in
District
Percent in
Maryland
Open Water 0.1 0.1
Woody Wetlands 0.9 0.1
Water/Wetlands
Emergent Herbaceous Wetlands 0.0 0.0
Low Intensity Residential 65.3 51.9
High Intensity Residential 11.4 0.0
Developed
Commercial/Industrial/Transportation 2.5 12.0
Agriculture Pasture/Hay Not present 0.1
Deciduous Forest 11.7 18.7
Evergreen Forest 0.5 1.2
Forest
Mixed Forest 2.6 5.9
Other Urban/Turf 5.1 9.5
Total 0.5
1.5. City Infrastructure
The District of Columbia has two types of sewer systems, a combined sewer system (CSS) and a
separated sewer system. Approximately one third of the city is covered by the former and two
thirds by the latter. Fortunately, the Oxon Run watershed does not contain any portion of the
city’s CSS, so stormwater discharges in Oxon Run should be free of sanitary sewage from
combined sewage overflow. The entire Oxon Run watershed is served by a separate storm
sewer system. This system conveys stormwater directly to local waterways, and sanitary
sewage directly to Blue Plains. Though preferable to a combined sewer system, a separated
sewer system is not without its drawbacks. By the time stormwater runoff reaches a catch
basin, it is far from clean, having picked up toxic chemicals, trash, sediment, nutrients, and
other nonpoint source pollutants. In addition to this problem of stormwater quality,
stormwater quantity is of equal concern. During storms, the sheer volume of runoff from the
city’s impervious areas creates a surge that damages stream channels, as evidenced by erosion

13
in Oxon Run. According to WASA records, 38 storm sewer outfalls discharge directly into Oxon
Run’s District portion alone (USFWS, 2003). In addition, the “sewersheds” draining to these
outfalls cover approximately 85 percent (1,766 acres) of Oxon Run’s District watershed area
(DDOE TMDL, 2004).
1.6. Terrestrial Habitat and Riparian Buffer
Prior to its development, the Oxon Run watershed contained some of the most unique
ecosystems in the District and the region. This area is underlain by gravel terrace sediments
that are highly acidic and composed of layers of well-drained gravel and sandy sediments over
fine silt and clay layers. The underlying geology combined with rolling topography created an
environment rich in springs and seeps, and composed of complex and diverse micro-
ecosystems. These micro-ecosystems provided habitat for a diversity of wildlife species, many
dependent on these environments for food, forage, and breeding habitat. Remnants of these
ecosystems still exist in the Oxon Run watershed. These remnants are part of an important
network of protected habitats spanning the District and surrounding region that support
species of greatest conservation need such as the wood duck, red shouldered hawk, brown
thrasher, gray fox, opossum, flying squirrel, box turtle, painted turtle, and queen snake. This
network of habitats is also vital for the support of populations of more common wildlife such
as the sharp-shinned hawk, downy woodpecker, white-tailed deer, red fox, grey squirrel, and
raccoon.
The largest remnant habitats are within the National Park Service (NPS) portion of Oxon Run
Park and the NPS portion of Bald Eagle Hill Park. Oxon Run Park contains one of the rarest and
most unique ecosystems in the region, the Sweetbay Magnolia bog. These bogs only occur in
gravelly sediments along the fall line within northern Virginia, the District and Central Maryland
where hilly terrain abuts floodplain bottomlands, and where the porous gravelly soil is
underlain by restricting clay layers. These conditions create numerous seeps and springs that
feed together and spread across the floodplain, creating an extremely acidic (pH 4-5), low
nutrient, bog environment. These bogs support a diversity of rare plant species and are home
to much resident and migratory wildlife, such as frogs, toads, turtles, ducks, and invertebrates
that depend on these wet areas for many aspects of their life functions. The copepod
Acanthocyclops columbiensis, a small crustacean that lives in groundwater, is endemic to this
habitat. A mix of tree species forms a diverse canopy with trees like sweetbay magnolia,
sweetgum, American hornbeam, tulip poplar, river birch, and willow oak. The understory is
dominated by shrubs such as possumhaw, huckleberry, blueberry, and swamp azalea.
Sphagnum moss is ubiquitous throughout, growing at the bases of trees and forming small
hummocks within the bog, where many rare herbaceous plant species are known to occur.
This sphagnum moss is also prime micro-habitat for terrestrial salamanders, such as the
redback (Designated by DDOE as a Species of Greatest Conservation Need) and four-toed
salamander, to lay their eggs. Magnolia bogs are fragile ecosystems that are at risk from
invasive plants, alterations in underlying hydrology from development, water quality
14
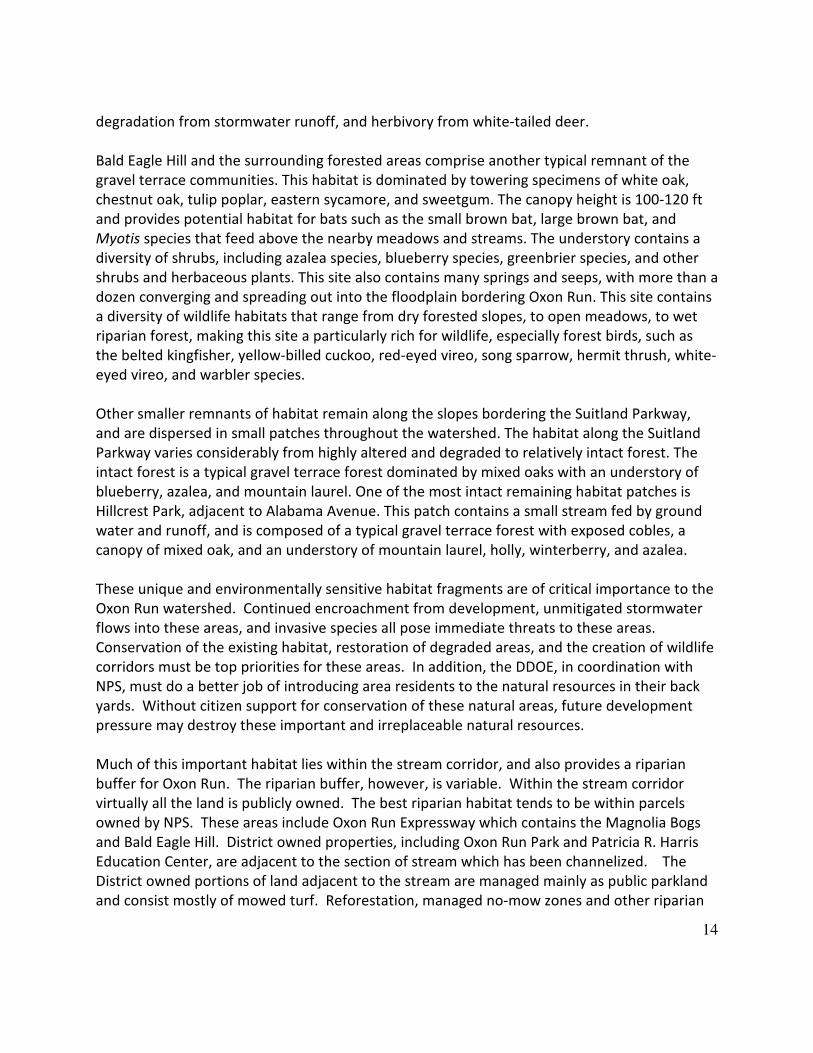
degradation from stormwater runoff, and herbivory from white-tailed deer.
Bald Eagle Hill and the surrounding forested areas comprise another typical remnant of the
gravel terrace communities. This habitat is dominated by towering specimens of white oak,
chestnut oak, tulip poplar, eastern sycamore, and sweetgum. The canopy height is 100-120 ft
and provides potential habitat for bats such as the small brown bat, large brown bat, and
Myotis species that feed above the nearby meadows and streams. The understory contains a
diversity of shrubs, including azalea species, blueberry species, greenbrier species, and other
shrubs and herbaceous plants. This site also contains many springs and seeps, with more than a
dozen converging and spreading out into the floodplain bordering Oxon Run. This site contains
a diversity of wildlife habitats that range from dry forested slopes, to open meadows, to wet
riparian forest, making this site a particularly rich for wildlife, especially forest birds, such as
the belted kingfisher, yellow-billed cuckoo, red-eyed vireo, song sparrow, hermit thrush, white-
eyed vireo, and warbler species.
Other smaller remnants of habitat remain along the slopes bordering the Suitland Parkway,
and are dispersed in small patches throughout the watershed. The habitat along the Suitland
Parkway varies considerably from highly altered and degraded to relatively intact forest. The
intact forest is a typical gravel terrace forest dominated by mixed oaks with an understory of
blueberry, azalea, and mountain laurel. One of the most intact remaining habitat patches is
Hillcrest Park, adjacent to Alabama Avenue. This patch contains a small stream fed by ground
water and runoff, and is composed of a typical gravel terrace forest with exposed cobles, a
canopy of mixed oak, and an understory of mountain laurel, holly, winterberry, and azalea.
These unique and environmentally sensitive habitat fragments are of critical importance to the
Oxon Run watershed. Continued encroachment from development, unmitigated stormwater
flows into these areas, and invasive species all pose immediate threats to these areas.
Conservation of the existing habitat, restoration of degraded areas, and the creation of wildlife
corridors must be top priorities for these areas. In addition, the DDOE, in coordination with
NPS, must do a better job of introducing area residents to the natural resources in their back
yards. Without citizen support for conservation of these natural areas, future development
pressure may destroy these important and irreplaceable natural resources.
Much of this important habitat lies within the stream corridor, and also provides a riparian
buffer for Oxon Run. The riparian buffer, however, is variable. Within the stream corridor
virtually all the land is publicly owned. The best riparian habitat tends to be within parcels
owned by NPS. These areas include Oxon Run Expressway which contains the Magnolia Bogs
and Bald Eagle Hill. District owned properties, including Oxon Run Park and Patricia R. Harris
Education Center, are adjacent to the section of stream which has been channelized. The
District owned portions of land adjacent to the stream are managed mainly as public parkland
and consist mostly of mowed turf. Reforestation, managed no-mow zones and other riparian

15
buffer enhancements are needed in this area of the stream corridor, yet may have limited
water quality benefits since flows mainly discharge through the MS4 system. Improving forest
cover and habitat will, however, help link otherwise fragmented areas important to wildlife.
1.7. Instream Habitat
Oxon Run’s instream habitat is poor. In the nearly two-mile long section of the stream where
there is a concrete lined trapezoidal channel, instream habitat for fish and benthic
communities is virtually non-existent. In the non-channelized sections, USFWS noted, “most
reaches have marginal bed feature development and do not have the riffle/pool sequences
necessary to sustain an aquatic community typical of coastal plain streams” (2003). An
American University Study drew similar conclusions stating, “Habitat degradation obviously is
responsible for much of the impairment of this stream, but the low diversity and abundance of
all animals suggests that toxic and organic pollution also may be important” (Banta, 1993).
However, further monitoring is necessary to validate assumptions regarding pollutants.
Oxon Run’s lack of well-defined bed features is due to the frequency of high stormwater flows,
which mobilize the sediments that form these features. The associated bank erosion and
channel widening exacerbates this habitat problem by decreasing average water depths.
Stream bed and bank erosion, however, are not the only fish habitat problems in Oxon Run.
Fish are prevented from entering the upper reaches of Oxon Run, in the District and beyond,
because of a concrete drop structure built by the Army Corps of Engineers for flood control in
the Forest Heights neighborhood. These flood control devices are located just outside the
District border, in Prince George’s County, Maryland. Upstream WASA sewer crossings, where
the stream bed has down cut exposing the infrastructure, also create fish barriers. In addition
the nearly two mile long concrete lined trapezoidal channel in the District portion of Oxon Run
offers virtually no aquatic habitat and further degrades downstream habitat. Aquatic habitat
and bed features are virtually non-existent throughout this entire two mile long stretch of
concrete channel. The investigators noted elevated water temperatures on the downstream
end of the concrete channel. Elevated temperature is a result of degraded riparian buffers and
the accumulation of heat, from solar energy, in the concrete channel itself. Bank erosion and
other effects of high intensity storm flows are also most severe on the downstream end of the
trapezoidal channel.
1.8. Tributaries
The Oxon Run watershed contains a number of subwatersheds. These subwatersheds are
primarily located in Prince George’s County. Though outside of District jurisdiction, the USFWS
did conduct basic assessments of these tributaries during their Oxon Run watershed
assessment (2003). Summaries of these findings are provided below:
Suitland Parkway Tributary
The USFWS traced the headwaters of the “Suitland Parkway Tributary” to an outfall that drains

16
the Suitland Federal Center. Throughout its 9,128 ft. length, the tributary exhibits a diversity of
reaches, including a gabion-lined reach, a natural channel reach, and a “restored” reach that
contains boulder grade control features, fiber mats, willow stakes, and riprap. Overall, USFWS
designated the Suitland Parkway Tributary a C4 stream type, with some evidence of bank
erosion.
Barnaby Run
Barnaby Run connects Oxon Run to two perennial tributaries, which are unofficially named
Glasmanor Tributary and Owens Road Tributary. With a subwatershed covering approximately
40 percent of Oxon Run’s total watershed area (mostly in Prince George’s County), Barnaby
Run is Oxon Run’s largest tributary. While assessing Barnaby Run’s upper, natural channel
sections, USFWS documented areas of instability, lateral migration, 12-20 ft. high banks, high
sediment supply, and a sanitary sewer break. In the
vicinity of the District Maryland border, Barnaby Run
parallels Southern Avenue in a pipe, and further
downstream in an open concrete channel. After crossing
Route 210, and before meeting Oxon Run, Barnaby Run
enters a channelized, natural stream bed that features
some concrete block revetments. USFWS characterized
this reach as an unstable F4 stream type, with very
high sediment supply and poor recovery potential. Barnaby Run During a rain event
Glassmanor Tributary
Glassmanor’s headwaters originate from a stormwater pipe behind Roscroft Village Circle, and
from a sub-tributary at the end of Alice Avenue. USFWS found both headwater segments to be
sites of active headcutting and high sediment supply. The main stem of Glassmanor is also
unstable despite its wide (75-500 ft.) riparian buffer. From Kennebec Street downstream to
Glassmanor’s confluence with Barnaby Run, the channel is concrete-lined.
Owens Road Tributary
The upstream reaches of the Owens Road tributary, just below the intersection of Woodland
Boulevard and Boulder Drive, are either piped or concrete-lined. Although the tributary
features a natural stream bed throughout the remainder of its length, it was concluded that
the stream has mostly converted, via head cutting, from a stable C4 type to an unstable F4
type. Most of the remaining C4 reaches are being sustained by utility crossings, which
currently provide grade control.
Forest Heights Tributary
The Forest Heights Tributary is the final tributary to join Oxon Run before it empties into Oxon
Cove. Unofficially named after its surrounding neighborhood, the tributary runs along

17
Livingston Road for much its 10,057-foot length. USFWS classified the Forest Heights
Tributary’s non-piped/concrete-lined reaches as unstable F4 channels with poor recovery
potential. A concrete drop structure, part of USACE’s Forest Heights flood control project, is
located in the Forest Heights Tributary, just before its confluence with Oxon Run. A larger drop
structure, also part of this project, is located in Oxon Run, just upstream of this confluence.
2. CURRENT AND PROPOSED MANAGEMENT MEASURES
General Management Measures
General management measures are tasks that are taking place throughout the watershed.
These measures are generally non-structural best management practices (BMPs), which seek to
reduce pollutants before they enter Oxon Run. Non-structural BMPS include legal regulation,
construction plan review and regulation, public education, illicit discharge detection and
enforcement, and the management of the District’s solid waste through street sweeping, trash
collection, catch basin cleaning, and floatable reduction as primary means to control
pollutants. General management measures also include programs to encourage the
installation of structural BMPs through voluntary measures on private lands.
Plan review activities for new construction and redevelopment, public education, and
demonstration of technologies for abating non-point sources of pollution are funded by the
Environmental Protection Agency non-point source management grant and Chesapeake Bay
grant. DDOE also coordinates pollution abatement activities through the Stormwater
Management Division. The Stormwater Management Division is an office within the DDOE
Office of Natural Resources and administers the District’s MS4 permit. The city has imposed an
impervious rate fee to offset the cost of compliance with the NPDES MS4 permit and ultimately
to protect and restore the District’s waterways. The fee is collected by WASA, but the rate for
the impervious surface fee and the fund (known as the Stormwater Enterprise Fund) are
administered by DDOE Stormwater Management Division. Although DDOE is the lead agency
for administering the stormwater permit several agencies are also responsible for meeting
permit obligations. These agencies are named in the DC Comprehensive Stormwater
management Enhancement Amendment Act of 2008 and include: WASA, District Department
of Public Works, District Department of Transportation and Office of Planning. Funds and
technical resources are shared among these agencies via intra District Memorandums of
Understanding. The Act mandates that a Stormwater Advisory Panel, composed of agency
heads, meet twice a year to coordinate MS4 related activities. In addition, a MS4 task force,
comprised of lower level managers, meets monthly to coordinate efforts.
2.1. Pollution Prevention Plans
Pollution Prevention Plans (P3) are low-cost, effective tools for reducing organics and metals
into Oxon Run. DC Village, a large municipal multi agency facility located in the south east
corner of the Oxon Run Watershed, is an important example of a facility that is administered

18
by the District government within this watershed. As a part of the District’s MS4 permit, the
permit stakeholder agencies are developing P3s for each facility under their control. These
plans detail procedures to avoid the accidental spill of hazardous materials and provide
guidance on how to properly clean up a spill should one occur. The Department of Public
Works has completed their P3 and many other agencies are currently in the process of
inventorying their facilities and current practices so that they can update and/or create P3s.
DDOE is offering technical assistance and quality assurance for the agencies.
DC Village is a municipally owned site in the south eastern corner of the DC portion of the Oxon
Run watershed. The site used to house a large public hospital long since closed and is still
utilized for temporary emergency housing for homeless families. Multiple agencies, however,
utilize this sprawling site. Two of the most important agencies are DC Department of Real-
estate Services, the branch of government charged with managing all municipally owned
properties, and Department of Public Works. This site has no visible signs of pollution
prevention, despite the industrial uses of the facilities. DPW asserts that this site is serviced by
blue Plains Municipal Waste Water Treatment Facility. DPW has an impoundment lot with no
visible pollution prevention measures, poor housekeeping practices, and loose aggregate
ground cover that does not prevent motor oil and other contaminants from polluting soil.
Pavement tailings are also stockpiled on the site, as are discarded District vehicles. Finally,
industrial chemicals are haphazardly stored throughout the facility. This site is need of an
overhaul. DDOE inspectors should coordinate with counterparts in EPA and sister agencies
within District government to ensure that improperly stored chemicals are removes, vehicles
are properly disposed of or stored, and that Best Management Practices are immediately
instituted.
2.2. Catch Basin Cleaning
Catch basin cleaning is a significant BMP to remove pollutants from the MS4 before they are
flushed into receiving waters. Catch basin cleaning has proven to be one of the most cost
effective methods to capture and remove gross pollutants in urban areas.
Catch basin sumps such as those used in the District trap substantial quantities of debris,
sediment, and particulate pollutants. Catch basins with a baffle or siphon attached to the
outlet can also trap significant amounts of floatable debris and oil and grease. Either
mechanical equipment or a vacuum truck is used to remove sediment and pollutants on a
regular schedule. WASA seeks to clean each of the District’s 25,000 catch basins once every six
to twelve months through annual clean outs and in response to public comments.
More efficient and frequent cleaning of the catch basins will remove solids and pollutants, and
prevent overfilling of the sumps and subsequent washout to receiving waters. Improved catch
basin containment and removal of pollutants near the source will be a major benefit toward
TMDL compliance. Primary pollutants of concern removed during catch basin cleaning are

19
nutrients, BOD, TSS, metals and other pollutants adsorbed to particulate matter, and oil and
grease in catch basins with a baffle or siphon device.
Between 2007 and 2009 WASA performed a pilot project to document the gross amount of
pollutants removed during catch basin cleaning and to optimize the frequency of catch basin
cleaning to maximize the removal of pollutants of concern. Based on the evaluation of the
pilot program, including a cost-benefit analysis, the recommended cleaning methods and
frequency will be expanded into the Oxon Run MS4 area.
2.3. Street Sweeping
Street sweeping has also been identified as one of the most cost-effective methods of
removing particulate debris from streets and roadways. Street sweeping with high efficiency
sweepers that are able to collect particulate and fine material are especially effective for
removal of TSS and other pollutants, such as metals that are commonly attached or collocated
with organic and particulate material.
Street sweeping removes particulate pollutants from District roadways before they are
introduced to the MS4 by runoff events. It has been documented that the removal of fine
particulate will also remove many pollutants including metals that are associated with
particulates (Schueler and Holland, 2000).
Traditionally, street sweeping has focused on removal of litter, leaves, and other large, visible
trash. The benefit of street sweeping for removal of pollutants of concern in the MS4 system is
the collection and disposal of fine particulate matter that is hardly noticeable by visual
inspection. Improved collection of the fine particulates in street sweeping activities is the focus
of this component of the implementation plan.
Compared with traditional mechanical street sweepers, modern regenerative air and high
efficiency vacuum assisted sweepers can remove up to 60 percent and 35 percent more TSS
and nitrogen, respectively (Sutherland, 2004). Heavy metals (copper, lead, and zinc) are also
removed more effectively. The use of vacuum assisted and/or regenerative air sweepers
greatly increases the removal efficiency of the fine particulate matter and the particulate
pollutants and pollutants that may bind to particulate matter.
The District Department of Public works currently cleans all streets several times a year. The
mechanical street sweeping program currently operates from March to November. The
District, through funding made available from the Stormwater Enterprise Fund, has already
initiated a program to accelerate the purchase of high-efficiency street sweepers. This
program will result in improved pollutant removal from street sweeping throughout the
District and in the Oxon Run watershed. In addition, DPW has recently completed a study of all
regularly scheduled and signed street sweeping routes. The results of this study suggest that

20
through improved route efficiency, on existing signed routes, DPW can expand mechanical
sweeping, so called environmental sweeping, to other parts of the District. For purposes of our
load reduction model we consider various street sweeping scenarios for total area of streets in
the MS4 areas of Oxon Run.
2.4. Public Roads and Alleyways
The District Department of Transportation (DDOT) is responsible for maintaining streets, roads,
alleyways and sidewalks in the city. DDOT has begun to adopt the use of Low Impact
Development (LID) strategies to control stormwater and stormwater pollution. The city is
currently demonstrating many types of LID including:
o Infiltration tree box planters – tree boxes that accept runoff from sidewalks and
roadways to treat the stormwater and provide water for the trees.
o Silva Cells, structural soils, and other tree root expansion techniques – These tools help
expand the space available for the growth of tree roots which allows for a larger and
healthier tree and the greater potential for the uptake of stormwater and stormwater
pollutants.
o Bioretention – This can take the form of standard bioretention cells or bump outs into
the street that are generally placed near intersections. These bump outs provide a
safer crossing area for pedestrians by reducing the street area that they have to cross;
they slow traffic by narrowing the road; and they accept runoff and treat stormwater
pollution.
o Permeable pavements – Permeable pavements take many forms including paving
stones, porous concrete, and porous asphalt. The District is testing different permeable
pavements in different applications such as alleyways, sidewalks, and roadways to
determine which are appropriate and cost effective.
DDOT is also working to reduce pollutants to the city’s waterways by encouraging commuters
to use alternative forms of transportation. DDOT is expanding the number of bike lanes in the
city, installing bike-share racks, creating trolley and high speed bus lanes, and operating lower
polluting hybrid and natural gas powered busses for its “Circulator” routes.
For purposes of our load reduction model we propose that the public right of way will be
retrofitted with LID at a rate consistent with the “aggressive” assumptions of Green Build-Out
Model (GBOM) – a model of the potential LID practices to control stormwater in the District of
Columbia that was funded by the EPA and created by LimnoTech. The GBOM “aggressive”
model assumes that 50 percent of all potential sites will have bump outs installed and 10
percent will install infiltration tree boxes.
2.5. Catch Basin Inserts and Screens and Water Quality Catch Basins
Catch basin inserts are devices designed to remove oil and grease, trash, debris, and sediment

21
can improve the efficiency of catch basins. Some inserts are designed to drop directly into
existing catch basins, while others may require retrofit construction. Catch basin inlet screens
are placed at the mouth of a catch basin and are effective at collecting trash and debris, but
less effective at removing oil, grease and sediment. DDOE in partnership with the Department
of Public Works and Department of Transportation is currently piloting the use of catch basin
inserts and screens to reduce trash and pollutant loads to our local waterways.
Water quality catch basins are three-chambered catch basins specifically designed to reduce
trash, collect sediment and trap oil, grease, and other metals and organics. The District Water
and Sewer Authority and the District Department of Transportation currently retrofit existing
catch basins with water quality catch basins whenever major road or sewer work is
undertaken.
2.6. Leaf Collection
DPW conducts curbside vacuum collection of leaves from residences in the District. Residents
are mailed a flyer prior to leaf collection, and DPW leaf vacuum trucks make a minimum of two
passes per year on each District street. The collection of leaf litter helps keep catch basins
from clogging which allows them to work efficiently to remove solids and pollutants. Leaf litter
collection also collects some pollutants. Primary pollutants of concern removed during leaf
collection are nutrients, TSS, metals and other pollutants sorbed to particulate matter. Due to
lack of reduction information, leaf collection was not modeled for load reductions.
2.7. RiverSmart Homes Program
Over the past three years DDOE has slowly
developed and matured an LID retrofit program
aimed at single family homes. The program
started with eight demonstration sites – one in
each Ward of the city. It then expanded to a
pilot program in the Pope Branch watershed of
the city. The program is now open city-wide.
Through this program, DDOE performs audits of
homeowner’s properties and provides feedback Volunteers plant a raingarden with native plants at a
Riversmart Homes demonstration site
to the homeowners on what LID technologies can be safely installed on the property. The city
also offers up to $1,600 to the homeowner to help cover the cost of installation of any LID the
homeowner chooses. Currently the program offers five different landscaping items including
shade trees, native landscaping to replace grass, rain gardens, rain barrels and permeable
pavement.

22
The District has recognized the importance of targeting homeowners for pollution reduction
measures because the residential property is the largest single land use in the city and is the
slowest of all construction areas to be redeveloped, and hence fall under new and stricter
stormwater regulations. (See Appendix B for Educational materials)
2.8. Rain Leader Disconnect Program
Under old construction codes in the District, new or reconstructed houses were required to
connect the rain leaders from rooftop drainage to the Combined Sewer System (CSS) or into
the street, which then drains to local waterways. The District has revised the District’s
Construction Codes Supplement to encourage downspout disconnection where feasible and
infiltrate runoff before it enters the storm sewer system. Furthermore the city has revised its
codes to allow this work to be done by anyone – not just licensed plumbers as was previously
required.
DDOE has begun a pilot program to encourage downspout disconnection by a) paying
homeowners to do the work themselves and/or b) paying non-profit organizations to
disconnect the downspouts of interested property owners. This pilot program is based on a
highly successful downspout disconnection incentive program by the city of Portland, Oregon.
Rain leader disconnection has been shown to be one of the most cost effective methods for
reducing stormwater thereby reducing pollutants such as metals and organics that are
commonly attached or collocated particulate material. Based on the success of the pilot
project, DDOE may expand this project to the Oxon Run Watershed.
2.9. Green Roof Retrofit Program
For the last three years the District has offered a rebate for installation of a new green roof or
the retrofit of an existing roof. This program, offered through DDOE, provides $5 a square foot
for the installation of a green roof on a new structure or existing roof less that 2,000 square
feet in size (up to $20,000) and $7 a square foot for the retrofit of a green roof on older roofs
over 2,000 square feet in size (no maximum dollar limit).
Additionally the city has been aggressively retrofitting their existing rooftops with green roofs
and installing vegetated roofs on new city-owned buildings. As a result of this push,
Washington, DC is second only to Chicago in the square footage of green roofs installed. We
envision that the city will continue this trend and we have adopted the assumptions of the
“aggressive” GBOM model for our long term pollutant load reduction. GBOM calls for green
roofs on 50 percent of rooftops with over 2,000 square feet to have green roofs.
2.10. Permeable Pavement
As noted earlier, the District is testing different permeable pavements to determine which are
appropriate and cost effective for the public right of way. In addition to the use of permeable
pavement in roads, alleys, and sidewalks, this technology has promise in commercial parking
23
lot applications. Our model adopts the “aggressive” assumptions proposed in the Green Build
Out Model of a 90 percent adoption rate for this technology in parking lots. We predict a high
rate of acceptance for this land use partly because of the new storm water fee that has gone
into effect in the last year. Previously parking lots did not pay a stormwater fee because the
fee was assessed as a part of water use. Now the stormwater fee has been tied to impervious
cover – something that greatly impacts parking lots. In the coming year property owners that
undertake retrofits to reduce impervious surfaces will be able to reduce their stormwater fee
by up to 50 percent.
2.11. Education of Public on Pet Wastes/Enforcement of Pet Waste Regulations
DDOE has developed educational materials such as fliers and videos that inform citizens of
their legal obligations to manage pet waste, proper application and disposal of fertilizers, and
the use of landscaping to control storm water runoff. These materials are regularly distributed
at public events such as community meetings, Earth Day celebrations, and community cleanup
days. Furthermore this information is distributed door to door in communities where storm
drain marking is taking place. Finally this information is available on the DDOE website.
The District has also begun installing dog parks in communities throughout the city. These dog
parks are placed and designed to reduce the impact of pets on the environment while allowing
dogs to play and exercise. Dog parks reduce TSS, nitrogen, phosphorous, and harmful bacteria
flowing to Oxon Run through their design and by the concentrating the impact of dogs in one
area, bags for the collections of dog waste are also provided. Finally dog parks increase the
compliance with pet waste regulations through peer pressure from
other dog owners. There is limited space for Dog Parks in the Oxon
Run watershed, but DDOE should coordinate with the Department
of Parks and Recreation to locate appropriate locations for dog
parks in the watershed. Dog parks should not be located in Oxon
Run Park because it is directly adjacent to the stream.
DDOE must also do a better job of outreach on this issue to
communities in Oxon Run. Outreach should be done in two phases.
The first phase should determine where in the watershed the need
is the greatest for additional outreach. This will be done as part of
the process for gathering public feedback for this report. Initial
outreach should also include distributing literature too, and
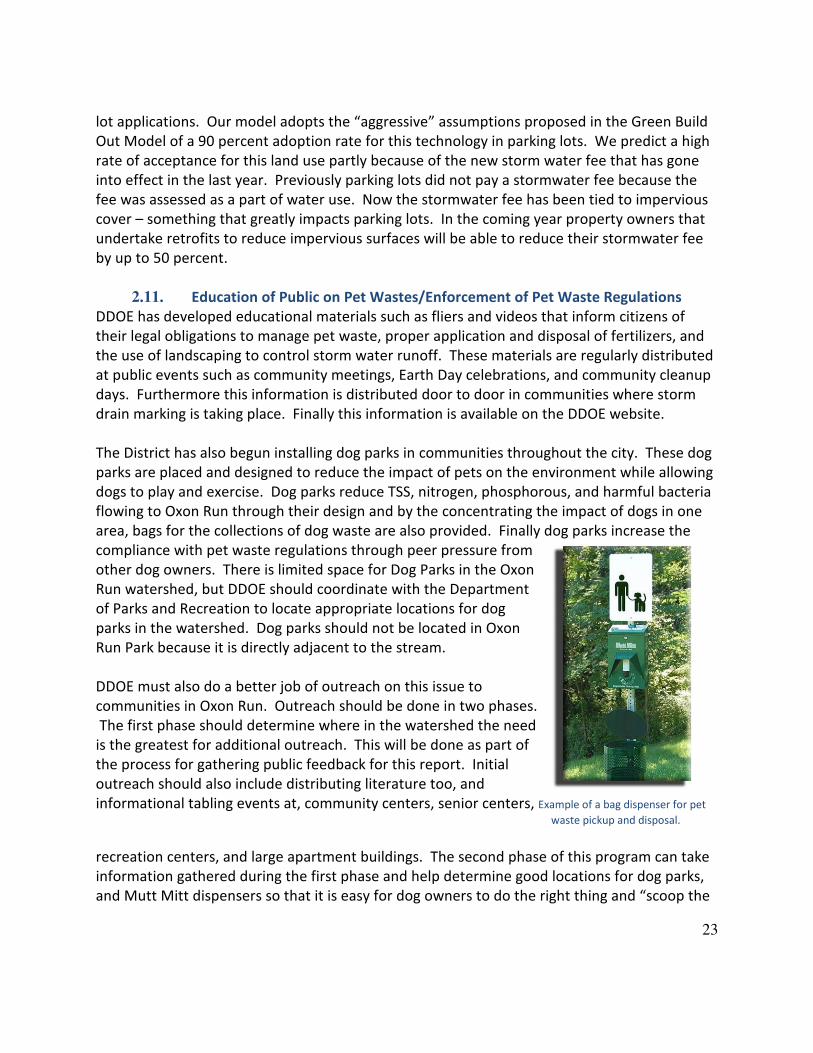
informational tabling events at, community centers, senior centers, Example of a bag dispenser for pet
waste pickup and disposal.
recreation centers, and large apartment buildings. The second phase of this program can take
information gathered during the first phase and help determine good locations for dog parks,
and Mutt Mitt dispensers so that it is easy for dog owners to do the right thing and “scoop the

24
poop.”
Although education is important, enforcement of existing laws can be a stronger tool for
reducing pet borne fecal coliform. Currently enforcement of pet waste and leash laws has
been lax. DDOE will work with law enforcement agencies to step up enforcement efforts.
2.12. Household Hazardous Waste Collection and Disposal
In the past, the District promoted the collection and disposal of household hazardous waste
through twice annual collection days when residents may bring hazardous wastes for proper
disposal. In the past year, DPW stepped up the household hazardous waste program and now
residents can drop their hazardous wastes off at the Fort Totten waste transfer station any
Saturday. This program is funded through the Stormwater Enterprise Fund. The frequent and
convenient collection of household hazardous waste is a low-cost and effective way to reduce
organics and metals into Oxon Run.
Unfortunately Fort Totten is a long drive from Oxon Run neighborhoods and a secondary
location that was closer was recently closed due to budget cuts. The Department of Public
Works should sponsor a day or two a month when District residents in this part of the city can
come and drop off house hold hazardous waste at a convenient location close to their homes.
The collection of household hazardous waste was not modeled for pollutant load reductions,
although it likely does help to reduce organic and metals pollution.
2.13. Integrated Pest Management and Nutrient Management
DDOE has developed an education and outreach program on Integrated Pest Management
(IPM) and Nutrient Management. (See Appendix B for educational handouts) The purpose of
the program is to better inform the public on the proper use and disposal of common house
hold pesticides and on the use of safer alternatives. The program provides education and
outreach activities designed to property owners and managers about environmentally sound
practices with regard to the use of pesticides in the yard or garden and the introduction of
“good” pests into the landscape. Through DDOE’s Nutrient Management Program, the
property owners receive education regarding the proper amount of fertilizer to use on a lawn.
In addition to fertilizer use, this program addresses the proper way to mow, use of mulch, and
the effects of applying too much mulch.
This management area focuses on the control of storm water pollutants originating from the
use of pesticides, herbicides, and fertilizers within the District. Emphasis is placed on
educational and training programs provided for both District property managers and private
residents.
Furthermore the DDOE Pesticide Management Program trains commercial applicators in the
legal and safe appliance of pesticides and herbicides. Commercial applicators must receive a
25
certification through the program to legally apply pesticides and herbicides in the District. A
part of this program involves the use of IPM.
The District Department of Real Estate Services, the District Agency that manages all District
owned office buildings, has committed to utilize IPM and nutrient management on their
properties and other District and Federal agencies are exploring similar efforts.
2.14. Tree Planting
The District of Columbia has been called “The City of Trees.” It has a tree canopy cover of 35
percent, which is high for a dense urban environment. The Urban Forestry Administration
(UFA) maintains the city’s street trees pruning and planting to manage trees in a harsh
environment of power and sewer lines, impervious surfaces, road salt, and punishing summer
heat. UFA plants an average of 4,150 trees annually, maintains the thousands of existing city
trees, and works to improve growing conditions for street trees by removing unneeded
impervious areas, experimenting with new tree box technology such as structural soils and
Silva cells, and watering trees and pruning trees.
In addition, DDOE with help from non-profit partners such as Casey Trees and Washington
Parks and People help plant trees on private, federal, and other District lands. Casey Trees, a
non-profit dedicated solely to expanding and caring for the District’s tree canopy is an
especially important partner. Casey runs community tree planting programs, a tree rebate
program, and plants trees for RiverSmart Homes. Additionally Casey leads classes in the
identification and care of trees and performs monitoring and modeling of canopy cover.
In 2009 the District committed to expand its canopy cover over the next 30 years. For the
purposes of this WIP, we have adopted the assumptions of the “aggressive” GBOM model for
our long term pollutant load reduction.
2.15. Erosion and Sediment Control
Erosion and Sediment Control programs, which are funded by an EPA grant from the
Chesapeake Bay Program, come in two forms – strict regulations and inspection and
enforcement. The District already has strong erosion and sediment control regulations in place
– requiring that any land disturbance over 50 square feet apply for an erosion and sediment
control permit. In comparison, local other jurisdictions require these permits be filed when
more than 5,000 square feet of soil are disturbed. Furthermore, DDOE has published the
District of Columbia Soil Erosion and Sediment Control Standards and Specifications and the DC
Storm Water Management Guidebook. These documents are used by DDOE in the plan review
process for new construction.
Federal facilities within the District are required to comply with District regulations under the
Soil Erosion and Sediment Control Act. The US General Services Administration (GSA) and

26
DDOE signed a consent agreement in fiscal year (FY)
2000 that requires work under contracts through
GSA to comply with the same sediment and erosion
control requirements as commercial, residential, and
industrial operations in the District. In the same
year, DDOT and WASA signed agreements, in an
MOU between District agencies, requiring their
contractors to comply with the same sediment and
erosion control requirements as commercial,
residential, and industrial operations in the District.
Investigators traced sediment that was discharging into
Oxon Run to a construction site in the watershed
The District also has a strong Inspection and Enforcement branch that inspects construction
sites throughout the District to make sure they are incompliance with District regulations. The
need for expanded inspection and enforcement will be continually evaluated. DDOE also
regularly inspects existing stormwater management facilities to ensure that they are in proper
working order. These measures are especially important in the Oxon Run Watershed were
significant redevelopment of old and dilapidated housing stock is still under way.
2.16. Illicit Discharge and Industrial Facility Inspection and Enforcement
The District has already evaluated and expanded inspection and enforcement activities
industrial facilities. The District will continue to evaluate and expand other inspection and
enforcement activities to ensure compliance with District regulations and to minimize pollutant
discharges to the Oxon Run watershed from these sources. The District is currently revising the
MS4 outfall maps so that inspectors know exactly what land area drains to a particular outfall.
Outfalls are classified as high, medium and low priority and are inspected on an annual,
biannual or five year basis, respectively, for dry weather flow and conducting field evaluation
of any flows observed. Inspectors record water temperature, pH, dissolved oxygen, and
conductivity at each outfall.
The expanded inspection program will result in the identification of a number of sites or
facilities that are sources of pollution to the MS4 program. Owners of the sites or facilities will
be required voluntarily or through enforcement actions to correct these sources of pollution.
After a source of pollution is corrected, there is no further cost, and with the pollutant source
removed, the benefit is continuous and cumulative each year. Removing polluting sources can
collectively represent significant progress toward TMDL compliance.
Inspectors routinely visit auto service shops, dry cleaners, and car washes in the District to
ensure compliance with Water Pollution Control Act regulations. Witnessing Water Pollution
Control Act violations during an inspection, however, is rare. For this reason, education and
27
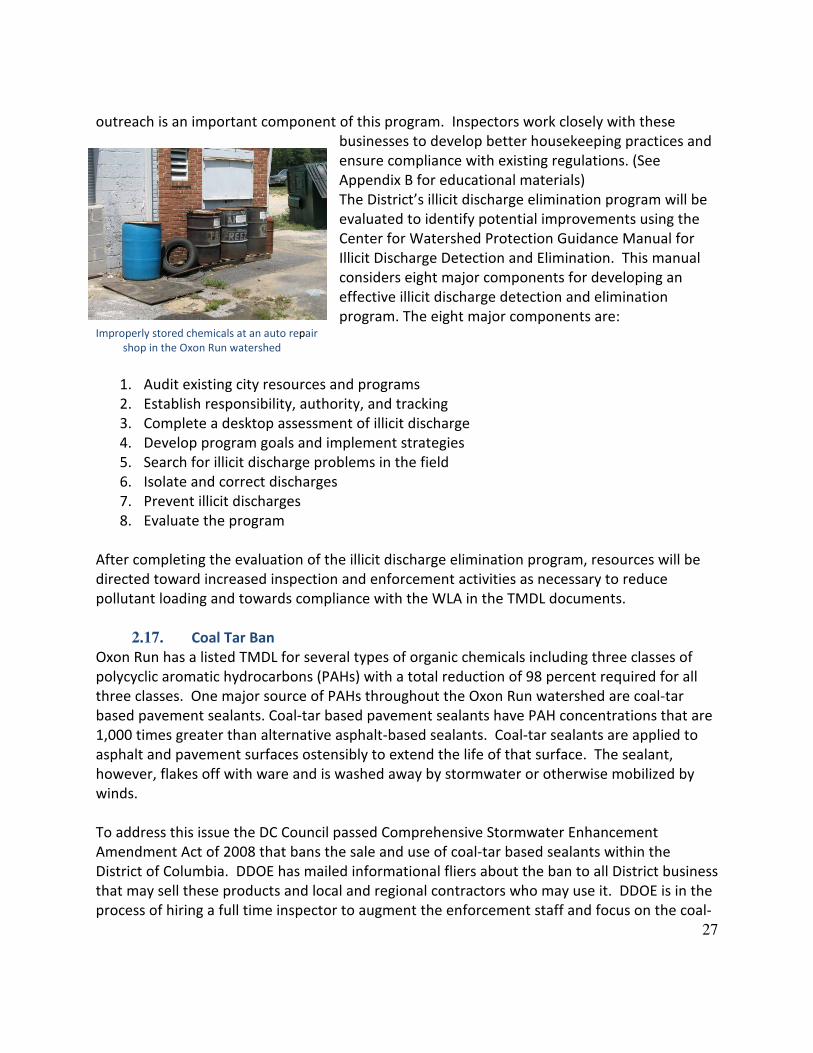
outreach is an important component of this program. Inspectors work closely with these
businesses to develop better housekeeping practices and
ensure compliance with existing regulations. (See
Appendix B for educational materials)
The District’s illicit discharge elimination program will be
evaluated to identify potential improvements using the
Center for Watershed Protection Guidance Manual for
Illicit Discharge Detection and Elimination. This manual
considers eight major components for developing an
effective illicit discharge detection and elimination
program. The eight major components are: Improperly stored chemicals at an auto repair
shop in the Oxon Run watershed
1. Audit existing city resources and programs
2. Establish responsibility, authority, and tracking
3. Complete a desktop assessment of illicit discharge
4. Develop program goals and implement strategies
5. Search for illicit discharge problems in the field
6. Isolate and correct discharges
7. Prevent illicit discharges
8. Evaluate the program
After completing the evaluation of the illicit discharge elimination program, resources will be
directed toward increased inspection and enforcement activities as necessary to reduce
pollutant loading and towards compliance with the WLA in the TMDL documents.
2.17. Coal Tar Ban
Oxon Run has a listed TMDL for several types of organic chemicals including three classes of
polycyclic aromatic hydrocarbons (PAHs) with a total reduction of 98 percent required for all
three classes. One major source of PAHs throughout the Oxon Run watershed are coal-tar
based pavement sealants. Coal-tar based pavement sealants have PAH concentrations that are
1,000 times greater than alternative asphalt-based sealants. Coal-tar sealants are applied to
asphalt and pavement surfaces ostensibly to extend the life of that surface. The sealant,
however, flakes off with ware and is washed away by stormwater or otherwise mobilized by
winds.
To address this issue the DC Council passed Comprehensive Stormwater Enhancement
Amendment Act of 2008 that bans the sale and use of coal-tar based sealants within the
District of Columbia. DDOE has mailed informational fliers about the ban to all District business
that may sell these products and local and regional contractors who may use it. DDOE is in the
process of hiring a full time inspector to augment the enforcement staff and focus on the coal-
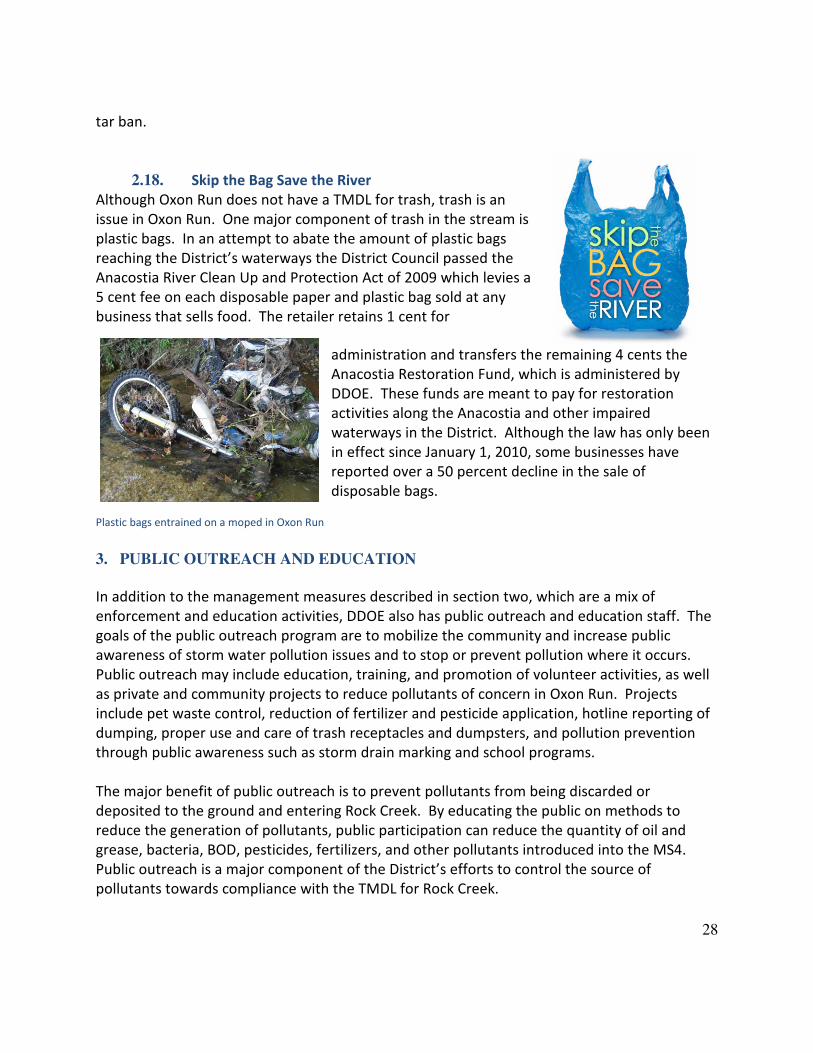
28
tar ban.
2.18. Skip the Bag Save the River
Although Oxon Run does not have a TMDL for trash, trash is an
issue in Oxon Run. One major component of trash in the stream is
plastic bags. In an attempt to abate the amount of plastic bags
reaching the District’s waterways the District Council passed the
Anacostia River Clean Up and Protection Act of 2009 which levies a
5 cent fee on each disposable paper and plastic bag sold at any
business that sells food. The retailer retains 1 cent for
administration and transfers the remaining 4 cents the
Anacostia Restoration Fund, which is administered by
DDOE. These funds are meant to pay for restoration
activities along the Anacostia and other impaired
waterways in the District. Although the law has only been
in effect since January 1, 2010, some businesses have
reported over a 50 percent decline in the sale of
disposable bags.
Plastic bags entrained on a moped in Oxon Run
3. PUBLIC OUTREACH AND EDUCATION
In addition to the management measures described in section two, which are a mix of
enforcement and education activities, DDOE also has public outreach and education staff. The
goals of the public outreach program are to mobilize the community and increase public
awareness of storm water pollution issues and to stop or prevent pollution where it occurs.
Public outreach may include education, training, and promotion of volunteer activities, as well
as private and community projects to reduce pollutants of concern in Oxon Run. Projects
include pet waste control, reduction of fertilizer and pesticide application, hotline reporting of
dumping, proper use and care of trash receptacles and dumpsters, and pollution prevention
through public awareness such as storm drain marking and school programs.
The major benefit of public outreach is to prevent pollutants from being discarded or
deposited to the ground and entering Rock Creek. By educating the public on methods to
reduce the generation of pollutants, public participation can reduce the quantity of oil and
grease, bacteria, BOD, pesticides, fertilizers, and other pollutants introduced into the MS4.
Public outreach is a major component of the District’s efforts to control the source of
pollutants towards compliance with the TMDL for Rock Creek.

29
The District’s public education efforts entail a mixture of programs emphasizing the city web
sites, education and outreach activities, household hazardous waste collection events, the
pesticide, fertilizer and pet waste programs, industrial and construction site operator’s
programs, and cooperative programs with other agencies. Many of these programs are both
pollution control activities and public outreach opportunities.
Furthermore DDOE has developed several outreach programs targeted to teachers,
environmental educators and students throughout the District. These programs are:
o Environmental Education Resource Center – This center provides resources and
materials that teachers and other environmental educators may use to enhance the
classroom curriculum and implement conservation projects.
o Conservation Education (Project Learning, Project Water Education for Teachers,
Project WILD) – These internationally recognized programs are utilized to train
educators in innovative techniques for exploring a wide range of environmental
concepts with students and teaching critical thinking skills that lead to environmental
stewardship (grades K-12).
o Teacher Training Workshops – These workshops assist teachers in meeting their
teaching and learning standards while helping students develop environmental ethics
and responsible stewardship.
o RiverSmart Schools – RiverSmart schools works with applicant schools to install Low
Impact Development (LID) practices to control stormwater. These practices are
specially designed to be functional as well as educational in order to fit with the school
environment. Additionally schools that take part in the RiverSmart Schools program
receive teacher and site manager training on how to use the sites to teach to
curriculum standards and how to properly maintain the site.
o The District of Columbia Environmental Education Consortium – DDOE helps to
organize a network of environmental educators throughout the city so that ideas and
resources can be shared among them. DCEEC provides opportunities for networking,
event coordination and program partnering among its members. They also facilitate
professional development and educational opportunities that support required learning
standards. The members provide environmental expertise, professional development
opportunities, curricula and resources, and hands-on classroom and field studies to
District schools.
o Aquatic Resources Education Center (AREC) - Located in Anacostia Park, AREC has a
variety of live exhibits of fish and other aquatic species from local rivers and
surrounding environment. This unique partnership between the National Park Service,
the Fish and Wildlife Service and DDOE affords school groups, teachers, and District
Residents to learn about the Aquatic Resources in the District. Stewardship of natural
resources is a key component of the AREC curriculum.

30
DDOE also performs outreach to industrial and construction facilities through workshops,
brochures, and site inspections. DDOE personnel use inspections to promote awareness of the
proper methods of facility maintenance for stormwater regulation compliance. To aid facilities
in ensuring proper maintenance of storm water management facilities, DDOE has established
and published guidelines for their proper maintenance.
Table 5: Summary of Education and Outreach Materials (also see Appendix B)
Education and Outreach Materials Audience Dissemination Method
Automotive Guidelines Poster Shop Owners and
Workers
DDOE Inspectors Deliver
Posters & Internet
Automotive Repair Brochure Shop Owners and
Workers
DDOE Inspectors Deliver
Posters & Internet
BayScaping Fact Sheet District Residents Inspectors Deliver to
Residents During Stormwater
Audit & Internet
Care Sheet for Rain Barrels District Residents District Residents Who Have
This Feature Installed On
Their Property Will Get
Mailed This Information &
Internet
Down Spout Disconnection Fact
Sheet
District Residents Inspectors Deliver to
Residents During Stormwater
Audit & Internet
Fertilizer Fact Sheet District Residents Inspectors Deliver to
Residents During Stormwater
Audit & Internet
Integrated Pest Management Fact
Sheet
District Residents Inspectors Deliver to
Residents During Stormwater
Audit & Internet
Pervious Pavers Fact Sheet District Residents Inspectors Deliver to
Residents During Stormwater
Audit & Internet
Rain Barrel Fact Sheet District Residents Inspectors Deliver to
Residents During Stormwater
Audit & Internet
Rain Garden and BayScaping Care
Sheet
District Residents District Residents Who Have
This Feature Installed On
Their Property Will Get
Mailed This Information &
Internet

31
Education and Outreach Materials Audience Dissemination Method
Rain Garden Fact Sheet District Residents Inspectors Deliver to
Residents During Stormwater
Audit & Internet
RiverSmart Homes Overview District Residents Inspectors Deliver to
Residents During Stormwater
Audit & Internet
Shade Tree Fact Sheet District Residents Inspectors Deliver to
Residents During Stormwater
Audit & Internet
Shade Tree Care Sheet District Residents District Residents Who Have
This Feature Installed On
Their Property Will Get
Mailed This Information &
Internet
RiverSmart Homes Poster DDOE Partner
Organizations and
District Residents
Displayed at Public Events
BMPs for Soil Erosion and Sediment
Control
District Residents Living
Near Development
Nonprofits and Community
Groups
Stormwater Controls for Your Yard District Residents Nonprofits and Community
Groups
4. LOAD REDUCTIONS
Oxon Run is listed on the District of Columbia’s 1998 through draft 2004 Section 303(d) Lists of
Impaired Waters. Oxon Run’s TMDLs and associated documents can be viewed online at
http://www.epa.gov/reg3wapd/tmdl/dc_tmdl/Oxon Run. Oxon Run is listed on the Section
303(d) list as impaired for fecal coliform, metals, and organics.
Reaching the necessary Total Maximum Daily Loads (TMDLs) end points for metals, bacteria,
and organics for the Oxon Run watershed will require considerable pollutant source
reductions. In an urbanized watershed like Oxon Run, the majority of these source reductions
will take years, and come at a high cost. For example, a bacteria problem in a rural watershed
may simply require BMP implementation on the part of a handful of cattle ranchers. However,
the bacteria problem in Oxon Run is likely to involve the reconstruction of thousands of feet of
sewer lines. Since most of the urban environment in the watershed has already been
developed almost all the projects proposed will be retrofits to existing infrastructure, which is
more costly than new construction

32
District of Columbia recognizes the environmental importance of these load reductions;
however the District is also required by law to meet the TMDL standards. DDOE will work to
implement the management measures outlined in this WIP to address the impaired status of
Oxon Run and the watershed’s pollution sources. The expected load reductions that can be
achieved by implementing the projects presented in this document are outlined in the
following sections. Discussions of nutrient reduction, in accordance with Chesapeake Bay
Agreement and TMDL commitments, are also included. Further data and calculations can be
found in Appendices D, E and F. Hopefully, as research involving water quality, LID, and
stormwater BMP techniques progresses, the means for addressing these load reductions will
become more feasible and apparent.
4.1. Methodology for Achieving Load Reductions
Reductions were calculated for metals, organics, and bacteria using the annual pounds removal
per acre for each Best Management Practice, as reported in the Rock Creek Watershed Total
Maximum Daily Load Allocation Implementation Plan written in August 2005 by the District of
Columbia Stormwater Administration. The TMDL loads in the District portion of Oxon Run
watershed are assigned to the MS4 portion of the watershed. (DOH, TMDL 2004) In the
District rain events ≤ 1 inch represent 90 percent of all storm events. These smaller rain
events, typically, only generate runoff from impervious surfaces and transport with them the
first flush of contaminants. Paved surfaces, e.g. roads and parking lots, due to vehicular traffic,
application of pavement sealants, atmospheric deposition, etc., will hold the bulk of listed
contaminants. Small rain events will generate a first-flush of these contaminants into the MS4
and ultimately the receiving water, in this case Oxon Run. Due to the contaminated runoff
generated by impervious surfaces load reductions were calculated for just for total impervious
surface in the District portion of the Oxon Run watershed.
Pollutant load reductions will be achieved by augmenting or enhancing existing best
management practices or implementing new stormwater management projects or programs,
e.g. Low Impact Development (LID), pollution prevention, reforestation, remediation of illegal
dumping sites, increased enforcement, sanitary sewer repair, stream restoration, and
improved environmental education and outreach activities.
Nearly 170 retrofit opportunities were identified by DDOE investigators for LID, regenerative
stormwater conveyance, and constructed wetland projects throughout the District portion of
the Oxon Run watershed. The total treatment area of these sites is 287 acres or 11 percent of
the watershed. The list of projects along with a short description and photographs of each site
can be found in Appendix C.
The load reductions were first calculated using the identified projects. Collectively, the
identified projects reach percent reductions between 0.2 and 22 percent, short of the targeted
load reductions stipulated in the TMDL report.

33
Reduction tables were developed for each management practice for organic and metal
constituents. The reduction tables list removals that will be expected for each pollutant and
each Best Management Practice when treating incrementally larger portions of the watershed,
from 10 percent to 100 percent. The management practices (bioretention, extended
detention shallow wetland, porous pavement, tree boxes, and vacuum sweeping) were chosen
for their cost benefit, ease of implementation, and environmental benefit. The reduction tables
found in Appendix D report the pounds and percent change of pollutant reductions one can
expect to achieve by using a particular management practice for a given area of the watershed.
These tables were then used to determine the optimal mix of stormwater and other pollution
management practices that could be employed to reach reduction goals for metals and
organics.
Removal efficiencies and pound removal per treatment acre for each management practices
were obtained from the Rock Creek Watershed Total Maximum Daily Load Waste Load
Allocation Plan report written in August 2005 by the District of Columbia Stormwater
Administration within the DC Department of Health.
Oxon Run watershed is not listed as impaired for nutrients or sediment. Because the proposed
stormwater volume controls will likely result in reductions in these pollutant loads as well,
reductions were calculated for the identified projects in Appendix C to illustrate that the work
in Oxon Run will have much larger quality benefits than just reductions in pollutants listed in
the TMDL. The reductions were calculated using the Simple Method. The Simple Method
estimates stormwater runoff pollutant loads for urban areas. The technique requires inputs of
subwatershed drainage area, impervious cover, stormwater runoff pollutant concentrations,
and annual precipitation. Land use was broken up into residential, commercial, industrial, and
roadway and annual pollutant loads were calculated for each type of land. The nutrient
reductions can be found in sections 4.5-4.7.
4.2. Metals
Although metals originate from natural sources, such as minerals in rock, vegetation, sand, and
salt, urban nonpoint sources are primarily responsible for Oxon Run’s elevated levels. Man-
made sources of this pollutant include exhaust from engines, worn automotive parts such as
tires and brake linings, rust, and weathered paint. Particles from these sources deposit on
roads and other impervious surfaces, and are eventually transported to streams during storm
events via the storm sewer system and overland flow. Once transported, metals have a
tendency to persist in aquatic environments as they readily adsorb to sediment particles. It
should be noted, however, that free flowing Oxon Run with a significant portion of the channel
lined with concrete, bears little resemblance to the Anacostia River, on which the TMDLs for
Oxon Run are based. Monitoring is required to determine which metals, if any, impact Oxon
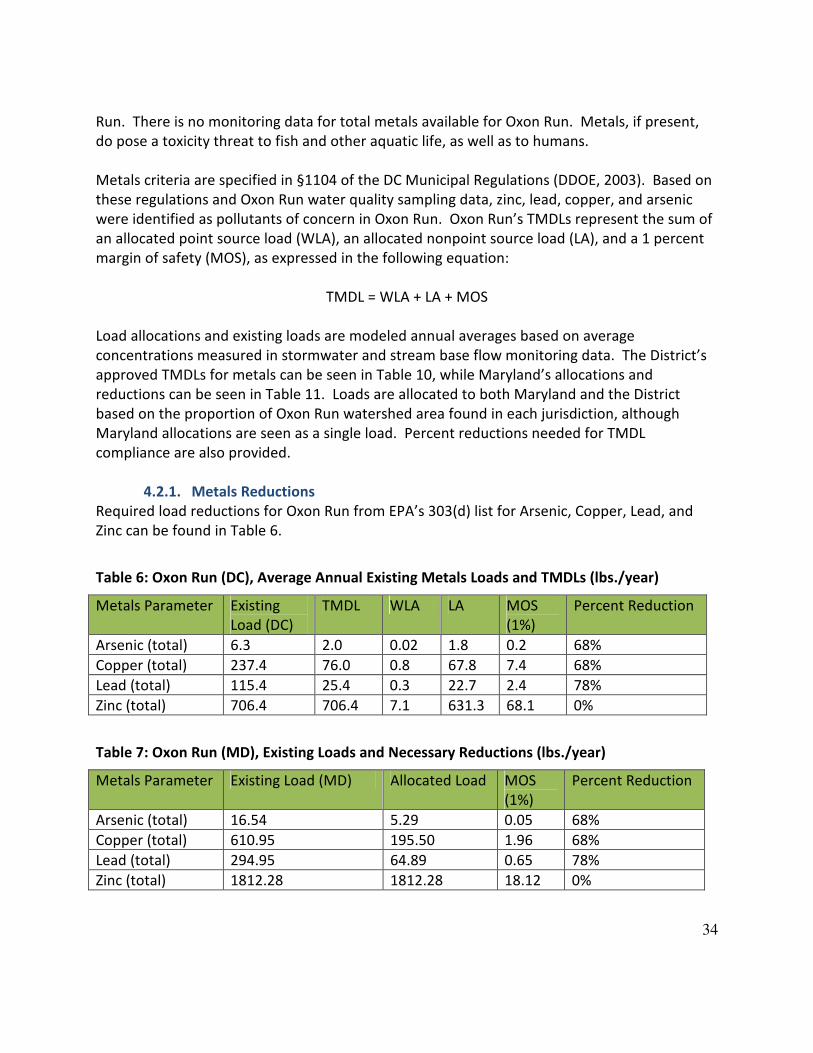
34
Run. There is no monitoring data for total metals available for Oxon Run. Metals, if present,
do pose a toxicity threat to fish and other aquatic life, as well as to humans.
Metals criteria are specified in §1104 of the DC Municipal Regulations (DDOE, 2003). Based on
these regulations and Oxon Run water quality sampling data, zinc, lead, copper, and arsenic
were identified as pollutants of concern in Oxon Run. Oxon Run’s TMDLs represent the sum of
an allocated point source load (WLA), an allocated nonpoint source load (LA), and a 1 percent
margin of safety (MOS), as expressed in the following equation:
TMDL = WLA + LA + MOS
Load allocations and existing loads are modeled annual averages based on average
concentrations measured in stormwater and stream base flow monitoring data. The District’s
approved TMDLs for metals can be seen in Table 10, while Maryland’s allocations and
reductions can be seen in Table 11. Loads are allocated to both Maryland and the District
based on the proportion of Oxon Run watershed area found in each jurisdiction, although
Maryland allocations are seen as a single load. Percent reductions needed for TMDL
compliance are also provided.
4.2.1. Metals Reductions
Required load reductions for Oxon Run from EPA’s 303(d) list for Arsenic, Copper, Lead, and
Zinc can be found in Table 6.
Table 6: Oxon Run (DC), Average Annual Existing Metals Loads and TMDLs (lbs./year)
Metals Parameter Existing
Load (DC)
TMDL WLA LA MOS
(1%)
Percent Reduction
Arsenic (total) 6.3 2.0 0.02 1.8 0.2 68%
Copper (total) 237.4 76.0 0.8 67.8 7.4 68%
Lead (total) 115.4 25.4 0.3 22.7 2.4 78%
Zinc (total) 706.4 706.4 7.1 631.3 68.1 0%
Table 7: Oxon Run (MD), Existing Loads and Necessary Reductions (lbs./year)
Metals Parameter Existing Load (MD) Allocated Load MOS
(1%)
Percent Reduction
Arsenic (total) 16.54 5.29 0.05 68%
Copper (total) 610.95 195.50 1.96 68%
Lead (total) 294.95 64.89 0.65 78%
Zinc (total) 1812.28 1812.28 18.12 0%
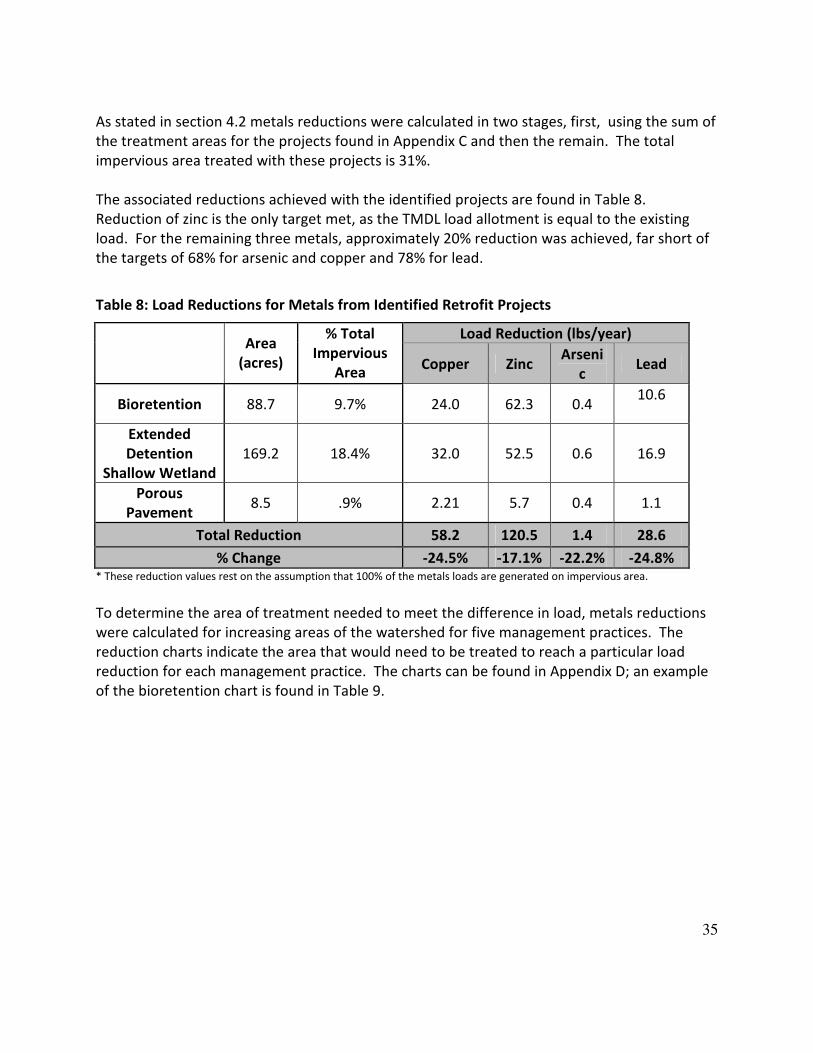
35
As stated in section 4.2 metals reductions were calculated in two stages, first, using the sum of
the treatment areas for the projects found in Appendix C and then the remain. The total
impervious area treated with these projects is 31%.
The associated reductions achieved with the identified projects are found in Table 8.
Reduction of zinc is the only target met, as the TMDL load allotment is equal to the existing
load. For the remaining three metals, approximately 20% reduction was achieved, far short of
the targets of 68% for arsenic and copper and 78% for lead.
Table 8: Load Reductions for Metals from Identified Retrofit Projects
Load Reduction (lbs/year)
Area
(acres)
% Total
Impervious
Area Copper Zinc
Arseni
c Lead
Bioretention 88.7 9.7% 24.0 62.3 0.4 10.6
Extended
Detention
Shallow Wetland
169.2 18.4% 32.0 52.5 0.6 16.9
Porous
Pavement 8.5 .9% 2.21 5.7 0.4 1.1
Total Reduction 58.2 120.5 1.4 28.6
% Change -24.5% -17.1% -22.2% -24.8% * These reduction values rest on the assumption that 100% of the metals loads are generated on impervious area.
To determine the area of treatment needed to meet the difference in load, metals reductions
were calculated for increasing areas of the watershed for five management practices. The
reduction charts indicate the area that would need to be treated to reach a particular load
reduction for each management practice. The charts can be found in Appendix D; an example
of the bioretention chart is found in Table 9.
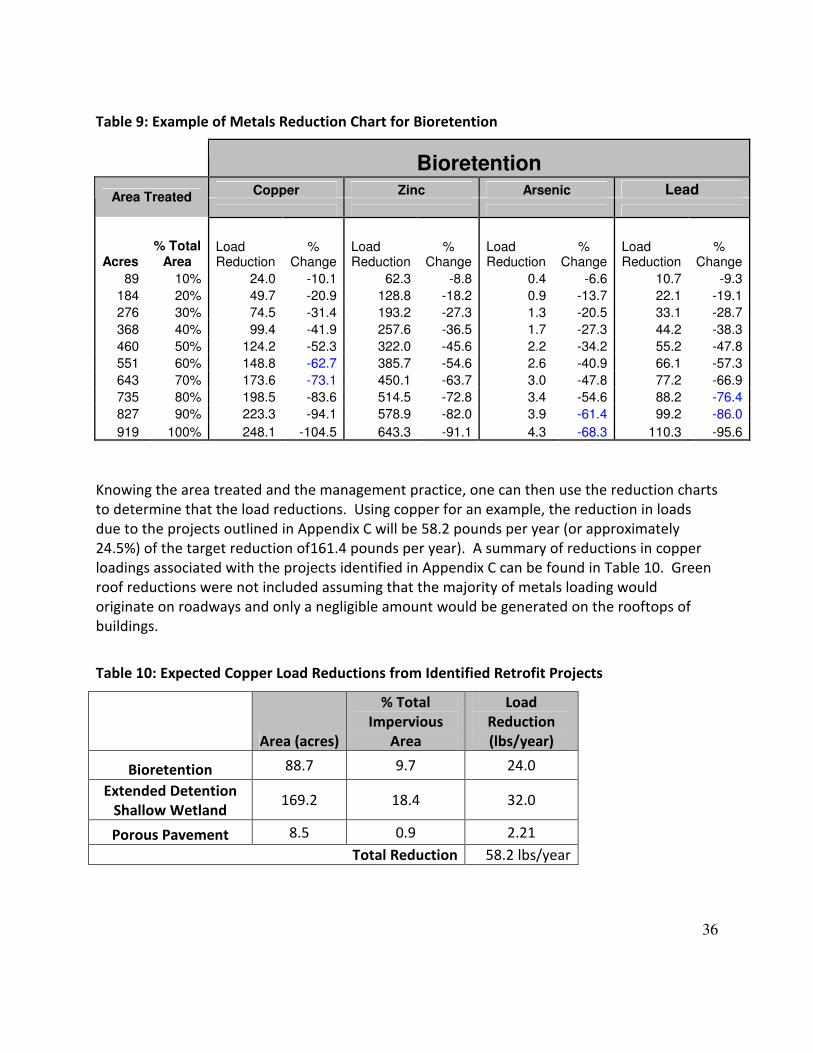
36
Table 9: Example of Metals Reduction Chart for Bioretention
Bioretention Copper Zinc Arsenic Lead
Area Treated
Acres % Total
Area Load Reduction
% Change
Load Reduction
% Change
Load Reduction
% Change
Load Reduction
% Change
89 10% 24.0 -10.1 62.3 -8.8 0.4 -6.6 10.7 -9.3
184 20% 49.7 -20.9 128.8 -18.2 0.9 -13.7 22.1 -19.1
276 30% 74.5 -31.4 193.2 -27.3 1.3 -20.5 33.1 -28.7
368 40% 99.4 -41.9 257.6 -36.5 1.7 -27.3 44.2 -38.3
460 50% 124.2 -52.3 322.0 -45.6 2.2 -34.2 55.2 -47.8
551 60% 148.8 -62.7 385.7 -54.6 2.6 -40.9 66.1 -57.3
643 70% 173.6 -73.1 450.1 -63.7 3.0 -47.8 77.2 -66.9
735 80% 198.5 -83.6 514.5 -72.8 3.4 -54.6 88.2 -76.4
827 90% 223.3 -94.1 578.9 -82.0 3.9 -61.4 99.2 -86.0
919 100% 248.1 -104.5 643.3 -91.1 4.3 -68.3 110.3 -95.6
Knowing the area treated and the management practice, one can then use the reduction charts
to determine that the load reductions. Using copper for an example, the reduction in loads
due to the projects outlined in Appendix C will be 58.2 pounds per year (or approximately
24.5%) of the target reduction of161.4 pounds per year). A summary of reductions in copper
loadings associated with the projects identified in Appendix C can be found in Table 10. Green
roof reductions were not included assuming that the majority of metals loading would
originate on roadways and only a negligible amount would be generated on the rooftops of
buildings.
Table 10: Expected Copper Load Reductions from Identified Retrofit Projects
Area (acres)
% Total
Impervious
Area
Load
Reduction
(lbs/year)
Bioretention 88.7 9.7 24.0
Extended Detention
Shallow Wetland 169.2 18.4 32.0
Porous Pavement 8.5 0.9 2.21
Total Reduction 58.2 lbs/year

37
The copper reduction of 24.5% does not achieve the target of 68% reduction. The reduction
chart found in Table 9 and in Appendix D can then be utilized to determine the additional area
of treatment needed to ultimately reach the reductions as stated in the TMDL. The blue
highlighted numbers in Table 9 indicate the point at which the required reductions would be
met using bioretention. To attain the target load for Copper, 70% of the roadway would need
to be treated with bioretention.
It is not realistic to treat 70% of impervious area by bioretention alone. Implementation of a
number of management practices will be necessary. The reduction charts for porous
pavement, vacuum sweeping, tree boxes, and constructed shallow detention wetlands can
then be used to determine the optimal mix of management practices to meet TMDL load
allocations. As seen in Table 10, if the treatment areas for bioretention, extended detention
shallow wetland, and porous pavement are kept constant, but the additional practices of
vacuum sweeping and treatment of stormwater in tree boxes are adopted to each treat 30% of
roadway and parking area, the copper reductions stated in the TMDL will be met. Monthly
street sweeping of 276 acres of roadway and the capturing of stormwater in tree boxes from
276 acres will increase copper reduction from 54.1 lbs to 181.6 pounds, putting us well above
the target reduction.
4.2.2. Metals Conclusion
The identified projects will achieve roughly one third of the target reductions, but a
combination of projects can be arranged using the reduction charts to achieve the necessary
reductions as stated in the TMDL. Copper was used as an example for illustrative purposes, but
the reductions for the remaining metals constituents are calculated the suggested scenarios
found in Section 3.8. The Suggested Scenarios section lists the recommended mix of pollution
management practices that will reach TMDL goals and the load reductions associated with
them.
4.3. Bacteria
The District of Columbia measures bacteria presence in its surface waters using fecal coliform
as an indicator. Fecal coliform bacteria reside in the intestines of warm-blooded mammals,
and are excreted in feces. Although fecal coliform is not necessarily a highly dangerous agent
of disease, concentrations are roughly proportional to the amount of fecal matter dissolved in
water, indicating the likely presence of other types of bacteria. In urban settings, such as Oxon
Run, fecal coliform from humans enters streams via wastewater treatment discharges, CSO,
and failed septic systems and sewer lines. There are no CSO outfalls in Oxon Run, and no septic
systems in Oxon Run. Waste from pets and wildlife are also substantial sources.

38
District and Maryland sewers are likely the largest source of bacteria loading in Oxon Run. The
District operates the only combined sewer system within the Anacostia watershed. The
system’s outfalls are located along the main stems of the Anacostia and Potomac Rivers, as
well as Rock Creek. Although no CSO outfalls discharge directly into Oxon Run, the tidally
influenced portion of the stream is still affected by CSO from these outfalls. It should be noted,
however, that there is no tidal influence in the District portion of
Oxon Run. Elevated fecal coliform levels in non-tidal Oxon Run
are likely the result of sanitary sewer leakages. In their 2003
assessment of Oxon Run, USFWS noted that many of the sanitary
pipes paralleling Oxon Run have been exposed as Oxon Run’s
channel has widened and incised. Severe breaks, as well as
evidence of leaks were documented in 6 specific Maryland and
District locations (USFWS, 2003). During the course of field work,
investigators noted degraded sewer line infrastructure. In one
location the top of a manhole cover had been shorn off by high
flows exposing flowing raw sewage. Since this section of sanitary
sewer is no longer supposed to be in operation it, was unclear
where the sewer line was tied in. WASA and the DDOE Water
Quality Divisions were notified and an investigation is ongoing. Exposed sewer line infrastructure
In order for Oxon Run to achieve its bacteria TMDL, fecal coliform loads must be reduced by
90%, from both District and Maryland sources (DOH TMDL, 2004). The District’s TMDL and
allocations can be seen in Table 11, while Maryland’s necessary reductions are listed in Table
13. District implementation of its TMDL almost completely depends upon WASA’s ability to
address its sanitary sewer leaks. Fortunately, WASA has launched a citywide sanitary sewer
system investigation. The activities under this program aim to eliminate infiltration of sanitary
sewage to the storm water system. In addition to this investigation, WASA is also conducting a
citywide trunk sewer assessment. As part of this work, direct sanitary sewer leaks to Oxon Run
will be identified and resolved. WASA has plans to reroute the upper Oxon Run trunk sewer
and abandon much of the lower Oxon Run trunk sewer in the first mile of District’s portion of
Oxon Run. It is DDOE’s hope that these commitments will ensure that Oxon Run will not be
compromised by WASA utilities in the future.
Table 11: Oxon Run (DC), Average Annual Existing Bacteria Loads and TMDL (MPN/year)
Bacteria
Parameter
Existing
Load (DC)
TMDL WLA LA MOS (1%) Percent
Reduction
Fecal Coliform 1.10E+15 1.10E+14 9.82E+13 1.03E+13 1.10E+12 90%

39
Table 12: Oxon Run (MD), Existing Bacteria Loads and Necessary Reductions (MPN/year)
Bacteria
Parameter
Existing Load (MD) Allocated Load MOS (1%) Percent
Reduction
Fecal Coliform 7.87E+14 7.87E+13 7.87E+11 90%
4.3.1. Bacteria Reductions
Rather than attributing the load generated to impervious surface, the chief sources of bacteria
were identified to be faulty sewer crossings, sewer main leakage, and pet waste. The bacteria
reductions were calculated using the Simple Method. The Simple Method estimates
stormwater runoff pollutant loads for urban areas. The technique requires inputs of
subwatershed drainage area, impervious cover, stormwater runoff pollutant concentrations,
and annual precipitation. Land use was broken up into residential, commercial, industrial, and
roadway and annual pollutant loads were calculated for each type of land. Again, pollutant
reductions were first calculated using just the treatment area of the 170 projects identified.
Next, pollutant reductions were calculated for projects identified for community greening and
stormwater management, namely the Green Build-Out model aggressive scenario for
stormwater control, RiverSmart Homes implementation, and more frequent street sweeping.
4.3.2. Sanitary Sewer Main Repair
There are ten sanitary sewer crossings on Oxon Run, varying in diameter from 24” to 42”. After
conducting a visual assessment of the sewer crossing infrastructure it was evident that the
sanitary sewer pipes are the major contributor of bacteria in Oxon Run stream. While obvious
sewer line breaches where not observed inspectors did locate, and report to WASA, open
manhole covers in the stream with sewage running through them, it was unclear to the
inspectors if this sewage was entering the stream. Inspectors also found sewer crossings that
are in need of replacement, including one pipe that was no longer supported by the stream
bed leaving the crossing totally free standing. We predict a load reduction of 90% for bacteria
will be met by replacing and rerouting the ten sanitary sewer lines that intersect the stream;
however additional opportunities for stormwater volume reduction, reforestation, pet waste
pick-up educational programs, increased enforcement, enforcement and vacuum sweeping
were identified and reductions calculated.
4.3.3. Bacteria Reductions through Identified Projects
Reducing the volumes of stormwater flow and improving tree canopy cover using the projects
outlined in Appendices C will only achieve a small fraction of the desired reduction loads. As
seen in Table 15, the projects will achieve a reduction of 10%. Target loads are 90%. Bacteria
reductions for green roofs were not calculated because given the sources of bacteria; it was
assumed that they would remove a negligible amount of bacteria.
A reduction tables were utilized to create a recommended scenario for removal of metal and
organic pollutants. This scenario, called Scenario 2, is outlined in Table 21 within section 4.5

40
Reduction Scenarios. The result will be a reduction of 6.4E14 MPN/year, or 66% of total
reductions needed. Through extensive field data, a major source of bacteria has been traced
back to the ten sewer crossings that traverse the stream bed. Many of these sewer lines are
faulty and badly in need of repair. It is assumed that the repair and rerouting of these sewer
lines will result in the final 24% reduction needed.
Table 13: Bacteria Reductions from Projects Identified in Appendix C
4.3.4. Bacteria Conclusion
Bacteria reductions through the projects outlined in Appendix C and the additional practices
described in section 3.3.5 will only achieve a reduction of 10%. The mix of Best Management
Practices recommended for the removal of metal and organic constituents (as outlined in
section 4.5) will reach 66%. The main source of bacteria has been traced back to the ten
sewer crossings that traverse the stream bed. It is assumed that the repair and rerouting of
these sewer lines will result in a reduction of bacteria by 90%. WASA has at least one sanitary
sewer main repair and rerouting scheduled for Valley Terrace housing complex for June 2011.
Schedule for the replacement and rerouting of the 10 sewer main crossings has been
requested from DCWASA.
4.4. Organics
DDOE has prepared TMDLs for eight different organic compounds in Oxon Run. These EPA
approved TMDLs can be seen in Table 14, along with load allocations for the average year.
Given that the Oxon Run watershed is split between Maryland and the District, for the District
to achieve its metals TMDLs, Maryland’s own load allocations (see Table 17) must also be met.
Management Practice Area Treated Expected Reductions
(MPN/year)
Bioretention 88.7 4.16E+13
Extended Detention Shallow
Wetland 169.2 6.78E+13
Porous Pavement 8.5 8.42E+11
Total Reductions 1.1E+14
% Change -10.0%

41
Table 14 : Oxon Run (DC), Average Annual Existing Organics Loads and TMDLs (lbs./year)
Metals Parameter Existing
Load (DC)
TMDL WLA LA MOS (1%) Percent
Reduction
Chlordane 4.26E-2 7.24E-3 6.51E-3 7.03E-4 7.24E-5 83%
DDT 1.89E-1 5.66E-3 5.02E-3 6.40E-4 5.66E-5 97%
Dieldrin 4.04E-3 8.48E-4 7.29E-4 1.19E-4 8.48E-6 79%
Heptachlor Epoxide 6.63E-3 9.94E-4 8.73E-4 1.22E-4 9.94E-6 85%
PAH1 3.91E-0 3.91E-0 3.51E-0 4.01E-1 3.91E-2 0%
PAH2 2.29E+1 3.89E-1 3.51E-0 3.81E-2 3.89E-3 98%
PAH3 1.45E+1 2.91E-1 2.63E-1 2.82E-2 2.91E-3 98%
TPCB 3.65E-1 3.65E-4 3.28E-4 3.78E-5 3.65E-6 99.9%
Table 15: Oxon Run (MD), Existing Organics Loads and Necessary Reductions (lbs./year)
The load reductions of organic chemicals were calculated similarly to metals; however it was
not assumed that the loads were generated on impervious surface, but rather throughout the
entire District portion of the watershed. The organic chemical reduction charts found in
Appendix D list the reductions for each pollutant expected given a particular treatment area of
the watershed. Taking the identified projects in Appendix C alone, the only organic
constituents that will be consistently removed through the bioretention, porous pavement,
and constructed wetland projects outlined in Appendix C are PAH1, PAH2 and TPCB. The
remaining organic pollutants will require treatment of a larger area and/or additional
treatment practice.
The projects in Appendix C treat approximately 10% of the entire area of the watershed. These
projects achieve reductions of approximately 0.6-22% of target reductions. Anticipated load
reductions can be found in Table 16.
Metals Parameter Existing
Load (MD)
Allocated Load MOS (1%) Percent
Reduction
Chlordane 1.10E-1 1.87E-2 1.87E-4 83%
DDT 5.03E-1 1.51E-2 1.51E-4 97%
Dieldrin 1.15E-2 2.41E-3 2.41E-5 79%
Heptachlor Epoxide 1.81E-2 2.71E-3 2.71E-5 85%
PAH1 1.02E+1 1.02E+1 1.02E-1 0%
PAH2 5.88E+1 9.99E-1 9.99E-3 98%
PAH3 3.73E+1 7.46E-1 7.46E-3 98%
TPCB 9.52E-1 9.52E-4 9.52E-6 99.9%
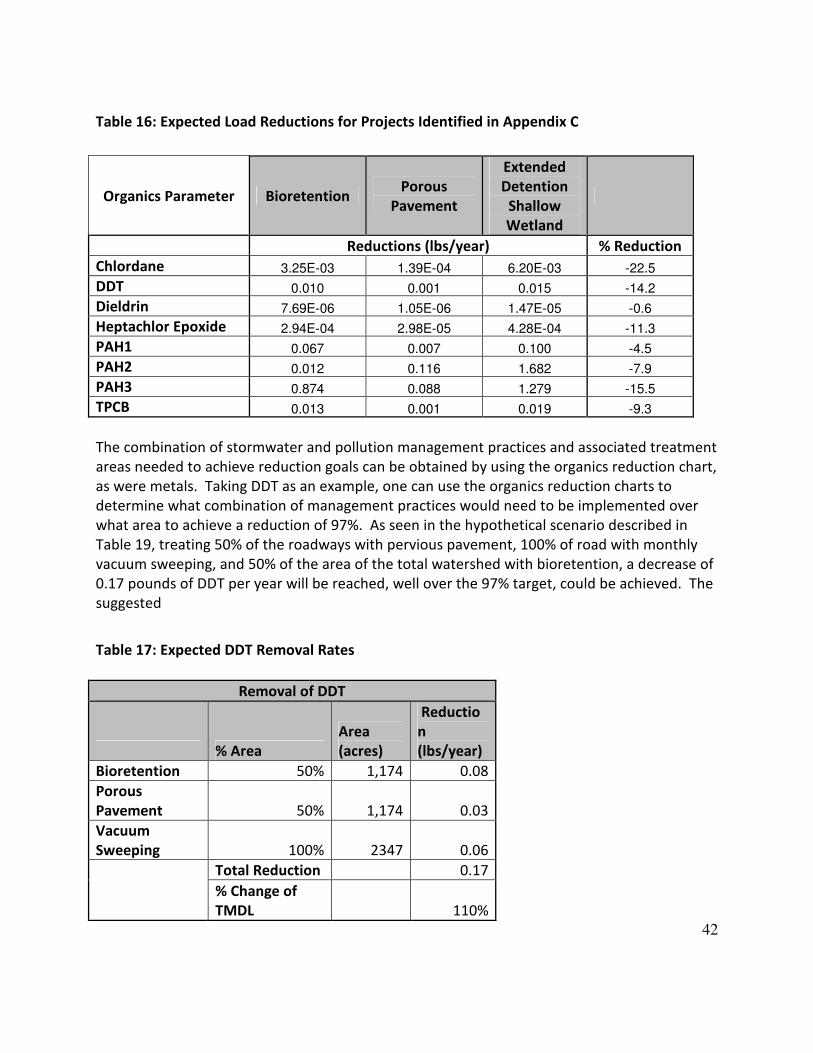
42
Table 16: Expected Load Reductions for Projects Identified in Appendix C
The combination of stormwater and pollution management practices and associated treatment
areas needed to achieve reduction goals can be obtained by using the organics reduction chart,
as were metals. Taking DDT as an example, one can use the organics reduction charts to
determine what combination of management practices would need to be implemented over
what area to achieve a reduction of 97%. As seen in the hypothetical scenario described in
Table 19, treating 50% of the roadways with pervious pavement, 100% of road with monthly
vacuum sweeping, and 50% of the area of the total watershed with bioretention, a decrease of
0.17 pounds of DDT per year will be reached, well over the 97% target, could be achieved. The
suggested
Table 17: Expected DDT Removal Rates
Organics Parameter Bioretention Porous
Pavement
Extended
Detention
Shallow
Wetland
Reductions (lbs/year) % Reduction
Chlordane 3.25E-03 1.39E-04 6.20E-03 -22.5
DDT 0.010 0.001 0.015 -14.2
Dieldrin 7.69E-06 1.05E-06 1.47E-05 -0.6
Heptachlor Epoxide 2.94E-04 2.98E-05 4.28E-04 -11.3
PAH1 0.067 0.007 0.100 -4.5
PAH2 0.012 0.116 1.682 -7.9
PAH3 0.874 0.088 1.279 -15.5
TPCB 0.013 0.001 0.019 -9.3
Removal of DDT
% Area
Area
(acres)
Reductio
n
(lbs/year)
Bioretention 50% 1,174 0.08
Porous
Pavement 50% 1,174 0.03
Vacuum
Sweeping 100% 2347 0.06
Total Reduction 0.17
% Change of
TMDL 110%

43
The treatment areas are rather large and may not seem feasible; however, the area needed for
treatment by the five practices for which the reduction charts were developed could be much
lower since majority of organic loads could be addressed through cleanup of illegal dumping
sites and greater enforcement of pollution prevention plants. A number of illegal dumping
and areas with poor pollution prevention were identified while conducting a watershed
assessment. The exact source of the organic constituents for which the Oxon Run TMDL
addresses is unknown; however the dumping of electronics such as computers, televisions, and
radios may contribute organic chemicals into the surrounding soil and water. Evidence of
dumping was observed at several points in the stream bed. Several sites were identified
throughout the watershed that exhibited very poor pollution prevention practices, specifically
automotive repair facilities and an impoundment lot run DC Department of Public Works. The
clean-up of these dumping sites (many with discarded electronics) and enforcement of better
pollution prevention plans on District Department of Public Works facilities and auto
mechanics will result in a reduction in organic loading rates. A listing of identified pollution
prevention and illegal dumping sites can be found in Appendix E. For the cleanup of the sites
found in Appendix E the District will rely on volunteer groups and both summer employment
programs for District youth that focus on the environment, Green Summer Jobs and Mayor’s
Conservation Corps. Between these two programs, thousands of youths are employed to clean
up the city. This workforce can be employed to address many of the dumping sites found in
Appendix E. Additionally, many environmental nonprofits watershed based organizations hold
regular cleanups each year.
Finally, by banning coal-tar sealants from use in the District, a reasonable assumption can be
made that the PAH loads, which are very concentrated in coal-tar sealants, will decrease over
time. Investigators discovered coal-tar based sealants on a school playground in the Oxon Run
watershed. It is likely that there are numerous locations throughout the watershed where coal
tar has been applied. Identifying and remediating these sites will be necessary to protect
aquatic and human health. DDT and Cholorodane are also illegal for sell or use in the District
and no new sources of these pollutants are being introduced to the watershed.
4.5. Nitrogen
LID bioretention can help reduce nitrogen loading by filtering it from runoff, storing it, and
using it for plant growth. Unfortunately, LID filtering efficiencies for nitrogen (below 50%)
leave much to be desired. However, recent studies have shown that raising the height of the
underdrain can create an anaerobic zone that boosts denitrification rates (Coffman and
Winogradoff, 2002).
Through its overall LID initiative, DDOE will work to incorporate the most recent LID technology
throughout the Oxon Run watershed. According to the efficiencies listed in Appendix E, if the
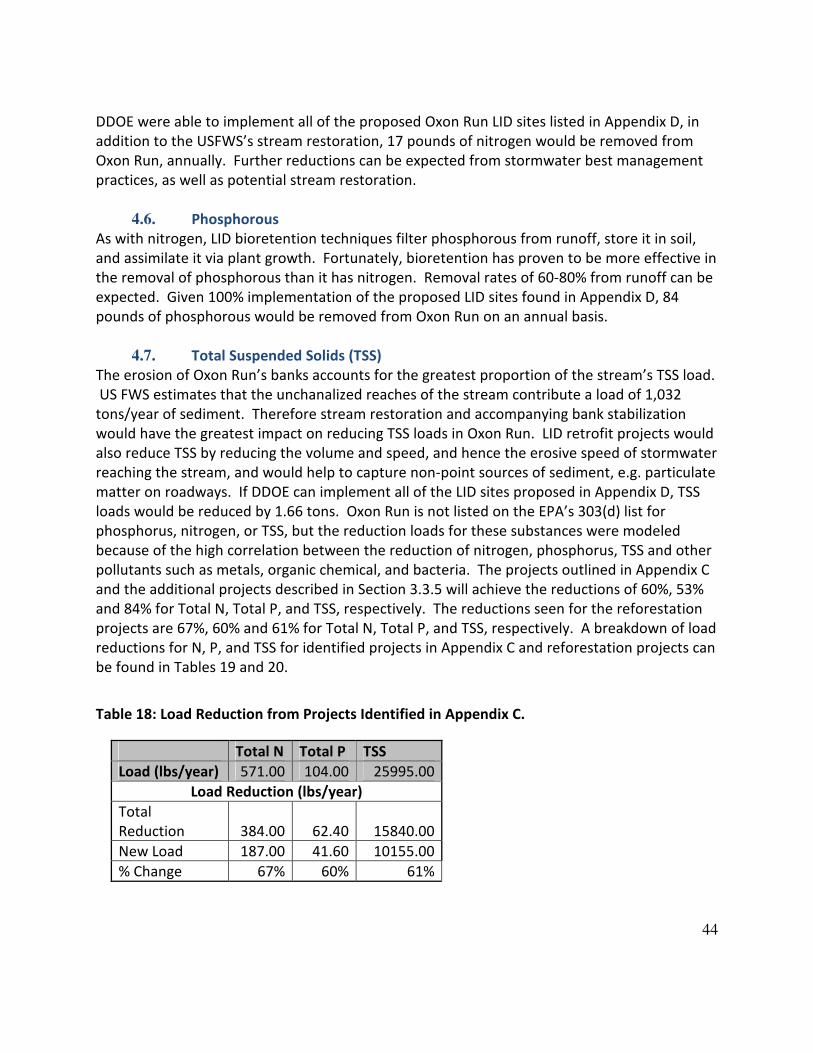
44
DDOE were able to implement all of the proposed Oxon Run LID sites listed in Appendix D, in
addition to the USFWS’s stream restoration, 17 pounds of nitrogen would be removed from
Oxon Run, annually. Further reductions can be expected from stormwater best management
practices, as well as potential stream restoration.
4.6. Phosphorous
As with nitrogen, LID bioretention techniques filter phosphorous from runoff, store it in soil,
and assimilate it via plant growth. Fortunately, bioretention has proven to be more effective in
the removal of phosphorous than it has nitrogen. Removal rates of 60-80% from runoff can be
expected. Given 100% implementation of the proposed LID sites found in Appendix D, 84
pounds of phosphorous would be removed from Oxon Run on an annual basis.
4.7. Total Suspended Solids (TSS)
The erosion of Oxon Run’s banks accounts for the greatest proportion of the stream’s TSS load.
US FWS estimates that the unchanalized reaches of the stream contribute a load of 1,032
tons/year of sediment. Therefore stream restoration and accompanying bank stabilization
would have the greatest impact on reducing TSS loads in Oxon Run. LID retrofit projects would
also reduce TSS by reducing the volume and speed, and hence the erosive speed of stormwater
reaching the stream, and would help to capture non-point sources of sediment, e.g. particulate
matter on roadways. If DDOE can implement all of the LID sites proposed in Appendix D, TSS
loads would be reduced by 1.66 tons. Oxon Run is not listed on the EPA’s 303(d) list for
phosphorus, nitrogen, or TSS, but the reduction loads for these substances were modeled
because of the high correlation between the reduction of nitrogen, phosphorus, TSS and other
pollutants such as metals, organic chemical, and bacteria. The projects outlined in Appendix C
and the additional projects described in Section 3.3.5 will achieve the reductions of 60%, 53%
and 84% for Total N, Total P, and TSS, respectively. The reductions seen for the reforestation
projects are 67%, 60% and 61% for Total N, Total P, and TSS, respectively. A breakdown of load
reductions for N, P, and TSS for identified projects in Appendix C and reforestation projects can
be found in Tables 19 and 20.
Table 18: Load Reduction from Projects Identified in Appendix C.
Total N Total P TSS
Load (lbs/year) 571.00 104.00 25995.00
Load Reduction (lbs/year)
Total
Reduction 384.00 62.40 15840.00
New Load 187.00 41.60 10155.00
% Change 67% 60% 61%
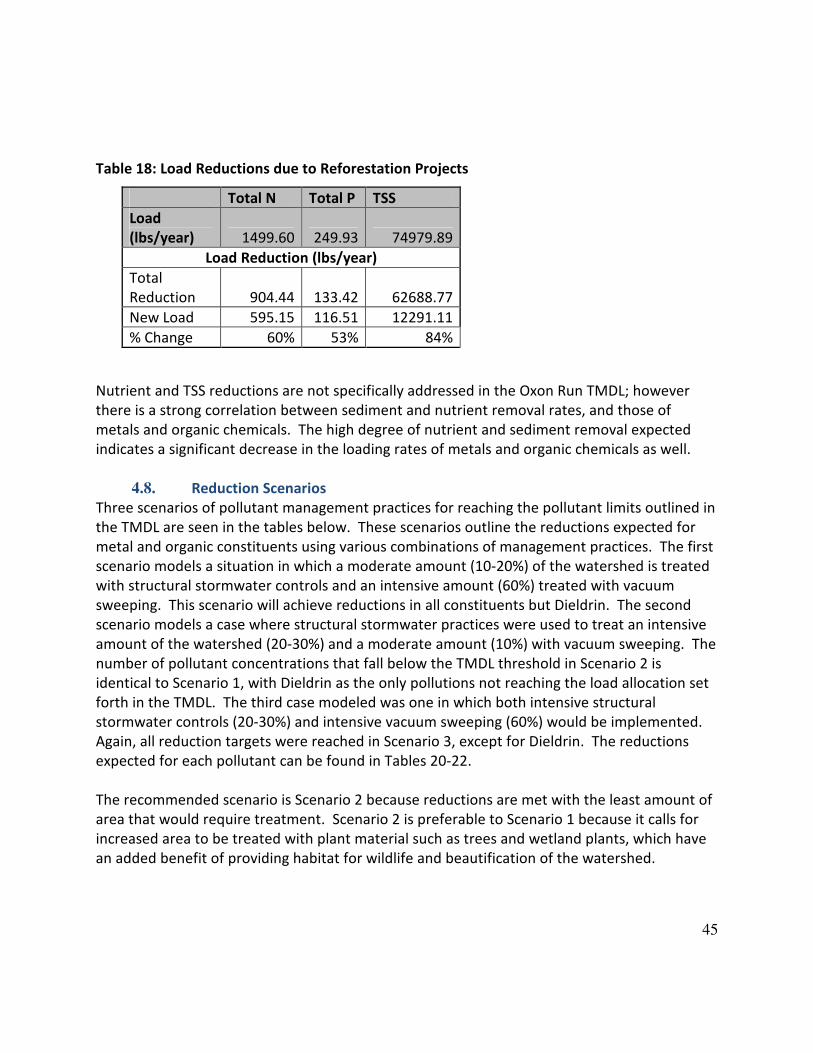
45
Table 18: Load Reductions due to Reforestation Projects
Nutrient and TSS reductions are not specifically addressed in the Oxon Run TMDL; however
there is a strong correlation between sediment and nutrient removal rates, and those of
metals and organic chemicals. The high degree of nutrient and sediment removal expected
indicates a significant decrease in the loading rates of metals and organic chemicals as well.
4.8. Reduction Scenarios
Three scenarios of pollutant management practices for reaching the pollutant limits outlined in
the TMDL are seen in the tables below. These scenarios outline the reductions expected for
metal and organic constituents using various combinations of management practices. The first
scenario models a situation in which a moderate amount (10-20%) of the watershed is treated
with structural stormwater controls and an intensive amount (60%) treated with vacuum
sweeping. This scenario will achieve reductions in all constituents but Dieldrin. The second
scenario models a case where structural stormwater practices were used to treat an intensive
amount of the watershed (20-30%) and a moderate amount (10%) with vacuum sweeping. The
number of pollutant concentrations that fall below the TMDL threshold in Scenario 2 is
identical to Scenario 1, with Dieldrin as the only pollutions not reaching the load allocation set
forth in the TMDL. The third case modeled was one in which both intensive structural
stormwater controls (20-30%) and intensive vacuum sweeping (60%) would be implemented.
Again, all reduction targets were reached in Scenario 3, except for Dieldrin. The reductions
expected for each pollutant can be found in Tables 20-22.
The recommended scenario is Scenario 2 because reductions are met with the least amount of
area that would require treatment. Scenario 2 is preferable to Scenario 1 because it calls for
increased area to be treated with plant material such as trees and wetland plants, which have
an added benefit of providing habitat for wildlife and beautification of the watershed.
Total N Total P TSS
Load
(lbs/year) 1499.60 249.93 74979.89
Load Reduction (lbs/year)
Total
Reduction 904.44 133.42 62688.77
New Load 595.15 116.51 12291.11
% Change 60% 53% 84%

46
Bacteria reductions associated with Scenario 2 can found in Table 25. The result will be a
reduction of 6.4E14 MPN/year, or 66% of total reductions needed. Through extensive field
data, a major source of bacteria has been traced back to the ten sewer crossings that traverse
the stream bed. Many of these sewer lines are faulty and badly in need of repair. It is assumed
that the repair and rerouting of these sewer lines will result in the final 24% reduction needed.
While identifying stormwater retrofit projects in Oxon Run watershed, over 50 acres identified
as good candidates for reforestation and riparian planting as well as 20 acres of green roof
installations and stream restoration. These best management practices we not modeled in the
scenarios above because it is assumed that the reduction efficiencies for metal and organic
constituents would be small; however the cumulative effect of the implementation of these
projects would certainly have a positive impact on water quality and will contribute to reaching
target reductions.

47
Table 19: Scenario 1 - Moderate Stormwater Control and Extensive Vacuum Sweeping
Management Practice Bioretention Porous
Pavement Wetland Tree
Boxes Vacuum
Sweeping
% Area Treated 20% 10% 10% 10% 60%
Pollutant Reductions Expected (lbs/year)
Reduction Needed (lb/year)
Reduction Achieved (lbs/year)
Copper 49.70 23.1 16.9 20.5 137.8 161.4 248
Zinc 128.80 59.6 27.6 53.4 341.6 0 611
Arsenic 0.90 0.4 0.3 0.4 2.7 4.3 4.7
Lead 22.10 11.6 8.9 9.8 55.1 90 107.5
Chlordane 0.012 0.0038 0.008 0.0004 0.0244 0.035358 0.0486
DDT 0.055 0.0290 0.020 0.03 0.1732 0.18333 0.3076
Dieldrin 5.21E-05 2.90E-05 1.99E-05 2.55E-05 1.56E-04 3.19E-03 2.83E-04
Heptachlor Epoxide 1.55E-03 8.07E-04 5.82E-04 7.25E-04 4.83E-03 5.64E-03 8.49E-03
PAH 1 0.36 0.19 0.14 0.17 1.11 0 1.97
PAH 2 6.10 3.15 2.29 2.83 18.7 22.442 33.07
PAH 3 4.62 2.39 1.74 2.16 14.4 14.21 25.31
TPCB 0.07 0.04 0.26 0.03 0.22 0.36 0.62
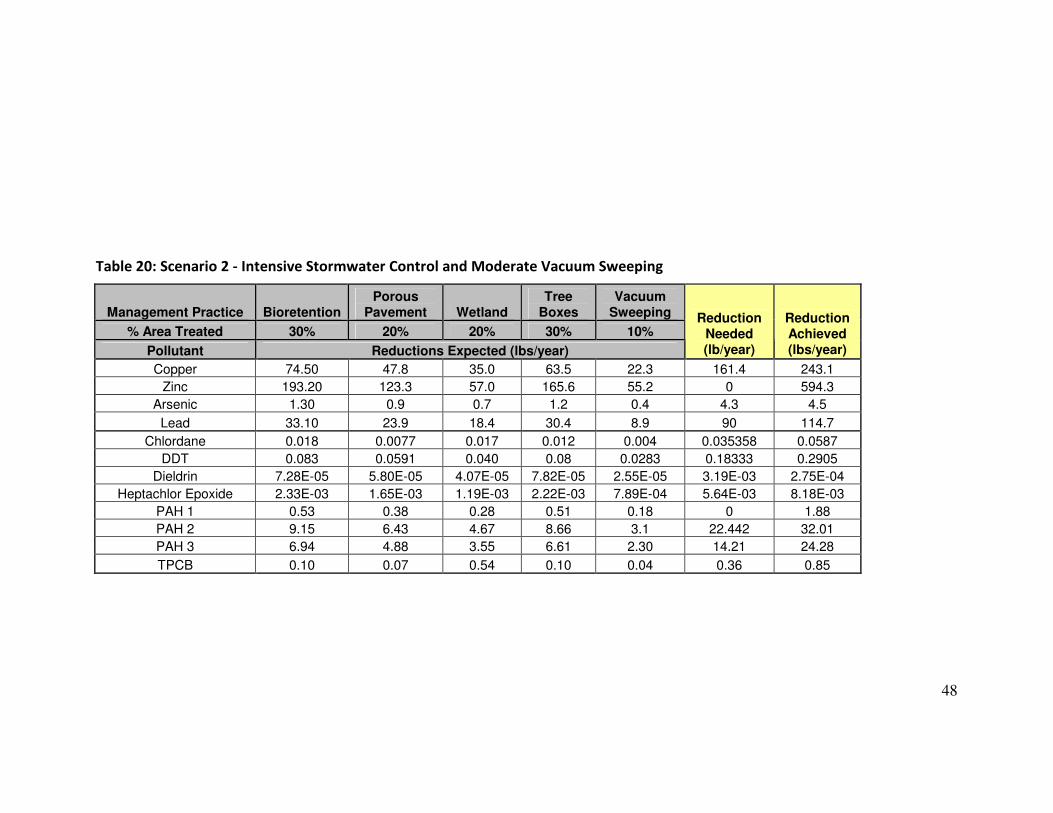
48
Table 20: Scenario 2 - Intensive Stormwater Control and Moderate Vacuum Sweeping
Management Practice Bioretention Porous
Pavement Wetland Tree
Boxes Vacuum
Sweeping
% Area Treated 30% 20% 20% 30% 10%
Pollutant Reductions Expected (lbs/year)
Reduction Needed (lb/year)
Reduction Achieved (lbs/year)
Copper 74.50 47.8 35.0 63.5 22.3 161.4 243.1
Zinc 193.20 123.3 57.0 165.6 55.2 0 594.3
Arsenic 1.30 0.9 0.7 1.2 0.4 4.3 4.5
Lead 33.10 23.9 18.4 30.4 8.9 90 114.7
Chlordane 0.018 0.0077 0.017 0.012 0.004 0.035358 0.0587
DDT 0.083 0.0591 0.040 0.08 0.0283 0.18333 0.2905
Dieldrin 7.28E-05 5.80E-05 4.07E-05 7.82E-05 2.55E-05 3.19E-03 2.75E-04
Heptachlor Epoxide 2.33E-03 1.65E-03 1.19E-03 2.22E-03 7.89E-04 5.64E-03 8.18E-03
PAH 1 0.53 0.38 0.28 0.51 0.18 0 1.88
PAH 2 9.15 6.43 4.67 8.66 3.1 22.442 32.01
PAH 3 6.94 4.88 3.55 6.61 2.30 14.21 24.28
TPCB 0.10 0.07 0.54 0.10 0.04 0.36 0.85

49
Table 21: Scenario 3 - Intensive Stormwater Control and Intensive Street Sweeping
Managemet Practice Bioretention Porous
Pavement Wetland Tree
Boxes Vacuum
Sweeping
% Area Treated 30% 20% 20% 30% 60%
Pollutant Reductions Expected (lbs/year)
Reduction Needed (lb/year)
Reduction Achieved (lbs/year)
Copper 74.50 47.8 35.0 63.5 137.8 161.4 358.6
Zinc 193.20 123.3 57.0 165.6 341.6 0 880.7
Arsenic 1.30 0.9 0.7 1.2 2.7 4.3 6.8
Lead 33.10 23.9 18.4 30.4 55.1 90 160.9
Chlordane 0.018 0.0077 0.017 0.012 0.0244 0.035358 0.0791
DDT 0.083 0.0591 0.040 0.08 0.1732 0.18333 0.4354
Dieldrin 7.28E-05 5.80E-05 4.07E-05 7.82E-05 1.56E-04 3.19E-03 4.06E-04
Heptachlor Epoxide 2.33E-03 1.65E-03 1.19E-03 2.22E-03 4.83E-03 5.64E-03 1.22E-02
PAH 1 0.53 0.38 0.28 0.51 1.11 0 2.81
PAH 2 9.15 6.43 4.67 8.66 18.7 22.442 47.61
PAH 3 6.94 4.88 3.55 6.61 14.4 14.21 36.38
TPCB 0.10 0.07 0.54 0.10 0.22 0.36 1.03
Table 23: Bacteria Reductions Expected for Scenario 2
Expected Bacteria Reductions (MPN/year)
BMP Bioretention Pervious Pavement Wetland Tree Boxes Vacuum Sweeping
% Area Treated 30% 20% 20% 30% 10%
Reductions Needed (MPN/year)
Reductions Achieved (MPN/year)
Load Reduction 3.3E+14 4.6E+13 1.9E+14 6.2E+13 2.3E+13 9.90E+14 6.5E+14
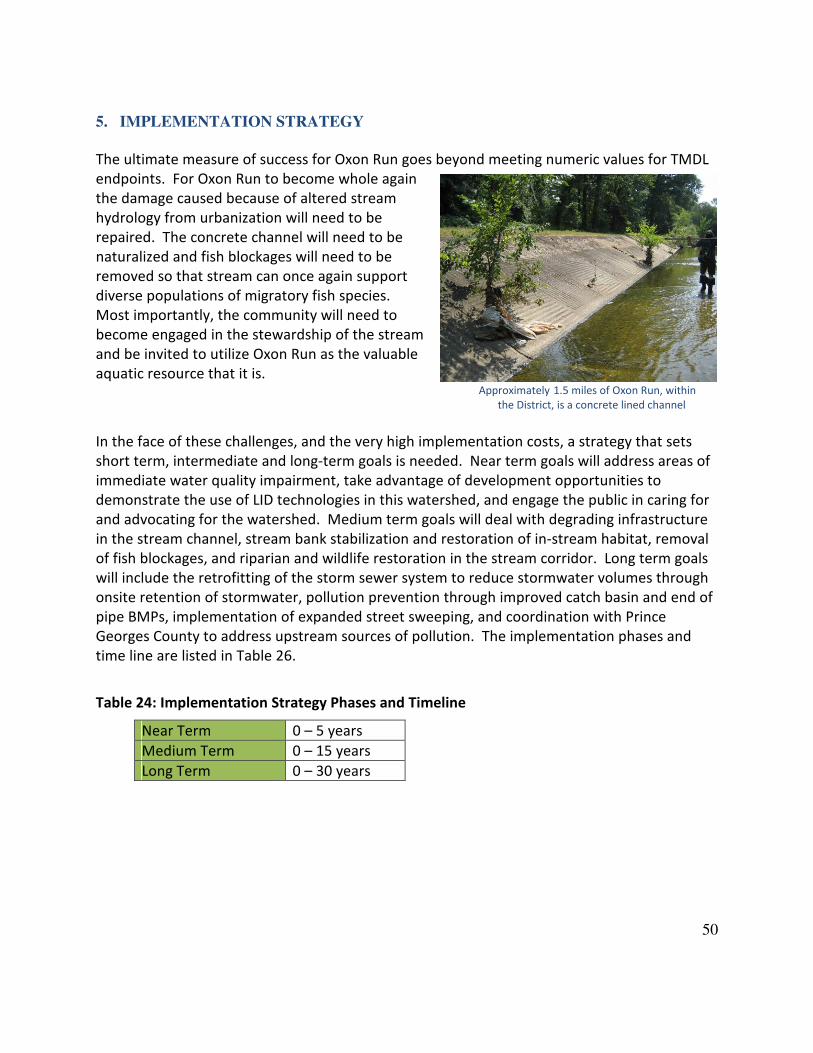
50
5. IMPLEMENTATION STRATEGY
The ultimate measure of success for Oxon Run goes beyond meeting numeric values for TMDL
endpoints. For Oxon Run to become whole again
the damage caused because of altered stream
hydrology from urbanization will need to be
repaired. The concrete channel will need to be
naturalized and fish blockages will need to be
removed so that stream can once again support
diverse populations of migratory fish species.
Most importantly, the community will need to
become engaged in the stewardship of the stream
and be invited to utilize Oxon Run as the valuable
aquatic resource that it is. Approximately 1.5 miles of Oxon Run, within
the District, is a concrete lined channel
In the face of these challenges, and the very high implementation costs, a strategy that sets
short term, intermediate and long-term goals is needed. Near term goals will address areas of
immediate water quality impairment, take advantage of development opportunities to
demonstrate the use of LID technologies in this watershed, and engage the public in caring for
and advocating for the watershed. Medium term goals will deal with degrading infrastructure
in the stream channel, stream bank stabilization and restoration of in-stream habitat, removal
of fish blockages, and riparian and wildlife restoration in the stream corridor. Long term goals
will include the retrofitting of the storm sewer system to reduce stormwater volumes through
onsite retention of stormwater, pollution prevention through improved catch basin and end of
pipe BMPs, implementation of expanded street sweeping, and coordination with Prince
Georges County to address upstream sources of pollution. The implementation phases and
time line are listed in Table 26.
Table 24: Implementation Strategy Phases and Timeline
Near Term 0 – 5 years
Medium Term 0 – 15 years
Long Term 0 – 30 years

51
Table 22: Temporal Implementation Strategy
5.1. Stakeholders
The District Department of the Environment has identified many key stakeholder organizations
that are currently or may be involved in activities to help restore Oxon Run. DDOE will
distribute this draft WIP to stakeholders which include, District of Columbia government
agencies, Federal agencies, neighborhood groups and nonprofit advocacy groups. It is hoped
that these stakeholders will identify additional specific and general projects to achieve further
pollutant load reductions in Oxon Run. Since DDOE does not administer any lands within the
District it is also hoped that some of the agencies will take it upon themselves to initiate some
of these projects. Once comments have been received they will be evaluated and incorporated
into this document, if appropriate.
Because DDOE does not have direct jurisdiction over any land, and since many of the identified
projects are on public land, the most important component of the outreach process is to work
across agencies to identify projects that can be implemented. DDOE has several venues for
accomplishing this task. The MS4 technical working group is a multi agency task force that
deals with issues surrounding the implementation of the provisions set forth in the Districts
MS4 permit from the EPA. WPD staff will present the findings from this report, in additions to
specific project sites and descriptions by agency, to all the members of the task force that
represent the various agencies. DDOE will also present the findings of this report to the various
nonprofit and advocacy groups listed below. For agencies that have a particularly large role to
play in the improvement of water quality in the Oxon Run Watershed DDOE will schedule
direct meetings to go over the various projects proposed on the agencies lands. Finally, DDOE
will also schedule direct meetings with the National Park Service National Capital East and the
District of Columbia Water and Sewer Authority (DC Water). Below is a table that summarizes
this outreach strategy.
Targeted enforcement of likely sources of water quality impairment;
Low Impact Development demonstration projects in the watershed;
Stepped up community outreach and engagement; and Near Term
Riparian and wildlife corridor improvements.
Stream restoration and fish blockage removal; Medium Term
Sewer line infrastructure repair; and
Stormwater volume reductions through onsite retention and LID retrofits on
public lands and in the public right of way;
Expanded street sweeping; and Long Term
Retrofitting of the MS4 system with catch basin and end of pipe BMPs.

52
Table 236: Outreach Priority Agencies and Timeline
Agency Outreach Type Completed By Notes
District Department of
Parks and Recreation
Agency Specific Meeting
and MS4 technical
working group
December 2010 DPR is an vital partner for
stream restoration and
protection of sensitive natural
areas
DC Water Agency Specific Meeting
and MS4 technical
working group
July 2010 DC Water is responsible for
upkeep of the storm system
infrastructure and also
maintains sewer line
infrastructure in the stream
valley that will affect an
stream restoration plans
NPS National Capital
Parks East
Agency Specific Meeting December 2010 NPS NCPE is a vital partner
in protecting sensitive natural
areas and stream restoration
District Department of
Transportation
Agency Specific Meeting
and MS4 technical
working group
December 2010 DDOT is responsible for
public right of way which
makes up a large percentage
of the impervious surface area
within the watershed (DDOE
is already coordinating with
DDOT on a bike trail project
that is in the planning stages
and will include LID features)
DC Public Schools and
Office of Public
Education Facilities
Modernization
Agency Specific Meeting
and MS4 technical
working group
December 2010 There are several schools in
the stream valley where school
grounds can be used to
infiltrate stormwater while
also providing outdoor
learning opportunities
5.1.1. EPA Chesapeake Bay Program
The District Department of the Environment’s goals for Oxon Run are closely aligned with those
of the Chesapeake Bay Program. Oxon Run restoration efforts will support the agreement’s
goals of: “Living Resource Protection and Restoration” for fish passage; “Water Quality
Protection and Restoration” through reduction of nutrient and sediment loads and for the
protection of priority urban waters; and “Sound Land Use” by helping to promote stewardship
of natural resources through public education and community engagement. While the goals of
nutrient and sediment load reductions are not directly linked to existing Oxon Run TMDLs, the
pollutant load reduction strategy will have contemporaneous benefits for these pollutants.

53
The Chesapeake Bay is listed as impaired for nitrogen, phosphorous, sediment. As noted
earlier, while no TMDLs exist for nitrogen, phosphorus, or total suspended solids in District
portion of the Oxon Run watershed, the District is still committed to reducing total nitrogen,
phosphorous, and total suspended solids loads in accordance with the Chesapeake Bay
Agreement. As the EPA moves to enforce the Chesapeake Bay TMDL it is expected that load
reductions for nitrogen, phosphorus and TSS will be assigned to the its tributaries which may
mean required reductions for Oxon Run.
The Chesapeake Bay Program has moved to utilizing specific two-year restoration actions with
five and ten year load reduction targets. It is expected that the activities laid out in this WIP
will inform the specific restoration actions and the more long-term load reduction targets.
5.1.2. District Department of the Environment
The Department of Environment Watershed Protection Division is responsible for watershed
management planning within the District of Columbia. The division manages DC watersheds
according to three types of actions that occur within their boundaries:
1. Scheduled, mandated actions
2. Scheduled, “voluntary” actions
3. Unscheduled and unanticipated events
The DDOE’s Watershed Protection Division manages these actions in accordance with its
mission to conserve the soil and water resources of the District of Columbia and to protect its
watersheds from nonpoint source pollution. The Branches within the Watershed Protection
Division are responsible for the following activities:
Planning and Restoration Branch – In addition to being responsible for all watershed planning
within the District, this branch also fulfills a number of other mandated responsibilities. The
first of these responsibilities is to encourage pollution prevention by carrying out information
and education campaigns, and increasing involvement in cleanup efforts in the District of
Columbia watersheds and the Chesapeake Bay. Second, the Watershed Protection Division
Planning and Restoration Branch sponsors activities that protect and restore river, stream, and
wetland habitats in DC, increase the DC and Chesapeake Bay watershed's ecological diversity,
and protect the health, welfare, and safety of our residents. Lastly, the branch’s education
segment sponsors teacher-training workshops in environmental education using nationally
accredited environmental curriculums. These curricula provide teachers with continuing
education credits, and provide students with meaningful environmental experiences via
outdoor activities, and events. The Watershed Protection Division’s developed its RiverSmart
Homes and RiverSmart Schools programs to combine all three missions of the branch.

54
Sediment and Stormwater Technical Services Branch – This branch has developed and enacted
storm water management and sediment and erosion control regulations for construction sites.
The branch reviews construction and grading plans for stormwater management, erosion and
sediment control, and flood plain management considerations. As required by EPA regulations
regarding new construction permits, all new construction in the District must have Storm
Water Pollution Prevention Plans (SWPPPS) that "identify all potential sources of pollution
which may reasonably be expected to affect the quality of storm water discharges from the
construction site."
Through the work of this branch, many BMPs are installed every year through the plan review
process. All construction that disturbs over 5,000 square feet requires a stormwater
certification from WPD review engineers. This regulatory process is one that is under a
mandate to ensure that post-development flows mimic pre-development stormwater runoff.
WPD is currently establishing new regulations that will encourage the development community
to focus on the installation of LID. Efficiency percentages for LID practices are higher and will
remove a greater percentage of nutrients and sediments. The current focus of WPD is to install
LID where appropriate and strongly encourage developers to incorporate this stormwater
management technique.
Inspection and Enforcement Branch – Following up on these plan reviews, the Inspection and
Enforcement Branch makes construction site visits to enforce compliance with the District of
Columbia’s sediment control and storm water management laws and regulations. In the
process, they also inspect Best Management Practices (BMPs) to ensure they are adequately
maintained. Lastly, the branch is also responsible for investigating citizen complaints relating
to soil erosion and drainage problems, and recommending appropriate solutions.
District Department of the Environment, Stormwater Management Division - The Stormwater
management division has already been mentioned is section 2 above. It is, however, a very
important partner and helps to fund and coordinate much of this work through the
Stormwater Management Division. The Stormwater Management Division is an office within
the DDOE Office of Natural Resources, as is the Watershed Protection Division, and administers
the District’s MS4 permit. The city has imposed an impervious rate fee to offset the cost of
compliance with the NPDES MS4 permit and ultimately to protect and restore the District’s
waterways. The fee is assed to all district property owners who have impervious surface on
their property. The fee applies to non-profit organizations and Federal agencies. The fee is
based on the equivalent residential unit (ERU), which is equal to 1,000 square feet, at a rate of
$2.57 per an ERU per a month. The annual revenue from this fund is approximately
$13,000,000. Most revenue is given, via an intra-district MOU, to the various agencies
responsible for the implementing activities that are prescribed in the MS4 agreement with EPA.
These agencies are named in the DC Comprehensive Stormwater management Enhancement
Amendment Act of 2008, which established the impervious rate fee, and include: WASA,

55
District Department of Public Works, District Department of Transportation and Office of
Planning. The Act mandates that a Stormwater Advisory Panel, composed of agency heads,
meet twice a year to coordinate MS4 related activities. In addition, a MS4 task force,
comprised of lower level managers, meets monthly to coordinate efforts.
WPD participates in the MS4 working group. In addition WPD gets money from the
Stormwater Enterprise fund to implement various pollution mitigation activities in the MS4
areas of the District. These activities include: low impact development projects, green-roof
incentive programs, and end of pipe BMPs.
5.1.3. DC Department of Parks and Recreation (DPR)
DPR supervises and maintains area parks, community facilities, swimming pools and spray
parks, and neighborhood recreation centers, as well as coordinates a wide variety of recreation
programs. DPR is a crucial partner in the implementation of this WIP in that it manages large
blocks of city land with the potential to manage stormwater. DPR is responsible for the
operation of Oxon Run Park, the largest District owned parks within the city. Due to a chronic
lack of funding for parks and open space DDOT has not been able to invest much money for
Capital improvements in Oxon Run Park. Initial conversations between DDOE and DPR have
shown a willingness on the part of DPR to allow end of pipe BMPs, such as stormwater
wetlands, to be constructed on their land.
In addition to Oxon Run Park DPR manages the Bald Eagle Recreation Center and the Hillcrest
Recreation Center. Both of these facilities are adjacent to important terrestrial habitat, Bald
Eagle Hill and Hillcrest Park respectively. Coordination between DPR and DDOE to address
runoff from DPR facilities and to use DPR land for stormwater mitigation will be critical for
improving water quality in Oxon Run.
5.1.4. DC Public Schools (DCPS) and Office of Public Education Facilities
Modernization (OPEFM)
Similar to the recreational facilities, the DCPS and OPEFM oversee, maintain, and modernize
the City’s public schools. There are over a dozen schools in the Oxon Run watershed, many of
which are slated for renovation. These renovations offer an opportunity to incorporate LID
and providing outdoor learning areas for environmental education. Three schools are located
in the floodplain and adjacent to Oxon Run itself. These schools are well placed for combining
stormwater mitigation with outdoor learning activities. School grounds are also good sites for
tree planting and in many instances, the removal of impervious surfaces. Current school
modernization programs can also be leveraged to minimize the buildings stormwater footprint
through the use of LID technologies. In short, schools in general, and in the Oxon Run
watershed in particular, are excellent locations for stormwater mitigation coupled with
education and stewardship opportunities.
56
5.1.5. DC Department of Transportation (DDOT)
The District Department of Transportation (DDOT) is responsible for maintaining streets, roads,
alleyways, sidewalks and trails in the city. DDOT has begun to adopt the use of Low Impact
Development (LID) strategies to control stormwater and stormwater pollution. The city is
currently demonstrating many types of LID including:
o Infiltration tree box planters – tree boxes that accept runoff from sidewalks and
roadways to treat the stormwater and provide water for the trees.
o Silva Cells, structural soils, and other tree root expansion techniques – These tools help
expand the space available for the growth of tree roots which allows for a larger and
healthier tree and the greater potential for the uptake of stormwater and stormwater
pollutants.
o Bioretention – This can take the form of standard bioretention cells or bump outs into
the street that are generally placed near intersections. These bump outs provide a
safer crossing area for pedestrians by reducing the street area that they have to cross;
they slow traffic by narrowing the road; and they accept runoff and treat stormwater
pollution.
o Permeable pavements – Permeable pavements take many forms including paving
stones, porous concrete, and porous asphalt. The District is testing different permeable
pavements in different applications such as alleyways, sidewalks, and roadways to
determine which are appropriate and cost effective.
DDOT is also working to reduce pollutants to the city’s waterways by encouraging commuters
to use alternative forms of transportation. DDOT is expanding the number of bike lanes in the
city, installing bike-share racks, creating trolley and high speed bus lanes, and operating lower
polluting hybrid and natural gas powered busses for its “Circulator” routes.
The District Department of Transportation also houses the City’s Urban Forestry Administration
(UFA). The Urban Forestry Administration (UFA) maintains the city’s street trees pruning and
planting to manage trees in a harsh environment of power and sewer lines, impervious
surfaces, road salt, and punishing summer heat. UFA plants an average of 4150 trees annually,
maintains the thousands of existing city trees, and works to improve growing conditions for
street trees by removing unneeded impervious areas, experimenting with new tree box
technology such as structural soils and Silva cells, and watering trees and pruning trees.
DDOT is in the planning stages of a major trail realignment and rehabilitation for Oxon Run
Park. The plan calls for improved pedestrian crossings at intersections near the park, better
trail alignments, adding solar powered lighting to the trail, rehabilitating bridges that cross the
stream, improved pedestrian and bicycle access to the two nearby metro stations, and
connectivity to a bicycle path network in Maryland that runs through Oxon Cove Park, an NPS
property. This work on its own will do a tremendous amount to improve the social and
recreational value of the park. In addition, DDOT and DDOE have been coordinating on the
57
planning to include LID elements that will treat roadway runoff and infiltrate stormwater.
These projects will take the form of infiltration tree boxes, bioretention cells, permeable
pavement, and possibly stormwater treatment wetlands.
5.1.6. District Department of Public Works (DPW)
The Department of Public Works provides a number of public services that affect the Oxon Run
watershed. DPW oversees solid waste collection, the collection of hazardous wastes, recycling,
leaf collection, and street and alley cleaning programs. These programs help to mitigate the
impacts of trash, hazardous waste, pollutants and roadway sediments on Oxon Run. In
addition DPW leads the Solid Waste Education and Enforcement Program (SWEEP) which
provides the tools for District residents to combat illegal dumping, clean up vacant lots, and
support neighborhood clean-ups.
One of the most important DPW functions, as far as reaching TMDL endpoints, is mechanical
street sweeping. DDOE SWD has paid for enhanced street sweeping by purchasing
regenerative air sweepers and continues to help pay for the continued upkeep of these
machines. Regenerative air sweepers do a better job of collecting fine partials, to which metals
and other pollutants tend to bind. (ESSPRS, 2008) While DPW cleans all district streets, the
frequency of mechanical street sweeping varies considerably across the city. In the Oxon Run
watershed there are only a few routes that are regularly swept. In order to reach required
TMDL endpoints DPW will need to expand street sweeping in Oxon Run Watershed.
5.1.7. DC Water and Sewer Authority (DC Water)
WASA is responsible for the maintenance of the waste water and storm water infrastructure in
the District. WASA is currently in the planning stages of a large sewer main rerouting, in the
western most reach of the stream, which will replace one of the ten aging sewer crossings in
Oxon Run. Repair, replacement and/or removal of all the sewer crossings will be necessary to
ensure that bacteria TMDL end points are reached. In addition stream bank stabilization will
be needed in areas to protect lateral sewer line pipes that run parallel on either side of the
stream for much of its length. Finally, any stream restoration work will need to happen in
coordination with WASA both to repair WASA infrastructure and to ensure that that it is
protected.
5.1.8. National Park Service (NPS) National Capital Parks East (NCPE)
The National Park Service manages a great deal of the federally-controlled lands in the Oxon
Run watershed. NPS NCPE is composed of 13 parcels which include parks, National Historic
Sites, and parkways both in the District of Columbia and Maryland. NPS controls large
contiguous portions of land adjacent to Oxon Run that straddle the DC Maryland border. Oxon
Cove Park and Oxon Run Expressway (an area that contains the Magnolia Bogs) are two
examples. Along with DPW and WASA, NPS NCPE is among the most important government
entity with which DDOE must coordinate stream restoration projects.

58
5.1.9. Washington Parks and People (WPP)
For nearly twenty years Washington Parks and People has been advocating for the District’s
neglected parks. Key to WPP mission is linking the issues of public health, public safety, and
environmental justice to adequate open space for all of District residents. WPP has worked
tirelessly to improve and revitalize Marvin Gaye Park, which is adjacent to Watts Branch, a
major tributary to the Anacostia. In recent years WPP has turned its attention to Oxon Run
Park. Last year WPP partnered with DDOE to field a group of Green Summer Youth, a summer
youth employment program run by DDOE, to help maintain and revitalize the park. WPP is an
important partner in helping to bring attention and resources to Oxon Run Watershed.
5.1.10. Casey Trees
Casey Trees is a non-profit organization dedicated to expanding and caring for the District’s
tree canopy. As a part of this effort, Casey runs community tree planting programs, a tree
rebate program, and plants trees for DDOE’s RiverSmart Homes program. Additionally Casey
leads classes in the identification and care of trees and performs monitoring and modeling of
canopy cover. Casey has an active and knowledgeable cadre of volunteer “citizen foresters”
that aid its paid staff in their mission. Casey Trees, will be an important partner in helping
increase tree canopy in the watershed as a whole and in riparian areas.
5.1.11. Neighborhood Advisory Commissions (ANC)
The Advisory Neighborhood Commissions are elected bodies that weigh in on issues that affect
their neighborhoods. ANCs consider a wide range of policies and programs affecting their
neighborhoods, including traffic, parking, recreation, street improvements, liquor licenses,
zoning, economic development, police protection, sanitation and trash collection, and the
District's annual budget. In each of these areas, the intent of the ANC legislation is to ensure
input from an advisory board that is made up of the residents of the neighborhoods that are
directly affected by government action. The ANCs are the body of government with the closest
official ties to the people in a neighborhood. The ANCs present their positions and
recommendations on issues to various District government agencies, the Executive Branch, and
the Council. They also present testimony to independent agencies, boards, and commissions.
There are four ANCs in the Oxon Run watershed (ANCs 8B, 8C, 8D, 8E). In the course of
preparing this plan DDOE met with representatives from these commissions. As a next step in
the community engagement process DDOE will bring the projects and findings from this report
to the various ANC commissions. ANC partners will be critical partners in helping to galvanize
community support for restoration activity.
5.1.12. Oxon Run Community Alliance (ORCA)
Oxon Run Community Alliance is a recently formed advocacy group. ORCAs mission is to bring
attention and resources to the Oxon Run watershed and the parks that are adjacent to the

59
park. DDOE partnered with ORCA to help lead a
cleanup in Oxon Run Park. Hundreds of people
came out on a Saturday to remove 30 cubic yards
of garbage from stream valley. DDOE will
continue to work with ORCA to promote water
quality improvements in the Oxon Run
Watershed.
Local Youth help out at an Oxon Run Cleanup
5.1.13. Prince Georges County Department of Environmental Resources
The mission of the Department of Environmental Resources is to protect and enhance the
natural and built environments of Prince George's County by enforcing Federal, State and
County laws to create a healthy, safe and aesthetically pleasing environment for all residents
and businesses of the County. Successful restoration and protection of the Oxon Run
watershed will require coordination with Prince Georges County.
5.1.14. Washington Suburban Sanitary Commission (WSSC)
The WSSC provides sanitary services to approximately 1.6 million residents in Prince George’s
and Montgomery counties. Similar to efforts by WASA and other District agencies, the WSCC
works to minimize the chances of sewage overflows and to maintain stormwater and sewer
infrastructure in the upstream portions of the Oxon Run watershed. In 2005 WSSC entered
into a consent decree with the EPA where WSSC is required to implement over 14 years
numerous reporting, monitoring, inspection, maintenance, repair and replacement remedial
measures for its sewer collection system in order to eliminate sewer overflows.
5.2. Specific Projects
In the development of this Watershed Implementation Plan, DDOE staff spent the equivalent
of several work weeks in the field searching for appropriate locations for the installation of Low
Impact Development practices to reduce stormwater pollution to Oxon Run. DDOE’s
investigators focused their efforts on LID on public land, in the public right of way and on quasi
public land, e.g. churches, and highly visible private property. Some additional projects on
private property were added when the size of the property or its proximity to Oxon Run
elevated its importance. An inventory of the identified projects is found in the appendix of this
document. The majority of these projects focus on three major pollution reducing practices:
low impact development installation, stream restoration, and reforestation. Investigators also
noted businesses and government facilities where pollution prevention or enforcement
activities where required. In addition, other projects that benefit fish and wildlife were
identified. These projects include removal of barriers to fish passage, trash reduction projects,
and the installation or rehabilitation of wetlands. Many of the projects identified in this
inventory will be among the first projects installed through the WIP effort, however not all the
project identified will be installed in the coming years. Some projects will be found to be
60
infeasible due to costs or unseen barriers to installation such as buried infrastructure or
unwilling land owners. Furthermore, it is possible that some of these projects will overlap with
the general management measures described above. Nevertheless, for the purposes of the
WIP analysis, it was assumed that all projects will be installed.
5.2.1. Low Impact Development
Low Impact Development are design techniques that mimic a site's predevelopment hydrology
and infiltrate, filter, store, evaporate, and detain runoff close to its source. Investigators
focused on three types of LID technology: bioretention cells, retrofit of vegetated (green) roofs
and installation of pervious pavers. Below, Table 24 details the area treated by specifically
identified projects, area treated and projected cost.
Bioretention - A bioretention cell is a shallow depression with porous soils and planted with
native plant species that can tolerate a range of conditions. Stormwater runoff is directed into
the cell where water pollutants are taken up by the plants, the soil mixture, and the microbes
that they contain. Bioretention differs from stormwater ponds in that they are generally
smaller, treat a more localized source of stormwater, and are more efficient in their uptake of
pollutants.
Green Roofs - Green roofs are rooftops that are partially or entirely covered by vegetation.
There are two types of green roofs: intensive and extensive green roofs. Intensive green roofs
are roofs with thick layers of soil or growing media that are able to support deeper rooting
plants such as perennials, shrubs and sometimes trees. Intensive roofs are less common than
the extensive roofs. Extensive roofs are green roofs with very shallow, light growing media.
These types of green roofs support only the most drought tolerant, shallow rooted vegetation.
Green roofs extend the life of roofs, conserve energy, and create habitat. Most importantly
green roofs reduce stormwater volume and peak flows and capture pollutants.
Permeable Pavement - Permeable pavements take many forms including paving stones,
porous concrete, and porous asphalt. These pavements are underlain by varying depths of
compacted, washed, angular gravel. The angular gravel provides void space for rain water to
filter down and eventually infiltrate into the soil while also creating a stable base for the paving
surface. The depth of the angular gravel base will vary depending on the amount of
stormwater the permeable pavement system will receive as well as the weight of the vehicles it
must support and the frequency of the pavement’s use.
Investigators identified 167 individual LID projects in the Oxon Run watershed. All told, these
projects could treat 87.9 acres, or 9.7%, of the total impervious area within the District portion
of Oxon Run watershed. Appendix A includes a map of the LID projects that we identified in
our survey and Appendix C contains details about each individual project.

61
5.2.2. Stream Restoration
Stream restoration is the act of modifying the current channel of a stream in an attempt to
improve the environmental health and habitat of the waterway. Urban streams face immense
pressure from high stormwater flows due to runoff from impervious surfaces. The erosion we
see in urban streams is the stream’s way of adjusting to accommodate the new (geologically)
flow regime it is experiencing. Stream restoration attempts to create a new channel that is in
stasis with the flows it experiences.
The District now prefers the use of natural channel design techniques that protect stream
banks, reduce erosion, and provide habitat for fish and wildlife. These techniques are
preferred over bank hardening such as the use of rip-rap, gabion baskets, and cement culverts.
There are, however cases where high flows, human infrastructure, and threats to safety
sometimes limit the use of natural stream channel design. Restoration in Oxon Run is
complicated by the presence of District infrastructure in the stream valley. Roadway bridges,
water mains, sanitary sewers, and storm sewers and their associated outfalls constrain designs
by limiting potential meander bends and producing erosion hazards. The US Fish and Wildlife
Service, 2004, surveyed the entire Oxon Run watershed and developed two stream restoration
concepts for representative reaches of the District portion of Oxon Run, i.e. natural unlined
reach and the concrete lined reach.
The concrete lined portion of Oxon Run, running between South Capitol and 13th
Streets, SE, a
7,920 foot long stretch, is perhaps the most difficult section to restore. For their
representative reach, USFWS chose the 2,520-foot stretch bound by Wheeler Road and 4th
Street. This section, like the rest of the concrete lined length, is surrounded by DPR’s Oxon Run
Park property, which is mostly open parkland that was created with fill. In this section, USFWS
designs call for removal of the channel’s concrete lining and the installation of a natural stream
channel with an increased length of 2,660 feet. Site constraints in this part of the stream
included: two sanitary sewers on either side of the channel, five storm sewer outfalls, and the
Wheeler Road and 4th
Street bridges. To accommodate this infrastructure, the concept designs
route Oxon Run through both bridges, but call for the crossing of the 42-inch sanitary sewer
that bounds the current channel to the north. To protect this sewer line, designs call for the
installation of a concrete line encasement, as well as rock grade control downstream and
possibly in front of the line. To address storm water outfalls, USFWS proposed backing the
outfalls away from the channel by creating a series of treatment areas that address trash
collection, settling for large sediment, and infiltration. DPR’s surrounding parkland provides
ample opportunity for pond and wetland features, and would provide opportunities for
environmental education in addition to their obvious water quality benefits. To accommodate
the 100-year flood, the designs include significant excavation to reduce elevations in the fill
areas near Wheeler Road.
62
The natural channel portion of Oxon Run that the USFWS chose as a representative reach lies
not far downstream of the District border along Southern Avenue. The representative qualities
of this reach include its location within the wooded NPS Oxon Run Parkway, its entrenched and
over-widened channel, and its degraded instream habitat. To correct Oxon Run’s problems in
this reach, while also managing NPS’s concerns over forest disturbance, USFWS designs
essentially keep Oxon Run within its current channel, but make modifications to this channel.
These modifications mainly include decreasing the stream’s width, creating a lower, more
accessible floodplain, and installing rock cross-vanes and J-hooks. Cross-vanes and J-hooks are
structures that help direct hydraulic forces away from stream banks and into the center of the
channel, where they help create and maintain streambed habitat features. A key improvement
will be an increase in Oxon Run’s flood prone width, which will reduce shear stress and
sediment transport for discharges greater than bankfull. During times of lower flows, J-hooks
and cross vanes (constructed, but seemingly natural rock features) will help to redirect shear
stress away from stream banks, and toward the center of the channel. Lastly, USFWS designs
will include a new meander pattern, or planform, for Oxon Run. In general, Oxon Run’s new
planform will replace long, tight meander curves with shorter and looser ones. These new
curves will provide Oxon Run with the stable geometry that the stream is currently trying to
achieve through bank erosion. (USFWS, 2004)
Stream restoration of Oxon Run to help accommodate the urban hydrology regime is extremely
ambitious. Yet, as already mentioned, stream restoration may be the only way to meet the
spirit, if not the rule, of the Clean Water Act. Restoring Oxon Run, and in the process Oxon Run
Park, would improve the both the environmental and social aspects of the stream corridor.
Stream restoration, would allow for the reestablishment of benthic communities in the stream.
It would also provide a tremendous educational, recreational, and ecological resource for the
communities of South East DC. Stream restoration would be a capstone to the long positive
trend of redevelopment in this once forgotten, but still underserved area. The monetary costs
associated with this project, however, will be high. The USFWS, in 2004, estimated that stream
restoration in the DC portion of Oxon Run would cost $6,888,888 and stormwater treatment
wetlands would cost an additional $1,094,000. This is a rough estimate and may be low, the
rising cost of materials, and the technical difficulty of this project will likely inflate the cost.
5.2.3. Reforestation and Riparian Buffers
Urban trees have many known and quantified benefits. They have recently been touted as
valuable tool for carbon sequestration. They are known to improve air quality, to cool their
surroundings, to reduce energy consumption, and to provide valuable food and habitat for
wildlife. Trees have documented human health benefits as well – from reducing asthma rates
to improving mental health.
From the standpoint of this plan however, we focus on trees’ ability to reduce pollution. Trees
reduce topsoil erosion, prevent harmful land pollutants contained in the soil from getting into

63
our waterways, slow down water run-off, and help ensure that our groundwater supplies are
continually being replenished. For every 5% of tree cover added to a community, stormwater
runoff is reduced by approximately 2% (Coder, 1996). Along with breaking the fall of
rainwater, tree roots remove nutrients harmful to water ecology and quality. Trees act as
natural pollution filters - keeping particulate matter out of the flow toward the storm sewers
and reducing the flow of stormwater.
Trees that make up a healthy riparian buffer also stabilize stream banks – reducing erosion
caused by stormwater flows. They also cool streams – reducing the thermal shock streams can
experience with stormwater flows. Finally riparian buffers provide valuable habitat to wildlife
– especially in urban environments.
Investigators located 66 sites for tree planting in the Oxon Run watershed adding tree canopy
equivalent to approximately 59 acres. This does not include riparian restoration. Tree planting
in urban environments often requires planting more costly older trees that can resist mowers,
weed-eaters and other human impacts. While the overall cost of these projects may be high,
there are ample opportunities for tree planting throughout the watershed and tree planting is
a great activity for engaging citizens. A map of the tree planting project locations can be found
in Appendix A and details about each project can be found in Appendix D.
5.2.4. Wetland Creation and Rehabilitation
Wetlands provide exceptional habitat and pollution reduction value. They are homes to
hundreds of species; play an important role in the breeding lifecycle of some fish, reptiles,
amphibians, and insects; and are a vital stopover for migrating birds and bats. Wetlands are
sometimes called “nature’s sponge” for their abilities both to hold water and prevent flooding
and for their ability to sop up pollutants.
Unfortunately, wetlands and urban areas do not mix well. A combination of development,
stream channelization, and flashy stormwater
conditions have reduced wetland areas nation-
wide by over 50 percent. Wetlands in the
District have fared worse. While no estimates
of wetlands in Oxon Run are available it is
thought that the magnolia bogs once extended
to Oxon Cove. Fortunately there is ample room
in Oxon Run Park to restore stormwater
wetlands. The advantage of stormwater
wetlands is that they can treat stormwater
runoff from a relatively large land area and also
provide a great deal of wildlife benefit. Middleton Elementary School Stormwater wetland,
Charles County Maryland

64
Investigators identified four areas where stormwater wetlands could be placed, however, more
detailed engineering is required to determine the size and number of stormwater treatment
areas that can be installed in the stream corridor. A map of the wetland project locations and
details about each project can be found in Appendix A and D respectively. USFWS in their
stream restoration designs also identified areas for wetland creation, restoration.
5.2.5. Removal of Barriers to Fish Passage
Throughout their ranges on the East Coast of the United States, migratory fish stocks are on
the decline. Part of the reduction in fish population is due to increased pollution loads in
streams and rivers, but part of their decline is due to the
loss of habitat. Even if the District is successful in
reducing pollutant loads to levels safe for aquatic life, if
they do not have access to local streams, populations
may continue to decline. Barriers to fish passage in the
District can be addressed with stream restoration.
USFWS designs for Oxon Run will result in a narrower,
deeper channel that allows for fish passage even during
normal, or baseflow, conditions. Currently, much of
Oxon Run is too wide and does not provide adequate
Sewer line crossings can be barriers to fish passage depth during baseflow periods. In addition to
narrowing Oxon Run, USFWS designs will greatly enhance the stream’s riffle-pool streambed
features. Oxon Run’s current fish habitat features are either poorly defined or absent
altogether, leading to limited area for food production, feeding, and cover. Downstream a
USACE flood prevention drop structure would need to be reengineered to allow for fish
passage.
5.2.6. Trash Removal
Trash removal is an excellent activity for involving the public in restoration work and in
generating watershed stewards, and as already mentioned trash is a major issue in the
watershed. Trash may also be a source of
water quality impairment. During the course
of field investigations various electronic and
automobile parts where identified, these
components very likely leach toxic chemicals
that will eventually find their way into Oxon
Run. While these sources may only
constitute a tiny fraction of the overall
pollutant load, investigators identified
locations throughout the watershed where
trash removal is needed, not least of which Illegal dumping and areas with accumulated litter are located
throughout the watershed
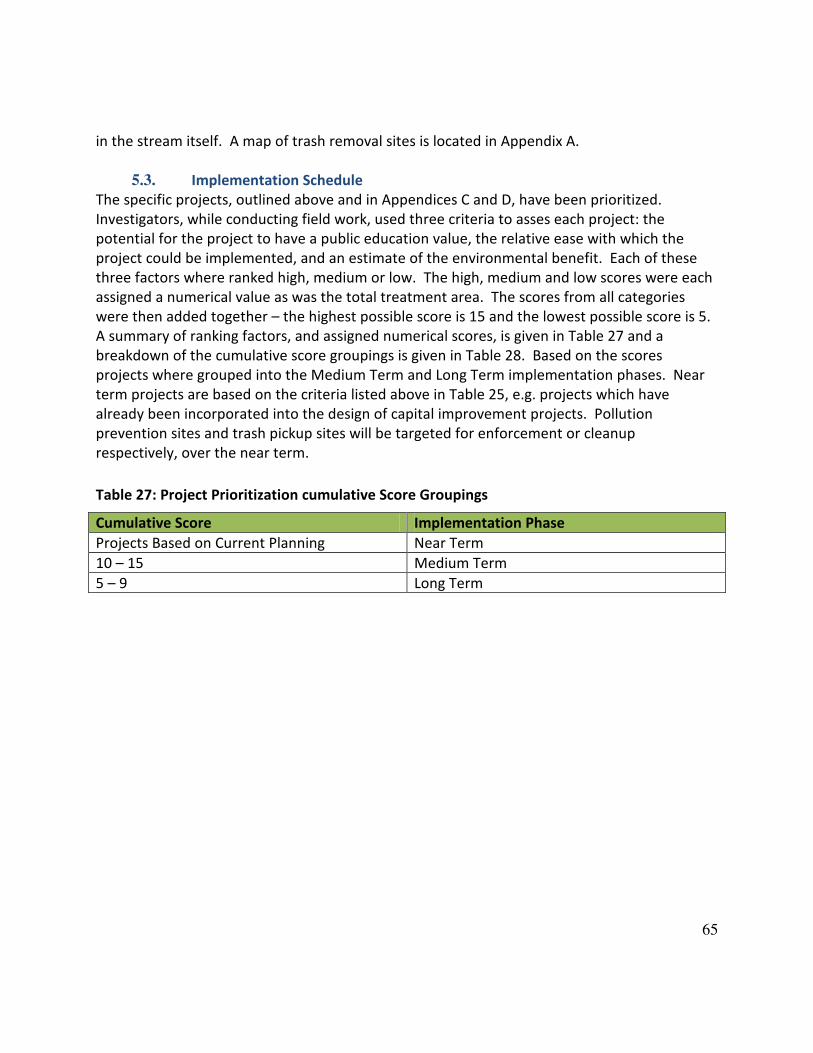
65
in the stream itself. A map of trash removal sites is located in Appendix A.
5.3. Implementation Schedule
The specific projects, outlined above and in Appendices C and D, have been prioritized.
Investigators, while conducting field work, used three criteria to asses each project: the
potential for the project to have a public education value, the relative ease with which the
project could be implemented, and an estimate of the environmental benefit. Each of these
three factors where ranked high, medium or low. The high, medium and low scores were each
assigned a numerical value as was the total treatment area. The scores from all categories
were then added together – the highest possible score is 15 and the lowest possible score is 5.
A summary of ranking factors, and assigned numerical scores, is given in Table 27 and a
breakdown of the cumulative score groupings is given in Table 28. Based on the scores
projects where grouped into the Medium Term and Long Term implementation phases. Near
term projects are based on the criteria listed above in Table 25, e.g. projects which have
already been incorporated into the design of capital improvement projects. Pollution
prevention sites and trash pickup sites will be targeted for enforcement or cleanup
respectively, over the near term.
Table 27: Project Prioritization cumulative Score Groupings
Cumulative Score Implementation Phase
Projects Based on Current Planning Near Term
10 – 15 Medium Term
5 – 9 Long Term

66
Table 28: Ranking Factors for Project Prioritization and Assigned Numerical Values
Potential Educational Benefit Numerical Score Maximum/Minimum Score
High 3
Medium 2
Low 1
3/1
Potential Environmental Benefit
High 4
Medium Low 3
Low 2
4/2
Estimated Ease of Implementation
High 3
Medium 2
Low 1
3/1
Treatment Area (acres)
≤ 0.09 1
0.10 – 0.19 2
0.20 – 0.49 3
0.50 – 0.99 4
≥ 1.00 5
5/1
Maximum/Minimum Score 15/5
The next step will be for DDOE to provide the list of projects to our sister agencies and
stakeholders for vetting. Based on redevelopment plans from sister agencies like DDOT and
DPW, and community preferences DDOE will reevaluate the implementation priorities to see if
other projects can be moved into the near term, or medium term categories. DDOE will also
take into account community input and priorities in order to reassess the implementation
strategy. A list of projects and project ranking is found in Table 29.
This being said, the District Department of the Environment is not a landholder in the city. It
relies on the willingness of those that do own or manage land in the city to provide access to
install pollution management measures. Moreover, approximately 1/3 of the land in the
District is federally controlled, which requires an additional burden of coordinating with a
second level of bureaucracy. Because of this, and because of the limited financial resources
available on an annual basis, it is difficult to lay out an exact implementation schedule or
include many projects in the near term implementation goals.
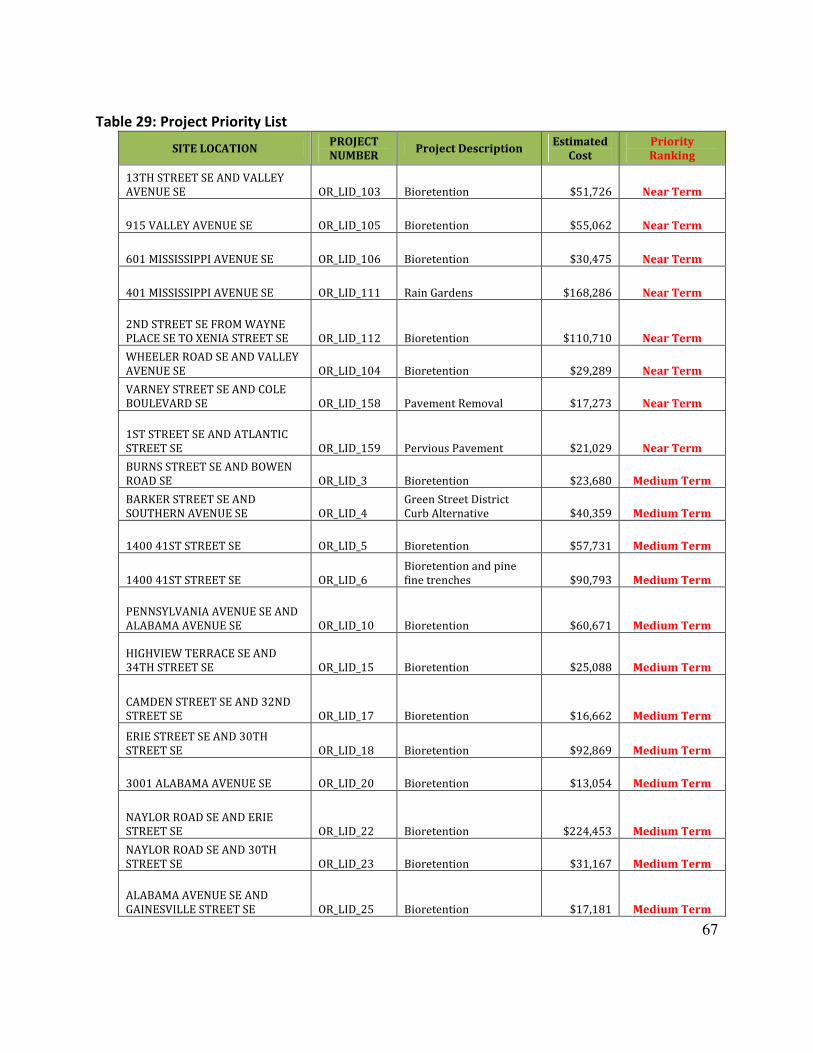
67
Table 29: Project Priority List
SITE LOCATION PROJECT
NUMBER Project Description
Estimated
Cost
Priority
Ranking
13TH STREET SE AND VALLEY AVENUE SE OR_LID_103 Bioretention $51,726 Near Term
915 VALLEY AVENUE SE OR_LID_105 Bioretention $55,062 Near Term
601 MISSISSIPPI AVENUE SE OR_LID_106 Bioretention $30,475 Near Term
401 MISSISSIPPI AVENUE SE OR_LID_111 Rain Gardens $168,286 Near Term
2ND STREET SE FROM WAYNE PLACE SE TO XENIA STREET SE OR_LID_112 Bioretention $110,710 Near Term
WHEELER ROAD SE AND VALLEY AVENUE SE OR_LID_104 Bioretention $29,289 Near Term
VARNEY STREET SE AND COLE BOULEVARD SE OR_LID_158 Pavement Removal $17,273 Near Term
1ST STREET SE AND ATLANTIC STREET SE OR_LID_159 Pervious Pavement $21,029 Near Term
BURNS STREET SE AND BOWEN ROAD SE OR_LID_3 Bioretention $23,680 Medium Term
BARKER STREET SE AND SOUTHERN AVENUE SE OR_LID_4
Green Street District Curb Alternative $40,359 Medium Term
1400 41ST STREET SE OR_LID_5 Bioretention $57,731 Medium Term
1400 41ST STREET SE OR_LID_6 Bioretention and pine fine trenches $90,793 Medium Term
PENNSYLVANIA AVENUE SE AND ALABAMA AVENUE SE OR_LID_10 Bioretention $60,671 Medium Term
HIGHVIEW TERRACE SE AND 34TH STREET SE OR_LID_15 Bioretention $25,088 Medium Term
CAMDEN STREET SE AND 32ND STREET SE OR_LID_17 Bioretention $16,662 Medium Term
ERIE STREET SE AND 30TH STREET SE OR_LID_18 Bioretention $92,869 Medium Term
3001 ALABAMA AVENUE SE OR_LID_20 Bioretention $13,054 Medium Term
NAYLOR ROAD SE AND ERIE STREET SE OR_LID_22 Bioretention $224,453 Medium Term
NAYLOR ROAD SE AND 30TH STREET SE OR_LID_23 Bioretention $31,167 Medium Term
ALABAMA AVENUE SE AND GAINESVILLE STREET SE OR_LID_25 Bioretention $17,181 Medium Term

68
SITE LOCATION PROJECT
NUMBER Project Description
Estimated
Cost
Priority
Ranking
2465 ALABAMA AVENUE SE OR_LID_26 Pervious pavment & Bioretention $31,192 Medium Term
2709 ALABAMA AVENUE SE OR_LID_31 Bioretention $70,358 Medium Term
KNOX STREET SE AND KNOX TERRACE SE OR_LID_32 Bioretention $52,764 Medium Term
23RD STREET SE AND SAVANNAH STREET SE OR_LID_33 Bioretention $73,274 Medium Term
23RD STREET SE AND ALABAMA AVENUE SE OR_LID_34
Asphalt removal & Bioretention $37,172 Medium Term
SAVANNAH STREET SE AND 23RD STREET SE OR_LID_35 Bioretention $46,240 Medium Term
SAVANNAH STREET SE AND 25TH STREET SE OR_LID_36
Curb bump-outs bioretention $135,495 Medium Term
VALLEY TERRACE SE AND SOUTHERN AVENUE SE OR_LID_38
Curb bump-outs bioretention $105,842 Medium Term
13TH STREET SE AND SOUTHERN AVENUE SE OR_LID_39 Bioretention $94,525 Medium Term
13TH STREET SE AND WAHLER PLACE SE OR_LID_40 Bioretention $80,217 Medium Term
1310 SOUTHERN AVENUE SE OR_LID_41 Bioretention $259,715 Medium Term
1310 SOUTHERN AVENUE SE OR_LID_42 Bioretention $180,320 Medium Term
1380 SOUTHERN AVENUE SE OR_LID_44 Bioretention $17,453 Medium Term
1380 SOUTHERN AVENUE SE OR_LID_45 Bioretention $37,789 Medium Term
1310 SOUTHERN AVENUE SE OR_LID_46 Bioretention $188,029 Medium Term
1310 SOUTHERN AVENUE SE OR_LID_47 Bioretention $144,020 Medium Term
ALABAMA AVENUE SE FROM 15TH PLACE SE TO STANTON ROAD SE OR_LID_48 Bioretention $34,182 Medium Term
1345 SAVANNAH STREET SE OR_LID_49 Rain Gardens $32,007 Medium Term
MISSISSIPPI AVENUE SE AND 15TH STREET SE OR_LID_50 Bioretention $98,577 Medium Term
14TH PLACE SE AND SAVANNAH PLACE SE OR_LID_51 Bioretention $95,612 Medium Term
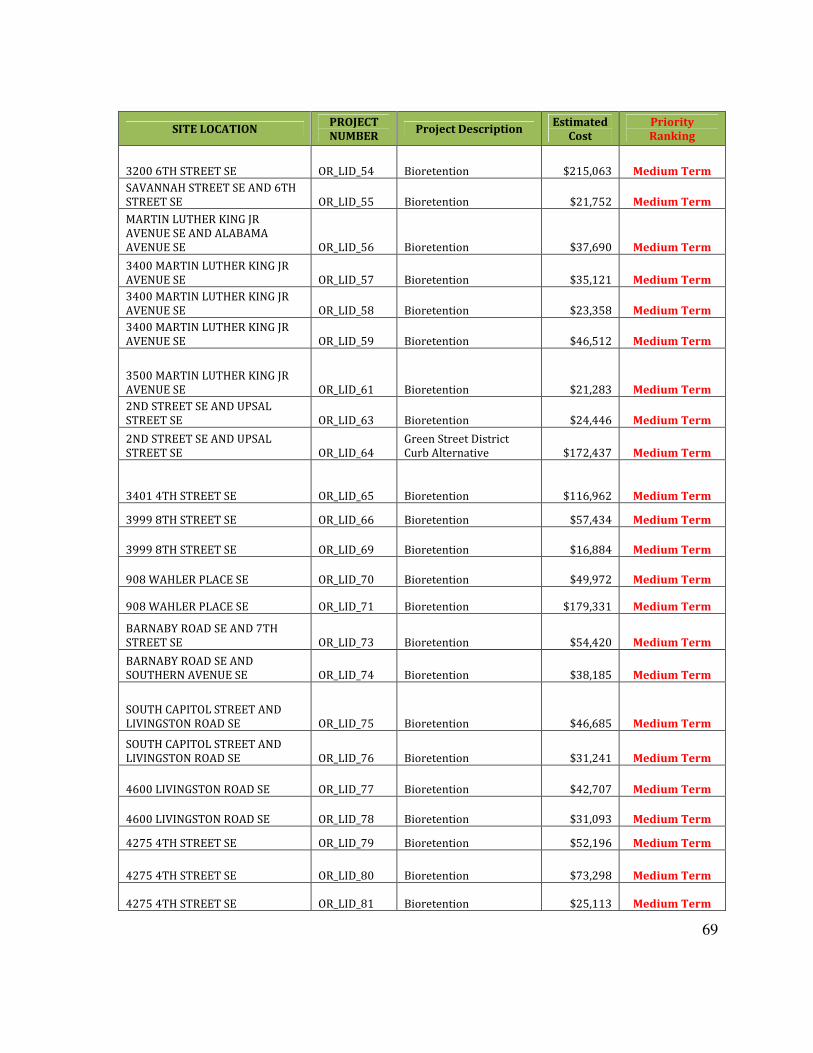
69
SITE LOCATION PROJECT
NUMBER Project Description
Estimated
Cost
Priority
Ranking
3200 6TH STREET SE OR_LID_54 Bioretention $215,063 Medium Term
SAVANNAH STREET SE AND 6TH STREET SE OR_LID_55 Bioretention $21,752 Medium Term
MARTIN LUTHER KING JR AVENUE SE AND ALABAMA AVENUE SE OR_LID_56 Bioretention $37,690 Medium Term
3400 MARTIN LUTHER KING JR AVENUE SE OR_LID_57 Bioretention $35,121 Medium Term
3400 MARTIN LUTHER KING JR AVENUE SE OR_LID_58 Bioretention $23,358 Medium Term
3400 MARTIN LUTHER KING JR AVENUE SE OR_LID_59 Bioretention $46,512 Medium Term
3500 MARTIN LUTHER KING JR AVENUE SE OR_LID_61 Bioretention $21,283 Medium Term
2ND STREET SE AND UPSAL STREET SE OR_LID_63 Bioretention $24,446 Medium Term
2ND STREET SE AND UPSAL STREET SE OR_LID_64
Green Street District Curb Alternative $172,437 Medium Term
3401 4TH STREET SE OR_LID_65 Bioretention $116,962 Medium Term
3999 8TH STREET SE OR_LID_66 Bioretention $57,434 Medium Term
3999 8TH STREET SE OR_LID_69 Bioretention $16,884 Medium Term
908 WAHLER PLACE SE OR_LID_70 Bioretention $49,972 Medium Term
908 WAHLER PLACE SE OR_LID_71 Bioretention $179,331 Medium Term
BARNABY ROAD SE AND 7TH STREET SE OR_LID_73 Bioretention $54,420 Medium Term
BARNABY ROAD SE AND SOUTHERN AVENUE SE OR_LID_74 Bioretention $38,185 Medium Term
SOUTH CAPITOL STREET AND LIVINGSTON ROAD SE OR_LID_75 Bioretention $46,685 Medium Term
SOUTH CAPITOL STREET AND LIVINGSTON ROAD SE OR_LID_76 Bioretention $31,241 Medium Term
4600 LIVINGSTON ROAD SE OR_LID_77 Bioretention $42,707 Medium Term
4600 LIVINGSTON ROAD SE OR_LID_78 Bioretention $31,093 Medium Term
4275 4TH STREET SE OR_LID_79 Bioretention $52,196 Medium Term
4275 4TH STREET SE OR_LID_80 Bioretention $73,298 Medium Term
4275 4TH STREET SE OR_LID_81 Bioretention $25,113 Medium Term
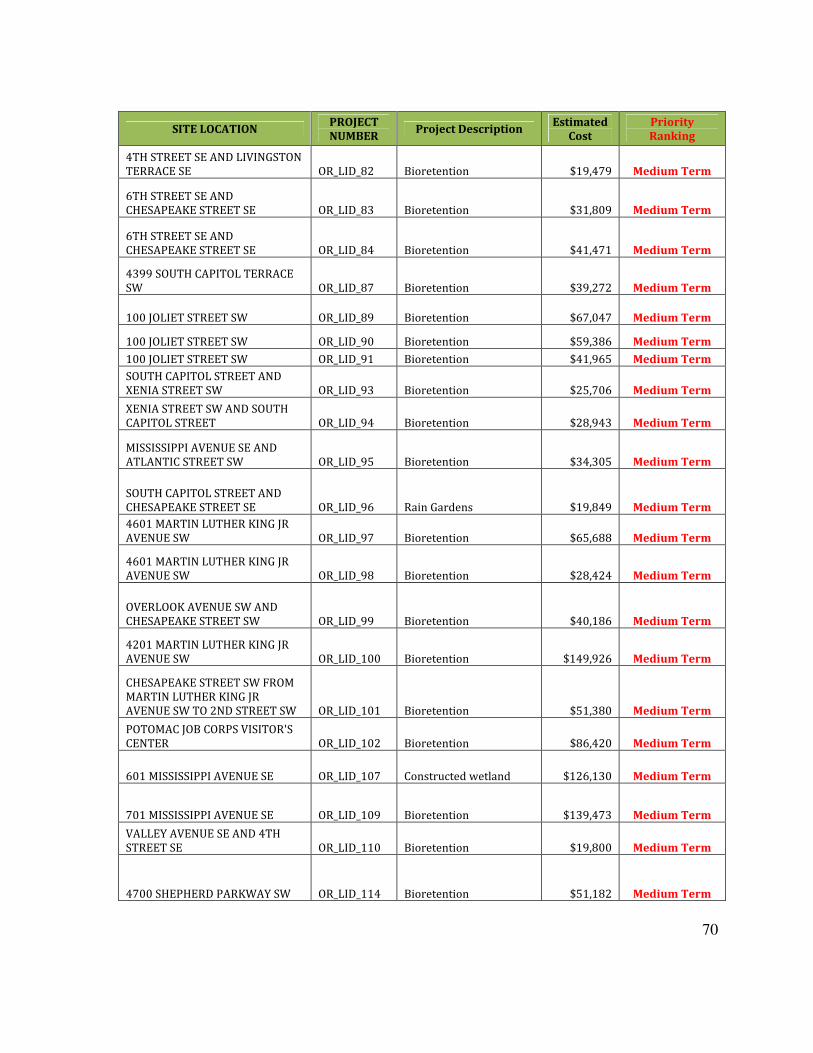
70
SITE LOCATION PROJECT
NUMBER Project Description
Estimated
Cost
Priority
Ranking
4TH STREET SE AND LIVINGSTON TERRACE SE OR_LID_82 Bioretention $19,479 Medium Term
6TH STREET SE AND CHESAPEAKE STREET SE OR_LID_83 Bioretention $31,809 Medium Term
6TH STREET SE AND CHESAPEAKE STREET SE OR_LID_84 Bioretention $41,471 Medium Term
4399 SOUTH CAPITOL TERRACE SW OR_LID_87 Bioretention $39,272 Medium Term
100 JOLIET STREET SW OR_LID_89 Bioretention $67,047 Medium Term
100 JOLIET STREET SW OR_LID_90 Bioretention $59,386 Medium Term
100 JOLIET STREET SW OR_LID_91 Bioretention $41,965 Medium Term
SOUTH CAPITOL STREET AND XENIA STREET SW OR_LID_93 Bioretention $25,706 Medium Term
XENIA STREET SW AND SOUTH CAPITOL STREET OR_LID_94 Bioretention $28,943 Medium Term
MISSISSIPPI AVENUE SE AND ATLANTIC STREET SW OR_LID_95 Bioretention $34,305 Medium Term
SOUTH CAPITOL STREET AND CHESAPEAKE STREET SE OR_LID_96 Rain Gardens $19,849 Medium Term
4601 MARTIN LUTHER KING JR AVENUE SW OR_LID_97 Bioretention $65,688 Medium Term
4601 MARTIN LUTHER KING JR AVENUE SW OR_LID_98 Bioretention $28,424 Medium Term
OVERLOOK AVENUE SW AND CHESAPEAKE STREET SW OR_LID_99 Bioretention $40,186 Medium Term
4201 MARTIN LUTHER KING JR AVENUE SW OR_LID_100 Bioretention $149,926 Medium Term
CHESAPEAKE STREET SW FROM MARTIN LUTHER KING JR AVENUE SW TO 2ND STREET SW OR_LID_101 Bioretention $51,380 Medium Term
POTOMAC JOB CORPS VISITOR'S CENTER OR_LID_102 Bioretention $86,420 Medium Term
601 MISSISSIPPI AVENUE SE OR_LID_107 Constructed wetland $126,130 Medium Term
701 MISSISSIPPI AVENUE SE OR_LID_109 Bioretention $139,473 Medium Term
VALLEY AVENUE SE AND 4TH STREET SE OR_LID_110 Bioretention $19,800 Medium Term
4700 SHEPHERD PARKWAY SW OR_LID_114 Bioretention $51,182 Medium Term

71
SITE LOCATION PROJECT
NUMBER Project Description
Estimated
Cost
Priority
Ranking
DC VILLAGE BUILDING 5 OR_LID_115 Rain Gardens & Bioretention $179,529 Medium Term
4700 SHEPHERD PARKWAY SW OR_LID_116 Bioretention $48,440 Medium Term
4700 SHEPHERD PARKWAY SW OR_LID_117 Bioretention $200,236 Medium Term
Mississippi Ave SE and 13th St SE OR_LID_137 Regenerative stormware Outfall $6,490,570 Medium Term
101 ATLANTIC STREET SE OR_LID_138 Stormwater Treatment Wetland $1,356,867 Medium Term
LIVINGSTON ROAD SE AND ATLANTIC STREET SE OR_LID_139
Stormwater Treatment Wetland $1,062,821 Medium Term
ATLANTIC STREET SE AND VALLEY AVENUE SE OR_LID_140
Stormwater Treatment Wetland $654,871 Medium Term
Yuma St SE and 1st St SE OR_LID_141 Stormwater Treatment Wetland $951,212 Medium Term
Mississippi Ave SE and 13th St SE OR_LID_142 Stormwater Treatment Wetland $2,559,504 Medium Term
3100 ERIE STREET SE OR_LID_145
Pavment Removal, Permeable Pavment & Biortention $71,982 Medium Term
1351 ALABAMA AVENUE SE OR_LID_149 Pavment Removal & Permeable Pavment $51,274 Medium Term
908 WAHLER PLACE SE OR_LID_150 Pavment Removal $44,948 Medium Term
908 WAHLER PLACE SE OR_LID_151 Pervious pavment $56,834 Medium Term
6TH STREET SE AND CHESAPEAKE STREET SE OR_LID_153 Pervious pavment $61,183 Medium Term
100 JOLIET STREET SW OR_LID_154 Pervious pavment $77,665 Medium Term
CHESAPEAKE STREET SW AND SOUTH CAPITOL STREET OR_LID_155 Pervious pavment $65,384 Medium Term
CHESAPEAKE STREET SW AND SOUTH CAPITOL STREET OR_LID_156 Pervious pavment $53,622 Medium Term
650 SAVANNAH STREET SE OR_LID_157 Pervious pavment $20,534 Medium Term
DC VILLAGE BUILDING 5 OR_LID_160 Pervious pavment $168,995 Medium Term
100 JOLIET STREET SW OR_LID_161 Regenerative stormware Conveyance $74,972 Medium Term
Stanton Road and Mississippi Ave. SE OR_LID_163
Regenerative stormware Conveyance $361,243 Medium Term

72
SITE LOCATION PROJECT
NUMBER Project Description
Estimated
Cost
Priority
Ranking
1901 Mississippi Ave SE OR_LID_164 Regenerative stormware Conveyance $64,593 Medium Term
Livingston and South Capitol St SE OR_LID_165 Regenerative stormware Conveyance $159,754 Medium Term
1st St SW and South Capitol St OR_LID_166 Regenerative stormware Conveyance $79,766 Medium Term
650 SAVANNAH STREET SE OR_LID_167 Regenerative stormware Conveyance $73,909 Medium Term
1380 SOUTHERN AVENUE SE OR_LID_43 Bioretention $25,434 Long Term
4339 BOWEN ROAD SE OR_LID_1 Rain Gardens & Bioretention $15,105 Long Term
4323 BOWEN ROAD SE OR_LID_2 Bioretention $12,510 Long Term
1400 41ST STREET SE OR_LID_7 Pine Fine Trench $40,087 Long Term
42ND PLACE SE AND FORT DUPONT STREET SE OR_LID_8
Curb bump-outs bioretention $24,767 Long Term
PENNSYLVANIA AVENUE SE AND ALABAMA AVENUE SE OR_LID_9
Lined biorentention to address hydrocarbon content in runoff. $23,383 Long Term
3859 PENNSYLVANIA AVENUE SE OR_LID_11 Bioretention $23,877 Long Term
38TH STREET SE AND SUITLAND ROAD SE OR_LID_12
Curb bump-outs bioretention $28,869 Long Term
HIGHVIEW TERRACE SE AND DENVER STREET SE OR_LID_13 Bioretention $25,088 Long Term
HIGHVIEW TERRACE SE AND 34TH STREET SE OR_LID_14
Green Street District Curb Alternative $24,297 Long Term
BANGOR STREET SE AND 32ND STREET SE OR_LID_16 Bioretention $15,154 Long Term
30TH STREET SE AND ALABAMA AVENUE SE OR_LID_19 Bioretention $13,054 Long Term
3100 DENVER STREET SE OR_LID_21 Bioretention $13,104 Long Term
30TH STREET SE AND HARTFORD STREET SE OR_LID_24 Bioretention $10,287 Long Term
KNOX CIRCLE SE AND KNOX TERRACE SE OR_LID_27 Bioretention $22,395 Long Term
2435 ALABAMA AVENUE SE OR_LID_28 Bioretention $192,329 Long Term
2435 ALABAMA AVENUE SE OR_LID_29 Bioretention $44,066 Long Term
HARTFORD STREET SE AND ALABAMA AVENUE SE OR_LID_30 Bioretention $28,770 Long Term

73
SITE LOCATION PROJECT
NUMBER Project Description
Estimated
Cost
Priority
Ranking
24TH STREET SE FROM SAVANNAH STREET SE TO SOUTHERN AVENUE SE OR_LID_37
Green Street District Curb Alternative $155,263 Long Term
14TH PLACE SE AND SAVANNAH PLACE SE OR_LID_52
Curb bump-outs bioretention $30,129 Long Term
STANTON TERRACE SE FROM TUBMAN ROAD SE TO ALABAMA AVENUE SE OR_LID_53 Bioretention $30,178 Long Term
3500 MARTIN LUTHER KING JR AVENUE SE OR_LID_60 Bioretention $11,967 Long Term
SAVANNAH STREET SE AND 2ND STREET SE OR_LID_62 Bioretention $24,421 Long Term
3999 8TH STREET SE OR_LID_67 Bioretention $15,377 Long Term
3999 8TH STREET SE OR_LID_68 Bioretention $17,551 Long Term
9TH STREET SE AND WAHLER PLACE SE OR_LID_72 Bioretention $44,931 Long Term
6TH STREET SE AND CHESAPEAKE STREET SE OR_LID_85 Bioretention $26,225 Long Term
4399 SOUTH CAPITOL TERRACE SW OR_LID_86 Rain Gardens $37,172 Long Term
4399 SOUTH CAPITOL TERRACE SW OR_LID_88 Bioretention $19,899 Long Term
1ST STREET SW AND JOLIET STREET SW OR_LID_92 Bioretention $12,708 Long Term
601 MISSISSIPPI AVENUE SE OR_LID_108 Bioretention $31,711 Long Term
YUMA STREET SE AND 1ST STREET SE OR_LID_113 Pervious Pavment $43,374 Long Term
2435 ALABAMA AVENUE SE OR_LID_146 Pavment Removal $20,806 Long Term
ALABAMA AVENUE SE AND HARTFORD STREET SE OR_LID_147 Permeable Pavement $21,498 Long Term
ALABAMA AVENUE SE AND 18TH STREET SE OR_LID_148 Permeable Pavement $18,113 Long Term
CHESAPEAKE STREET SE AND 6TH STREET SE OR_LID_152 Pavement Removal $18,311 Long Term

74
5.4. Indicators for Tracking Progress
The projects detailed above amount to small percentage of the total treatment needed to
remove Oxon Run from the 303d list of impaired water bodies. These projects were reflect the
management practices as the recommended scenario (Scenario 2, found in Table 21) for
rehabilitating Oxon Run; the remaining treatment areas were divided over Near, Medium, and
Far term project phases. A breakdown of area planned to be treated in each phase can be
found in Table 30. The reductions in metal and organic constituents that will be achieved in
the Near, Medium, and Far term project phases can be found in Tables 30-33. Bacteria
reductions for each phase can be found in Table 34. . To track progress effectively, the
monitoring program will use these expected reductions as benchmarks for the adaptive
monitoring plan.
Table 30: Percentage of Watershed Treated Per Project Phase
Near Medium Far Cumulative
BMP Acres
% of Watershe
d Acres
% of Watershe
d Acres % of
Watershed Total Acres % of
Watershed
Tree Boxes 46.94 2% 187.76 8% 422.46 18% 704.10 30%
Porous pavement 46.94 2% 187.76 8% 234.7 10% 469.40 20%
Bioretention 46.94 2% 234.7 10% 422.46 18% 704.10 30%
Vacuum Sweeping 46.94 2% 70.41 3% 117.35 5% 234.70 10% Constructed Wetland 0 0% 234.7 10% 234.70 10% 469.40 20%
* Project phases indicate the implementation of Scenario 2- treating 30% of watershed with bioretention, 20% with
porous pavement, %20 in wetlands, 30% in tree boxes and 10% by vacuum sweeping.
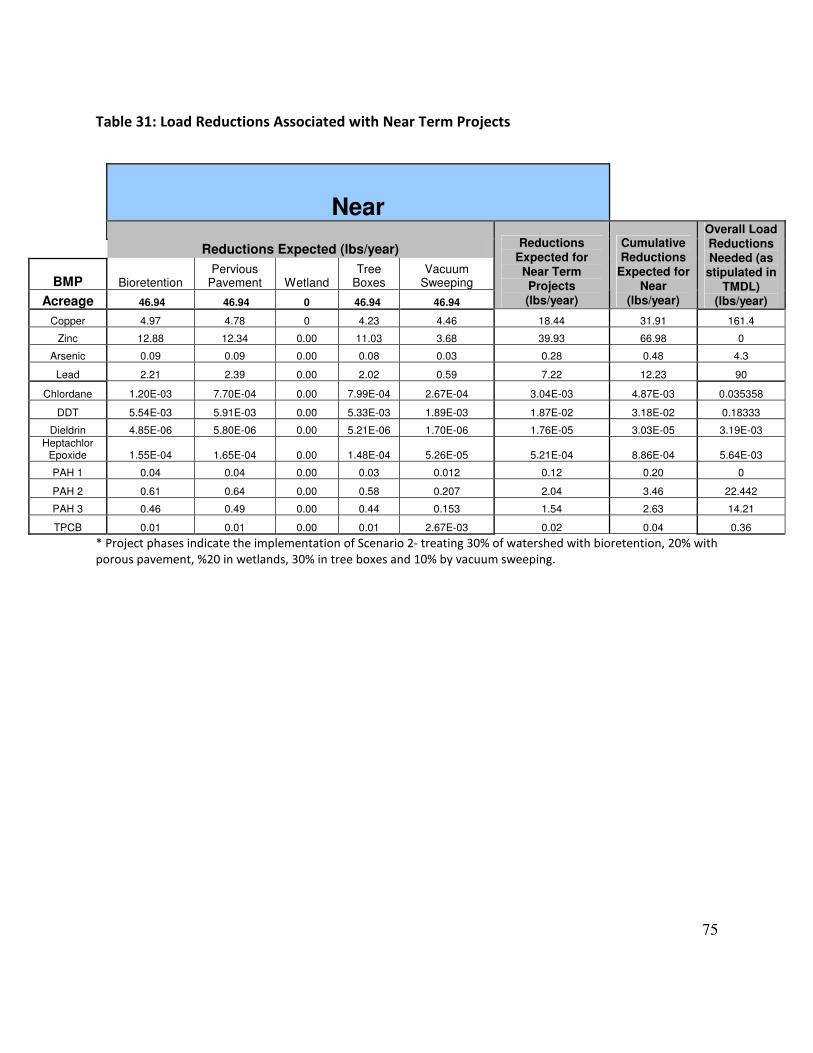
75
Table 31: Load Reductions Associated with Near Term Projects
* Project phases indicate the implementation of Scenario 2- treating 30% of watershed with bioretention, 20% with
porous pavement, %20 in wetlands, 30% in tree boxes and 10% by vacuum sweeping.
Near
Reductions Expected (lbs/year)
BMP Bioretention Pervious
Pavement Wetland Tree
Boxes Vacuum
Sweeping
Acreage 46.94 46.94 0 46.94 46.94
Reductions Expected for
Near Term
Projects (lbs/year)
Cumulative Reductions
Expected for
Near (lbs/year)
Overall Load Reductions Needed (as
stipulated in TMDL)
(lbs/year)
Copper 4.97 4.78 0 4.23 4.46 18.44 31.91 161.4
Zinc 12.88 12.34 0.00 11.03 3.68 39.93 66.98 0
Arsenic 0.09 0.09 0.00 0.08 0.03 0.28 0.48 4.3
Lead 2.21 2.39 0.00 2.02 0.59 7.22 12.23 90
Chlordane 1.20E-03 7.70E-04 0.00 7.99E-04 2.67E-04 3.04E-03 4.87E-03 0.035358
DDT 5.54E-03 5.91E-03 0.00 5.33E-03 1.89E-03 1.87E-02 3.18E-02 0.18333
Dieldrin 4.85E-06 5.80E-06 0.00 5.21E-06 1.70E-06 1.76E-05 3.03E-05 3.19E-03
Heptachlor Epoxide 1.55E-04 1.65E-04 0.00 1.48E-04 5.26E-05 5.21E-04 8.86E-04 5.64E-03
PAH 1 0.04 0.04 0.00 0.03 0.012 0.12 0.20 0
PAH 2 0.61 0.64 0.00 0.58 0.207 2.04 3.46 22.442
PAH 3 0.46 0.49 0.00 0.44 0.153 1.54 2.63 14.21
TPCB 0.01 0.01 0.00 0.01 2.67E-03 0.02 0.04 0.36

76
Table 32: Load Reductions Associated with Medium Term Projects
* Project phases indicate the implementation of Scenario 2- treating 30% of watershed with bioretention, 20% with
porous pavement, %20 in wetlands, 30% in tree boxes and 10% by vacuum sweeping.
Medium
Reductions Expected (lbs/year)
BMP Bioretention Pervious
Pavement Wetland Tree
Boxes Vacuum
Sweeping
Acreage 234.7 187.8 234.7 187.8 70.41
Reductions Expected for Medium Term
Projects
(lbs/year)
Cumulative Reductions Expected
for Medium
(lbs/year)
Overall Load Reductions Needed (as
stipulated in TMDL)
(lbs/year)
Copper 24.83 19.12 17.50 21.17 6.69 89.31 107.75 161.4
Zinc 64.40 49.32 28.50 55.20 16.56 213.98 253.91 0
Arsenic 0.43 0.36 0.35 0.40 0.12 1.66 1.95 4.3
Lead 11.03 9.56 9.20 10.13 2.67 42.60 49.81 90
Chlordane 6.00E-03 3.08E-03 8.50E-03 4.00E-03 1.20E-03 0.02 0.03 0.035358
DDT 2.77E-02 2.36E-02 2.00E-02 2.67E-02 8.49E-03 0.11 0.13 0.18333
Dieldrin 0.00 0.00 0.00 0.00 7.65E-06 1.02E-04 1.19E-04 3.19E-03
Heptachlor Epoxide 0.00 0.00 0.00 0.00 2.37E-04 3.01E-03 3.53E-03 5.64E-03
PAH 1 0.18 0.15 0.14 0.17 0.05 0.69 0.81 0
PAH 2 3.05 2.57 2.34 2.89 0.93 11.77 13.81 22.442
PAH 3 2.31 1.95 1.78 2.20 0.69 8.93 10.48 14.21
TPCB 0.03 0.03 0.27 0.03 0.01 0.38 0.40 0.36

77
Table 243: Load Reductions Associated with Far Term Projects and Cumulative Reductions
* Project phases indicate the implementation of Scenario 2- treating 30% of watershed with bioretention, 20% with
porous pavement, %20 in wetlands, 30% in tree boxes and 10% by vacuum sweeping.
Far
Reductions Expected (lbs/year)
BMP Bioretention Pervious
Pavement Wetland Tree
Boxes Vacuum
Sweeping
Acreage 433.26 234.7 234.7 422.46 117.85
Reductions Expected for
Far Term Projects
(lbs/year)
Cumulative Reductions Expected at
Far
(lbs/year)
Overall Load Reductions Needed (as
stipulated in TMDL)
(lbs/year)
Copper 44.70 23.90 17.50 38.10 11.16 135.36 243.11 161.4
Zinc 115.92 61.65 28.50 99.36 27.64 333.07 586.97 0
Arsenic 0.78 0.45 0.35 0.72 0.20 2.50 4.45 4.3
Lead 19.86 11.95 9.20 18.24 4.46 63.71 113.52 90
Chlordane 1.08E-02 3.85E-03 8.50E-03 7.20E-03 2.00E-03 0.03 0.06 0.035358
DDT 4.99E-02 2.96E-02 2.00E-02 4.80E-02 1.42E-02 0.16 0.29 0.18333
Dieldrin 4.37E-05 2.90E-05 2.04E-05 4.69E-05 1.28E-05 1.53E-04 2.72E-04 3.19E-03
Heptachlor Epoxide 1.40E-03 8.25E-04 5.95E-04 1.33E-03 3.95E-04 4.55E-03 8.07E-03 5.64E-03
PAH 1 0.32 0.19 0.14 0.31 0.09 1.04 1.86 0
PAH 2 5.49 3.22 2.34 5.20 1.55 17.79 31.60 22.442
PAH 3 4.164 2.44 1.78 3.97 1.15 13.50 23.97 14.21
TPCB 0.06 0.035 0.27 0.06 0.02 0.45 0.84 0.36
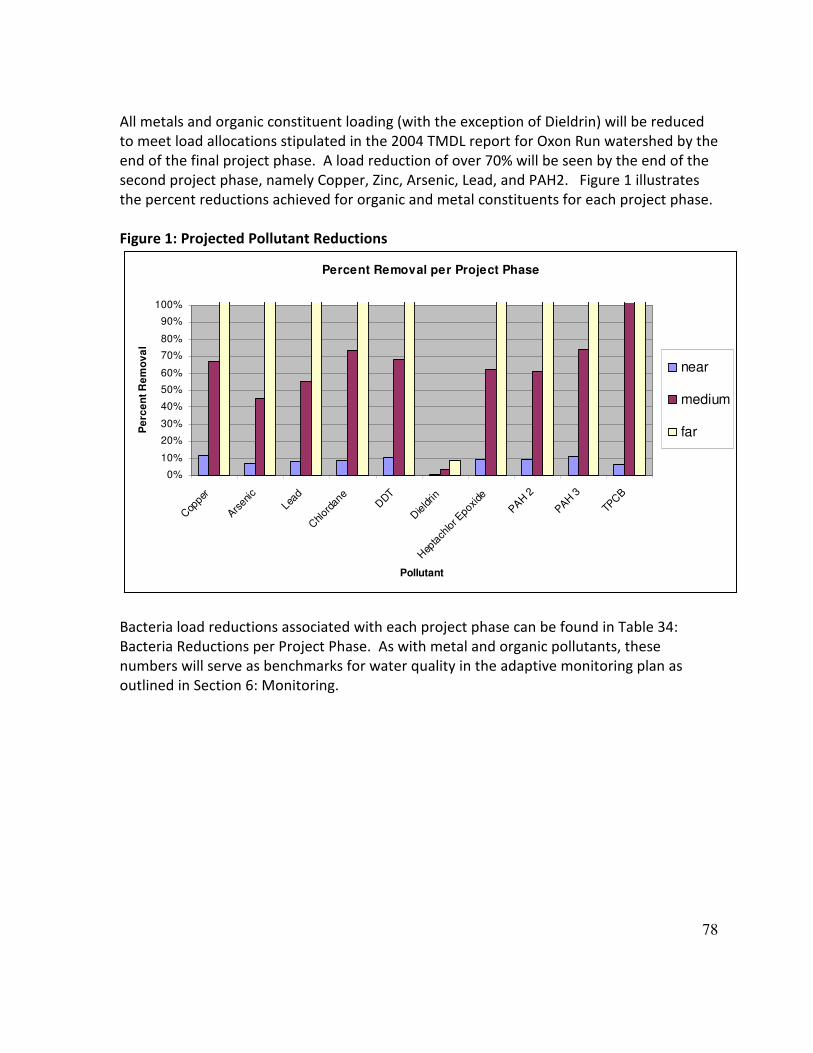
78
All metals and organic constituent loading (with the exception of Dieldrin) will be reduced
to meet load allocations stipulated in the 2004 TMDL report for Oxon Run watershed by the
end of the final project phase. A load reduction of over 70% will be seen by the end of the
second project phase, namely Copper, Zinc, Arsenic, Lead, and PAH2. Figure 1 illustrates
the percent reductions achieved for organic and metal constituents for each project phase.
Figure 1: Projected Pollutant Reductions
Percent Removal per Project Phase
0%
10%
20%
30%
40%
50%
60%
70%
80%
90%
100%
Cop
per
Arsen
ic
Lead
Chlor
dane
DDT
Dieldrin
Hep
tach
lor E
poxide
PAH 2
PAH 3
TPCB
Pollutant
Pe
rce
nt
Re
mo
va
l
near
medium
far
Bacteria load reductions associated with each project phase can be found in Table 34:
Bacteria Reductions per Project Phase. As with metal and organic pollutants, these
numbers will serve as benchmarks for water quality in the adaptive monitoring plan as
outlined in Section 6: Monitoring.
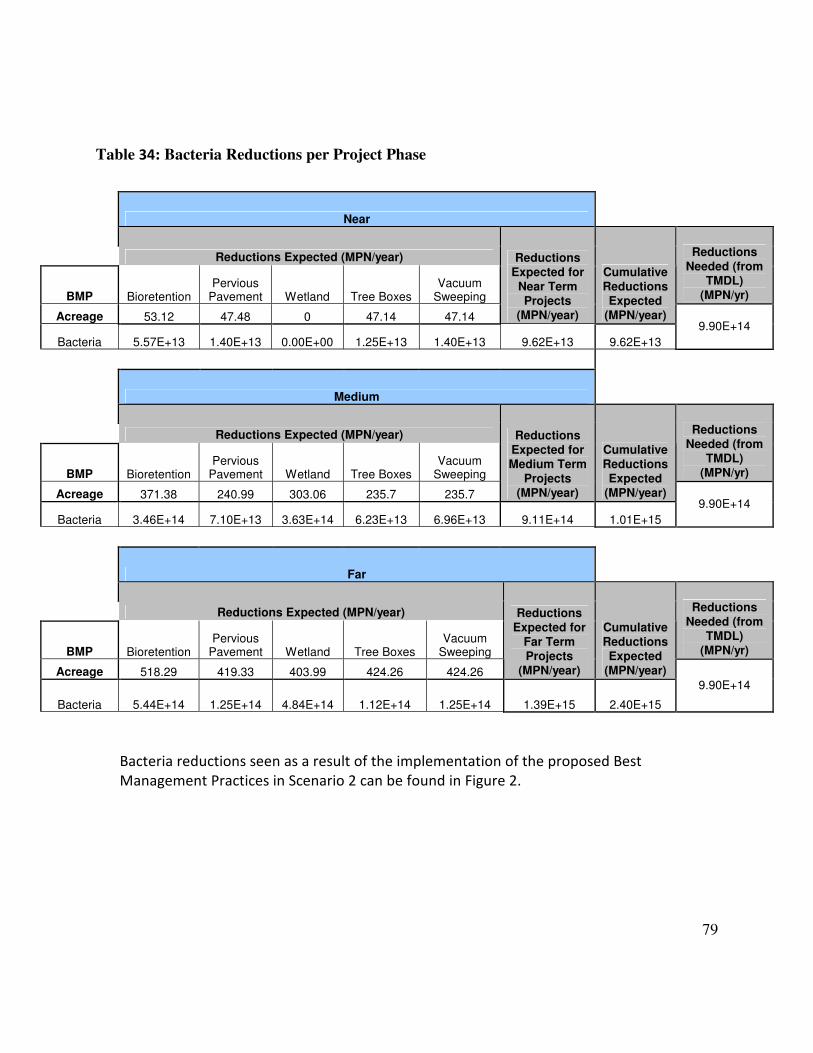
79
Table 34: Bacteria Reductions per Project Phase
Bacteria reductions seen as a result of the implementation of the proposed Best
Management Practices in Scenario 2 can be found in Figure 2.
Near
Reductions Expected (MPN/year)
BMP Bioretention Pervious
Pavement Wetland Tree Boxes Vacuum
Sweeping
Reductions
Needed (from TMDL)
(MPN/yr)
Acreage 53.12 47.48 0 47.14 47.14
Reductions
Expected for Near Term Projects
(MPN/year)
Cumulative Reductions Expected
(MPN/year)
Bacteria 5.57E+13 1.40E+13 0.00E+00 1.25E+13 1.40E+13 9.62E+13 9.62E+13
9.90E+14
Medium
Reductions Expected (MPN/year)
BMP Bioretention Pervious
Pavement Wetland Tree Boxes Vacuum
Sweeping
Reductions Needed (from
TMDL) (MPN/yr)
Acreage 371.38 240.99 303.06 235.7 235.7
Reductions Expected for
Medium Term Projects
(MPN/year)
Cumulative
Reductions Expected
(MPN/year)
Bacteria 3.46E+14 7.10E+13 3.63E+14 6.23E+13 6.96E+13 9.11E+14 1.01E+15
9.90E+14
Far
Reductions Expected (MPN/year)
BMP Bioretention Pervious
Pavement Wetland Tree Boxes Vacuum
Sweeping
Reductions Needed (from
TMDL) (MPN/yr)
Acreage 518.29 419.33 403.99 424.26 424.26
Reductions Expected for
Far Term Projects
(MPN/year)
Cumulative
Reductions Expected
(MPN/year)
Bacteria 5.44E+14 1.25E+14 4.84E+14 1.12E+14 1.25E+14 1.39E+15 2.40E+15
9.90E+14
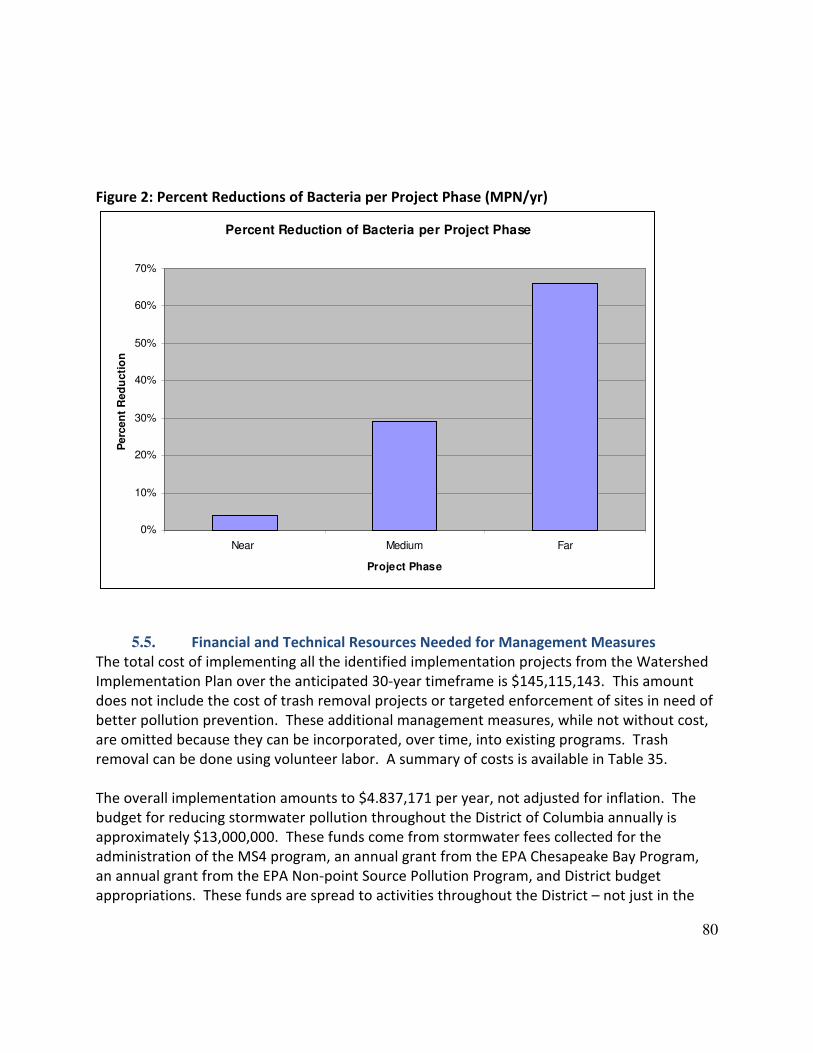
80
Figure 2: Percent Reductions of Bacteria per Project Phase (MPN/yr)
Percent Reduction of Bacteria per Project Phase
0%
10%
20%
30%
40%
50%
60%
70%
Near Medium Far
Project Phase
Perc
en
t R
ed
ucti
on
5.5. Financial and Technical Resources Needed for Management Measures
The total cost of implementing all the identified implementation projects from the Watershed
Implementation Plan over the anticipated 30-year timeframe is $145,115,143. This amount
does not include the cost of trash removal projects or targeted enforcement of sites in need of
better pollution prevention. These additional management measures, while not without cost,
are omitted because they can be incorporated, over time, into existing programs. Trash
removal can be done using volunteer labor. A summary of costs is available in Table 35.
The overall implementation amounts to $4.837,171 per year, not adjusted for inflation. The
budget for reducing stormwater pollution throughout the District of Columbia annually is
approximately $13,000,000. These funds come from stormwater fees collected for the
administration of the MS4 program, an annual grant from the EPA Chesapeake Bay Program,
an annual grant from the EPA Non-point Source Pollution Program, and District budget
appropriations. These funds are spread to activities throughout the District – not just in the

81
Oxon Run watershed. When allocated by percent land area in Oxon Run, the annual amount is
equivalent to approximately $1,066,000.
Table 35: Cost of Implementing Identified Restoration Projects and Projects Suggested in
Scenario 2.
Indentified Project Type Cost of Implementation
Green Roof Projects $18,223,118
Permeable Pavement $4,442,826
All Other Low Impact Development Projects $21,043,671
Regenerative Stormwater Conveyance $285,640
Stream Restoration $10,000,000
Riparian Reforestation $243,298
General Reforestation $1,579,500
Total Cost $55,818,053.00
Project Type Suggested in Scenario 2 Cost of Implementation
Bioretention $13,908,040
Pervious Pavement $50,238,100
Constructed Wetland $7,970,910
Tree Boxes $17,180,040
Vacuum Sweeping $656,221/year
Total Cost $89,297,090.40
Cost of Identified Projects and Projects
Suggested in Scenario 2 $145,115,143
In reality, however, the District allocates a greater percent of funds to the Anacostia because
its pollution impairments are much worse than other District tributaries and not all funds are
used for implementation. Some of the funds are used for salaries and program administration.
These factors combine to make the actual amount of funds being allocated toward Oxon Run
watershed far below the levels needed to complete these projects.
In order to restore Oxon Run, even over a 30 year time frame, additional funds will be needed.
Some potential sources of additional funds have been identified. These include:
o Increasing the stormwater fee that District residents pay for the administration of the
MS4 permit;

82
o Allocating funds from the recently implemented fee on shopping bags; and
o Being more efficient with existing funds through better coordination with other District
agencies to ensure stormwater mitigation components are included in new
development, redevelopment and infrastructure projects.
Despite any additional funds that the District is able to dedicate to the restoration of Oxon
Run, there will still be a need for additional support from the federal government. The District
of Columbia is unique in that 1/3 of its lands are held by the federal government. This
effectively reduces city revenues because the federal government does not pay taxes and
occupies valuable lands that could generate revenue for the city. The federal government
provides annual appropriation to the District, but it is difficult to budget for these funds
because appropriation is not automatic.
In addition to further funding, as a local government, we are in need of additional technical
resources. Although we have a strong and knowledgeable staff, we are still a small staff that is
required to fulfill the obligations of both a state and local agency. DDOE and EPA Region III
have recently signed a Performance Partnership Agreement and was developed under the
auspices of the National Environmental Performance Partnership System. The vision of this
agreement includes the goals of “improve[ing] the quality of life in the District of Columbia
through the protection and enhancement of human health and the environment… and
[topromote greening of neighborhoods.” Under the auspices of this agreement, or through
some other means, EPA and DDOE should coordinate monitoring activities that will
comprehensively evaluate water quality impairments in Oxon Run. Similarly, EPA can assist in
the multijurisdictional coordination that is needed to address water quality issues in the Oxon
Run watershed in both Prince Georges County and the District.
A final, and important, area where the District requires technical assistance is working with
federal landholders, i.e. National Park Service. A number of the proposed projects, most
notably stream restoration, are located on federal lands. To date the Federal agencies have
been reticent to allow the District access to their lands to treat stormwater pollution or do
stream restoration. The District could use the weight of a federal agency supporting our
efforts and negotiating on our behalf with the major federal landholders – the military services,
the Government Services Administration, and the Architect of the Capitol would all be
included. The most notable agency, however, as already mentioned, is the National Park
Service, since any stream restoration work done on Oxon Run would impact, and ultimately
benefit, the National Park Service.
6. MONITORING
On a biannual basis DDOE Water Quality Division, an office within the Office of Natural
Resources, prepares the Integrated Report to the Environmental Protection Agency. This
83
report, which was last prepared in 2008, satisfies the listing requirements of §303(d) and the
reporting requirements of §305(b) of the federal Clean Water Act (P.L. 97-117). This report
provides water quality information on the District of Columbia’s surface and ground waters
that were assessed during 2008 and updates the water quality information as required by law.
Monitoring data for this report came from two assessments. Monitoring took place in the
downstream reach closest to the Maryland border. The purpose of monitoring at the
downstream reach was to ensure that a cumulative effect of all pollution sources would be
registered.
The Water Quality Division uses the D.C. Surface Water Quality Standards for evaluating
surface waters. The percentage of time a selected standard is out of compliance at a
monitoring station or group of monitoring stations over a selected span of time determines
whether a water body supports a particular use. As already mentioned, Oxon Run is
designated for class A – D uses. (DC Integrated Report, 2008) The District determines overall
use support for water bodies with multiple uses according to EPA guidance. A water body fully
supports its designated uses when all its uses are fully supported. When one or more uses are
not supported, then the water body is not supporting. (DC Water Quality and Assessment
Strategy, 2004) In summary the Oxon Run findings in the 2008 Integrated Report are as follows:
While not providing a specific score, the report notes that there is a low Hilsenhoff
Biotic Index score. The report, again without noting actual numbers, suggests that
there is a high percentage of EPT. The dominant taxa were Coenagrinidae.
Collected macroinvertebrates were assed as tolerant species. The D.O. (0.0%-
Violation), pH (5.0%-violation) and temperature (0.0%) fully supported the aquatic
life use. Based on surface fecal coliform samples Oxon Run was not in compliance
for its swimmable use and was not in compliance for its secondary contact use at
81.2% of the time. Oxon Run did not support the consumption of fish due to an
EPA fish advisory on the Potomac River.
In short, Oxon Run did not meet its designated uses for the monitoring period (see the table
below for designated use indicators). The assumption, however, that Oxon Run is impaired for
toxics is not substantiated by enough data to make any clear assertions on the type of or
concentrations of toxic compounds, if any. Degraded habitat, low dissolved oxygen and/or
thermal massing from the concrete lined channel may preclude the presence of all but the
most tolerant species and explain low macroinvertebrate counts on the downstream end of
Oxon Run. As mentioned is section 1.3 better monitoring data is necessary to ascertain the
types, concentrations, and sources of listed pollutants of concern.
The other source of water quality data for Oxon Run is stormwater outfall monitoring done for
the MS4 Discharge Monitoring Report. In an attempt to get a representative sample of
stormwater discharge to Oxon Run three wet samples and one dry sample are taken once
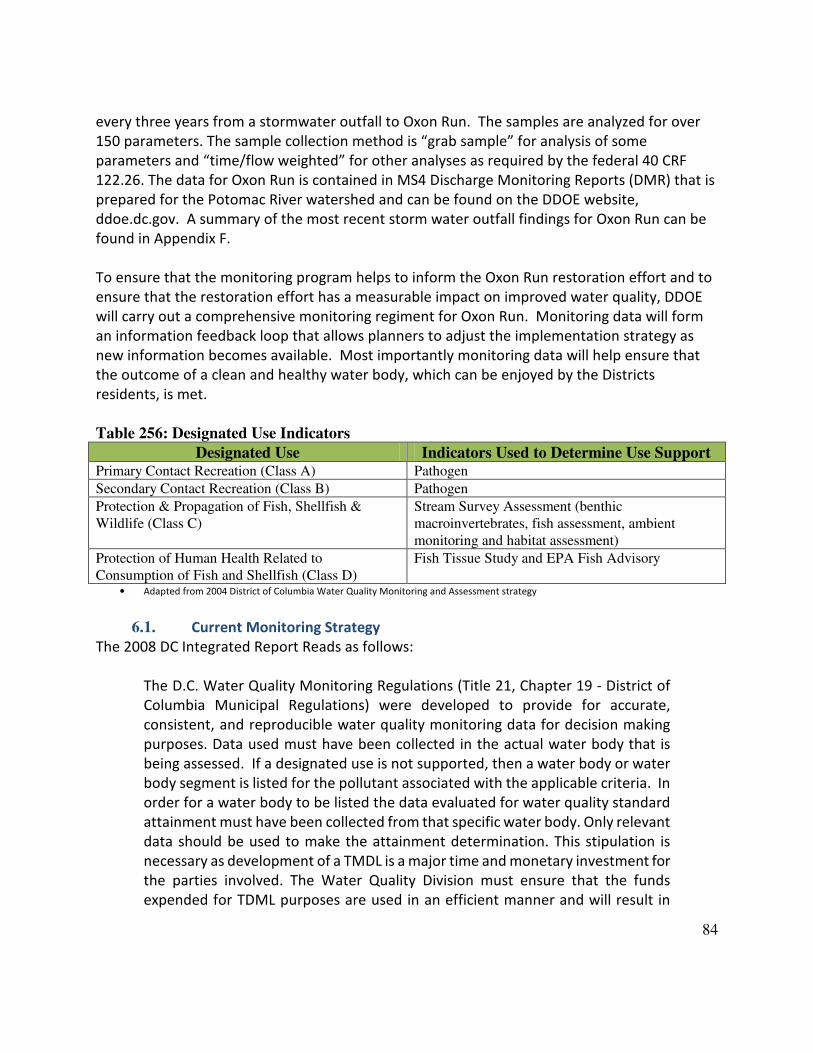
84
every three years from a stormwater outfall to Oxon Run. The samples are analyzed for over
150 parameters. The sample collection method is “grab sample” for analysis of some
parameters and “time/flow weighted” for other analyses as required by the federal 40 CRF
122.26. The data for Oxon Run is contained in MS4 Discharge Monitoring Reports (DMR) that is
prepared for the Potomac River watershed and can be found on the DDOE website,
ddoe.dc.gov. A summary of the most recent storm water outfall findings for Oxon Run can be
found in Appendix F.
To ensure that the monitoring program helps to inform the Oxon Run restoration effort and to
ensure that the restoration effort has a measurable impact on improved water quality, DDOE
will carry out a comprehensive monitoring regiment for Oxon Run. Monitoring data will form
an information feedback loop that allows planners to adjust the implementation strategy as
new information becomes available. Most importantly monitoring data will help ensure that
the outcome of a clean and healthy water body, which can be enjoyed by the Districts
residents, is met.
Table 256: Designated Use Indicators
Designated Use Indicators Used to Determine Use Support Primary Contact Recreation (Class A) Pathogen
Secondary Contact Recreation (Class B) Pathogen
Protection & Propagation of Fish, Shellfish &
Wildlife (Class C)
Stream Survey Assessment (benthic
macroinvertebrates, fish assessment, ambient
monitoring and habitat assessment)
Protection of Human Health Related to
Consumption of Fish and Shellfish (Class D)
Fish Tissue Study and EPA Fish Advisory
• Adapted from 2004 District of Columbia Water Quality Monitoring and Assessment strategy
6.1. Current Monitoring Strategy
The 2008 DC Integrated Report Reads as follows:
The D.C. Water Quality Monitoring Regulations (Title 21, Chapter 19 - District of
Columbia Municipal Regulations) were developed to provide for accurate,
consistent, and reproducible water quality monitoring data for decision making
purposes. Data used must have been collected in the actual water body that is
being assessed. If a designated use is not supported, then a water body or water
body segment is listed for the pollutant associated with the applicable criteria. In
order for a water body to be listed the data evaluated for water quality standard
attainment must have been collected from that specific water body. Only relevant
data should be used to make the attainment determination. This stipulation is
necessary as development of a TMDL is a major time and monetary investment for
the parties involved. The Water Quality Division must ensure that the funds
expended for TDML purposes are used in an efficient manner and will result in

85
maximum water quality benefits. For example, the Anacostia River cannot be listed
for copper if there is no copper data available from water samples collected in a
segment of the Anacostia River to indicate that impairment. MS4 data from an
outfall to a tributary of the Anacostia River cannot be used to list a segment of the
Anacostia River.
In other words DDOE is committed to gathering comprehensive and relevant water quality data
for Oxon Run. The monitoring strategy will build upon ongoing monitoring in Oxon Run. The
goal for the monitoring strategy is to asses Oxon Run water quality under a variety of
conditions including wet and dry weather and to also examine point source discharges that
contribute to water quality impairment, namely the MS4 system. A summary of ongoing
monitoring is found in Table 37. A fairly comprehensive monitoring strategy has already been
implemented, however, as mentioned elsewhere in this report, there are gaps in the available
data for Oxon Run that will need be addressed.
DDOE Water Quality Division sets an annual schedule of monitoring activities that are outlined
in the Table below. Dates for water quality are set in advance and in-stream water quality
monitoring takes place in all weather conditions. Moreover, quarterly water quality
monitoring ensures that samples are representative of the various seasons. DDOE also collects
wet weather water quality samples at outfalls in compliance with the Districts MS4 permit.
The data from this monitoring is reported to the EPA in the biennial Discharge Monitoring
Report to the EPA and is posted on the DDOE website. Finally, DDOE monitors for biological
activity in Oxon Run. When streams with both conventional pollutant data and biological data
are evaluated, the biological data are the overriding factor in aquatic life use decisions.
Tributary assessments are based on the Maryland 2001 Biological Stream Survey (MBSS) for
benthic macroinvertebrates which are used as a reference. Aquatic life use support is based on
the relationship between observed stream biological conditions as compared to the reference
stream condition producing a percent of reference stream biological condition. This scale rates
“impaired” at 0-79%, and “non-impaired at 80-100%” of reference condition. U.S. EPA 305(b)
guidelines on criteria for aquatic life use support classification recommend designation of “not
supporting” if impairment exists, and “fully supporting” if no impairment exists. Coastal Plain
tributaries are assessed using reference condition data from Montgomery and Prince George’s
Counties, Maryland. DDOE uses the most up-to-date assessment techniques when conducting
bio-assessments for Oxon Run.
Table 37: Summary of Current Monitoring Activities
Parameters Monitored Frequency Type of Sample Bacteria (E. Coli) Quarterly Grab Sample
Temperature, Salinity, Dissolved Oxygen %,
Dissolved Oxygen Concentration, pH,
Turbidity, Chlorophyll, and Hardness
Quarterly In Situ

86
Parameters Monitored Frequency Type of Sample Dissolved Metals (Zinc, Lead, Copper,
Aresenic)
Quarterly Grab Sample
Outfall Monitoring (150 Parameters See
Appendix F)
Three Wet Weather
Events And One
Dry Weather -
Biennial
Time/Flow Weighted & Grab
Samples
Benthic Macroinvertebrates Annually District of Columbia Stream
Survey (adapted from Maryland
Biological Stream Survey)
Habitat Assessment Annually District of Columbia Stream
Survey (evaluate in-stream habitat,
channel morphology, and structural
features of bank and riparian
vegetation)
Fish Assessment Annually Index of Biotic Integrity
Current monitoring practices, however, are not sufficient for monitoring all the water quality
indicators and benchmarks as described in section 5.4 above. DDOE has not focused
monitoring efforts on TMDL end points per se. Monitoring protocols, as currently conceived,
are focused on making use determination based on the water bodies designated uses and on
complying with the Districts MS4 permit from EPA Region III. On the other hand, the data
currently collected by DDOE is a valuable source of information that establishes a baseline of
for most pollutants in Oxon Run and can help determine the presence and concentration of
those pollutants. Some enhancements are needed to gain a better picture for the sources of
impairment and to accurately measure progress toward delisting Oxon Run.
6.2. Enhanced Monitoring Strategy
To ensure that the monitoring program helps to inform the Oxon Run restoration effort and to
ensure that the restoration effort has a measurable impact on improved water quality, DDOE
will develop an enhanced monitoring regiment for Oxon Run. By leveraging existing data and
monitoring efforts the enhanced monitoring program will measure progress toward near,
medium, and long term benchmarks as outlined in section 5.4. Monitoring data will form an
information feedback loop that allows planners to adjust the implementation strategy as new
information becomes available. Most importantly, monitoring data will help ensure that the
outcome of a clean and healthy water body, which can be enjoyed by the Districts residents, is
met.
The enhanced monitoring strategy will have the following key components:
o Monitor for organic pollutants;
o Monitor at multiple locations; and,
o Gather both dry and wet weather samples.
87
These additions to current monitoring activities will give a comprehensive picture of existing
conditions and establish a baseline from which progress toward TMDL endpoints can be
measured. Establishing a monitoring station at an upstream reach near the District and Prince
Georges County border, in addition to the downstream location, will allow planners to more
accurately depict pollutant loads coming from upstream sources outside the District’s borders.
Wet weather samples, in addition to outfall monitoring, and dry weather samples, will further
enhance DDOE’s understanding of the water quality impairment contributed via stormwater.
The most glaring gap in the current suite of water quality information available for Oxon Run is
the lack of direct sampling for organic pollutants. To close this gap DDOE proposes a dual
strategy of intensive biological monitoring and continuous in situ water quality monitoring.
Biological monitoring will examine fish tissue samples to ascertain the presence of organic
pollutants that are harmful to human health. The in situ monitoring will be done using a
Continuous Low-Level Monitoring device, or CLAM.
The CLAM is a submersible extraction sampler, using EPA approved SPE (Solid Phase Extraction)
media to sequester Pesticides, Herbicides, PAH’s, TPH, and other trace organics from water.
The device uses low flow rate extraction sampling (5-60 ml/minute), where water is drawn
continuously through the extraction media. The CLAM provides an extraction event that can be
hours, days or weeks long, allowing capture of trace pollutants from illicit and episodic events.
Standard grab sampling only provides a few second snap shot in time, of a changing dynamic
system, and a liter sample to take to the laboratory for extraction and analysis.
The CLAM actually extracts the water in-situ, with the same technology the labs use on the
bench. It provides a pre-extracted quantitative sampling event representing up to a hundred
liters of water, lowering the laboratories detection limits a hundred fold. The small dry
extraction disk is all that is sent to the laboratory for solvent elution and analysis. This saves
the costs of extraction, expensive cooler shipments of sample bottles, and seven day holding
time requirements. The testing methods for the extraction disc would utilize EPA method 8081
pesticides, and the 8270 PAH's. Rather than extracting from a water sample, the lab will only
elute the sample from the sampling disk. The expense of shipping out liter bottles is avoided.
In addition the CLAM filter disk represents up to 100 liters of extracted water and many
aliquots can be taken from the extract for many different semi-volatile methods, the lab only
needs to perform one simple solvent elution instead of having to run multiple solvent
extractions. Finally, the clam can be deployed strategically to sample before, during, and after
storm events.
Sampling protocol for the CLAM would be established in accordance with EPA Quality
Assurance Project Plan guidance. Sampling would begin at the lowest reach in the District
Portion of Oxon Run. Subsequent upstream samples would help to pinpoint the source(s) of
organic pollution, if any. Similarly, fish tissue analysis would follow quality assurance protocol.
88
Fish samples from upper and lower reaches would be taken. Bioaccumulation, if any, of
organic and metals pollutants in fish tissue which may be harmful to human health if consumed
would be tested for. The enhanced monitoring strategy is in keeping with the D.C. Water
Quality Monitoring Regulations (Title 21, Chapter 19 - District of Columbia Municipal
Regulations) that data used to for TMDLs be gathered from the impaired stream in Question.
This monitoring strategy will allow DDOE to measure progress toward the bench marks
established in section 5.4. It will also allow DDOE to track the effectiveness of various
management techniques that have been outlined in this report. For example, stream
restoration initiatives should have a dramatic benefit for benthic macroinvertebrate
populations or water quality wetlands should dramatically decrease metals concentrations at
the stormwater outfall. The ultimate questions that monitoring should be answering are: is the
stream impaired? If so, what are the impairments? And are control measures effective for
removing those impairments? The objective is to have a healthy stream that supports both
aquatic life uses and human uses while contributing to the overall health and well being of the
community.

89
7. REFERENCES
Banta, W.C., 1993. Biological water quality of the surface streams of the District of Columbia.
Occasional Publications, Department of Biology, American University, Washington, DC 20016.
Volume 2, no. 1.
USEPA Chesapeake Bay Program (CBP), 2000. The Chesapeake 2000 Agreement.
DC Department of Health (DDOE), 2002. 2002 Water Quality Report to US EPA and Congress.
DC Department of Health (DDOE), 2004. District of Columbia 2004 Water Quality Assessment
(305b) Report.
DC Department of Health (DDOE), 2004. District of Columbia Total Maximum Daily Load
(TMDL) for Organics, Metals and Bacteria in Oxon Run.
DC Department of Health (DDOE), 2000. Non-point Source Management Plan II (NPSMBII):
Addressing Polluted Runoff in an Urban Environment.
DC Office of Documents and Administrative Issuances, 2004. The District of Columbia
Municipal Regulations (DCMR).
DC Water and Sewer Authority (DCWASA), 2002. WASA’s Recommended Combined Sewer
System Long-Term Control Plan Highlights.
Metropolitan Washington Council of Governments (COG), 1999. Anacostia Resoration
Agreement.
US Fish and Wildlife Service (USFWS), 2003. Oxon Run, Washington, DC, Watershed and
Stream Assessment – Draft.
US Fish and Wildlife Service (USFWS), 2004. Oxon Run, Washington, DC, Stream Restoration
Concept Development – Draft.
United States Department of Agriculture (USDA), Soil Conservation Service, 1976. Soil Survey
of the District of Columbia.
Winogradoff, D. A., 2002. Prince George’s County Bioretention Manual. Department of
Environmental Resources, Prince George’s County, Maryland

90
National Research Council, 2008. Urban Stormwater Management in the United States. The
National Academies Press, Washington, D.C.
Government of the District of Columbia, 2006. Discharge Monitoring Report: Municipal
Separate Storm Sewer System NPDES Permit No. DC0000221. District of Columbia Storm Water
Task Force, Washington, D.C.
Government of the District of Columbia, 2004. District of Columbia Water Quality Monitoring
and Assessment Strategy. District Department of the Environment, Washington D.C.