Embed Size (px)
Citation preview

Ownership and Energy Efficiency in Indonesia’s Manufacturing Plants
Eric D. Ramstetter ICSEAD and Graduate School of Economics, Kyushu University
and Dionisius Narjoko
Economic Research Institute for ASEAN and East Asia
Working Paper Series Vol. 2012-14 December 2012
The views expressed in this publication are those of the author(s) and do not necessarily reflect those of the Institute. No part of this book may be used reproduced in any manner whatsoever without written permission except in the case of brief quotations embodied in articles and reviews. For information, please write to the Centre.
The International Centre for the Study of East Asian Development, Kitakyushu

1
Ownership and Energy Efficiency in Indonesia’s Manufacturing Plants
Eric D. Ramstetter ([email protected]) International Centre for the Study of East Asian Development and Kyushu University
and Dionisius Narjoko
Economic Research Institute for ASEAN and East Asia December 2012
Abstract
This paper examines energy efficiency differentials between foreign multinational corporations
(MNCs) or state-owned enterprises (SOEs) and local, private plants in Indonesian manufacturing using data on medium-large plants from the industrial censuses for 1996 and 2006. The results suggest that correlations between ownership and five different energy intensities (total energy, electricity, diesel fuel, natural gas fuel, and coal fuel) were all relatively weak. When significant, MNC-private and SOE-private differentials varied markedly among energy types, industries, years, and capital definitions. In other words, the evidence suggests that ownership-related differentials in energy intensity were not pronounced or consistent in Indonesia in these two years. Thus, if policy makers are concerned with energy efficiency in Indonesian manufacturing, it does not appear meaningful to focus on plant ownership. Keywords: ownership, multinational corporations, energy efficiency, Indonesia, manufacturing JEL Categories: F23, K32, L32, L33, L60, O53, Q40 Acknowledgement: We thank the Japan Society for the Promotion of Sciences for partial financing of this research (grant #22530255 for the project “Ownership and Firm- or Plant-level Energy Efficiency in Southeast Asia”) and ICSEAD for logistic support. We thank Sadayuki Takii for discussing a previous version, as well as Kornkarun Cheewatrakoolpong, Kiichiro Fukusaku, Lin See Yan, Siang Leng Wong, and Naoyuki Yoshino for discussing related research on Malaysia and Thailand. Helpful comments were also received from other participants in the Thailand Economic Conference on 8 June 2012, an ICSEAD Staff Seminar on 11 September 2012, the Asian Economic Panel on 5-6 October 2012, and the 13th International Convention of the East Asian Economic Association on 19-20 October 2012, as well as other project participants (Archanun Kohpaiboon, Shahrazat Binti Haji Ahmad). However, the authors are solely responsible for the content of this paper including all errors and opinions.

2
1. Introduction
This paper asks whether plants controlled by foreign multinational corporations (MNCs)
and state-owned enterprises (SOEs) used purchased energy (defined as electricity and fuel)
more efficiently than medium-large local, private plants covered by the Indonesian
manufacturing censuses for 1996 and 2006. Answering this question is important because
purchased energy consumption generates a large portion of pollution (mainly air pollution)
emitted by manufacturing plants. Improving energy efficiency or energy conservation is thus
an important way to limit pollution by manufacturers. For example, if foreign MNCs are
more efficient than local plants or firms in host economies as often asserted, they may
contribute directly to lower pollution intensity in the host and may also help create spillovers
that encourage local, private plants and firms to adopt more energy-saving technologies. The
Indonesian census data also contain rather detailed breakdowns of energy consumption,
which also allow us to ask if differentials in energy intensities vary among relatively clean
and dirty energy sources (e.g., natural gas-based fuel and coal fuel).
Eskeland and Harrison (2003) is one of the few studies using micro-data to investigate this
question in developing economies. One of their main findings (p. 21) was “foreign plants are
significantly more energy efficient and use cleaner types of energy” than their local peers in
Coˆte d’Ivoire, Mexico, and Venezuela. In a related study of provincial data, He (2006) provides
evidence that FDI [foreign direct investment] enterprises produce “with higher [SO2]
pollution efficiency”, but that stronger environmental regulation has simultaneously, though
moderately, deterred FDI among Chinese provinces. Earnhart and Lizal (2006) focus on the
effects of financial performance and privatization on environmental performance, but their
results also indicate foreign ownership was usually an insignificant determinant of pollution
in Czech firms.
The paper first reviews literature related to the energy efficiency of MNCs (Section 2).
Second, it describes the database used and compares energy expenditures and energy
3
intensities between MNCs or SOEs, on the one hand, and local, private plants, on the other
(Section 3). Third, it analyzes whether MNC-private and SOE-private differentials in energy
intensities persist after accounting for scale and input mix, as well as factors affecting
technology and thus energy intensity (Section 4). The final section concludes.
2. MNCs, SOEs, and Energy Efficiency in Developing Economies
There are at least two distinct stands of literature examining the environmental impacts of MNCs
in developing economies. The largest strand examines location choices of MNCs and investigates
the so-called pollution-haven hypothesis, asking whether relatively lax environmental standards in
developing economies encourage MNCs to locate “dirty” production in those economies. Although
this literature’s methodology is not directly related to this paper’s analysis, it is helpful to review a
few key concepts it raises. The section then examines the literature analyzing whether foreign MNCs
are more efficient than local plants in developing economies, which is more directly related to this
analysis.
2a. Pollution Havens and Location Choice by MNCs
The pollution haven hypothesis literature is worthy of brief consideration because it helps put this
analysis is the context of other literature on MNCs and the environment. The pollution haven
hypothesis states that MNCs transfer polluting activities from home economies, where
environmental regulations are relatively strict, to developing economies, where
corresponding regulations tend to be less stringent. Evidence supporting this pollution-haven
hypothesis is generally weak (Dean et al. 2009; Eskeland and Harrison 2003; Kirkpatrick and
Shimamoto 2008; Smarzynska and Wei 2001), but there is some evidence consistent with the
hypothesis (He 2006; Wagner and Timmons 2008).
4
These analyses face numerous problems which have yet to be sorted out. First,
internationally comparable and meaningful data on location choice by MNCs and the severity
of environmental regulations are not easy to obtain. For example, the level of FDI is often
used to proxy MNC location choice, but FDI represents only a portion of equity and loans
(corporate finance) in recipient affiliates and is often poorly correlated (both over time and
across economies) with employment, sales, the number of affiliates, and other real activities
in recipient affiliates (Ramstetter 2012). Second, modeling MNC location choice is a rather
imprecise art and most of the literature lacks sufficient data to analyze the effects of all
potentially important determinants (Ramstetter 2011). For example, Kirkpatrick and
Shimamoto (2008) find a positive correlation between Japanese firm presence and host
country participation in international environmental agreements, but fail to account for other
factors related to good governance (e.g., strong and impartial legal and political institutions,
effective economic policy implementation), which are likely to be positively correlated with
participation in international environmental agreements.
Even if the pollution-haven hypothesis is true, and foreign direct investment (FDI) or other
MNC activities (e.g., employment, sales) tend to be concentrated in pollution-intensive
industries and countries with relatively lax environmental regulation, it is also possible that
MNC affiliates in developing economies may be less pollution- or energy-intensive compared
to local firms or plants. In other words, even if MNCs exploit pollution havens, they may
contribute to more efficient use of energy or pollution reduction in host developing countries,
especially if energy-efficient practices spillover from MNCs to local firms.
2b. MNCs, SOEs, Productivity, and Energy Efficiency in Developing Economies
In recent years, theoretical analyses have highlighted the role of what have been called
knowledge-based, intangible assets (terminology from Markusen 1991) in MNCs. The key
goals of many theoretical analyses are to explain why the MNC chooses to invest abroad
5
when it (at least) initially has several cost disadvantages compared to local firms, and why the
MNC chooses to spread out production across countries rather than concentrate it in one
location. Most observers agree that MNCs tend to possess relatively large amounts of
technological knowledge and networks, marketing expertise and networks, especially
international ones, and generally have relatively sophisticated and capable management.1
The first two characteristics are evidenced by relatively high research and development
(R&D) intensities (ratios to total sales), relatively large proportions of patent applications and
approvals, relatively high advertising-sales ratios, and relatively high dependence on
international trade (generally on both exports and imports). Correspondingly, when asking
what makes a firm decide to assume the extra costs of investing in a foreign country
(compared to the costs of local firms in the host), Dunning (1988) asserted that a firm must
first have “ownership advantages” such as those afforded by possession of relatively large
amounts intangible assets, as well as “location advantages” and “internalization advantages”
before investing.2
The important implication is that, if one accepts the idea that MNCs have relatively large
amounts of knowledge-based, intangible assets, MNCs will tend to be relatively efficient
producers compared to non-MNCs, at least in some respect. And this relatively high
efficiency could involve the MNC becoming more energy efficient and/or polluting less as
part of efforts to facilitate increased demand among consumers and minimize production
costs related to energy and pollution abatement needs. Moreover, because MNCs tend to be
relatively R&D- and patent-intensive, and because technologies for clean energy and
pollution control usually require relatively sophisticated technological inputs, it is logical to
expect that MNCs are relatively efficient producers and consumers of goods and services that
1 Caves (2007) and Dunning and Lundan (2008) provide thorough literature reviews. The work of Markusen (2002) has also been influential. 2 Dunning’s OLI (ownership-location-internalization) paradigm has been influential, but others (Buckley and Casson 1992, Casson 1987, Rugman 1980, 1985) emphasize that the concept of internalization alone can explain the existence of the MNC and its characteristics.

6
promote energy efficiency and pollution reduction. For example, evidence from Cole et al.
(2006) suggests that Japanese firms with FDI tend to have better environmental performance
(pollute less and manage emissions better) than firms without FDI, and is consistent with the
notion that MNCs are both better able to and more highly motivated to pollute less than other
firms.3 Although limited, the existing literature on energy intensities (see introduction)
indicates that MNCs tend to be relatively energy efficient, and thus pollute less, than local
counterparts.
On the other hand, the fact that MNCs can move productive resources internationally
clearly gives them the opportunity to locate polluting activities where related regulations tend
to be relatively lax. It is also conceivable that investment incentives for MNCs might
encourage them to be less energy efficient or pollute more than local firms. As indicated
above, with some exceptions, the existing literature suggests that there is not much evidence
supporting the pollution haven hypothesis that MNCs tend to locate in pollution-friendly
areas. Moreover, even if MNCs pollute less per unit of output, they may contribute to higher
overall pollution if they stimulate higher production levels to the extent that volume-related
increases in pollution are larger than efficiency gains related to MNC activity.
Although the theoretical rationale for expecting MNCs to have relatively high productivity is
rather convincing, the empirical evidence on productivity differentials between foreign MNCs and
local firms in developing economies (which are predominantly non-MNCs) is often ambiguous. For
example, studies of productivity differentials between MNCs and non-MNCs in the manufacturing
sectors of Malaysia (Oguchi et al 2002, Haji Ahmad 2010) and Thailand (Ramstetter 2004, 2006)
suggest that productivity differentials tended to be relatively small and were often statistically
insignificant. Other evidence from Malaysia (Menon 1998, Oguchi et al. 2002) indicates that the
growth of total factor productivity (TFP) was often less rapid in MNCs than in non-MNCs. Evidence
3 Cole et al. (2006) also provide evidence that firms with trade are also more likely to have better environmental performance than firms without trade. Correspondingly, they emphasize that internationalized firms are more likely to have better environmental performance than others.

7
for Indonesia (Takii 2004, 2006) and Vietnam (Ramstetter and Phan 2008, 2011) suggests that
significant productivity differentials between MNCs and local plants were somewhat more common
in the manufacturing industries of these economies. However, here again, differentials often become
statistically insignificant when a translog function is used (allowing for flexible assumptions about
scale and factor substitution) and plants are disaggregated by industry (allowing for differences in
production function slopes among industries, as well as the constant). The only known evidence for
China also suggests significant differences in both capital- and labor-productivity when all
manufacturing firms are combined into one sample (Jefferson and Su 2006). Because an MNC
parent’s willingness to share technology is often thought to be greater in controlled affiliates (Moran
2001), much of this literature also examines the question of whether majority-foreign MNCs or
MNCs with large foreign ownership shares have different productivity levels than other MNCs.
However, the empirical evidence for Thailand, Indonesia, and Vietnam cited above does not suggest
a strong tendency for productivity levels to be higher in controlled affiliates.
In contrast to MNCs, many economists expect SOEs to generally have relatively low productivity
compared to private plants, largely because SOEs are thought to face relatively weak incentives for
pursuing profits and efficiency. However, here again, the empirical evidence is mixed with several
studies finding SOEs to have relatively low productivity and others finding the opposite.4 At the
firm level, some SOEs have clear records of high profitability and productivity (e.g., Korea’s Pohang
Steel before privatization, Taiwan’s China Steel). However, accounting is often ambiguous in SOEs
and it is difficult to evaluate just how common efficient or inefficient SOEs are in general. In
Indonesia, SOEs have played important roles in several industries but have generally been perceived
as relatively inefficient. This is one reason for privatization of many SOEs during the period studied
(see Section 3 below).
Hartono et al. (2011) is the only known study of energy intensity determinants in Indonesia. They
4 See Aharoni (2000), Djankov and Murrell (2002), and (Stretton and Orchard 1994) for surveys. Jefferson and Su (2006) provide Chinese evidence and Brown (2004, 2005) analyze the productivity effects of privatization in Eastern Europe.

8
find find that local, private firms tended to have significantly higher energy intensities than SOEs
(the control group in their study) and that MNC-SOE differentials were not significant when all
manufacturing plants were pooled for 2002-2006. However, they do not examine the substantial
variation energy intensity differentials and their determinants among industries, and the theoretical
foundations of their specification is not clear.
3. The Data, Energy Consumption, and Energy Intensities
This paper uses data from the two industrial censuses conducted by BPS-Statistics (various years)
for 1996 and 2006 primarily because the censuses contain greater detail on energy expenditures and
labor quality than annual surveys conducted for other years. Focus on census years is also
advantageous because sample coverage tended to be higher in these years and because data for some
plants were estimated in the survey years between the censuses. In other words, the data for the
census years are more comprehensive and probably more accurate than data for survey years.
Because a number of plants are jointly owned by MNCs, SOEs, and/or private firms, the
distinctions between these three ownership forms are potentially ambiguous. In order to avoid
ambiguity, joint ventures with foreign shares of 33 percent or more are classified as MNCs and
non-MNC joint ventures with state shares of 33 percent or more are classified as SOEs. This cutoff
for the definition of MNCs is somewhat higher than the standard one (foreign shares of 10 percent or
more), but we know of no standard for defining SOEs similarly.
Table 1 shows total energy (fuel and electricity) expenditures for 19 manufacturing industries and
the shares of each industry’s expenditure by SOEs, all MNCs, minority-foreign MNCs (foreign
shares of 33-49 percent), majority-foreign (50-89 percent shares), and heavily foreign MNCs (shares
of 90 percent or more). These data refer to energy expenditures only, and do not account for energy
generated or sold by the plant, but purchased energy accounts for the vast majority of energy used by
most plants. Industry definitions for 1996 are based on version 2 of the Indonesia’s Standard
Industrial Classification (ISIC) and differ in some respects from 2006 definitions, which are based on
9
version 3 of the ISIC. Thus, caution is necessary when interpreting trends over time, particularly at
the industry level.5
The aggregate data indicate large increases in nominal energy expenditures during this decade,
7.8-fold in all manufacturing industries and in the 12 large energy using industries that accounted for
93 percent of total energy expenditures in both 1996 and 2006 (Table 1). Because it is reasonable to
assume that the 12 large energy using industries were the source of most energy-related pollution in
Indonesian manufacturing, the analysis below focuses primarily on these industries.6 Most of the
increase in nominal expenditures was the result of inflation, which was relatively high in Indonesian
manufacturing during 1997-2001, and again in 2005-2006.7 Among these industries, textiles,
non-metallic mineral products, food and beverages, paper, and chemicals used the most purchased
energy in both years; these five industries accounted for almost two-thirds (66%) of the total in 1996
and just over three-fifths (62%) in 2006.
Among large energy using industries, the share of SOEs in energy expenditures fell from 12 to 9.2
percent, while the share MNCs rose from 21 to 29 percent. Shares of minority- and majority-foreign
MNCs were relatively stable (5.7-6.3 percent and 11-12 percent, respectively), but shares of
heavily-foreign MNCs increased 2.7 fold (3.9 to 11 percent). Financial duress among private firms
and local partners in joint ventures with MNCs in the wake of the 1997-1998 financial crisis led
many MNCs to increase ownership shares in old joint ventures. Large decreases in Indonesian asset 5 It is impossible to construct a precise correspondence between the two classifications, because several detailed categories (i.e., at the 5- or 4-digit level) in one classification are split among detailed categories in the other classification; see Appendix Table 8 for detailed definitions used in this paper. 6 These analyses focus on industries that accounted for 3 percent or more of expenditures in 1996 or 2006 (or both) on each type of fuel examined (total energy, electricity, diesel fuel, natural gas fuel, and coal fuel). The same 12 industries were both large energy users and large electricity users by this criterion, though their share of electricity expenditures, 91-92 percent, was slightly lower. This criterion was met by 10 industries for diesel (92-93 percent of the total), 8 industries for natural gas (94-98 percent of the total), and 4 industries for coal (99-100 percent of the total). All but one was among the 12 large energy using industries, fabricated metals for natural gas being the exception. 7 According to national accounts’ estimates, manufacturing GDP increased 6.7-fold in 1996-2006 if measured in current prices, but the manufacturing GDP deflator increased 4.9-fold while real manufacturing GDP increased only 1.4-fold. The growth of the manufacturing GDP deflator peaked in 1998 (60 percent), but this measure of manufacturing inflation was also high in 2000-2001 (20-27 percent), and in 1997, 1999, and 2005-2006 (13-17 percent; Asian Development Bank 2004, 2011).

10
prices and the value of the rupiah also made buyouts of joint venture partners, as well as investments
in new ventures or takeovers of local plants much cheaper in foreign currency than before the crisis.
In addition, the post-crisis policy environment was also more favorable for MNCs seeking relatively
large ownership shares, though the implementation 1994 investment law was probably the most
important reduction of foreign ownership restrictions.
SOEs accounted for more than one-fifth of the energy expenditures in four of the 12 large energy
using industries in 1996, chemicals, basic metals, electronics-related machinery, and other
transportation machinery, but in only one industry in 2006, non-metallic mineral products (Table 1).8
On the other hand, MNC shares exceed one fifth in most of the large using industries, apparel, paper,
chemicals, non-metallic mineral products, electronics-related machinery, and motor vehicles in both
years, basic metals in 1996 but not 2006, and food and beverages, textiles, and rubber and plastics in
2006 but not 1996.
MNC shares of output tended to be somewhat smaller than shares of energy expenditures. Thus,
mean energy intensities, measured as the ratio of energy expenditures to output, were generally lower
in MNCs than in other plants. Correspondingly, the MNC-private differentials in Table 2 were
predominantly negative. If plants from all 12 large energy using industries are combined, the mean
energy intensity of private plants was 6.0 percent in 1996 and 6.5 percent in 2006, but the mean
energy intensity was 2.4 percentage points lower in all MNCs combined in 1996 and 1.3 percentage
points lower in 2006. If all 12 industries are combined, heavily foreign MNCs had the lowest energy
intensities, 2.6 and 1.4 percentage points, respectively, lower than private plants. In contrast, these
differentials were smallest (in absolute value) between minority-foreign MNCs and private plants,
2.2 and 0.2 percent lower than private plants, respectively.
8 Although not shown in Table 1, it is also interesting to note that energy expenditures of local SOEs increased much more rapidly than those of central SOEs (45-fold vs. 4.5 fold), but that expenditures of central SOEs remained 3.4-fold larger in 2006 (authors’ calculations). This occurred largely because many central SOEs were privatized or transferred to local authorities after the 1997 crisis and the promulgation of the decentralization law in 1999. However, the number of local and central SOEs is not large enough to make this distinction statistically meaningful in most industries.

11
There was also large variation of energy intensities and MNC-private differentials among
industries and ownership groups (Table 2). For example, both private plant energy intensities and
negative MNC-private differentials tended to be relatively large in non-metallic mineral products. On
the other hand, SOEs and minority- and majority-foreign MNCs all had higher energy intensities
than private plants in textiles in both years. Most MNC-private differentials (10-11 industries in 1996,
8-9 in 2006) were negative in both years. In other words, MNCs tended to have lower energy
intensities than private plants even at the industry level, but the size of both intensities and
differentials depended on the industry involved. In contrast, mean SOE-private differentials were
negative in about half (6) of the 12 (1996) or 11 (2006) relevant, large energy using industries.9
The aggregate energy intensities at the top of Table 2 do not reflect the important possibility that
MNCs and private plants may consume different energy mixes and thus impart different
environmental impacts even if aggregate energy intensities are similar. For example, Eskeland and
Harrison (2003) suggest that electricity consumption is cleaner than fuel consumption and find that
MNCs tend to consume relatively more electricity than non-MNCs. In Indonesia, electricity
generation has relied relatively heavily on clean fuels such as natural gas and hydropower, but coal (a
relatively dirty fuel) was the single largest fuel source. Coal’s shares of electricity generation were
also much larger than corresponding shares of the primary energy supply and increased substantially
between 2000 and 2005.10 The heavy and increasing use of coal for electricity generation suggests
that electricity may not be a relatively clean source of energy in Indonesia, while the relatively large
shares of natural gas and hydropower indicate the opposite. Thus, it is unclear whether electricity was
a relatively clean source of energy in Indonesian manufacturing during this period.
9 Note that there were no SOE plants in motor vehicles in 2006. 10 According to Asia Pacific Energy Research Centre (2009), natural gas and hydropower combined to account for 36 percent of electricity generation in 2000 and 23 percent in 2005, while corresponding shares of the primary energy supply were 22 and 18 percent, respectively. Coal’s share in electricity generation rose was 37 percent in 2000 and 41 percent in 2005, but its share in the primary energy supply was 7 and 13 percent, respectively. Oil accounted for another large portion of both the primary energy supply (30 and 19 percent, respectively) and electricity generation (40 and 39 percent, respectively).

12
Electricity accounted for 42 percent of all purchased energy in 1996 and 47 percent in 2006
(Appendix Tables 1a, 1b). Mean electricity propensities for private plants in the 12 large electricity
using industries were 2.2 percent in 1996 and 2.7 percent in 2006 (Table 2). In 1996, all MNC groups
had lower electricity intensities than private plants in most (9-11) of the 12 industries. Relatively
large negative differentials of over 1 percentage point were observed in about half of the industries
for minority-foreign plants (6) and heavily-foreign plants (5), but only three industries for
majority-foreign plants. In 2006, mean MNC-private differentials for all industries combined were
positive for majority- and heavily-foreign MNCs, but negative for minority-foreign MNCs. Both
minority- and majority-foreign MNCs had lower electricity intensities than private plants in most
industries (8 and 9, respectively), but negative differentials were observed in only five industries for
heavily-foreign MNCs. Moreover, there were few negative differentials greater than 1 percentage
point, six for minority-foreign MNCs, two for majority-foreign MNCs, and only one for heavily
foreign MNCs. SOEs had lower electricity intensities in slightly more than two-fifths of the relevant
large electricity using industries in 1996 (5 of 12) and slightly fewer in 2006 (4 of 11); mean
SOE-private differentials for all 12 industries combined were positive and large.
Diesel and diesel oil constitute the largest homogeneous fuel type, accounting for 29 percent of
total energy expenditures in 1996 and 24 percent in 2006 (Appendix Tables 1a, 1c), but there were
only 10 industries that accounted for 3 percent of all diesel in at least one year. In these industries,
minority- and heavily foreign MNCs had mean diesel intensities that were 0.4 points lower than
private plants, and majority-foreign plants had mean diesel intensities that were 0.6 points lower
(Table 2). However, in 2006, only minority-foreign MNCs had lower diesel intensities than private
plants while majority- and heavily-foreign had relatively high diesel intensities. Similarly, in 1996,
most of the MNC-private differentials were negative for the three MNCs ownership groups (6 or 7),
and this was also true for majority- and heavily-foreign MNCs in 2006, but not minority-foreign
MNCs (5 industries). SOEs had lower diesel intensities than private plants in four of ten industries in
1996, but six of nine in 2006; mean intensities in all 10 industries combined were about 0.9

13
percentage points higher in 1996, but only 0.03 percentage points higher in 2006. Thus, as for total
energy intensities and electricity intensities, most MNC-local differentials are negative, but there are
relatively few negative differentials or relatively large negative differentials for fuel compared to
electricity and total energy, and for 2006 compared to 1996.
Although it is difficult to classify electricity or diesel as unambiguously clean or dirty energy
sources in Indonesia, natural gas use is relatively clean, while coal and coke usage is relatively dirty.
Thus, despite the small shares of natural gas and coal in total energy expenditures, it is interesting to
examine the use of these two fuels.11 Use of both of these fuels is more specialized than use of diesel
or electricity, for example. Only eight industries had shares of total natural gas expenditures greater
than 3 percent in at least one of the years and this was true for only four industries in the case of coal
expenditures. Moreover, a very large number of plants did not use these specialized fuels at all.
Correspondingly, means of both natural gas and coal intensities (ratios expenditures on each
energy type to gross output) were only 0.10 and 0.08 for natural gas in 1996 and 2006, respectively,
and 0.04 and 0.23, respectively, for coal (Table 2). Mean MNC-private differentials for gas tended to
be positive for both types of fuel. For gas, majority-foreign plants had relatively high intensities in
most industries in both years (6 and 5 of 8, respectively), while SOE-private differentials were
predominantly negative, by exactly the same counts. On the other hand, MNC-private differentials
were predominantly negative for minority-foreign MNCs in both years (again 5 or 6 of 8) in
heavily-foreign MNCs in 1996 in most (7) industries. For coal, negative and positive differentials
were equally frequent in 1996 but by 2006 most differentials between minority-foreign and
majority-foreign MNCs and private plants (3 and 4 of 4, respectively) were negative On the other
hand, SOE-private and wholly-foreign-private differentials were predominantly positive in 2006.
In short, the descriptive statistics in Table 2 suggest that there was a weak tendency for MNCs to
use less total energy and electricity per unit of output than do private plants. The was also a weaker
11 Natural gas accounted for 7 percent of total manufacturing energy expenditures in 1996 and 3 percent in 2006, while coal accounted for 5 and 6 percent, respectively (Appendix Tables 1a, 1d, 1e).

14
tendency for MNCs to have relatively low diesel intensities, but MNC-private differentials in coal or
natural gas intensities were more often positive, though somewhat inconsistent across time and
ownership groups. However, these simple comparisons mask important plant-level differences in
factor usage, scale, and technology that may affect the relationship between ownership and energy
intensities.
4. Energy Intensities and Ownership after Accounting for Scale and Factor Usage
This section attempts to examine the relationship between ownership and energy intensities after
accounting for the effects of scale and other factor usage by estimating a factor demand model
similar to that used by Eskeland and Harrison (2003, 16-18). The model is based on a translog
production function and derives the relevant energy demand, measured as the share of the energy
factors income (expenditure) in gross output, as a function of the logs of other factor inputs (other
intermediate consumption, fixed assets, and labor), the quantity of the energy input being considered,
and factors related to a plant’s technological sophistication. In the Indonesian census data, there are
four potentially important indicators of technological sophistication that might affect energy
intensities, the ratio of research and development (R&D) expenditures to gross output, shares of
moderately educated workers and highly educated workers in the total workforce, and information
on a plant’s startup which can be used to calculate a vintage variable.12 The effect of plant ownership
is then captured by adding dummy variables that identify various groups of MNCs and SOEs (i.e.,
private firms are used as the reference group).
The simplest version of the model assumes that MNC-private differentials are the same for all
MNC ownership groups as follows:
EPi=a0+a1(LLi)+a2(LKi)+a3(LMi)+a4(LEi)+a5(SMi)+a6(SHi)+a7(RDi)+a8(YRi) +a9(DSi)+a10(DFi) (1) 12 Eskeland and Harrison (2003) include the R&D ratio and the vintage variable in their model. They also include machinery imports, but that variable is not available in the Indonesian census data.

15
where DFi=a dummy equal to 1 if plant i is an MNC, 0 otherwise DSi=a dummy equal to 1 if plant i is an SOE, 0 otherwise EPi=energy intensity or ratio of energy expenditures gross output in plant i (percent) LEi=natural log of the quantity of energy used in plant i + 1 (kilowatt hours of electricity for total energy and electricity, liters for diesel, kilograms for coal, cubic meters for natural gas) LLi=natural log of the number of workers in plant i (number) LKi= natural log of the fixed assets less depreciation at yearend in plant i (thousand rupiah) LMi=natural log intermediate consumption excluding energy in plant i (thousand rupiah) RDi=ratio of R&D expenditures to gross output in plant i (percent) SMi=percentage of workers with secondary education in plant i SHi=percentage of workers with tertiary education in plant i YRi=number of years in operation in plant i.
The coefficient a10 is the percentage point differential (comparable to calculations in Table 2) of
energy intensities between MNCs and local, private plants after accounting for the influences of scale
and factor usage, and the four indicators of technological sophistication. As in the tables above, a
modification of equation (1) is also used to distinguish differentials between MNC ownership groups
and private plants as follows:
EPi=b0+b1(LLi)+b2(LKi)+b3(LMi)+b4(LEi)+b5(SMi) +b6(SHi)+b7(RDi)+b8(YRi) +b9(DSi)+b10(DFMINi)+b11(DFMAJi)+b12(DFHVYi) (2) where DFMINi=a dummy equal to 1 if plant i is a minority-foreign MNC, 0 otherwise DFMAJi=a dummy equal to 1 if plant i is a majority-foreign MNC, 0 otherwise DFHVYi=a dummy equal to 1 if plant i is a heavily-foreign MNC, 0 otherwise
In this case, the coefficients b10, b11, and b12 are the percentage point differentials between
minority-foreign, majority-foreign and heavily-foreign MNCs, on the one hand, and private plants on
the other, after accounting for the influences of scale and other factor usage, and four indicators of
technological sophistication.
16
Because energy requirements differ greatly among manufacturing industries, determinants of
energy intensities, including SOE-private and MNC-private differentials, are likely to differ across
industries. Correspondingly, analyses of industry-level regressions are emphasized and contrasted to
results from large samples of plants in all large energy using industries combined. In both
industry-level and aggregate regressions, more detailed, industry-related differences in intercepts are
accounted for by adding industry dummies at the 4-digit level as possible.13 Regional dummies are
also included to account for the effects of plant location on intercepts.14 Because the data cover two
years spanning a period of severe economic crisis and large structural change, and because there are
large differences in industrial classifications between the two years, the models are estimated in cross
section only.
Unfortunately, even after excluding plants that reported extreme values of production or the
average product of labor, 28-33 percent of the plants in large energy consuming industries did not
report data on fixed assets in 1996 and 43-48 percent did not report this variable in 2006, with more
plants reporting yearend capital than initial capital. The following analysis focuses on analyses of
relatively small samples for which capital measures are available because omitted variable biases are
likely to be severe if the variable is not included. Although estimates using initial capital are probably
preferable because they reduce the possibility of simultaneity-related problems, estimates using
ending capital are also reported as robustness checks, primarily because samples are up to 15 percent
larger using this measure. Similarly, Appendix Tables 3-7, which report lengthy regression details
excluded from the text, also include estimates in large samples that omit the capital variable
13 One industry, motor vehicles, was a 4-digit category in 1996. In other industries, it is sometimes necessary to combine 4-digit categories with few observations or ambiguous definitions (Appendix Table 8). To reiterate, both aggregate and detailed industry definitions differ between 1996 and 2006. 14 Jakarta is used as the reference region and regional dummies are used to identify plants in Sumatra, West Java, Central Java (including Yogyakarta), East Java, and East Indonesia (including Nusa Tenggara, Kalimantan, Sulawesi, Maluku, and Irian Jaya). Plants in East Indonesia had to be omitted from some industry estimates in order to avoid perfect correlations with ownership dummies (paper in 1996, basic metals in 2006, and in both years for electronics-related machinery and motor vehicles (see Appendix tables 3-7 for details).

17
altogether. The choice of the capital variable, or its omission, does not appear to affect estimates of
MNC-private or SOE-private differentials in a predictable manner.
As in Table 2, MNC-private and SOE-private differentials are examined for five types of energy
intensities, total energy, electricity, diesel fuel, gas fuel, and coal fuel. For total energy, the quantity
of energy is not directly measurable and proxied with the quantity of electricity (as in Eskeland and
Harrison 2003); for other energy types, quantities are measured directly in homogeneous units (see
precise definitions above). Model performance varies substantially depending on the measure, period,
and industry involved (Appendix Tables 3-7). For example, in the aggregate samples that combine
all sample plants, the model explains variation in total energy and coal fuel intensities in 1996 quite
well given the cross sectional context (R2 of 0.59 or higher). However, it does a poorer job of
explaining variation of diesel and gas intensities (R2 of 0.36 or lower) and an intermediate job of
explaining variation of electricity intensities in 1996. The model’s explanatory power is also
substantially lower for total energy, electricity, and coal in 2006 than in 1996, though differences
between years are smaller for diesel and natural gas. Not surprisingly, there is also substantial
variation in explanatory power across industries. However, even the lowest R2 (0.18 for total energy
in other transportation machinery in 2006) was not unusually low for cross sections such as these.
Moreover, in almost all of the total energy and electricity equations, most of the coefficients on
labor and the energy quantity were positive and at least weakly significant at the 10 percent level,
while coefficients on intermediate consumption (excluding the energy input in question) were
negative and significant at this level (Appendix Tables 3-4). The coefficient on the energy quantity
was also positive and significant in the most diesel, natural gas, and coal estimates, and intermediate
consumption also had a significantly negative coefficient in the diesel equations (Appendix Tables
5-7). In other words, labor was a complement for total energy and electricity while intermediate
consumption was a substitute for total energy, electricity, and diesel. However, all of the control
coefficients were less often significant in estimates for the smaller energy sources of natural gas and
coal. Labor also did not appear to affect diesel consumption in many industry-year combinations.
18
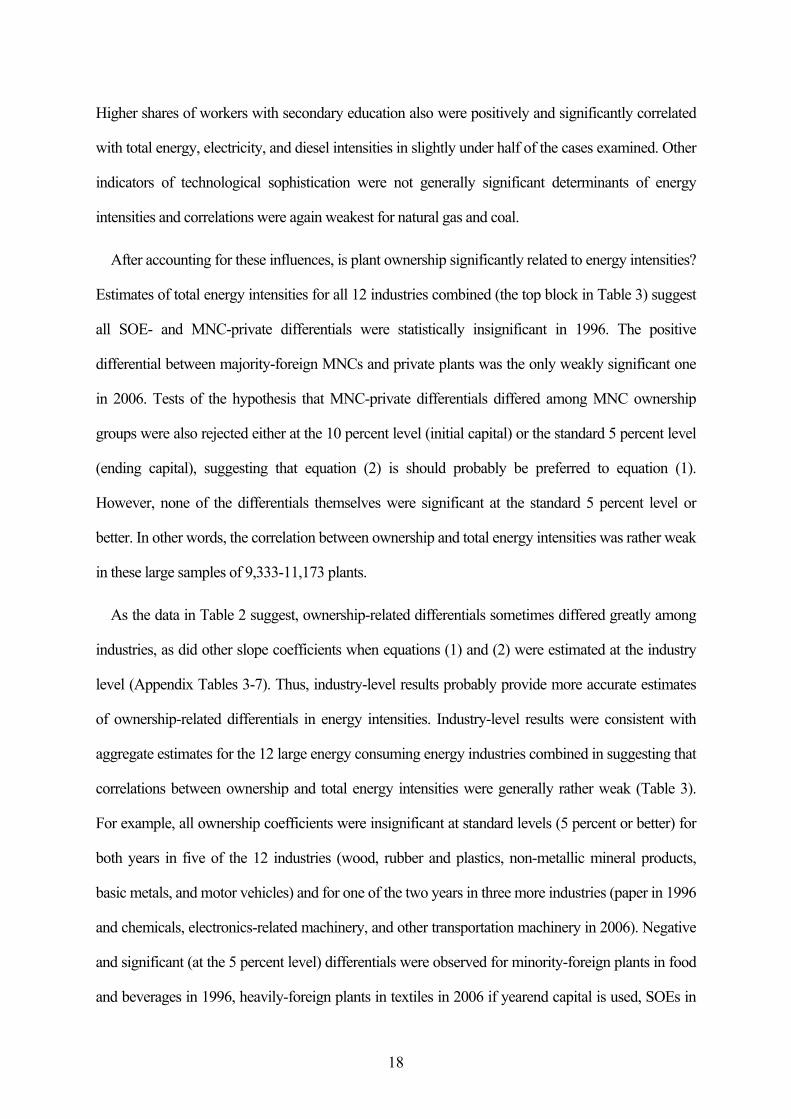
Higher shares of workers with secondary education also were positively and significantly correlated
with total energy, electricity, and diesel intensities in slightly under half of the cases examined. Other
indicators of technological sophistication were not generally significant determinants of energy
intensities and correlations were again weakest for natural gas and coal.
After accounting for these influences, is plant ownership significantly related to energy intensities?
Estimates of total energy intensities for all 12 industries combined (the top block in Table 3) suggest
all SOE- and MNC-private differentials were statistically insignificant in 1996. The positive
differential between majority-foreign MNCs and private plants was the only weakly significant one
in 2006. Tests of the hypothesis that MNC-private differentials differed among MNC ownership
groups were also rejected either at the 10 percent level (initial capital) or the standard 5 percent level
(ending capital), suggesting that equation (2) is should probably be preferred to equation (1).
However, none of the differentials themselves were significant at the standard 5 percent level or
better. In other words, the correlation between ownership and total energy intensities was rather weak
in these large samples of 9,333-11,173 plants.
As the data in Table 2 suggest, ownership-related differentials sometimes differed greatly among
industries, as did other slope coefficients when equations (1) and (2) were estimated at the industry
level (Appendix Tables 3-7). Thus, industry-level results probably provide more accurate estimates
of ownership-related differentials in energy intensities. Industry-level results were consistent with
aggregate estimates for the 12 large energy consuming energy industries combined in suggesting that
correlations between ownership and total energy intensities were generally rather weak (Table 3).
For example, all ownership coefficients were insignificant at standard levels (5 percent or better) for
both years in five of the 12 industries (wood, rubber and plastics, non-metallic mineral products,
basic metals, and motor vehicles) and for one of the two years in three more industries (paper in 1996
and chemicals, electronics-related machinery, and other transportation machinery in 2006). Negative
and significant (at the 5 percent level) differentials were observed for minority-foreign plants in food
and beverages in 1996, heavily-foreign plants in textiles in 2006 if yearend capital is used, SOEs in

19
apparel if initial capital is used, minority-foreign plants in paper products in 2006 if yearend capital is
used, and SOEs in other transportation machinery in 1996 (Table 3). Positive and significant
differentials were slightly less frequent, being observed for SOEs in textiles in 1996 if initial capital
is used, heavily foreign MNCs in apparel in 1996, SOEs in chemicals in 1996 if initial capital is used,
and all MNCs in electronics-related machinery in 1996. However, only about one-fourth of the
estimated differentials in Table 3 were weakly significant at the 10 percent level and the positive
SOE-private differential in textiles was the only one that was consistently significant in both
specifications for both years. In short, estimated differentials were often inconsistent among years
and capital definitions, and accompanied by large variation that made them generally insignificant.
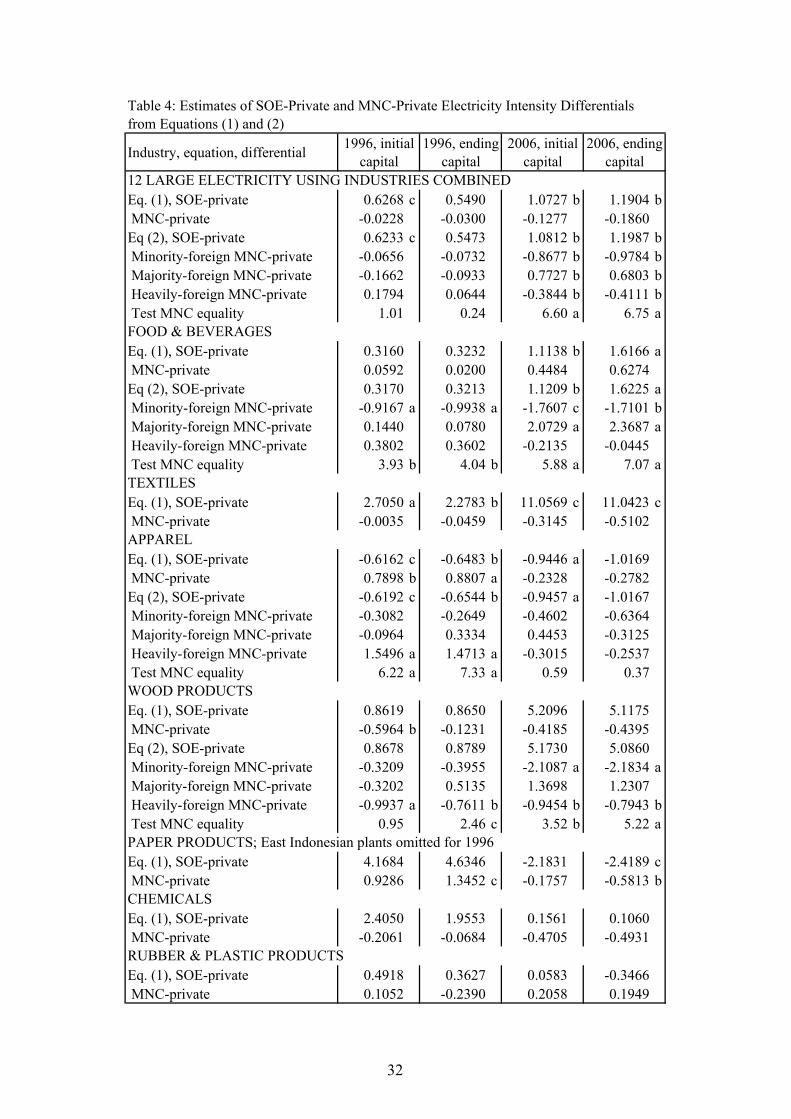
Significant, ownership-related differentials were slightly more common for electricity intensities
(Table 4) than for total energy intensities. However, 70 percent of the estimated differentials were
still insignificant at the 10 percent level or better, as were all ownership-related differentials in
chemicals, rubber and plastics, and motor vehicles. When all 12 industries were combined in 2006,
electricity intensities were significantly lower in minority-foreign and heavily-foreign MNCs, but
significantly higher in majority-foreign MNCs and SOEs. In 1996, SOEs also had weakly significant
and higher electricity intensities than private plants if initial capital is used, but there were no
significant differences between MNCs and private plants.
Industry-level results contrasted with the aggregate ones (Table 4). For example, significantly
higher electricity intensities were observed for SOEs in only two industries, food and beverages
(2006) and textiles (both years, weakly significant in 2006), but significantly lower ones were
observed in four industries, apparel (both years, inconsistent among capital measures), paper (weakly
significant in 2006, yearend capital), non-metallic mineral products (1996), and other transportation
machinery (1996, yearend capital, Table 4). At least one group of MNCs had relatively low
electricity intensities in food and beverages (minority-foreign in both years), wood (minority-foreign
in 2006, heavily foreign in both years), paper (all in 2006, yearend capital), non-metallic mineral
products (minority-foreign in 2006), basic metals (minority-foreign in 1996), and other transportation

20
machinery (majority-foreign in 2006, yearend capital). Conversely, at least one group of MNCs had
relatively high electricity intensities in food and beverages (majority foreign in 2006), apparel
(heavily foreign in 1996), paper (all in 1996, yearend capital), electronics-related machinery
(heavily-foreign in 1996), and other transportation machinery (heavily-foreign in 1996). In short,
there was large variation of ownership-related differentials among industries and little consistency in
the signs of those differentials among industries or across time in individual industries. In addition,
because electricity was not an unambiguously clean or dirty energy source in Indonesia, it is difficult
to interpret these results as in Eskeland and Harrison (2003).
Interpreting estimates of diesel fuel intensities in Table 5 is similarly difficult for similar reasons.
Moreover, only 21 percent of the estimated differentials in the Table were weakly significant. In the
aggregate estimates for all sample industries, tests of the hypothesis that ownership-related
differentials were the same for all MNC groups could not be rejected. Results of estimating equation
(1) indicate that both SOE-private and the MNC-private differentials were never weakly significant.
At the industry-level, SOEs used less diesel per unit of output than private plants and differentials
were significant at the 10 percent level or better in wood (2006), paper (both years), and rubber and
plastics (1996); SOE-private differentials in diesel intensities were never negative and weakly
significant. MNC-private differentials were at least weakly significant and negative in chemicals
(minority-foreign in 1996), rubber and plastics (majority-foreign in 1996), and non-metallic mineral
products (all MNCs in 1996), but positive in paper (heavily foreign in 1996, ending capital) and
motor vehicles (minority-foreign in both years, heavily-foreign in 1996). There is thus some
evidence that, when ownership-related differentials were significant, both SOEs and MNCs used less
diesel per unit of output than private plants. However, all ownership-related differentials were
insignificant four of the ten large diesel using industries, food and beverages, textiles, basic metals
and other transportation machinery and differentials in most industries were not consistent in the two
years. Thus, the relationship between plant ownership and diesel intensity was also weak.

21
Because natural gas fuel is clearly a relatively clean source of energy in Indonesia, one would
expect positive ownership-related differentials if MNCs or SOEs tend to use relatively large amounts
of clean fuel. However, in the aggregate estimates for the eight large gas using industries combined,
SOEs had significantly lower gas intensities than private plants in 1996 and other SOE-private and
MNC-private differentials were insignificant (Table 6).15 All ownership-related differentials were
also insignificant in half of the eight industries, textiles, paper, basic metals and metal products, and
four-fifths of all estimated differentials in the Table were insignificant. MNC-private differentials
were positive and significant in food and beverages in 1996 for minority-foreign plants if initial
capital is used, but negative for all MNCs in 2006 using both capital measures. SOE-private
differentials were also negative in 1996 if yearend capital is used. MNC-private differentials were
negative and at least weakly significant in chemicals in 2006, but all other differentials were
insignificant statistically. In rubber and plastics, both SOE- and MNC-private differentials were
significantly positive in 1996 if initial capital is used but insignificant otherwise. In non-metallic
mineral products, the second largest gas using industry after basic metals, differentials involving
minority-foreign plants in 1996 and SOEs in 2006 were significantly negative, but all other
differentials were insignificant. Thus, when differentials were significant, they tended to be negative,
but here again, the relationship of ownership to natural gas intensities was weak.
Correlations of ownership to coal fuel intensities were also weak with over three-fourths (78
percent) of the estimated differentials in Table 7 being insignificant. There were only four large coal
using industries. In 1996, the negative MNC-private differentials in chemicals and in all four
industries combined when yearend capital was used were the only weakly significant differentials.16
Significant or weakly significant differentials were more common in 2006 and all of these
differentials were positive. The aggregate results indicated that SOEs used more coal per unit of 15 Estimates of equation (2) indicate relatively low gas intensities for minority-foreign MNCs in 2006, but tests of the hypothesis that all MNC-private differentials were the same could not be rejected and estimates of equation (1) reveal the MNC-private differential to be insignificant. 16 Results of equation (2) suggest that the negative MNC-private differentials were concentrated in majority-foreign and heavily foreign MNCs, but the hypothesis that all MNC-private differentials were the same could not be rejected.

22
output than private plants as did industry-level results in textiles and non-metallic mineral products.
Results for chemicals suggested that heavily foreign MNCs used relatively large amounts of coal if
equation (2) is used and that SOEs used relatively large amounts of coal if equation (1) and yearend
capital is used, but other differentials were insignificant.17 All differentials were insignificant for
paper in this year. Thus, when significant, these results also suggest a tendency for SOEs and MNCs
to use less coal per unit of output than local plants in 1996, but to have higher coal intensities in 2006.
However, in 1996, all SOE-private differentials were insignificant and in 2006, none of the
MNC-private differentials were significant at standard levels. In short, as with the other energy
sources examined, the correlation between plant ownership and coal intensities was rather weak.
5. Conclusions
This paper has examined whether foreign MNCs used five types of energy (total energy,
electricity, diesel fuel gas fuel, and coal fuel) more efficiently than their local counterparts in samples
of Indonesia’s medium-large manufacturing plants in 1996 and 2006. A literature review highlighted
the fact that foreign MNCs are generally assumed to have superior technology to local plants in
developing economies like Indonesia. This creates the possibility that they might use inputs like
energy relatively efficiently. The empirical evidence also suggests that productivity differentials
between MNCs and local plants were more pronounced in Indonesia and Vietnam than in other
Southeast Asian economies such as Malaysia and Thailand, for example. However, if estimated at
the industry-level for different periods, there is substantial variation in the size and significance of
productivity differentials among industries and across years.
Both descriptive statistics and results of econometric estimation are consistent with this mixed
picture and suggest that the relationship between ownership and energy intensities was relatively
weak in Indonesian manufacturing. When ownership-related differentials in energy intensities were
17 The hypothesis that all MNC-private differentials were equal can be rejected at the 10 percent level but not the standard 5 percent level in this industry.

23
statistically significant, they varied greatly among industries, years, and capital definitions. In other
words, the evidence compiled suggests that ownership-related differentials in energy intensity were
not pronounced or consistent. This suggests that plants of all types tended to use energy with more or
less the same efficiency in these two years. Thus, if policy makers are concerned with energy
efficiency in Indonesian manufacturing, it does not appear meaningful to focus on plant ownership.
References
Aharoni, Yair (2000) The Performance of State-Owned Enterprises. In Pier Angelo Toninelli ed. The Rise and Fall of State-Owned Enterprise in the Western World. United Kingdom: Cambridge University Press.
Asian Development Bank (2004), Key Indicators of Developing Asian and Pacific Countries 2004, Manila: Asian Development Bank.
Asian Development Bank (2011), Key Indicators for Asia and the Pacific 2011, Manila: Asian Development Bank.
Asia Pacific Energy Research Centre (2009), APEC Energy Demand and Supply Outlook 4th Edition Economy Review, Tokyo: Institute of Energy Economics.
Blomström, Magnus and Fredrik Sjöholm (1999), “Technology Transfer and Spillovers: Does Local Participation with Multinationals Matter?” European Economic Review, 43: 915-923.
BPS-Statistics (various years), Statistik Industri (Industrial Statistics), various volumes and underlying plant-level data, 1990-2009 issues. Jakarta: Badan Pusat Statistik.
Brown, J. David, John Earle, and Almos Telegdy (2004) "Does Privatization Raise Productivity? Evidence from Comprehensive Panel Data on Manufacturing Firms in Hungary, Romania, Russia, and Ukraine", Discussion Paper 2004/10, Centre for Economic Reform and Transformation, Heriot-Watt University, Edinburgh.
Brown, J. David, John Earle, and Almos Telegdy (2005) "The Productivity Effects of Privatization: Longitudinal Estimates from Hungary, Romania, Russia, and Ukraine", Discussion Paper 2005/08, Centre for Economic Reform and Transformation, Heriot-Watt University, Edinburgh.
Buckley, Peter J. and Mark Casson (1992), The Future of the Multinational Enterprise, 2nd Edition. London: Macmillan.
Caves, Richard E. (2007), Multinational Enterprise and Economic Analysis, Cambridge, UK: Cambridge University Press.

24
Cole, Matthew A., Robert J.R. Elliott, and Kenichi Shimamoto (2006), "Globalization, firm-level characteristics and environmental management: A study of Japan" Ecological Economics, 59(2), 312-323.
Dean, Judith M., Mary E. Lovely, and Hua Wang (2009), "Foreign Direct Investment and Pollution Havens: Evaluating the Evidence from China", Journal of Development Economics, 90(1), 1-13.
Djankov, Simeon and Peter Murrell (2002) “Enterprise Restructuring in Transition: A Quantitative Survey”, Journal of Economic Literature, 60(3), 739-792.
Dunning, John H. (1988), Explaining International Production. London: Unwin Hyman.
Dunning, John H. and Sarianna M. Lundan (2008), Multinationals and the Global Economy, 2nd Ed., London: Edward Elgar.
Earnhart, Dietrich and Lubomir Lizal. 2006. Effects of ownership and financial performance on corporate environmental performance. Journal of Comparative Economics. 34 (1): 111-129.
Eskeland, Gunnar S. and Ann E. Harrison, (2003), "Moving to greener pastures? Multinationals and the pollution haven hypothesis", Journal of Development Economics, 70(1), 1-23.
Haji Ahmad, Shahrazat Binti (2010), “A Quantitative Study on the Productivity of the Manufacturing Industry in Malaysia”, Ph.D. Dissertation, University of Kitakyushu. Ch. 6.
Hartono, Djoni, Tony Irawan, and Noer Azam Achsani (2011), "An Analysis of Energy Intensity in Indonesian Manufacturing", International Research Journal of Finance and Economics, 62, 77-84.
He, Jin (2006), "Pollution haven hypothesis and environmental impacts of foreign direct investment: The case of industrial emission of sulfur dioxide (SO2) in Chinese provinces", Ecological Economics, 60(1), 228-245.
Jefferson, Gary H. and Jian Su (2006) "Privatization and restructuring in China: Evidence from shareholding ownership, 1995-2001" Journal of Comparative Economics, 34(1), 146-166.
Kirkpatrick, Colin and Kenichi Shimamoto (2008), "The effect of environmental regulation on the locational choice of Japanese foreign direct investment", Applied Economics, 40(11), 1399-1409.
Markusen, James R. (1991), "The Theory of the Multinational Enterprise: A Common Analytical Framework," in Eric D. Ramstetter, ed., Direct Foreign Investment in Asia's Developing Economies and Structural Change in the Asia-Pacific Region, Boulder, Co: Westview Press, pp. 11-32.
Markusen, James R. (2002), Multinational Firms and the Theory of International Trade, Cambridge: MIT Press.
Menon, J. (1998), "Total Factor Productivity Growth in Foreign and Domestic Firms in Malaysian Manufacturing", Journal of Asian Economics, 9(2): 251-280.

25
Moran, Theodore H. (2001), Parental Supervision: The New Paradigm for Foreign Direct Investment and Development. Washington, D.C.: Institute for International Economics.
Oguchi, Noriyoshi, Nor Aini Mohd. Amdzah, Zainon Bakar, Rauzah Zainal Abidin, and Mazlina Shafii (2002) "Productivity of Foreign and Domestic Firms in Malaysian Manufacturing Industry", Asian Economic Journal, 16(3), 215-228.
Ramstetter, Eric D. (2004) "Labor productivity, wages, nationality, and foreign ownership shares in Thai manufacturing, 1996-2000", Journal of Asian Economics, 14(6): 861-884.
Ramstetter, Eric D. (2006) “Are Productivity Differentials Important in Thai Manufacturing?” in Eric D. Ramstetter and Fredrik Sjöholm, eds., Multinational Corporations in Indonesia and Thailand: Wages, Productivity, and Exports. Hampshire, UK: Palgrave Macmillan, pp. 114-142.
Ramstetter, Eric D. (2011) “Ranking Locations for Japan’s Manufacturing Multinationals in Asia: A Literature Survey Illustrated with Indexes”, Asian Economic Journal, 25(2), 197-226.
Ramstetter, Eric D. (2012). “Foreign Multinationals in East Asia’s Large Developing Economies”, Working Paper 2012-06, Kitakyushu: International Centre for the Study of East Asian Development (http://file.icsead.or.jp/user03/1049_238.pdf).
Ramstetter, Eric D. and Phan Minh Ngoc (2008), “Productivity, Ownership, and Producer Concentration in Vietnam's Manufacturing Industries”, Working Paper 2008-04, Kitakyushu: International Centre for the Study of East Asian Development (http://file.icsead.or.jp/user04/833_212.pdf).
Ramstetter, Eric D. and Phan Minh Ngoc (2011), “Productivity, Ownership, and Producer Concentration in Transition: Further Evidence from Vietnamese Manufacturing”, Working Paper 2011-17, Kitakyushu: International Centre for the Study of East Asian Development (http://file.icsead.or.jp/user04/852_164.pdf).
Rugman, Alan M., (1980) "Internalization as a General Theory of Foreign Direct Investment: A Re-Appraisal of the Literature," Weltwirtschaftliches Archiv, 116(2), 365-379.
Rugman, Alan M. (1985) "Internalization is Still a General Theory of Foreign Direct Investment," Weltwirtschaftliches Archiv, 121(3), 570-575.
Stretton, Hugh, and Lionel Orchard (1994) Public Goods, Public Enterprise, Public Choice – Theoretical Foundations of the Contemporary Attack on Government. New York: St. Martin’s Press, Inc.
Sjöholm, Fredrik (1998), "Joint Ventures, Technology Transfer and Spillovers: Evidence from Indonesian Establishment Data", in Economic Planning Agency, ed., Foreign Direct Investment in Asia, papers and proceedings of an international symposium, 22-23 October, Tokyo: Economic Planning Agency, pp. 587-616.

26
Sjöholm, Fredrik (1999a), “Productivity Growth in Indonesia: The Role of Regional Characteristics and Direct Foreign Investment,” Economic Development and Cultural Change, 47: 559-584.
Sjöholm, Fredrik (1999b), “Technology Gap, Competition and Spillovers from Direct Foreign Investment: Evidence from Establishment Data,” Journal of Development Studies, 36: 53-73.
Smarzynska, Beata K. and Shang-Jin Wei (2001), "Pollution Havens and Foreign Direct Investment: Dirty Secret or Popular Myth?", Cambridge, MA: NBER Working Paper 8465.
Takii, Sadayuki (2004), “Productivity Differentials between Local and Foreign Plants in Indonesian Manufacturing, 1995,” World Development, 32(11), 1957-1969.
Takii, Sadayuki (2006), “Productivity Differentials and Spillovers in Indonesian Manufacturing”, in Eric D. Ramstetter and Fredrik Sjöholm, eds. Multinational Corporations in Indonesia and Thailand: Wages, Productivity, and Exports, Hampshire, UK: Palgrave Macmillan, pp. 85-103.
Wagner Ulrich J. and Christopher D. Timmins (2008), "Agglomeration Effects in Foreign Direct Investment and the Pollution Haven Hypothesis" Economic Research Initiatives at Duke (ERID) Research Paper No. 22 (forthcoming in Environmental and Resource Economics).
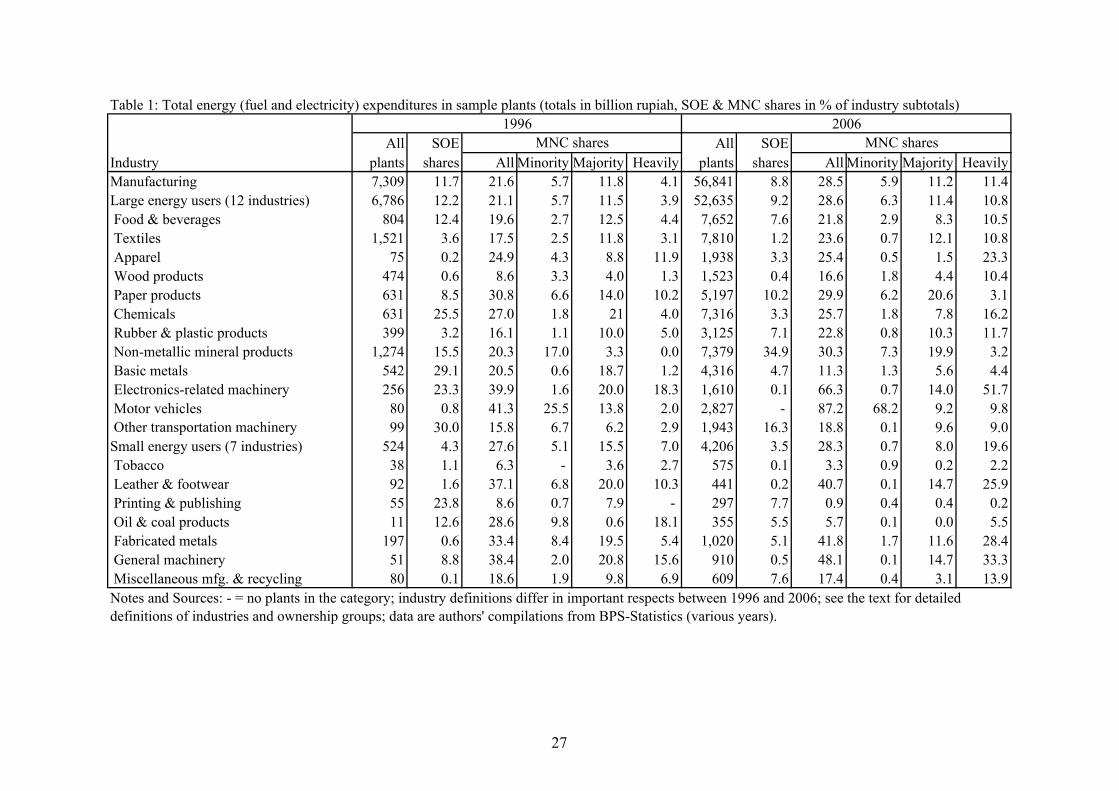
Table 1: Total energy (fuel and electricity) expenditures in sample plants (totals in billion rupiah, SOE & MNC shares in % of industry subtotals)1996 2006
All SOE All SOEIndustry plants shares All Minority Majority Heavily plants shares All Minority Majority HeavilyManufacturing 7,309 11.7 21.6 5.7 11.8 4.1 56,841 8.8 28.5 5.9 11.2 11.4Large energy users (12 industries) 6,786 12.2 21.1 5.7 11.5 3.9 52,635 9.2 28.6 6.3 11.4 10.8 Food & beverages 804 12.4 19.6 2.7 12.5 4.4 7,652 7.6 21.8 2.9 8.3 10.5 Textiles 1,521 3.6 17.5 2.5 11.8 3.1 7,810 1.2 23.6 0.7 12.1 10.8 Apparel 75 0.2 24.9 4.3 8.8 11.9 1,938 3.3 25.4 0.5 1.5 23.3 Wood products 474 0.6 8.6 3.3 4.0 1.3 1,523 0.4 16.6 1.8 4.4 10.4 Paper products 631 8.5 30.8 6.6 14.0 10.2 5,197 10.2 29.9 6.2 20.6 3.1 Chemicals 631 25.5 27.0 1.8 21 4.0 7,316 3.3 25.7 1.8 7.8 16.2 Rubber & plastic products 399 3.2 16.1 1.1 10.0 5.0 3,125 7.1 22.8 0.8 10.3 11.7 Non-metallic mineral products 1,274 15.5 20.3 17.0 3.3 0.0 7,379 34.9 30.3 7.3 19.9 3.2 Basic metals 542 29.1 20.5 0.6 18.7 1.2 4,316 4.7 11.3 1.3 5.6 4.4 Electronics-related machinery 256 23.3 39.9 1.6 20.0 18.3 1,610 0.1 66.3 0.7 14.0 51.7 Motor vehicles 80 0.8 41.3 25.5 13.8 2.0 2,827 - 87.2 68.2 9.2 9.8 Other transportation machinery 99 30.0 15.8 6.7 6.2 2.9 1,943 16.3 18.8 0.1 9.6 9.0Small energy users (7 industries) 524 4.3 27.6 5.1 15.5 7.0 4,206 3.5 28.3 0.7 8.0 19.6 Tobacco 38 1.1 6.3 - 3.6 2.7 575 0.1 3.3 0.9 0.2 2.2 Leather & footwear 92 1.6 37.1 6.8 20.0 10.3 441 0.2 40.7 0.1 14.7 25.9 Printing & publishing 55 23.8 8.6 0.7 7.9 - 297 7.7 0.9 0.4 0.4 0.2 Oil & coal products 11 12.6 28.6 9.8 0.6 18.1 355 5.5 5.7 0.1 0.0 5.5 Fabricated metals 197 0.6 33.4 8.4 19.5 5.4 1,020 5.1 41.8 1.7 11.6 28.4 General machinery 51 8.8 38.4 2.0 20.8 15.6 910 0.5 48.1 0.1 14.7 33.3 Miscellaneous mfg. & recycling 80 0.1 18.6 1.9 9.8 6.9 609 7.6 17.4 0.4 3.1 13.9Notes and Sources: - = no plants in the category; industry definitions differ in important respects between 1996 and 2006; see the text for detailed definitions of industries and ownership groups; data are authors' compilations from BPS-Statistics (various years).
MNC shares MNC shares
27

Table 2: Mean energy intensities in private plants (percent) and SOE-private and MNC-private differentials (percentage point [1st] differences)1996 2006
Private SOE- Private SOE-Industry plants private All Minority Majority Heavily plants private All Minority Majority HeavilyTotal energy (12 large using industries) 5.96 1.110 -2.429 -2.195 -2.375 -2.584 6.54 0.224 -1.253 -0.208 -1.040 -1.434 Food & beverages 5.83 1.785 -2.463 -2.207 -2.362 -2.748 6.49 0.717 -1.259 5.238 -0.589 -2.460 Textiles 4.94 4.417 0.310 0.097 0.805 -0.210 6.82 4.315 0.405 2.211 1.910 -0.477 Apparel 2.24 -1.218 -0.309 -0.930 -0.512 -0.097 3.70 4.630 1.834 -2.087 5.509 1.595 Wood products 4.65 -0.700 -1.460 -2.284 -1.276 -1.340 6.05 -1.275 -1.985 -3.392 -2.713 -1.631 Paper products 5.38 7.782 1.417 -2.337 1.682 2.764 5.90 2.543 -0.272 -3.088 2.941 -0.556 Chemicals 5.07 3.234 -2.544 -1.942 -2.652 -2.658 6.25 -1.922 -2.170 -2.017 -2.769 -1.850 Rubber & plastic products 5.68 -2.600 -2.359 -2.837 -2.648 -1.953 6.57 -2.746 -1.097 -2.246 -1.834 -0.705 Non-metallic mineral products 15.61 -3.096 -5.821 -2.059 -7.570 -5.698 14.52 -2.775 -4.293 -5.326 -5.884 -2.526 Basic metals 5.61 -0.083 -1.187 -3.367 -0.690 -1.089 5.36 1.466 0.054 -1.087 -0.549 0.590 Electronics-related machinery 3.19 1.334 -0.248 -1.175 -0.212 -0.138 3.76 -2.747 0.175 -2.620 -0.935 0.442 Motor vehicles 3.97 1.540 -1.537 -1.603 -1.278 -2.487 5.11 - -0.426 4.704 -1.398 -0.930 Other transportation machinery 4.39 -2.140 -1.637 -1.795 -1.494 -1.721 6.17 -1.659 -0.295 -5.228 -1.811 0.463Electricity (12 large using industries) 2.15 0.862 -0.510 -0.407 -0.618 -0.410 2.71 0.625 0.222 -0.395 0.226 0.280 Food & beverages 2.11 1.210 -1.045 -1.286 -0.876 -1.172 2.22 0.597 -0.223 -0.778 0.870 -0.695 Textiles 2.83 2.772 -0.653 -1.372 -0.506 -0.648 4.14 4.547 0.280 2.577 0.555 0.006 Apparel 1.43 -1.040 -0.149 -0.912 -0.517 0.176 2.12 5.030 0.931 -1.619 4.678 0.601 Wood products 1.74 -0.132 -0.352 -1.026 -0.340 -0.051 2.33 0.580 -0.363 -1.612 -0.571 -0.198 Paper products 2.75 4.268 -0.091 -2.300 0.703 -0.574 3.13 0.912 -1.147 -2.456 -0.559 -1.045 Chemicals 2.34 1.990 -0.973 0.072 -1.212 -1.037 2.72 -1.159 -0.367 -0.412 -0.684 -0.180 Rubber & plastic products 3.73 -2.936 -1.900 -2.153 -2.056 -1.681 4.39 -2.379 -0.586 -2.663 -2.021 0.167 Non-metallic mineral products 1.25 0.991 1.599 5.284 0.778 -1.085 1.87 1.976 1.474 0.048 1.367 1.966 Basic metals 2.95 1.553 -0.857 -2.447 -0.367 -0.935 2.52 0.596 -0.003 -0.359 -0.881 0.541 Electronics-related machinery 1.80 2.591 -0.007 -0.865 -0.416 0.465 2.56 -1.985 0.523 -1.739 -0.209 0.714 Motor vehicles 2.39 -0.903 -1.162 -0.757 -1.306 -1.463 3.40 - 0.278 4.199 -0.232 -0.196 Other transportation machinery 2.02 -0.627 -0.082 0.187 -0.097 -0.454 3.03 -1.419 0.056 -2.623 -1.027 0.549
MNC-private MNC-private
28

Table 2 (continued)1996 2006
Private SOE- Private SOE-Industry plants private All Minority Majority Heavily plants private All Minority Majority HeavilyDiesel fuel (10 large using industries) 1.65 0.939 -0.352 -0.465 -0.353 -0.295 2.08 0.028 -0.463 1.337 -0.510 -0.656 Food & beverages 1.72 1.343 -0.177 0.343 -0.326 -0.225 2.11 0.798 0.458 7.600 0.000 -0.265 Textiles 1.29 1.764 0.836 1.328 1.389 0.078 1.08 0.272 0.513 0.083 1.199 0.183 Wood products 1.93 -0.227 -0.563 -0.621 -0.508 -0.616 2.75 -1.848 -1.210 -1.271 -1.420 -1.133 Paper products 1.48 -0.560 0.819 -0.010 0.215 2.444 1.45 0.146 0.126 -1.374 2.228 -0.126 Chemicals 1.61 0.683 -0.954 -1.215 -0.950 -0.795 2.23 -0.703 -1.154 -1.204 -1.336 -1.043 Rubber & plastic products 1.23 0.195 -0.144 -0.410 -0.443 0.224 1.46 -0.016 -0.538 0.741 -0.194 -0.769 Non-metallic mineral products 2.30 1.661 -0.398 -1.495 0.191 -0.681 4.06 -1.662 -1.587 -1.468 -3.142 -0.173 Basic metals 1.25 -0.985 -0.259 0.025 -0.604 0.050 1.22 -1.109 0.563 0.585 1.316 0.148 Motor vehicles 0.75 0.437 -0.227 -0.209 -0.188 -0.436 0.86 - -0.335 0.634 -0.720 -0.354 Other transportation machinery 1.07 -0.859 -0.736 -1.061 -0.762 -0.192 1.92 -0.556 -0.007 -1.920 -0.346 0.209Natural gas fuel (8 large using industries) 0.10 -0.027 0.103 0.112 0.218 -0.087 0.08 0.006 0.152 0.058 0.225 0.128 Food & beverages 0.04 -0.014 0.018 -0.039 0.067 -0.026 0.05 -0.036 -0.003 0.076 0.007 -0.018 Textiles 0.02 -0.024 0.096 0.112 0.159 0.020 0.03 -0.026 0.117 -0.026 0.367 -0.004 Paper products 0.09 1.572 -0.084 -0.086 -0.086 -0.078 0.04 1.461 0.146 -0.040 0.929 -0.019 Chemicals 0.09 -0.069 0.092 -0.094 0.212 -0.093 0.08 -0.077 -0.045 -0.076 -0.035 -0.047 Rubber & plastic products 0.02 -0.019 -0.004 -0.019 0.013 -0.019 0.05 -0.054 0.096 -0.054 0.234 0.047 Non-metallic mineral products 0.44 0.017 1.460 1.342 2.118 -0.440 0.37 -0.191 1.857 0.597 1.442 2.591 Basic metals 0.23 0.082 -0.116 -0.231 -0.007 -0.207 0.15 2.154 0.080 -0.099 -0.148 0.238 Fabricated metals 0.07 -0.028 0.026 0.045 0.062 -0.048 0.08 -0.047 0.058 -0.037 -0.010 0.089Coal fuel (4 large using industries) 0.04 0.216 0.039 0.277 0.005 -0.018 0.23 0.252 0.112 0.702 0.134 0.020 Textiles 0.00 -0.001 0.002 -0.001 0.006 -0.001 0.36 -0.364 0.084 0.311 0.296 -0.038 Paper products 0.05 -0.046 0.051 0.052 -0.046 0.244 0.37 -0.367 -0.023 1.467 -0.367 -0.223 Chemicals 0.02 0.031 -0.016 -0.017 -0.015 -0.017 0.07 -0.066 0.155 0.132 0.053 0.216 Non-metallic mineral products 0.08 0.718 0.469 1.391 0.225 -0.083 0.08 1.892 0.394 1.801 0.485 -0.078Notes and Sources: please see the text for detailed definitions of ownership groups and note that industry definitions differ in important respects between 1996 (ISIC rev. 2) and 2006 (ISIC rev. 3); data are authors' compilations from BPS-Statistics (various years).
MNC-private MNC-private
29

Industry, equation, differential 1996, initialcapital
1996, endingcapital
2006, initialcapital
2006, endingcapital
Eq. (1), SOE-private 0.3017 0.2310 0.8454 0.9661 MNC-private -0.2025 -0.1559 -0.0402 -0.2190Eq (2), SOE-private 0.2933 0.2248 0.8515 0.9739 Minority-foreign MNC-private -0.7328 -0.7374 -1.1381 -1.4010 Majority-foreign MNC-private -0.3950 -0.2375 0.8494 c 0.7814 c Heavily-foreign MNC-private 0.2410 0.1384 -0.2539 -0.4524 Wald test of MNC group equality 2.00 1.42 2.47 c 3.46 b
Eq. (1), SOE-private 0.2359 0.2538 0.9146 1.5051 c MNC-private 0.0513 0.0050 1.2665 1.3189 cEq (2), SOE-private 0.2393 0.2520 0.9220 1.5114 c Minority-foreign MNC-private -1.9068 a -2.1417 a 1.3248 0.9381 Majority-foreign MNC-private 0.3133 0.2574 2.3492 a 2.5458 a Heavily-foreign MNC-private 0.5225 0.4949 0.6327 0.6780 Wald test of MNC group equality 6.38 a 7.22 a 0.97 1.23
Eq. (1), SOE-private 2.7380 b 2.2935 c 9.9839 c 10.0477 c MNC-private 0.3220 0.3325 -0.4717 -0.8486Eq (2), SOE-private 2.7336 b 2.2921 c 9.9905 c 10.0573 c Minority-foreign MNC-private 0.5273 0.5265 0.8189 0.5328 Majority-foreign MNC-private -0.1142 0.1157 0.3407 0.0848 Heavily-foreign MNC-private 0.6843 0.5051 -1.0928 -1.5074 b Wald test of MNC group equality 0.18 0.05 1.68 5.01 a
Eq. (1), SOE-private -0.7441 c -0.8285 c -2.1992 a -2.2944 MNC-private 0.5943 c 0.7893 b -0.0768 -0.0239Eq (2), SOE-private -0.7462 c -0.8334 c -2.1987 a -2.2911 Minority-foreign MNC-private -0.0553 0.0339 -1.1901 c -1.2595 Majority-foreign MNC-private -0.4448 0.2950 0.2149 0.2807 Heavily-foreign MNC-private 1.3593 a 1.2726 a -0.0287 0.0029 Wald test of MNC group equality 4.60 b 2.11 1.31 1.35
Eq. (1), SOE-private 0.7242 0.6830 4.4512 4.5320 MNC-private -0.5021 -0.0605 -0.2232 -0.4600
Eq. (1), SOE-private 6.1690 6.4640 c -2.3363 -2.7228 MNC-private 0.4859 1.4496 1.4167 0.4231Eq (2), SOE-private 6.2196 6.4340 c -2.1258 -2.4872 Minority-foreign MNC-private - - -2.9980 c -5.3068 b Majority-foreign MNC-private -0.3370 1.6077 3.2408 2.9849 Heavily-foreign MNC-private 4.3113 1.0823 1.4229 0.6207 Wald test of MNC group equality 1.38 0.03 2.44 c 3.19 b
Table 3: Estimates of SOE-Private and MNC-Private Total Energy Intensity Differentials from Equations (1) and (2)
12 LARGE ENERGY USING INDUSTRIES COMBINED
FOOD & BEVERAGES
TEXTILES
APPAREL
WOOD PRODUCTS
PAPER PRODUCTS; East Indonesian and minority-foreign plants omitted for 1996
30

Table 3 (continued)
Industry, equation, differential 1996, initialcapital
1996, endingcapital
2006, initialcapital
2006, endingcapital
Eq. (1), SOE-private 4.1615 b 3.5609 c 0.7666 1.1918 MNC-private -0.0622 0.1954 -0.2882 -0.4983
Eq. (1), SOE-private -0.9482 -1.1290 c -0.4337 -1.0144 MNC-private -0.3007 -0.6996 0.2159 0.1563
Eq. (1), SOE-private -0.8752 -0.9236 6.4073 6.8196 MNC-private -3.0950 c -2.9576 c -2.2913 -1.6446
Eq. (1), SOE-private -4.1974 c -2.5143 - - MNC-private -0.2194 -0.4278 -1.5212 -2.2187 c
Eq. (1), MNC-private 0.9084 b 0.8955 b 0.1732 0.1105
Eq. (1), MNC-private 0.8239 0.4092 -0.2242 -0.4547
Eq. (1), SOE-private -2.1724 c -2.7168 b -1.0354 -0.7599 MNC-private 0.2072 -1.0595 -0.3054 0.5313
BASIC METALS; SOE & East Indonesian plants omitted for 2006
ELECTRONICS-RELATED MACHINERY; SOE & East Indonesian plants omitted
MOTOR VEHICLES; SOE & East Indonesian plants omitted
Notes: a=signficant at the 1% level, b=significant at the 5% level, c=significant at the 10% level (all p-values based on robust standard errors); the test MNC equality rows report Wald tests of the hypothesis that MNC-private differentials are equal for all MNC groups and associated p-values; equation (2) results are omitted for industries if all Wald tests of MNC group equality for the industry are not significant at 0.10; for other slope coefficients and equation statistics, see Appendix Table 3.
OTHER TRANSPORTATION MACHINERY
RUBBER & PLASTIC PRODUCTS
NON-METALLIC MINERAL PRODUCTS,
CHEMICALS
31
Industry, equation, differential 1996, initialcapital
1996, endingcapital
2006, initialcapital
2006, endingcapital
Eq. (1), SOE-private 0.6268 c 0.5490 1.0727 b 1.1904 b MNC-private -0.0228 -0.0300 -0.1277 -0.1860Eq (2), SOE-private 0.6233 c 0.5473 1.0812 b 1.1987 b Minority-foreign MNC-private -0.0656 -0.0732 -0.8677 b -0.9784 b Majority-foreign MNC-private -0.1662 -0.0933 0.7727 b 0.6803 b Heavily-foreign MNC-private 0.1794 0.0644 -0.3844 b -0.4111 b Test MNC equality 1.01 0.24 6.60 a 6.75 a
Eq. (1), SOE-private 0.3160 0.3232 1.1138 b 1.6166 a MNC-private 0.0592 0.0200 0.4484 0.6274Eq (2), SOE-private 0.3170 0.3213 1.1209 b 1.6225 a Minority-foreign MNC-private -0.9167 a -0.9938 a -1.7607 c -1.7101 b Majority-foreign MNC-private 0.1440 0.0780 2.0729 a 2.3687 a Heavily-foreign MNC-private 0.3802 0.3602 -0.2135 -0.0445 Test MNC equality 3.93 b 4.04 b 5.88 a 7.07 a
Eq. (1), SOE-private 2.7050 a 2.2783 b 11.0569 c 11.0423 c MNC-private -0.0035 -0.0459 -0.3145 -0.5102
Eq. (1), SOE-private -0.6162 c -0.6483 b -0.9446 a -1.0169 MNC-private 0.7898 b 0.8807 a -0.2328 -0.2782Eq (2), SOE-private -0.6192 c -0.6544 b -0.9457 a -1.0167 Minority-foreign MNC-private -0.3082 -0.2649 -0.4602 -0.6364 Majority-foreign MNC-private -0.0964 0.3334 0.4453 -0.3125 Heavily-foreign MNC-private 1.5496 a 1.4713 a -0.3015 -0.2537 Test MNC equality 6.22 a 7.33 a 0.59 0.37
Eq. (1), SOE-private 0.8619 0.8650 5.2096 5.1175 MNC-private -0.5964 b -0.1231 -0.4185 -0.4395Eq (2), SOE-private 0.8678 0.8789 5.1730 5.0860 Minority-foreign MNC-private -0.3209 -0.3955 -2.1087 a -2.1834 a Majority-foreign MNC-private -0.3202 0.5135 1.3698 1.2307 Heavily-foreign MNC-private -0.9937 a -0.7611 b -0.9454 b -0.7943 b Test MNC equality 0.95 2.46 c 3.52 b 5.22 a
Eq. (1), SOE-private 4.1684 4.6346 -2.1831 -2.4189 c MNC-private 0.9286 1.3452 c -0.1757 -0.5813 b
Eq. (1), SOE-private 2.4050 1.9553 0.1561 0.1060 MNC-private -0.2061 -0.0684 -0.4705 -0.4931
Eq. (1), SOE-private 0.4918 0.3627 0.0583 -0.3466 MNC-private 0.1052 -0.2390 0.2058 0.1949
Table 4: Estimates of SOE-Private and MNC-Private Electricity Intensity Differentials from Equations (1) and (2)
12 LARGE ELECTRICITY USING INDUSTRIES COMBINED
FOOD & BEVERAGES
TEXTILES
WOOD PRODUCTS
PAPER PRODUCTS; East Indonesian plants omitted for 1996
CHEMICALS
APPAREL
RUBBER & PLASTIC PRODUCTS
32

Table 4 (continued)
Industry, equation, differential 1996, initialcapital
1996, endingcapital
2006, initialcapital
2006, endingcapital
Eq. (1), SOE-private -1.2577 b -1.4644 b 1.1867 1.3509 MNC-private -0.4375 -0.5632 -1.0599 -0.3498Eq (2), SOE-private -1.2099 c -1.4089 b 1.1742 1.3111 Minority-foreign MNC-private 1.7126 1.7971 -3.9047 a -3.6958 a Majority-foreign MNC-private -1.3190 -1.4998 c 0.6814 0.6679 Heavily-foreign MNC-private -0.9941 -1.2817 -0.8209 0.2265 Test MNC equality 1.05 1.14 4.40 b 4.95 a
Eq. (1), SOE-private -2.2071 -1.3903 - - MNC-private -0.4087 -0.3146 -0.0741 -0.9321Eq (2), SOE-private -1.8997 -1.2513 - - Minority-foreign MNC-private -3.8117 b -3.9843 b -0.7783 -0.4172 Majority-foreign MNC-private 0.6667 0.4633 1.6562 0.9733 Heavily-foreign MNC-private -1.0242 -0.1815 -0.7048 -1.9038 Test MNC equality 3.29 b 3.15 b 0.89 1.41
Eq. (1), MNC-private 0.6982 a 0.6558 a 0.1072 0.1032Eq. (2), Minority-foreign-private -0.3173 -0.3042 -1.4598 -1.4833 Majority-foreign MNC-private 0.3760 0.3084 -0.4241 -0.5640 Heavily-foreign MNC-private 1.4220 a 1.3754 a 0.3338 0.3483 Test MNC equality 8.71 a 8.89 a 0.95 1.06
Eq. (1), MNC-private -0.1124 -0.2590 -0.0470 -0.4883
Eq. (1), SOE-private -0.8876 -1.2453 b -0.2077 -0.1066 MNC-private 0.3097 -0.2563 -0.5001 -0.0574Eq (2), SOE-private -0.8985 -1.2539 b -0.1968 -0.0701 Majority-foreign MNC-private -0.2723 -1.0233 -1.8716 c -1.8904 b Heavily-foreign MNC-private 2.3473 a 2.3667 a -0.2436 0.3200 Test MNC equality 7.06 a 9.09 a 2.38 6.96 a
NON-METALLIC MINERAL PRODUCTS
BASIC METALS; SOE & East Indonesian plants omitted for 2006
ELECTRONICS-RELATED MACHINERY; SOE & East Indonesian plants omitted
MOTOR VEHICLES; SOE & East Indonesian plants omitted
Notes: a=signficant at the 1% level, b=significant at the 5% level, c=significant at the 10% level (all p-values based on robust standard errors); the test MNC equality rows report Wald tests of the hypothesis that MNC-private differentials are equal for all MNC groups and associated p-values; equation (2) results are omitted for industries if all Wald tests of MNC group equality for the industry are not significant at 0.10; for other slope coefficients and equation statistics, see Appendix Table 4.
OTHER TRANSPORTATION MACHINERY; minority-foreign MNCs omitted from (2)
33
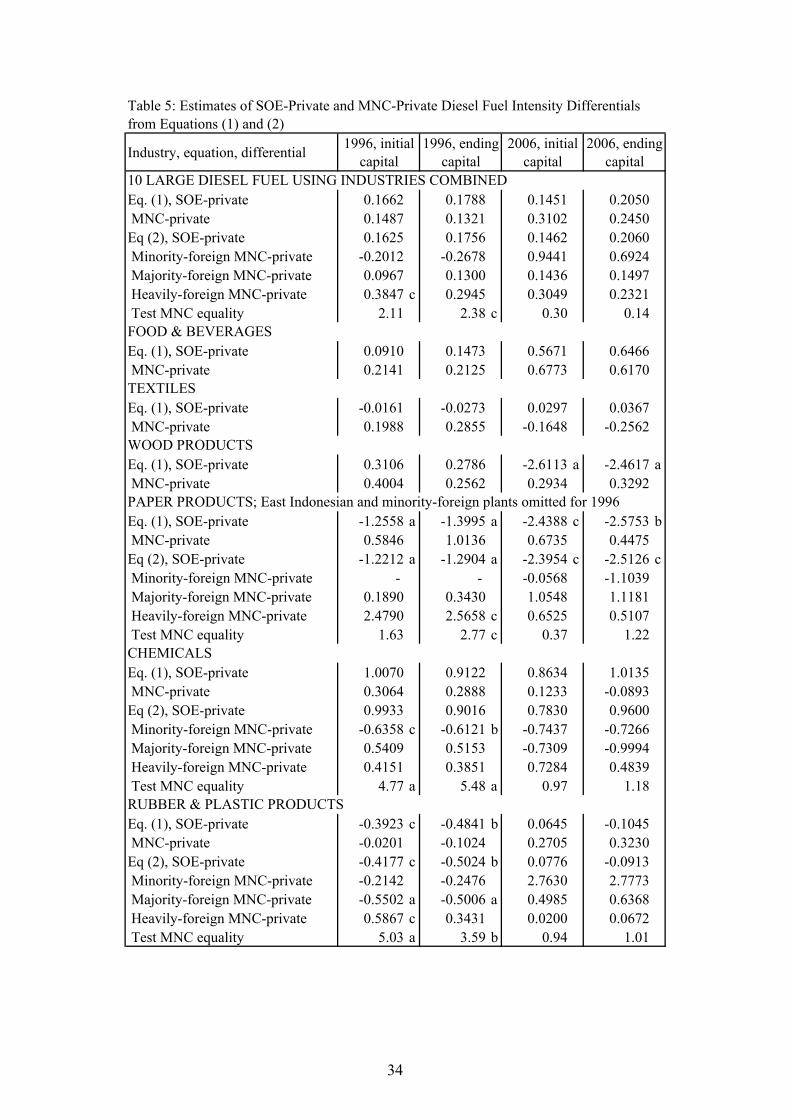
Industry, equation, differential 1996, initialcapital
1996, endingcapital
2006, initialcapital
2006, endingcapital
Eq. (1), SOE-private 0.1662 0.1788 0.1451 0.2050 MNC-private 0.1487 0.1321 0.3102 0.2450Eq (2), SOE-private 0.1625 0.1756 0.1462 0.2060 Minority-foreign MNC-private -0.2012 -0.2678 0.9441 0.6924 Majority-foreign MNC-private 0.0967 0.1300 0.1436 0.1497 Heavily-foreign MNC-private 0.3847 c 0.2945 0.3049 0.2321 Test MNC equality 2.11 2.38 c 0.30 0.14
Eq. (1), SOE-private 0.0910 0.1473 0.5671 0.6466 MNC-private 0.2141 0.2125 0.6773 0.6170
Eq. (1), SOE-private -0.0161 -0.0273 0.0297 0.0367 MNC-private 0.1988 0.2855 -0.1648 -0.2562
Eq. (1), SOE-private 0.3106 0.2786 -2.6113 a -2.4617 a MNC-private 0.4004 0.2562 0.2934 0.3292
Eq. (1), SOE-private -1.2558 a -1.3995 a -2.4388 c -2.5753 b MNC-private 0.5846 1.0136 0.6735 0.4475Eq (2), SOE-private -1.2212 a -1.2904 a -2.3954 c -2.5126 c Minority-foreign MNC-private - - -0.0568 -1.1039 Majority-foreign MNC-private 0.1890 0.3430 1.0548 1.1181 Heavily-foreign MNC-private 2.4790 2.5658 c 0.6525 0.5107 Test MNC equality 1.63 2.77 c 0.37 1.22
Eq. (1), SOE-private 1.0070 0.9122 0.8634 1.0135 MNC-private 0.3064 0.2888 0.1233 -0.0893Eq (2), SOE-private 0.9933 0.9016 0.7830 0.9600 Minority-foreign MNC-private -0.6358 c -0.6121 b -0.7437 -0.7266 Majority-foreign MNC-private 0.5409 0.5153 -0.7309 -0.9994 Heavily-foreign MNC-private 0.4151 0.3851 0.7284 0.4839 Test MNC equality 4.77 a 5.48 a 0.97 1.18
Eq. (1), SOE-private -0.3923 c -0.4841 b 0.0645 -0.1045 MNC-private -0.0201 -0.1024 0.2705 0.3230Eq (2), SOE-private -0.4177 c -0.5024 b 0.0776 -0.0913 Minority-foreign MNC-private -0.2142 -0.2476 2.7630 2.7773 Majority-foreign MNC-private -0.5502 a -0.5006 a 0.4985 0.6368 Heavily-foreign MNC-private 0.5867 c 0.3431 0.0200 0.0672 Test MNC equality 5.03 a 3.59 b 0.94 1.01
Table 5: Estimates of SOE-Private and MNC-Private Diesel Fuel Intensity Differentials from Equations (1) and (2)
10 LARGE DIESEL FUEL USING INDUSTRIES COMBINED
FOOD & BEVERAGES
TEXTILES
WOOD PRODUCTS
PAPER PRODUCTS; East Indonesian and minority-foreign plants omitted for 1996
CHEMICALS
RUBBER & PLASTIC PRODUCTS
34

Table 5 (continued)
Industry, equation, differential 1996, initialcapital
1996, endingcapital
2006, initialcapital
2006, endingcapital
Eq. (1), SOE-private 0.9386 0.8224 -0.1585 -0.1968 MNC-private -1.1835 b -1.2284 b -0.1072 -0.0826
Eq. (1), SOE-private -2.1196 -1.9136 - - MNC-private 0.0085 -0.4291 0.1374 0.2112
Eq. (1), MNC-private 0.7964 b 0.7109 b -0.0602 -0.1476Eq. (2), Minority-foreign-private 1.0177 a 1.0067 a 1.4639 a 1.4183 a Majority-foreign MNC-private 0.4904 0.3613 -0.1694 -0.1860 Heavily-foreign MNC-private 1.0978 b 1.0870 b -0.2778 -0.3783 Test MNC equality 0.40 0.71 13.80 a 12.89 a
Eq. (1), SOE-private -0.3640 -0.6050 -0.3186 -0.2360 MNC-private 0.2005 -0.0600 0.3198 0.2761
MOTOR VEHICLES; SOE & East Indonesian plants omitted
OTHER TRANSPORTATION MACHINERY
Notes: a=signficant at the 1% level, b=significant at the 5% level, c=significant at the 10% level (all p-values based on robust standard errors); the test MNC equality rows report Wald tests of the hypothesis that MNC-private differentials are equal for all MNC groups and associated p-values; equation (2) results are omitted for industries if all Wald tests of MNC group equality for the industry are not significant at 0.10; for other slope coefficients and equation statistics, see Appendix Table 5.
NON-METALLIC MINERAL PRODUCTS
BASIC METALS; SOE & East Indonesian plants omitted for 2006
35

Industry, equation, differential 1996, initialcapital
1996, endingcapital
2006, initialcapital
2006, endingcapital
Eq. (1), SOE-private -0.1585 a -0.1482 a 0.0448 0.0500 MNC-private -0.0684 -0.0782 -0.0593 -0.0590Eq (2), SOE-private -0.1602 a -0.1495 a 0.0427 0.0475 Minority-foreign MNC-private -0.2896 -0.2777 -0.4642 b -0.4954 b Majority-foreign MNC-private -0.0544 -0.0530 -0.0269 -0.0366 Heavily-foreign MNC-private -0.0025 -0.0442 -0.0234 -0.0157 Test MNC equality 0.85 0.59 1.82 2.19
Eq. (1), SOE-private -0.0552 -0.0614 c 0.0083 0.0065 MNC-private -0.0518 -0.0693 -0.1299 a -0.1457 aEq (2), SOE-private -0.0553 -0.0609 c 0.0089 0.0068 Minority-foreign MNC-private 0.1006 a 0.0737 -0.2315 -0.2360 Majority-foreign MNC-private -0.0693 -0.0789 -0.0390 -0.0707 Heavily-foreign MNC-private -0.0940 -0.1147 -0.1702 b -0.1763 b Test MNC equality 3.38 b 2.94 c 1.64 1.09
Eq. (1), SOE-private 0.0162 0.0194 0.0097 0.0004 MNC-private 0.0048 0.0125 0.0418 0.0390
Eq. (1), SOE-private 0.9655 1.3146 4.8174 4.8381 MNC-private 0.0718 -0.1955 0.0163 -0.0316
Eq. (1), SOE-private -0.0155 -0.0026 -0.0311 -0.0006 MNC-private 0.0427 0.0555 -0.2206 b -0.1482 c
Eq. (1), SOE-private 0.0214 b 0.0136 0.0109 0.0146 MNC-private 0.0242 b -0.0002 0.0021 -0.0089
Eq. (1), SOE-private -0.7077 -0.6475 -3.0625 b -3.0637 b MNC-private -1.9192 b -1.8845 b 0.0004 -0.0672Eq (2), SOE-private -0.7662 -0.7061 -3.1435 b -3.1705 b Minority-foreign MNC-private -3.7310 b -3.6754 b -2.7115 -2.6911 Majority-foreign MNC-private -1.8370 -1.7843 -2.1399 -2.2287 Heavily-foreign MNC-private 0.0320 0.0374 1.6578 1.3500 Test MNC equality 3.13 b 3.17 b 1.06 1.11
Eq. (1), SOE-private -0.0102 0.0546 - - MNC-private 0.1078 0.0992 -0.0662 0.0845
Eq. (1), SOE-private -0.1507 -0.1682 -0.1523 -0.6258 MNC-private -0.0542 -0.0617 -0.0484 -0.0299
CHEMICALS
Table 6: Estimates of SOE-Private and MNC-Private Natural Gas Fuel Intensity Differentials from Equations (1) and (2)
8 LARGE NATURAL GAS FUEL USING INDUSTRIES COMBINED
FOOD & BEVERAGES
TEXTILES
PAPER PRODUCTS; East Indonesian and minority-foreign plants omitted for 1996
Notes: a=signficant at the 1% level, b=significant at the 5% level, c=significant at the 10% level (all p-values based on robust standard errors); the test MNC equality rows report Wald tests of the hypothesis that MNC-private differentials are equal for all MNC groups and associated p-values; equation (2) results are omitted for industries if all Wald tests of MNC group equality for the industry are not significant at 0.10; for other slope coefficients and equation statistics, see Appendix Table 6.
METAL PRODUCTS
RUBBER & PLASTIC PRODUCTS
NON-METALLIC MINERAL PRODUCTS
BASIC METALS; SOE & East Indonesian plants omitted for 2006
36

Industry, equation, differential 1996, initialcapital
1996, endingcapital
2006, initialcapital
2006, endingcapital
Eq. (1), SOE-private -0.1215 -0.1094 1.2397 a 1.1477 a MNC-private -0.0565 -0.0757 c 0.0549 0.0527Eq (2), SOE-private -0.1232 -0.1093 1.2406 a 1.1489 a Minority-foreign MNC-private -0.1030 -0.0960 -0.0499 -0.0607 Majority-foreign MNC-private -0.0797 -0.0576 0.1471 0.1377 Heavily-foreign MNC-private 0.0001 -0.0948 0.0255 0.0305 Test MNC equality 1.40 0.15 0.28 0.33
Eq. (1), SOE-private 0.0005 0.0004 0.6334 b 0.5592 b MNC-private 0.0006 0.0006 0.1966 0.1783
Eq. (1), SOE-private 0.0063 0.0123 -0.0084 0.1254 MNC-private 0.0006 -0.0179 -0.1093 -0.0961
Eq. (1), SOE-private -0.0632 -0.0625 0.1506 0.1457 c MNC-private -0.0902 c -0.0825 c 0.1649 0.1486Eq (2), SOE-private -0.0636 -0.0631 0.1264 0.1315 Minority-foreign MNC-private -0.0178 -0.0187 -0.2017 -0.1939 Majority-foreign MNC-private -0.1411 c -0.1300 c -0.0794 -0.0641 Heavily-foreign MNC-private -0.0330 c -0.0288 0.3647 c 0.3257 c Test MNC equality 1.43 1.40 2.35 c 2.34 c
Eq. (1), SOE-private -0.5098 -0.4796 1.2743 c 1.2635 c MNC-private -0.2881 -0.2836 0.0289 0.0239
NON-METALLIC MINERAL PRODUCTS
Notes: a=signficant at the 1% level, b=significant at the 5% level, c=significant at the 10% level (all p-values based on robust standard errors); the test MNC equality rows report Wald tests of the hypothesis that MNC-private differentials are equal for all MNC groups and associated p-values; equation (2) results are omitted for industries if all Wald tests of MNC group equality for the industry are not significant at 0.10; for all results including other slope coefficients and equation statistics, see Appendix Table 7.
Table 7: Estimates of SOE-Private and MNC-Private Coal Fuel Intensity Differentials from Equations (1) and (2)
4 LARGE COAL FUEL USING INDUSTRIES COMBINED
TEXTILES
PAPER PRODUCTS, East Indonesian plants omitted for 1996
CHEMICALS
37
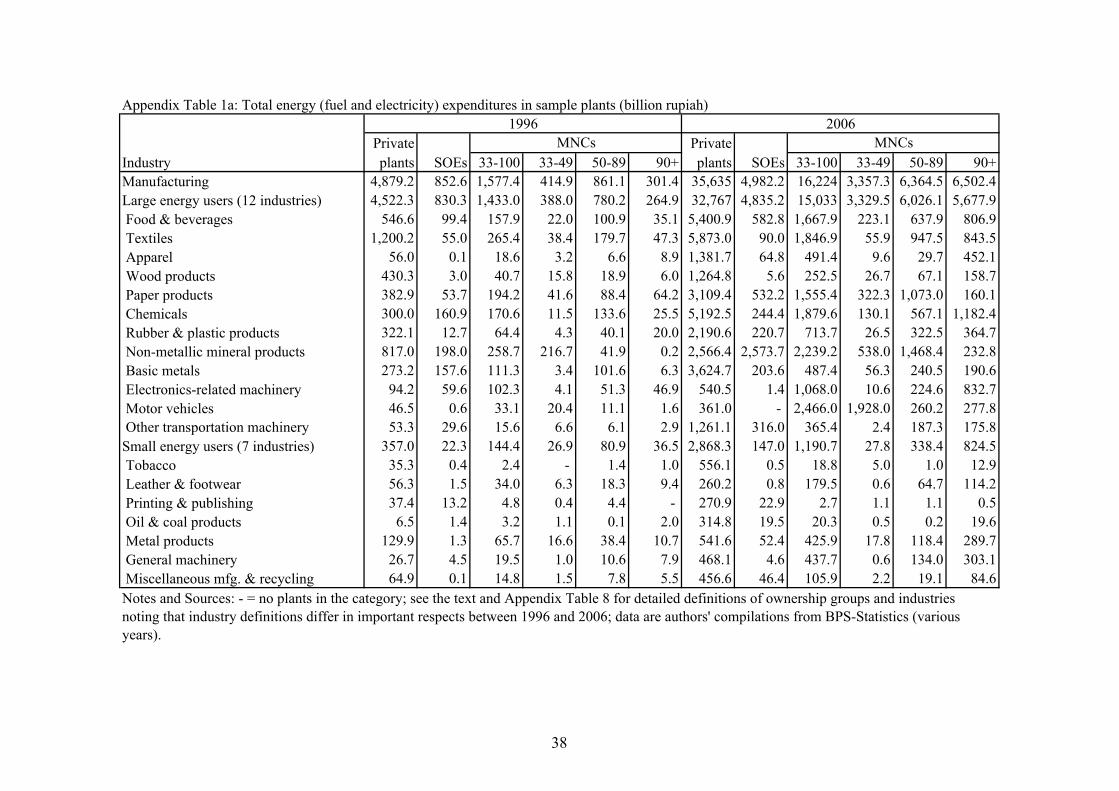
Appendix Table 1a: Total energy (fuel and electricity) expenditures in sample plants (billion rupiah)1996 2006
Private PrivateIndustry plants SOEs 33-100 33-49 50-89 90+ plants SOEs 33-100 33-49 50-89 90+Manufacturing 4,879.2 852.6 1,577.4 414.9 861.1 301.4 35,635 4,982.2 16,224 3,357.3 6,364.5 6,502.4Large energy users (12 industries) 4,522.3 830.3 1,433.0 388.0 780.2 264.9 32,767 4,835.2 15,033 3,329.5 6,026.1 5,677.9 Food & beverages 546.6 99.4 157.9 22.0 100.9 35.1 5,400.9 582.8 1,667.9 223.1 637.9 806.9 Textiles 1,200.2 55.0 265.4 38.4 179.7 47.3 5,873.0 90.0 1,846.9 55.9 947.5 843.5 Apparel 56.0 0.1 18.6 3.2 6.6 8.9 1,381.7 64.8 491.4 9.6 29.7 452.1 Wood products 430.3 3.0 40.7 15.8 18.9 6.0 1,264.8 5.6 252.5 26.7 67.1 158.7 Paper products 382.9 53.7 194.2 41.6 88.4 64.2 3,109.4 532.2 1,555.4 322.3 1,073.0 160.1 Chemicals 300.0 160.9 170.6 11.5 133.6 25.5 5,192.5 244.4 1,879.6 130.1 567.1 1,182.4 Rubber & plastic products 322.1 12.7 64.4 4.3 40.1 20.0 2,190.6 220.7 713.7 26.5 322.5 364.7 Non-metallic mineral products 817.0 198.0 258.7 216.7 41.9 0.2 2,566.4 2,573.7 2,239.2 538.0 1,468.4 232.8 Basic metals 273.2 157.6 111.3 3.4 101.6 6.3 3,624.7 203.6 487.4 56.3 240.5 190.6 Electronics-related machinery 94.2 59.6 102.3 4.1 51.3 46.9 540.5 1.4 1,068.0 10.6 224.6 832.7 Motor vehicles 46.5 0.6 33.1 20.4 11.1 1.6 361.0 - 2,466.0 1,928.0 260.2 277.8 Other transportation machinery 53.3 29.6 15.6 6.6 6.1 2.9 1,261.1 316.0 365.4 2.4 187.3 175.8Small energy users (7 industries) 357.0 22.3 144.4 26.9 80.9 36.5 2,868.3 147.0 1,190.7 27.8 338.4 824.5 Tobacco 35.3 0.4 2.4 - 1.4 1.0 556.1 0.5 18.8 5.0 1.0 12.9 Leather & footwear 56.3 1.5 34.0 6.3 18.3 9.4 260.2 0.8 179.5 0.6 64.7 114.2 Printing & publishing 37.4 13.2 4.8 0.4 4.4 - 270.9 22.9 2.7 1.1 1.1 0.5 Oil & coal products 6.5 1.4 3.2 1.1 0.1 2.0 314.8 19.5 20.3 0.5 0.2 19.6 Metal products 129.9 1.3 65.7 16.6 38.4 10.7 541.6 52.4 425.9 17.8 118.4 289.7 General machinery 26.7 4.5 19.5 1.0 10.6 7.9 468.1 4.6 437.7 0.6 134.0 303.1 Miscellaneous mfg. & recycling 64.9 0.1 14.8 1.5 7.8 5.5 456.6 46.4 105.9 2.2 19.1 84.6Notes and Sources: - = no plants in the category; see the text and Appendix Table 8 for detailed definitions of ownership groups and industries noting that industry definitions differ in important respects between 1996 and 2006; data are authors' compilations from BPS-Statistics (various years).
MNCs MNCs
38

Appendix Table 1b: Electricity expenditures in sample plants (billion rupiah)1996 2006
Private PrivateIndustry plants SOEs 33-100 33-49 50-89 90+ plants SOEs 33-100 33-49 50-89 90+Manufacturing 2,080.8 299.9 724.4 164.6 403.7 156.1 15,902 2,231.4 8,574.3 1,786.5 2,943.1 3,844.8Large energy users (12 industries) 1,900.9 284.2 651.1 155.9 360.6 134.5 14,432 2,159.9 7,876.6 1,765.9 2,728.0 3,382.6 Food & beverages 177.6 16.6 62.0 6.3 44.5 11.3 1,461.7 144.1 633.6 22.5 201.4 409.7 Textiles 648.6 47.3 105.0 5.6 73.4 26.0 3,329.1 67.1 961.6 42.9 596.4 322.3 Apparel 33.6 0.1 10.9 0.9 4.3 5.7 977.2 54.3 278.4 5.0 20.0 253.4 Wood products 133.7 1.2 11.7 4.1 3.4 4.3 382.0 4.2 77.1 13.8 9.1 54.2 Paper products 125.5 5.9 52.6 1.2 41.2 10.1 818.5 171.8 508.9 1.1 417.6 90.2 Chemicals 129.8 23.4 90.8 7.4 62.9 20.4 2,640.4 121.0 1,194.3 56.6 246.6 891.1 Rubber & plastic products 194.9 1.9 31.9 2.6 17.3 12.1 1,209.1 61.0 421.6 16.3 166.9 238.5 Non-metallic mineral products 162.8 78.3 114.8 105.8 8.9 0.0 538.1 1,153.4 730.3 103.2 533.9 93.2 Basic metals 176.9 31.5 74.3 0.5 72.1 1.7 1,859.7 93.4 135.3 22.8 19.0 93.5 Electronics-related machinery 59.7 59.5 67.8 3.0 25.0 39.9 318.3 0.6 893.2 9.7 201.9 681.5 Motor vehicles 30.0 0.2 19.1 12.5 5.6 1.1 242.8 - 1,872.3 1,470.2 200.9 201.1 Other transportation machinery 27.6 18.4 10.0 6.0 2.1 1.9 655.6 288.9 169.9 1.9 114.1 53.9Small energy users (7 industries) 179.9 15.7 73.4 8.7 43.0 21.6 1,470.0 71.5 697.8 20.6 215.1 462.2 Tobacco 15.2 0.3 1.9 - 1.1 0.8 131.7 0.1 15.4 4.6 0.0 10.8 Leather & footwear 34.5 0.6 18.8 2.6 10.7 5.5 181.1 0.5 124.7 0.4 39.1 85.2 Printing & publishing 24.0 10.2 3.3 0.2 3.2 - 190.8 18.8 2.1 0.9 0.9 0.3 Oil & coal products 0.5 0.0 1.7 0.0 0.0 1.7 67.2 4.8 2.1 0.0 0.0 2.1 Metal products 55.8 0.8 31.9 4.0 21.5 6.4 288.0 13.7 249.3 12.4 70.2 166.6 General machinery 14.6 3.8 8.3 0.7 2.9 4.8 344.6 2.3 231.5 0.4 92.8 138.4 Miscellaneous mfg. & recycling 35.2 0.0 7.5 1.2 3.7 2.5 266.6 31.4 72.8 1.8 12.1 58.8
MNCs MNCs
Notes and Sources: - = no plants in the category; see the text and Appendix Table 8 for detailed definitions of ownership groups and industries noting that industry definitions differ in important respects between 1996 and 2006; data are authors' compilations from BPS-Statistics (various years).
39
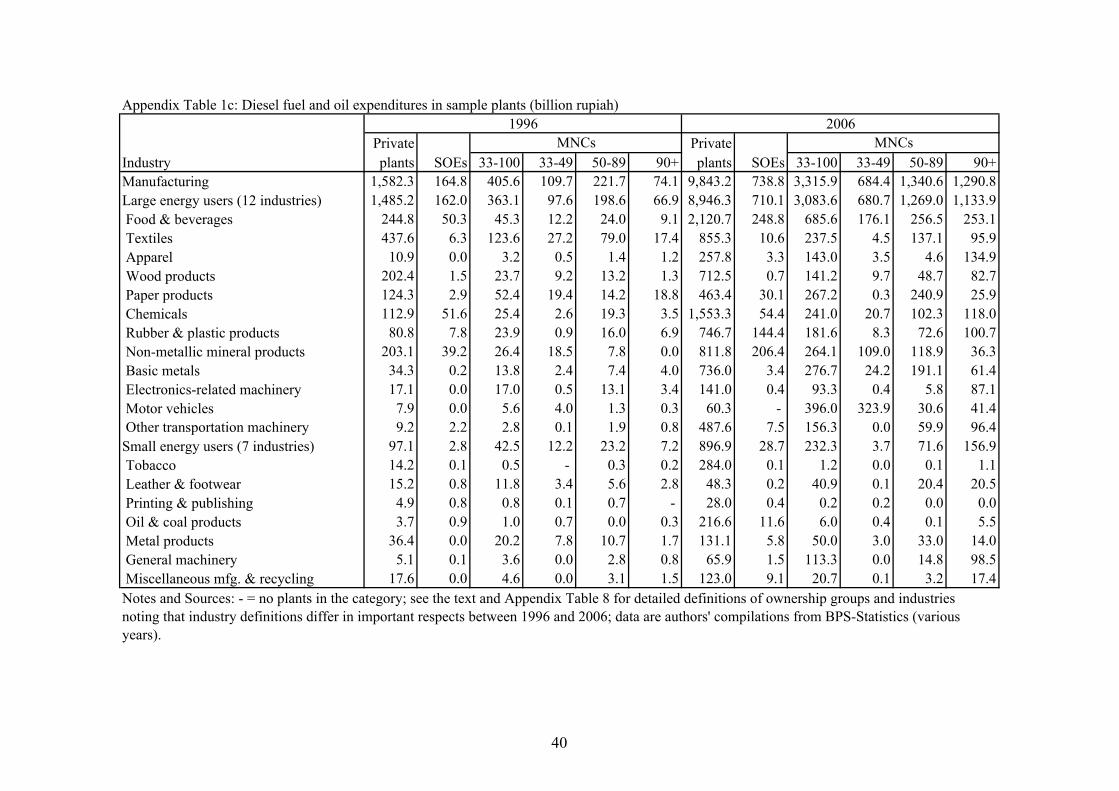
Appendix Table 1c: Diesel fuel and oil expenditures in sample plants (billion rupiah)1996 2006
Private PrivateIndustry plants SOEs 33-100 33-49 50-89 90+ plants SOEs 33-100 33-49 50-89 90+Manufacturing 1,582.3 164.8 405.6 109.7 221.7 74.1 9,843.2 738.8 3,315.9 684.4 1,340.6 1,290.8Large energy users (12 industries) 1,485.2 162.0 363.1 97.6 198.6 66.9 8,946.3 710.1 3,083.6 680.7 1,269.0 1,133.9 Food & beverages 244.8 50.3 45.3 12.2 24.0 9.1 2,120.7 248.8 685.6 176.1 256.5 253.1 Textiles 437.6 6.3 123.6 27.2 79.0 17.4 855.3 10.6 237.5 4.5 137.1 95.9 Apparel 10.9 0.0 3.2 0.5 1.4 1.2 257.8 3.3 143.0 3.5 4.6 134.9 Wood products 202.4 1.5 23.7 9.2 13.2 1.3 712.5 0.7 141.2 9.7 48.7 82.7 Paper products 124.3 2.9 52.4 19.4 14.2 18.8 463.4 30.1 267.2 0.3 240.9 25.9 Chemicals 112.9 51.6 25.4 2.6 19.3 3.5 1,553.3 54.4 241.0 20.7 102.3 118.0 Rubber & plastic products 80.8 7.8 23.9 0.9 16.0 6.9 746.7 144.4 181.6 8.3 72.6 100.7 Non-metallic mineral products 203.1 39.2 26.4 18.5 7.8 0.0 811.8 206.4 264.1 109.0 118.9 36.3 Basic metals 34.3 0.2 13.8 2.4 7.4 4.0 736.0 3.4 276.7 24.2 191.1 61.4 Electronics-related machinery 17.1 0.0 17.0 0.5 13.1 3.4 141.0 0.4 93.3 0.4 5.8 87.1 Motor vehicles 7.9 0.0 5.6 4.0 1.3 0.3 60.3 - 396.0 323.9 30.6 41.4 Other transportation machinery 9.2 2.2 2.8 0.1 1.9 0.8 487.6 7.5 156.3 0.0 59.9 96.4Small energy users (7 industries) 97.1 2.8 42.5 12.2 23.2 7.2 896.9 28.7 232.3 3.7 71.6 156.9 Tobacco 14.2 0.1 0.5 - 0.3 0.2 284.0 0.1 1.2 0.0 0.1 1.1 Leather & footwear 15.2 0.8 11.8 3.4 5.6 2.8 48.3 0.2 40.9 0.1 20.4 20.5 Printing & publishing 4.9 0.8 0.8 0.1 0.7 - 28.0 0.4 0.2 0.2 0.0 0.0 Oil & coal products 3.7 0.9 1.0 0.7 0.0 0.3 216.6 11.6 6.0 0.4 0.1 5.5 Metal products 36.4 0.0 20.2 7.8 10.7 1.7 131.1 5.8 50.0 3.0 33.0 14.0 General machinery 5.1 0.1 3.6 0.0 2.8 0.8 65.9 1.5 113.3 0.0 14.8 98.5 Miscellaneous mfg. & recycling 17.6 0.0 4.6 0.0 3.1 1.5 123.0 9.1 20.7 0.1 3.2 17.4
MNCs MNCs
Notes and Sources: - = no plants in the category; see the text and Appendix Table 8 for detailed definitions of ownership groups and industries noting that industry definitions differ in important respects between 1996 and 2006; data are authors' compilations from BPS-Statistics (various years).
40

Appendix Table 1d: Natural gas fuel expenditures in sample plants (billion rupiah)1996 2006
Private PrivateIndustry plants SOEs 33-100 33-49 50-89 90+ plants SOEs 33-100 33-49 50-89 90+Manufacturing 284.8 153.0 65.9 12.7 51.1 2.1 1,112.7 165.5 705.1 36.0 423.9 245.2Large energy users (12 industries) 280.1 152.8 60.3 10.6 48.5 1.3 1,084.7 165.4 606.7 35.8 414.9 156.0 Food & beverages 31.3 2.7 7.8 0.0 7.6 0.1 110.1 6.7 67.2 2.6 54.8 9.8 Textiles 14.5 0.0 8.7 0.7 7.3 0.7 59.7 0.0 20.4 0.0 15.7 4.7 Apparel 0.6 0.0 0.0 0.0 0.0 0.0 23.7 0.0 0.9 0.0 0.0 0.9 Wood products 1.1 0.0 0.0 0.0 0.0 0.0 0.1 0.0 0.0 0.0 0.0 0.0 Paper products 20.2 12.4 0.3 0.0 0.0 0.3 20.6 90.7 147.7 0.0 146.2 1.5 Chemicals 9.5 9.7 8.6 0.0 8.6 0.0 26.0 0.0 36.0 0.0 13.5 22.6 Rubber & plastic products 15.3 0.0 2.7 0.0 2.7 0.0 34.5 0.0 39.9 0.0 24.6 15.3 Non-metallic mineral products 140.0 5.4 17.9 9.6 8.3 0.0 269.3 7.9 227.0 26.2 153.4 47.5 Basic metals 38.2 118.1 7.4 0.0 7.4 0.0 528.6 60.0 21.3 6.8 0.0 14.5 Electronics-related machinery 3.1 0.0 6.6 0.1 6.4 0.1 3.4 0.0 26.2 0.0 0.1 26.2 Motor vehicles 0.9 0.4 0.0 0.0 0.0 0.0 0.4 - 3.8 0.2 2.4 1.2 Other transportation machinery 5.3 4.0 0.3 0.2 0.0 0.1 8.2 0.1 16.2 0.0 4.3 11.8Small energy users (7 industries) 4.7 0.2 5.6 2.1 2.6 0.8 28.1 0.1 98.4 0.3 9.0 89.2 Tobacco 0.0 0.0 0.0 - 0.0 0.0 0.0 0.0 1.3 0.0 0.7 0.5 Leather & footwear 0.1 0.0 0.0 0.0 0.0 0.0 0.2 0.0 0.0 0.0 0.0 0.0 Printing & publishing 0.7 0.0 0.2 0.0 0.2 - 0.5 0.0 0.0 0.0 0.0 0.0 Oil & coal products 0.0 0.0 0.0 0.0 0.0 0.0 2.5 0.0 0.0 0.0 0.0 0.0 Metal products 2.6 0.0 4.9 2.1 1.9 0.8 22.1 0.1 91.6 0.3 7.8 83.6 General machinery 1.1 0.1 0.4 0.0 0.4 0.0 1.7 0.0 5.0 0.0 0.5 4.5 Miscellaneous mfg. & recycling 0.2 0.0 0.0 0.0 0.0 0.0 1.2 0.0 0.6 0.0 0.0 0.6
MNCs MNCs
Notes and Sources: - = no plants in the category; see the text and Appendix Table 8 for detailed definitions of ownership groups and industries noting that industry definitions differ in important respects between 1996 and 2006; data are authors' compilations from BPS-Statistics (various years).
41

Appendix Table 1e: Coal fuel expenditures in sample plants (billion rupiah)1996 2006
Private PrivateIndustry plants SOEs 33-100 33-49 50-89 90+ plants SOEs 33-100 33-49 50-89 90+Manufacturing 245.0 58.1 82.5 54.1 17.6 10.8 1,012.8 967.4 1,218.5 441.3 525.9 251.3Large energy users (12 industries) 241.2 58.1 82.3 54.1 17.3 10.8 1,002.3 965.6 1,215.6 441.3 524.3 250.0 Food & beverages 0.2 0.9 0.1 0.0 0.0 0.1 45.9 4.0 14.1 0.0 5.3 8.8 Textiles 1.4 0.0 0.5 0.0 0.5 0.0 336.7 0.0 166.4 6.6 56.0 103.7 Apparel 0.0 0.0 0.0 0.0 0.0 0.0 16.2 0.0 0.7 0.1 0.0 0.6 Wood products 0.8 0.0 0.0 0.0 0.0 0.0 40.7 0.0 10.2 1.4 2.5 6.2 Paper products 72.3 0.0 12.5 2.0 0.0 10.5 314.6 0.0 328.0 320.0 0.0 8.0 Chemicals 0.6 0.0 0.0 0.0 0.0 0.0 37.0 0.0 203.8 7.5 78.2 118.1 Rubber & plastic products 0.7 0.0 0.0 0.0 0.0 0.0 9.4 0.0 8.5 0.0 5.2 3.3 Non-metallic mineral products 164.2 57.2 65.5 52.1 13.4 0.0 146.2 960.6 474.1 105.6 368.5 0.0 Basic metals 0.8 0.0 3.4 0.0 3.3 0.2 55.3 1.1 9.8 0.0 8.6 1.2 Electronics-related machinery 0.1 0.0 0.1 0.0 0.1 0.0 0.0 0.0 0.0 0.0 0.0 0.0 Motor vehicles 0.0 0.0 0.1 0.0 0.1 0.0 0.3 - 0.0 0.0 0.0 0.0 Other transportation machinery 0.3 0.0 0.0 0.0 0.0 0.0 0.0 0.0 0.0 0.0 0.0 0.0Small energy users (7 industries) 3.8 0.0 0.3 0.0 0.3 0.0 10.6 1.7 2.9 0.0 1.6 1.3 Tobacco 0.0 0.0 0.0 - 0.0 0.0 0.0 0.1 0.0 0.0 0.0 0.0 Leather & footwear 0.0 0.0 0.0 0.0 0.0 0.0 0.0 0.0 0.0 0.0 0.0 0.0 Printing & publishing 0.8 0.0 0.0 0.0 0.0 - 0.9 0.0 0.0 0.0 0.0 0.0 Oil & coal products 0.0 0.0 0.0 0.0 0.0 0.0 3.1 1.6 0.0 0.0 0.0 0.0 Metal products 1.5 0.0 0.0 0.0 0.0 0.0 2.2 0.0 0.7 0.0 0.0 0.7 General machinery 1.4 0.0 0.2 0.0 0.2 0.0 2.5 0.0 2.2 0.0 1.6 0.6 Miscellaneous mfg. & recycling 0.0 0.0 0.0 0.0 0.0 0.0 1.9 0.0 0.0 0.0 0.0 0.0
MNCs MNCs
Notes and Sources: - = no plants in the category; see the text and Appendix Table 8 for detailed definitions of ownership groups and industries noting that industry definitions differ in important respects between 1996 and 2006; data are authors' compilations from BPS-Statistics (various years).
42

Appendix Table 1f: Gross output in sample plants (billion rupiah)1996 2006
Private PrivateIndustry plants SOEs 33-100 33-49 50-89 90+ plants SOEs 33-100 33-49 50-89 90+Manufacturing 155,557 21,602 66,019 12,801 37,008 16,210 741,205 83,245 459,566 43,173 156,309 260,083Large energy users (12 industries) 125,385 19,942 54,355 11,285 29,368 13,702 609,683 76,860 398,492 28,270 140,566 229,655 Food & beverages 24,273 3,391 5,957 1,010 3,664 1,284 167,720 18,796 74,954 3,584 20,047 51,323 Textiles 21,829 695 5,636 684 4,007 945 68,280 1,401 32,869 550 13,715 18,604 Apparel 5,907 67 2,329 556 714 1,058 27,332 1,299 16,035 1,384 1,335 13,317 Wood products 14,180 126 1,867 724 913 230 31,079 118 6,751 1,034 2,393 3,324 Paper products 6,005 437 2,949 876 836 1,237 40,456 9,650 21,808 3,361 12,799 5,648 Chemicals 10,954 3,187 8,679 793 6,635 1,251 76,140 21,977 49,293 1,832 17,357 30,104 Rubber & plastic products 11,514 490 3,158 248 2,191 719 67,142 4,247 27,585 1,261 14,217 12,107 Non-metallic mineral products 5,400 1,150 2,224 1,675 544 4 17,318 10,488 11,564 3,777 5,589 2,198 Basic metals 5,291 7,845 3,904 235 3,513 156 66,472 2,675 12,614 3,525 5,448 3,641 Electronics-related machinery 7,752 655 10,658 352 3,652 6,653 22,993 275 59,683 2,739 4,896 52,048 Motor vehicles 3,852 8 5,258 3,220 1,972 65 13,043 - 56,742 4,427 18,336 33,979 Other transportation machinery 8,427 1,891 1,736 911 727 98 11,709 5,934 28,592 796 24,435 3,362Small energy users (7 industries) 30,173 1,660 11,664 1,516 7,639 2,509 131,522 6,384 61,074 14,903 15,743 30,428 Tobacco 13,563 7 723 - 563 160 55,227 202 14,339 13,735 302 302 Leather & footwear 3,954 65 3,400 414 1,943 1,043 11,215 74 11,843 52 7,345 4,446 Printing & publishing 2,210 1,065 272 29 242 - 10,786 1,872 229 168 52 9 Oil & coal products 97 144 40 12 6 22 6,803 57 1,031 6 11 1,013 Metal products 5,548 189 4,277 869 2,897 511 16,963 2,420 12,765 695 4,056 8,014 General machinery 1,754 181 1,857 94 1,574 189 10,678 582 13,185 94 3,416 9,675 Miscellaneous mfg. & recycling 3,046 8 1,095 97 413 585 19,851 1,178 7,683 153 561 6,969
MNCs MNCs
Notes and Sources: - = no plants in the category; see the text and Appendix Table 8 for detailed definitions of ownership groups and industries noting that industry definitions differ in important respects between 1996 and 2006; data are authors' compilations from BPS-Statistics (various years).
43

Appendix Table 1g: Value added in sample plants (billion rupiah)1996 2006
Private PrivateIndustry plants SOEs 33-100 33-49 50-89 90+ plants SOEs 33-100 33-49 50-89 90+Manufacturing 54,557 12,682 25,877 6,427 13,621 5,829 278,753 37,019 196,660 20,405 69,774 106,481Large energy users (12 industries) 39,700 11,735 21,074 5,596 10,640 4,838 204,857 33,902 167,608 10,632 63,205 93,772 Food & beverages 5,583 1,260 1,876 362 957 557 45,000 6,237 30,335 1,275 11,937 17,123 Textiles 7,233 198 2,156 304 1,501 351 25,903 592 10,877 115 5,579 5,184 Apparel 2,191 15 1,042 285 285 471 11,569 585 6,835 465 920 5,449 Wood products 5,139 38 687 206 421 60 12,526 56 1,975 233 785 957 Paper products 1,967 87 1,079 256 145 678 18,940 3,281 8,485 440 5,700 2,345 Chemicals 3,345 1,477 3,607 341 2,714 552 27,677 13,300 17,239 524 5,040 11,676 Rubber & plastic products 2,521 199 847 72 624 151 20,779 1,813 7,119 249 3,648 3,223 Non-metallic mineral products 2,002 443 1,284 1,033 249 2 7,942 4,630 6,225 2,153 3,001 1,071 Basic metals 1,353 6,090 2,408 85 2,282 41 14,222 801 5,081 2,577 1,545 959 Electronics-related machinery 3,608 479 2,965 97 963 1,905 9,358 112 21,940 998 2,601 18,341 Motor vehicles 1,462 1 2,542 2,160 368 15 6,137 - 40,225 1,308 12,776 26,140 Other transportation machinery 3,294 1,448 581 395 131 55 4,806 2,494 11,273 295 9,673 1,305Small energy users (7 industries) 14,857 946 4,804 831 2,981 992 73,896 3,117 29,052 9,773 6,569 12,709 Tobacco 8,298 4 479 - 415 64 39,225 105 9,764 9,405 201 159 Leather & footwear 1,796 6 1,221 142 698 381 5,212 53 5,055 16 2,832 2,206 Printing & publishing 811 651 217 15 202 - 5,249 1,166 72 41 28 4 Oil & coal products 42 120 16 1 1 13 5,041 20 212 2 5 206 Metal products 2,015 84 1,836 605 1,059 172 6,768 983 4,753 221 1,670 2,862 General machinery 736 77 537 31 437 70 3,299 316 5,391 37 1,643 3,711 Miscellaneous mfg. & recycling 1,160 4 498 37 169 292 9,102 475 3,805 52 191 3,562
MNCs MNCs
Notes and Sources: - = no plants in the category; see the text and Appendix Table 8 for detailed definitions of ownership groups and industries noting that industry definitions differ in important respects between 1996 and 2006; data are authors' compilations from BPS-Statistics (various years).
44

Appendix Table 1h: Workers in sample plants (thousands)1996 2006
Private PrivateIndustry plants SOEs 33-100 33-49 50-89 90+ plants SOEs 33-100 33-49 50-89 90+Manufacturing 2,981.7 275.2 720.2 133.5 346.0 240.7 2,972.6 236.0 1,067.9 102.0 299.8 666.1Large energy users (12 industries) 2,242.1 251.4 492.6 100.3 221.8 170.5 2,235.1 204.8 806.0 70.9 236.9 498.1 Food & beverages 361.3 118.7 52.3 16.7 24.7 10.8 481.1 74.2 116.4 13.8 41.1 61.5 Textiles 499.8 18.7 79.0 8.1 46.7 24.2 427.7 11.1 91.5 3.5 46.9 41.2 Apparel 284.8 3.6 86.6 17.8 25.3 43.4 335.0 15.5 153.3 14.1 14.0 125.3 Wood products 356.7 4.6 36.6 12.4 14.8 9.3 241.4 2.1 36.2 3.2 10.6 22.3 Paper products 68.2 5.8 17.0 6.3 6.3 4.3 80.5 21.3 22.8 6.4 8.4 8.1 Chemicals 125.7 22.6 34.7 5.9 21.7 7.1 139.0 18.0 43.0 4.4 15.6 23.1 Rubber & plastic products 218.4 27.8 33.1 2.8 18.6 11.7 223.0 26.3 71.6 2.9 35.6 33.1 Non-metallic mineral products 139.0 11.6 20.3 11.5 8.5 0.3 113.1 12.8 35.4 12.5 14.2 8.7 Basic metals 32.6 7.2 10.4 0.9 7.2 2.2 48.6 3.1 13.3 1.9 5.1 6.3 Electronics-related machinery 83.6 3.3 91.5 3.2 35.2 53.1 76.8 3.3 152.5 3.4 12.9 136.3 Motor vehicles 42.7 0.3 17.6 9.6 7.1 0.8 38.3 - 46.3 4.3 17.6 24.5 Other transportation machinery 29.5 27.1 13.7 4.9 5.6 3.2 30.6 17.2 23.5 0.6 15.0 7.9Small energy users (7 industries) 739.6 23.8 227.6 33.2 124.2 70.2 737.4 31.3 261.9 31.1 62.9 167.9 Tobacco 168.3 1.2 2.8 - 0.7 2.1 205.7 5.9 30.0 26.0 0.1 3.9 Leather & footwear 184.9 2.4 138.3 20.5 76.3 41.5 124.4 1.3 97.4 0.6 37.0 59.8 Printing & publishing 58.2 8.3 3.1 0.6 2.5 - 56.9 4.6 1.1 0.5 0.4 0.2 Oil & coal products 1.6 0.4 0.6 0.1 0.0 0.5 5.0 0.3 0.5 0.0 0.0 0.4 Metal products 117.6 2.6 39.4 9.8 22.9 6.7 75.5 4.1 29.5 2.8 7.5 19.2 General machinery 26.7 8.3 8.9 0.8 6.2 1.9 49.1 4.7 51.6 0.4 12.0 39.2 Miscellaneous mfg. & recycling 182.3 0.6 34.5 1.4 15.7 17.4 220.9 10.3 51.8 0.8 5.8 45.3
MNCs MNCs
Notes and Sources: - = no plants in the category; see the text and Appendix Table 8 for detailed definitions of ownership groups and industries noting that industry definitions differ in important respects between 1996 and 2006; data are authors' compilations from BPS-Statistics (various years).
45

Appendix Table 1i: Number of sample plants1996 2006
Private PrivateIndustry plants SOEs 33-100 33-49 50-89 90+ plants SOEs 33-100 33-49 50-89 90+Manufacturing 18,270 533 1,233 165 604 464 21,662 623 1,992 122 483 1,387Large energy users (12 industries) 14,068 458 941 130 455 356 15,885 510 1,476 97 377 1,002 Food & beverages 3,934 226 139 24 69 46 5,096 202 245 20 75 150 Textiles 1,698 33 108 11 52 45 1,932 41 137 5 45 87 Apparel 1,879 6 108 10 35 63 2,465 33 138 7 15 116 Wood products 1,569 22 56 9 28 19 1,397 17 75 4 18 53 Paper products 316 5 21 3 12 6 430 15 45 6 8 31 Chemicals 796 42 156 24 95 37 864 40 195 16 65 114 Rubber & plastic products 1,279 65 88 9 40 39 1,454 98 160 7 46 107 Non-metallic mineral products 1,524 33 39 10 22 7 1,181 31 64 8 27 29 Basic metals 143 5 32 4 15 13 212 4 57 6 18 33 Electronics-related machinery 406 4 145 11 61 73 325 5 230 7 29 194 Motor vehicles 238 2 30 9 17 4 242 - 82 9 20 53 Other transportation machinery 286 15 19 6 9 4 287 24 48 2 11 35Small energy users (7 industries) 4,202 75 292 35 149 108 5,777 113 516 25 106 385 Tobacco 258 5 7 - 2 5 488 5 9 1 1 7 Leather & footwear 556 8 56 6 31 19 671 8 60 2 16 42 Printing & publishing 603 32 8 3 5 - 803 31 8 2 3 3 Oil & coal products 30 1 5 2 1 2 55 6 9 1 1 7 Metal products 908 13 85 11 48 26 813 22 133 10 29 94 General machinery 288 9 43 9 25 9 321 10 132 5 36 91 Miscellaneous mfg. & recycling 1,559 7 88 4 37 47 2,626 31 165 4 20 141
MNCs MNCs
Notes and Sources: - = no plants in the category; see the text and Appendix Table 8 for detailed definitions of ownership groups and industries noting that industry definitions differ in important respects between 1996 and 2006; data are authors' compilations from BPS-Statistics (various years).
46

Appendix Table 2a: Total energy intensities (means of plant-level ratios of all fuel and electricity expenditures to output, percent)1996 2006
Private PrivateIndustry plants SOEs 33-100 33-49 50-89 90+ plants SOEs 33-100 33-49 50-89 90+Manufacturing 5.37 6.50 3.24 3.53 3.20 3.20 5.83 6.32 5.05 5.49 5.41 4.88Large energy users (12 industries) 5.96 7.07 3.54 3.77 3.59 3.38 6.54 6.76 5.28 6.33 5.50 5.10 Food & beverages 5.83 7.61 3.36 3.62 3.46 3.08 6.49 7.21 5.23 11.73 5.90 4.03 Textiles 4.94 9.36 5.25 5.04 5.75 4.73 6.82 11.13 7.22 9.03 8.73 6.34 Apparel 2.24 1.02 1.93 1.31 1.73 2.14 3.70 8.33 5.53 1.61 9.21 5.30 Wood products 4.65 3.95 3.19 2.37 3.38 3.31 6.05 4.78 4.07 2.66 3.34 4.42 Paper products 5.38 13.16 6.80 3.04 7.06 8.14 5.90 8.44 5.63 2.81 8.84 5.34 Chemicals 5.07 8.30 2.53 3.13 2.42 2.41 6.25 4.33 4.08 4.23 3.48 4.40 Rubber & plastic products 5.68 3.08 3.32 2.84 3.03 3.72 6.57 3.82 5.47 4.32 4.73 5.86 Non-metallic mineral products 15.61 12.52 9.79 13.55 8.04 9.91 14.52 11.74 10.22 9.19 8.63 11.99 Basic metals 5.61 5.53 4.43 2.25 4.92 4.52 5.36 6.83 5.41 4.27 4.81 5.95 Electronics-related machinery 3.19 4.53 2.95 2.02 2.98 3.06 3.76 1.01 3.93 1.14 2.82 4.20 Motor vehicles 3.97 5.51 2.44 2.37 2.70 1.49 5.11 - 4.68 9.81 3.71 4.18 Other transportation machinery 4.39 2.25 2.76 2.60 2.90 2.67 6.17 4.52 5.88 0.95 4.36 6.64Notes and Sources: - = no plants in the category; see the text and Appendix Table 8 for detailed definitions of ownership groups and industries noting that industry definitions differ in important respects between 1996 and 2006; data are authors' compilations from BPS-Statistics (various years).
MNCs MNCs
47

Appendix Table 2b: Electricity intensities (means of plant-level ratios of electricity expenditures to output, percent)1996 2006
Private PrivateIndustry plants SOEs 33-100 33-49 50-89 90+ plants SOEs 33-100 33-49 50-89 90+Manufacturing 2.03 2.81 1.54 1.63 1.43 1.66 2.53 3.12 2.91 2.11 3.06 2.93Large electricity users (12 industries) 2.15 3.01 1.64 1.74 1.53 1.74 2.71 3.34 2.94 2.32 2.94 2.99 Food & beverages 2.11 3.32 1.06 0.82 1.23 0.94 2.22 2.81 1.99 1.44 3.09 1.52 Textiles 2.83 5.60 2.17 1.45 2.32 2.18 4.14 8.69 4.42 6.72 4.70 4.15 Apparel 1.43 0.39 1.29 0.52 0.92 1.61 2.12 7.15 3.05 0.50 6.80 2.72 Wood products 1.74 1.61 1.39 0.71 1.40 1.69 2.33 2.91 1.97 0.72 1.76 2.13 Paper products 2.75 7.02 2.66 0.45 3.45 2.18 3.13 4.04 1.98 0.67 2.57 2.09 Chemicals 2.34 4.33 1.37 2.41 1.13 1.30 2.72 1.56 2.35 2.31 2.03 2.54 Rubber & plastic products 3.73 0.80 1.83 1.58 1.68 2.05 4.39 2.01 3.80 1.73 2.37 4.56 Non-metallic mineral products 1.25 2.24 2.85 6.53 2.03 0.16 1.87 3.85 3.35 1.92 3.24 3.84 Basic metals 2.95 4.50 2.09 0.50 2.58 2.02 2.52 3.11 2.52 2.16 1.64 3.06 Electronics-related machinery 1.80 4.39 1.79 0.94 1.39 2.27 2.56 0.57 3.08 0.82 2.35 3.27 Motor vehicles 2.39 1.49 1.23 1.63 1.09 0.93 3.40 - 3.67 7.60 3.16 3.20 Other transportation machinery 2.02 1.39 1.93 2.20 1.92 1.56 3.03 1.61 3.08 0.40 2.00 3.57
MNCs MNCs
Notes and Sources: - = no plants in the category; see the text and Appendix Table 8 for detailed definitions of ownership groups and industries noting that industry definitions differ in important respects between 1996 and 2006; data are authors' compilations from BPS-Statistics (various years).
48

Appendix Table 2c: Diesel fuel intensities (means of plant-level ratios of diesel and diesel oil expenditures to output, percent)1996 2006
Private PrivateIndustry plants SOEs 33-100 33-49 50-89 90+ plants SOEs 33-100 33-49 50-89 90+Manufacturing 1.24 2.27 0.95 1.01 1.00 0.85 1.55 1.76 1.25 2.47 1.36 1.10Large diesel users (10 industries) 1.65 2.59 1.30 1.19 1.30 1.36 2.08 2.10 1.61 3.41 1.57 1.42 Food & beverages 1.72 3.06 1.54 2.06 1.39 1.49 2.11 2.91 2.57 9.71 2.11 1.85 Textiles 1.29 3.06 2.13 2.62 2.68 1.37 1.08 1.35 1.59 1.16 2.28 1.26 Wood products 1.93 1.71 1.37 1.31 1.42 1.32 2.75 0.90 1.54 1.48 1.33 1.62 Paper products 1.48 0.92 2.30 1.47 1.69 3.92 1.45 1.59 1.57 0.07 3.68 1.32 Chemicals 1.61 2.30 0.66 0.40 0.66 0.82 2.23 1.53 1.07 1.02 0.89 1.19 Rubber & plastic products 1.23 1.42 1.08 0.82 0.78 1.45 1.46 1.45 0.93 2.21 1.27 0.70 Non-metallic mineral products 2.30 3.96 1.90 0.81 2.49 1.62 4.06 2.40 2.47 2.59 0.92 3.89 Basic metals 1.25 0.27 1.00 1.28 0.65 1.30 1.22 0.12 1.79 1.81 2.54 1.37 Motor vehicles 0.75 1.18 0.52 0.54 0.56 0.31 0.86 - 0.52 1.49 0.14 0.51 Other transportation machinery 1.07 0.21 0.33 0.01 0.31 0.88 1.92 1.36 1.91 0.00 1.57 2.13
MNCs MNCs
Notes and Sources: - = no plants in the category; see the text and Appendix Table 8 for detailed definitions of ownership groups and industries noting that industry definitions differ in important respects between 1996 and 2006; data are authors' compilations from BPS-Statistics (various years).
49

Appendix Table 2d: Natural gas fuel intensities (means of plant-level ratios of gas expenditures to output, percent)1996 2006
Private PrivateIndustry plants SOEs 33-100 33-49 50-89 90+ plants SOEs 33-100 33-49 50-89 90+Manufacturing 0.069 0.074 0.120 0.135 0.201 0.010 0.052 0.069 0.144 0.091 0.203 0.128Large gas users (8 industries) 0.103 0.076 0.206 0.215 0.321 0.016 0.082 0.088 0.234 0.140 0.307 0.210 Food & beverages 0.039 0.025 0.057 0.000 0.106 0.013 0.045 0.009 0.042 0.121 0.052 0.027 Textiles 0.024 0.000 0.120 0.136 0.183 0.044 0.026 0.000 0.143 0.000 0.393 0.022 Paper products 0.086 1.658 0.002 0.000 0.000 0.008 0.041 1.502 0.187 0.001 0.970 0.022 Chemicals 0.094 0.025 0.186 0.000 0.306 0.001 0.077 0.000 0.032 0.001 0.042 0.030 Rubber & plastic products 0.019 0.000 0.015 0.000 0.032 0.000 0.054 0.000 0.150 0.000 0.288 0.101 Non-metallic mineral products 0.440 0.457 1.900 1.782 2.558 0.000 0.373 0.182 2.230 0.970 1.815 2.964 Basic metals 0.231 0.313 0.115 0.000 0.224 0.024 0.148 2.302 0.228 0.049 0.000 0.386 Fabricated metals 0.071 0.043 0.097 0.116 0.133 0.023 0.077 0.030 0.135 0.040 0.067 0.166
MNCs MNCs
Notes and Sources: see the text and Appendix Table 8 for detailed definitions of ownership groups and industries noting that industry definitions differ in important respects between 1996 and 2006; data are authors' compilations from BPS-Statistics (various years).
50
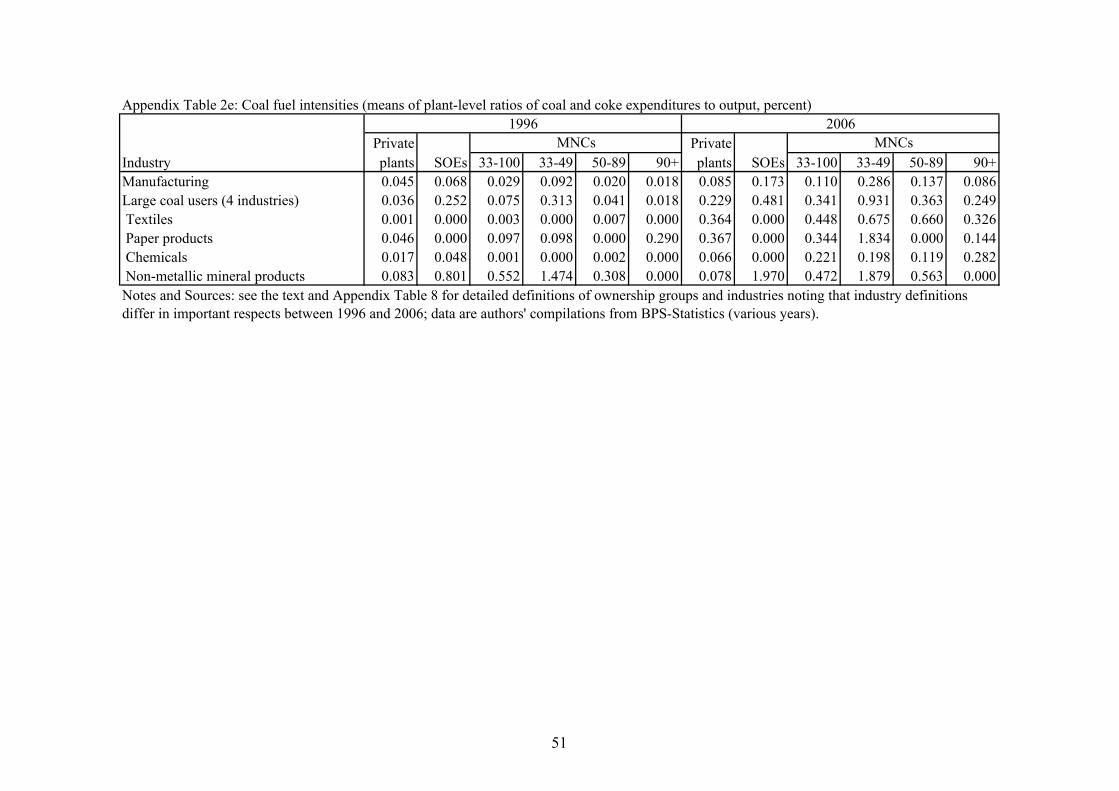
Appendix Table 2e: Coal fuel intensities (means of plant-level ratios of coal and coke expenditures to output, percent)1996 2006
Private PrivateIndustry plants SOEs 33-100 33-49 50-89 90+ plants SOEs 33-100 33-49 50-89 90+Manufacturing 0.045 0.068 0.029 0.092 0.020 0.018 0.085 0.173 0.110 0.286 0.137 0.086Large coal users (4 industries) 0.036 0.252 0.075 0.313 0.041 0.018 0.229 0.481 0.341 0.931 0.363 0.249 Textiles 0.001 0.000 0.003 0.000 0.007 0.000 0.364 0.000 0.448 0.675 0.660 0.326 Paper products 0.046 0.000 0.097 0.098 0.000 0.290 0.367 0.000 0.344 1.834 0.000 0.144 Chemicals 0.017 0.048 0.001 0.000 0.002 0.000 0.066 0.000 0.221 0.198 0.119 0.282 Non-metallic mineral products 0.083 0.801 0.552 1.474 0.308 0.000 0.078 1.970 0.472 1.879 0.563 0.000
MNCs MNCs
Notes and Sources: see the text and Appendix Table 8 for detailed definitions of ownership groups and industries noting that industry definitions differ in important respects between 1996 and 2006; data are authors' compilations from BPS-Statistics (various years).
51

Indepen- 1996 2006dent Initial capital Ending capital No capital Initial capital Ending capital No capitalvariable,statistic Value P-
val. Value P-val. Value P-
val. Value P-val. Value P-
val. Value P-val.
LK i 0.0980 0.00 0.1041 0.00 - - 0.1569 0.00 0.1505 0.00 - - LL i 1.3237 0.00 1.3001 0.00 1.3280 0.00 1.5664 0.00 1.5418 0.00 1.3257 0.00LM i -1.4514 0.00 -1.4525 0.00 -1.3614 0.00 -1.9679 0.00 -1.9816 0.00 -1.8686 0.00LE i 0.2568 0.00 0.2667 0.00 0.2590 0.00 0.5290 0.00 0.5399 0.00 0.5730 0.00RD i -0.0789 0.72 -0.0273 0.90 0.0843 0.66 0.0514 0.56 0.0017 0.98 -0.0367 0.67SM i 0.0209 0.00 0.0204 0.00 0.0203 0.00 0.0269 0.00 0.0267 0.00 0.0372 0.00SH i 0.0057 0.61 0.0050 0.63 0.0003 0.97 0.0222 0.02 0.0288 0.00 0.0264 0.00YR i 0.0235 0.00 0.0212 0.00 0.0187 0.00 0.0359 0.00 0.0342 0.00 0.0493 0.00DS i 0.3017 0.53 0.2310 0.62 0.3064 0.41 0.8454 0.20 0.9661 0.14 0.6020 0.13DF i -0.2025 0.35 -0.1559 0.45 -0.2250 0.16 -0.0402 0.90 -0.2190 0.47 -0.2990 0.21Obs./R2 10,342 0.60 11,173 0.59 15,463 0.55 9,333 0.30 10,187 0.29 17,834 0.26
LK i 0.0976 0.00 0.1036 0.00 - - 0.1577 0.00 0.1512 0.00 - - LL i 1.3227 0.00 1.3007 0.00 1.3295 0.00 1.5728 0.00 1.5488 0.00 1.3241 0.00LM i -1.4491 0.00 -1.4511 0.00 -1.3612 0.00 -1.9725 0.00 -1.9872 0.00 -1.8690 0.00LE i 0.2566 0.00 0.2666 0.00 0.2589 0.00 0.5287 0.00 0.5395 0.00 0.5736 0.00RD i -0.0867 0.69 -0.0326 0.88 0.0829 0.67 0.0558 0.53 0.0069 0.94 -0.0390 0.65SM i 0.0209 0.00 0.0204 0.00 0.0202 0.00 0.0269 0.00 0.0267 0.00 0.0372 0.00SH i 0.0061 0.58 0.0051 0.62 0.0004 0.97 0.0226 0.02 0.0293 0.00 0.0262 0.00YR i 0.0239 0.00 0.0214 0.00 0.0188 0.00 0.0358 0.00 0.0340 0.00 0.0491 0.00DS i 0.2933 0.54 0.2248 0.63 0.3033 0.42 0.8515 0.20 0.9739 0.13 0.6054 0.13DFMIN i -0.7328 0.12 -0.7374 0.12 -0.7289 0.07 -1.1381 0.37 -1.4010 0.25 0.7472 0.50DFMAJ i -0.3950 0.17 -0.2375 0.40 -0.1785 0.42 0.8494 0.08 0.7814 0.09 -0.3071 0.43DFHVY i 0.2410 0.45 0.1384 0.63 -0.0997 0.65 -0.2539 0.50 -0.4524 0.19 -0.3982 0.15TestDFs 2.00 0.14 1.42 0.24 1.03 0.36 2.47 0.08 3.46 0.03 0.52 0.60Obs./R2 10,342 0.60 11,173 0.59 15,463 0.55 9,333 0.30 10,187 0.29 17,834 0.26
LK i -0.0038 0.94 0.0189 0.72 - - 0.1724 0.00 0.1690 0.00 - - LL i 1.2415 0.00 1.2867 0.00 1.1798 0.00 1.9111 0.00 1.8355 0.00 1.7268 0.00LM i -1.4689 0.00 -1.5402 0.00 -1.3756 0.00 -2.9018 0.00 -2.9242 0.00 -2.5762 0.00LE i 0.2441 0.00 0.2541 0.00 0.2285 0.00 0.6995 0.00 0.7180 0.00 0.6241 0.00RD i 0.6304 0.39 0.5861 0.42 0.4776 0.48 -0.1385 0.31 -0.1528 0.28 -0.1884 0.33SM i 0.0358 0.00 0.0343 0.00 0.0369 0.00 0.0547 0.00 0.0564 0.00 0.0618 0.00SH i -0.0251 0.47 -0.0079 0.79 -0.0285 0.26 0.0530 0.02 0.0573 0.01 0.0458 0.01YR i 0.0152 0.16 0.0102 0.32 0.0111 0.20 0.0515 0.00 0.0454 0.00 0.0576 0.00DS i 0.2359 0.74 0.2538 0.71 0.1688 0.75 0.9146 0.25 1.5051 0.06 1.6698 0.01DF i 0.0513 0.93 0.0050 0.99 -0.0387 0.92 1.2665 0.12 1.3189 0.09 1.3340 0.02Obs./R2 3,073 0.67 3,267 0.65 4,297 0.63 3,267 0.29 3,527 0.29 5,541 0.26
Appendix Table 3: OLS Estimates of SOE-Private and MNC-Private Total Energy Intensity Differentials and Other Slope Coefficients from Equations (1) and (2); all p-values based on robust standard errors
12 LARGE ENERGY USING INDUSTRIES COMBINED, eq. (1)
12 LARGE ENERGY USING INDUSTRIES COMBINED, eq. (2)
FOOD AND BEVERAGES, eq. (1)
52

Appendix Table 3 (continued)Indepen- 1996 2006dent Initial capital Ending capital No capital Initial capital Ending capital No capitalvariable,statistic Value P-
val. Value P-val. Value P-
val. Value P-val. Value P-
val. Value P-val.
LK i -0.0082 0.87 0.0153 0.77 - - 0.1744 0.00 0.1708 0.00 - - LL i 1.2491 0.00 1.2998 0.00 1.1807 0.00 1.9039 0.00 1.8323 0.00 1.7024 0.00LM i -1.4658 0.00 -1.5394 0.00 -1.3756 0.00 -2.8992 0.00 -2.9234 0.00 -2.5711 0.00LE i 0.2453 0.00 0.2555 0.00 0.2285 0.00 0.7004 0.00 0.7187 0.00 0.6271 0.00RD i 0.6233 0.40 0.5800 0.43 0.4790 0.48 -0.1272 0.34 -0.1396 0.31 -0.1665 0.36SM i 0.0358 0.00 0.0343 0.00 0.0369 0.00 0.0546 0.00 0.0564 0.00 0.0616 0.00SH i -0.0238 0.49 -0.0074 0.80 -0.0285 0.26 0.0536 0.02 0.0582 0.01 0.0432 0.01YR i 0.0149 0.17 0.0099 0.33 0.0110 0.20 0.0517 0.00 0.0455 0.00 0.0579 0.00DS i 0.2393 0.73 0.2520 0.71 0.1690 0.75 0.9220 0.24 1.5114 0.06 1.6777 0.01DFMIN i -1.9068 0.00 -2.1417 0.00 -0.2221 0.84 1.3248 0.78 0.9381 0.83 7.0111 0.06DFMAJ i 0.3133 0.70 0.2574 0.74 0.0191 0.97 2.3492 0.01 2.5458 0.00 1.6817 0.02DFHVY i 0.5225 0.52 0.4949 0.50 -0.0302 0.95 0.6327 0.53 0.6780 0.48 0.4298 0.49TestDFs 6.38 0.00 7.22 0.00 0.02 0.98 0.97 0.38 1.23 0.29 2.29 0.10Obs./R2 3,073 0.67 3,267 0.65 4,297 0.63 3,267 0.29 3,527 0.29 5,541 0.26
LK i 0.1078 0.23 0.0969 0.24 - - 0.0757 0.19 0.0454 0.43 - - LL i 1.5678 0.00 1.4761 0.00 1.5931 0.00 1.6225 0.00 1.5780 0.00 1.4281 0.00LM i -1.5158 0.00 -1.4588 0.00 -1.4684 0.00 -1.8608 0.00 -1.8458 0.00 -2.1081 0.00LE i 0.3928 0.00 0.4113 0.00 0.3935 0.00 0.8983 0.00 0.9758 0.00 0.9477 0.00RD i 1.7517 0.24 2.1208 0.18 1.6930 0.00 3.9827 0.09 3.6470 0.11 5.6071 0.18SM i 0.0295 0.00 0.0301 0.00 0.0303 0.00 0.0262 0.00 0.0232 0.00 0.0556 0.00SH i 0.0937 0.13 0.0859 0.14 0.0803 0.03 0.0952 0.00 0.0906 0.01 0.0713 0.02YR i 0.0357 0.01 0.0338 0.01 0.0269 0.02 0.0202 0.31 0.0200 0.29 0.0217 0.19DS i 2.7380 0.03 2.2935 0.06 3.3252 0.05 9.9839 0.08 10.0477 0.08 2.4980 0.19DF i 0.3220 0.68 0.3325 0.65 0.1457 0.79 -0.4717 0.50 -0.8486 0.21 -1.2657 0.07Obs./R2 1,306 0.33 1,430 0.33 1,839 0.31 1,184 0.38 1,283 0.37 2,097 0.30
LK i 0.1064 0.23 0.0960 0.25 - - 0.0746 0.20 0.0447 0.44 - - LL i 1.5667 0.00 1.4766 0.00 1.5917 0.00 1.6225 0.00 1.5804 0.00 1.4265 0.00LM i 0.3920 0.00 0.4108 0.00 0.3939 0.00 -1.8619 0.00 -1.8490 0.00 -2.1089 0.00LE i -1.5125 0.00 -1.4577 0.00 -1.4682 0.00 0.8942 0.00 0.9709 0.00 0.9460 0.00RD i 1.8391 0.22 2.1547 0.17 1.6975 0.00 4.0740 0.08 3.7449 0.10 5.5592 0.17SM i 0.0298 0.00 0.0302 0.00 0.0303 0.00 0.0263 0.00 0.0234 0.00 0.0557 0.00SH i 0.0931 0.14 0.0857 0.14 0.0805 0.03 0.0950 0.00 0.0898 0.01 0.0710 0.02YR i 0.0361 0.01 0.0339 0.01 0.0269 0.03 0.0197 0.33 0.0192 0.32 0.0212 0.20DS i 2.7336 0.03 2.2921 0.06 3.3251 0.05 9.9905 0.08 10.0573 0.08 2.5029 0.19DFMIN i 0.5273 0.76 0.5265 0.76 0.5223 0.69 0.8189 0.44 0.5328 0.61 -1.3731 0.33DFMAJ i -0.1142 0.90 0.1157 0.90 0.0732 0.91 0.3407 0.79 0.0848 0.95 -0.7381 0.52DFHVY i 0.6843 0.57 0.5051 0.65 0.1372 0.87 -1.0928 0.11 -1.5074 0.02 -1.5262 0.08TestDFs 0.18 0.84 0.05 0.95 0.05 0.95 1.68 0.19 5.01 0.01 1.82 0.16Obs./R2 1,306 0.33 1,430 0.33 1,839 0.31 1,184 0.38 1,283 0.37 2,097 0.20
TEXTILES, eq. (1)
FOOD AND BEVERAGES, eq. (2)
TEXTILES, eq. (2)
53

Appendix Table 3 (continued)Indepen- 1996 2006dent Initial capital Ending capital No capital Initial capital Ending capital No capitalvariable,statistic Value P-
val. Value P-val. Value P-
val. Value P-val. Value P-
val. Value P-val.
LK i 0.0905 0.06 0.0142 0.64 - - 0.0718 0.00 0.0825 0.00 - - LL i 0.0370 0.70 0.0901 0.28 0.0677 0.39 0.3782 0.00 0.3872 0.00 0.4612 0.04LM i -0.6434 0.00 -0.6536 0.00 -0.7294 0.00 -0.8309 0.00 -0.8767 0.00 -1.1538 0.00LE i 0.3159 0.00 0.3442 0.00 0.4235 0.00 0.3595 0.00 0.4117 0.00 0.7610 0.00RD i -0.0732 0.70 -0.0729 0.71 0.4462 0.55 -0.1170 0.00 -0.1103 0.00 0.0108 0.79SM i 0.0083 0.02 0.0071 0.03 0.0111 0.00 0.0075 0.06 0.0072 0.05 0.0219 0.00SH i 0.0390 0.10 0.0405 0.08 0.0378 0.04 0.0059 0.70 0.0013 0.92 0.0234 0.41YR i 0.0247 0.01 0.0245 0.01 0.0271 0.00 0.0394 0.01 0.0459 0.00 0.0682 0.00DS i -0.7441 0.09 -0.8285 0.06 -0.3836 0.54 -2.1992 0.00 -2.2944 0.00 2.8996 0.09DF i 0.5943 0.08 0.7893 0.03 0.5244 0.05 -0.0768 0.84 -0.0239 0.95 0.2143 0.81Obs./R2 1,131 0.30 1,252 0.29 1,993 0.25 1,303 0.26 1,420 0.27 2,626 0.17
LK i 0.0934 0.05 0.0150 0.62 - - 0.0720 0.00 0.0828 0.00 - - LL i 0.0369 0.70 0.0921 0.27 0.0691 0.38 0.3759 0.00 0.3836 0.00 0.4590 0.04LM i 0.3148 0.00 0.3441 0.00 0.4240 0.00 -0.8296 0.00 -0.8750 0.00 -1.1481 0.00LE i -0.6377 0.00 -0.6517 0.00 -0.7291 0.00 0.3593 0.00 0.4116 0.00 0.7561 0.00RD i -0.1717 0.45 -0.1327 0.54 0.4255 0.57 -0.1170 0.00 -0.1102 0.00 0.0096 0.81SM i 0.0085 0.01 0.0072 0.02 0.0111 0.00 0.0075 0.06 0.0073 0.05 0.0221 0.00SH i 0.0389 0.08 0.0398 0.07 0.0370 0.04 0.0065 0.68 0.0019 0.89 0.0253 0.38YR i 0.0245 0.01 0.0245 0.01 0.0272 0.00 0.0396 0.01 0.0462 0.00 0.0689 0.00DS i -0.7462 0.08 -0.8334 0.06 -0.3872 0.54 -2.1987 0.00 -2.2911 0.00 2.8993 0.09DFMIN i -0.0553 0.90 0.0339 0.94 -0.1176 0.71 -1.1901 0.09 -1.2595 0.09 -2.4658 0.03DFMAJ i -0.4448 0.14 0.2950 0.57 0.3716 0.38 0.2149 0.86 0.2807 0.78 4.3310 0.30DFHVY i 1.3593 0.01 1.2726 0.01 0.7092 0.05 -0.0287 0.94 0.0029 1.00 -0.1281 0.87TestDFs 4.60 0.01 2.11 0.12 1.82 0.16 1.31 0.27 1.35 0.26 2.68 0.07Obs./R2 1,131 0.31 1,252 0.30 1,993 0.25 1,303 0.26 1,420 0.27 2,626 0.18
LK i 0.2340 0.00 0.2029 0.00 - - 0.1162 0.06 0.1081 0.08 - - LL i 1.9846 0.00 2.0013 0.00 1.9725 0.00 2.3420 0.00 2.2016 0.00 1.5305 0.00LM i -2.1357 0.00 -2.1373 0.00 -1.9480 0.00 -2.1551 0.00 -2.0912 0.00 -2.1706 0.00LE i 0.1472 0.00 0.1423 0.00 0.1611 0.00 0.1376 0.03 0.1584 0.01 0.3396 0.00RD i -0.0272 0.96 -0.7150 0.51 0.0134 0.96 1.6250 0.47 1.4648 0.47 3.0907 0.20SM i 0.0195 0.02 0.0207 0.01 0.0198 0.00 0.0073 0.33 0.0038 0.60 0.0210 0.01SH i 0.0757 0.05 0.0691 0.07 0.0374 0.26 0.0189 0.49 0.0543 0.26 0.0486 0.21YR i -0.0137 0.42 -0.0125 0.45 -0.0002 0.99 -0.0147 0.53 -0.0133 0.57 0.0840 0.00DS i 0.7242 0.37 0.6830 0.41 -0.1702 0.77 4.4512 0.45 4.5320 0.43 -2.9665 0.17DF i -0.5021 0.25 -0.0605 0.89 -0.1105 0.78 -0.2232 0.82 -0.4600 0.58 -0.0032 1.00Obs./R2 1,107 0.31 1,181 0.31 1,647 0.28 775 0.25 851 0.24 1,486 0.21
APPAREL, eq. (1)
APPAREL, eq. (2)
WOOD PRODUCTS, eq. (1)
54

Appendix Table 3 (continued)Indepen- 1996 2006dent Initial capital Ending capital No capital Initial capital Ending capital No capitalvariable,statistic Value P-
val. Value P-val. Value P-
val. Value P-val. Value P-
val. Value P-val.
LK i 0.2353 0.00 0.2033 0.00 - - 0.1169 0.05 0.1090 0.07 - - LL i 1.9859 0.00 2.0052 0.00 1.9734 0.00 2.3421 0.00 2.2015 0.00 1.5338 0.00LM i 0.1476 0.00 0.1440 0.00 0.1620 0.00 -2.1531 0.00 -2.0893 0.00 -2.1733 0.00LE i -2.1399 0.00 -2.1414 0.00 -1.9490 0.00 0.1386 0.03 0.1595 0.01 0.3398 0.00RD i -0.0232 0.97 -0.7188 0.50 0.0181 0.95 1.6139 0.47 1.4554 0.48 3.1175 0.20SM i 0.0196 0.02 0.0206 0.01 0.0199 0.00 0.0073 0.33 0.0038 0.60 0.0210 0.01SH i 0.0756 0.06 0.0687 0.07 0.0372 0.26 0.0191 0.48 0.0544 0.26 0.0469 0.23YR i -0.0145 0.39 -0.0132 0.43 -0.0004 0.98 -0.0146 0.54 -0.0134 0.57 0.0838 0.00DS i 0.7344 0.37 0.6980 0.40 -0.1679 0.77 4.4443 0.45 4.5223 0.43 -2.9682 0.17DFMIN i 0.4021 0.54 -0.0985 0.90 -0.3269 0.61 -1.6877 0.01 -1.8477 0.01 1.6493 0.19DFMAJ i -0.3492 0.60 0.5391 0.45 0.2722 0.65 -0.2211 0.89 -0.2288 0.89 0.0133 0.99DFHVY i -1.0417 0.10 -0.7557 0.19 -0.5748 0.29 -0.1017 0.93 -0.4387 0.65 -0.1272 0.89TestDFs 1.36 0.26 1.08 0.34 0.64 0.53 1.23 0.29 1.31 0.27 0.79 0.46Obs./R2 1,107 0.31 1,181 0.31 1,647 0.28 775 0.25 851 0.24 1,486 0.21
LK i 0.2855 0.33 0.2473 0.40 - - 0.3222 0.11 0.2498 0.20 - - LL i 2.5433 0.00 2.1865 0.00 2.0602 0.00 2.9950 0.01 3.0868 0.00 1.4871 0.01LM i -2.0858 0.00 -1.9974 0.00 -1.6169 0.00 -2.4569 0.00 -2.3647 0.00 -1.3449 0.00LE i 0.4896 0.00 0.5358 0.00 0.5120 0.00 0.7412 0.00 0.6673 0.00 0.6928 0.00RD i 0.6376 0.49 0.7192 0.50 1.0534 0.37 -1.4205 0.42 -1.6017 0.35 -1.7905 0.14SM i 0.0505 0.01 0.0449 0.01 0.0328 0.02 0.0141 0.43 0.0140 0.42 0.0203 0.18SH i -0.0469 0.63 -0.1124 0.18 -0.0922 0.07 -0.1331 0.01 -0.1327 0.01 -0.1228 0.01YR i 0.0049 0.89 0.0042 0.91 0.0028 0.92 0.0180 0.69 0.0205 0.64 0.0183 0.57DS i 6.1690 0.14 6.4640 0.10 5.8057 0.05 -2.3363 0.60 -2.7228 0.53 0.8333 0.75DF i 0.4859 0.67 1.4496 0.40 0.9288 0.42 1.4167 0.41 0.4231 0.79 -0.5152 0.66Obs./R2 186 0.38 214 0.37 339 0.36 229 0.26 263 0.26 490 0.19
LK i 0.2821 0.33 0.2510 0.38 - - 0.3143 0.12 0.2431 0.21 - - LL i 2.4597 0.00 2.1978 0.00 2.0465 0.00 3.0192 0.01 3.1579 0.00 1.4939 0.01LM i 0.4816 0.00 0.5349 0.00 0.5172 0.00 -2.5117 0.00 -2.4701 0.00 -1.3676 0.00LE i -1.9970 0.00 -2.0065 0.00 -1.6088 0.00 0.7437 0.00 0.6676 0.00 0.6860 0.00RD i 0.6294 0.50 0.7186 0.50 1.0452 0.38 -1.2518 0.49 -1.4190 0.41 -1.6319 0.19SM i 0.0507 0.01 0.0447 0.01 0.0328 0.02 0.0152 0.40 0.0160 0.36 0.0215 0.16SH i -0.0752 0.43 -0.1080 0.19 -0.0947 0.06 -0.1297 0.01 -0.1240 0.01 -0.1234 0.01YR i 0.0048 0.90 0.0041 0.91 0.0031 0.92 0.0180 0.70 0.0191 0.67 0.0172 0.60DS i 6.2196 0.14 6.4340 0.10 5.8426 0.05 -2.1258 0.64 -2.4872 0.57 0.8931 0.73DFMIN i - - - - - - -2.9980 0.05 -5.3068 0.02 -2.1387 0.48DFMAJ i -0.3370 0.75 1.6077 0.47 1.1714 0.48 3.2408 0.36 2.9849 0.38 1.8674 0.55DFHVY i 4.3113 0.26 1.0823 0.66 1.0809 0.61 1.4229 0.49 0.6207 0.73 -0.7799 0.55TestDFs 1.38 0.24 0.03 0.87 0.00 0.97 2.44 0.09 3.19 0.04 0.44 0.64Obs./R2 186 0.38 214 0.37 336 0.36 229 0.26 263 0.26 490 0.10
PAPER PRODUCTS, eq. (2), minority-foreign & East Indonesian plants omitted for 1996
WOOD PRODUCTS, eq. (2)
PAPER PRODUCTS, eq. (1); East Indonesian plants omitted for 1996
55

Appendix Table 3 (continued)Indepen- 1996 2006dent Initial capital Ending capital No capital Initial capital Ending capital No capitalvariable,statistic Value P-
val. Value P-val. Value P-
val. Value P-val. Value P-
val. Value P-val.
LK i 0.1357 0.22 0.1370 0.20 - - -0.0517 0.69 -0.0533 0.65 - - LL i 0.7594 0.03 0.9521 0.00 1.4088 0.00 2.1574 0.00 2.2869 0.00 0.7110 0.04LM i -1.5152 0.00 -1.5428 0.00 -1.5375 0.00 -1.9543 0.00 -2.1455 0.00 -1.2537 0.00LE i 0.4932 0.00 0.4694 0.00 0.4082 0.00 0.3829 0.00 0.3708 0.00 0.5485 0.00RD i -0.2381 0.14 -0.2177 0.14 -0.2345 0.10 1.5157 0.01 -0.3002 0.64 -0.4769 0.33SM i 0.0214 0.09 0.0202 0.09 0.0198 0.04 0.0063 0.63 0.0158 0.27 0.0071 0.52SH i -0.0134 0.53 -0.0103 0.61 -0.0160 0.33 0.0024 0.91 0.0245 0.37 -0.0017 0.94YR i -0.0201 0.25 -0.0092 0.59 -0.0059 0.72 0.0082 0.71 0.0137 0.56 0.0202 0.25DS i 4.1615 0.03 3.5609 0.06 2.2945 0.14 0.7666 0.65 1.1918 0.45 -0.7669 0.39DF i -0.0622 0.92 0.1954 0.74 -0.3079 0.52 -0.2882 0.79 -0.4983 0.62 -1.7562 0.01Obs./R2 630 0.34 665 0.34 993 0.30 493 0.30 544 0.31 1,096 0.16
LK i 0.1346 0.22 0.1369 0.20 - - -0.0523 0.68 -0.0540 0.65 - - LL i 0.7689 0.03 0.9602 0.00 1.4328 0.00 2.1725 0.00 2.2943 0.00 0.7154 0.04LM i 0.4938 0.00 0.4697 0.00 0.4110 0.00 -1.9524 0.00 -2.1445 0.00 -1.2484 0.00LE i -1.5248 0.00 -1.5496 0.00 -1.5588 0.00 0.3814 0.00 0.3698 0.00 0.5499 0.00RD i -0.2266 0.17 -0.2106 0.16 -0.2161 0.15 1.6037 0.01 -0.2839 0.67 -0.4753 0.34SM i 0.0214 0.09 0.0201 0.09 0.0196 0.04 0.0064 0.63 0.0159 0.27 0.0070 0.53SH i -0.0134 0.54 -0.0100 0.62 -0.0166 0.30 0.0000 1.00 0.0234 0.40 -0.0024 0.92YR i -0.0202 0.25 -0.0094 0.59 -0.0060 0.72 0.0101 0.65 0.0145 0.54 0.0204 0.24DS i 4.1727 0.03 3.5679 0.06 2.2989 0.14 0.6791 0.68 1.1616 0.46 -0.7854 0.38DFMIN i -0.0092 0.99 0.2039 0.83 -0.7744 0.39 -1.8007 0.15 -1.4031 0.22 -1.8836 0.07DFMAJ i 0.2711 0.73 0.4235 0.55 0.3226 0.56 -0.7091 0.53 -0.6383 0.54 -2.4560 0.00DFHVY i -0.7863 0.31 -0.2637 0.69 -1.4256 0.03 0.2618 0.86 -0.2257 0.87 -1.3416 0.16TestDFs 0.80 0.45 0.46 0.63 3.15 0.04 0.75 0.47 0.30 0.74 0.46 0.46Obs./R2 630 0.34 665 0.34 993 0.30 493 0.30 544 0.31 1,096 0.23
LK i 0.2869 0.01 0.3643 0.00 - - 0.0017 0.98 -0.0017 0.98 - - LL i 0.7390 0.00 0.7331 0.00 0.8915 0.00 0.7266 0.01 0.6460 0.01 0.5560 0.07LM i -1.6508 0.00 -1.6943 0.00 -1.4874 0.00 -1.5462 0.00 -1.4841 0.00 -1.4730 0.00LE i 0.4162 0.00 0.4385 0.00 0.4002 0.00 0.5409 0.00 0.5109 0.00 0.5136 0.00RD i 0.0500 0.81 0.0129 0.95 0.1994 0.25 1.2275 0.54 1.2504 0.49 1.1962 0.48SM i 0.0081 0.25 0.0053 0.44 0.0066 0.24 0.0187 0.02 0.0118 0.15 0.0128 0.07SH i -0.0193 0.40 -0.0373 0.07 -0.0145 0.41 -0.0213 0.36 -0.0132 0.56 0.0053 0.83YR i 0.0189 0.25 0.0138 0.38 0.0078 0.50 -0.0077 0.68 -0.0062 0.73 0.0057 0.70DS i -0.9482 0.17 -1.1290 0.08 0.0462 0.94 -0.4337 0.70 -1.0144 0.33 -1.1318 0.06DF i -0.3007 0.58 -0.6996 0.15 -0.3458 0.39 0.2159 0.79 0.1563 0.83 0.0523 0.94Obs./R2 868 0.24 972 0.25 1,432 0.22 744 0.23 848 0.21 1,711 0.18
CHEMICALS, eq. (2)
RUBBER & PLASTIC PRODUCTS, eq. (1)
CHEMICALS, eq. (1)
56

Appendix Table 3 (continued)Indepen- 1996 2006dent Initial capital Ending capital No capital Initial capital Ending capital No capitalvariable,statistic Value P-
val. Value P-val. Value P-
val. Value P-val. Value P-
val. Value P-val.
LK i 0.2885 0.01 0.3649 0.00 - - 0.0073 0.92 0.0020 0.98 - - LL i 0.7419 0.00 0.7328 0.00 0.8916 0.00 0.7404 0.01 0.6578 0.01 0.5561 0.07LM i 0.4152 0.00 0.4384 0.00 0.4002 0.00 -1.5649 0.00 -1.4989 0.00 -1.4732 0.00LE i -1.6527 0.00 -1.6942 0.00 -1.4858 0.00 0.5438 0.00 0.5134 0.00 0.5136 0.00RD i 0.0375 0.85 0.0096 0.96 0.1947 0.25 1.0575 0.56 1.1205 0.49 1.1994 0.47SM i 0.0079 0.26 0.0053 0.44 0.0065 0.25 0.0189 0.02 0.0118 0.15 0.0128 0.07SH i -0.0191 0.40 -0.0372 0.07 -0.0143 0.41 -0.0214 0.36 -0.0132 0.56 0.0053 0.83YR i 0.0194 0.25 0.0140 0.38 0.0080 0.49 -0.0086 0.65 -0.0070 0.70 0.0057 0.70DS i -0.9727 0.17 -1.1350 0.08 0.0407 0.94 -0.4045 0.72 -0.9896 0.35 -1.1311 0.06DFMIN i -0.5443 0.74 -0.7029 0.66 -1.2267 0.26 1.6866 0.57 1.6698 0.56 0.3246 0.86DFMAJ i -0.7249 0.35 -0.8311 0.21 -0.4804 0.33 1.9083 0.15 1.7224 0.20 0.0380 0.96DFHVY i 0.2017 0.79 -0.5631 0.42 -0.0013 1.00 -0.3902 0.68 -0.3968 0.65 0.0409 0.96TestDFs 0.42 0.66 0.04 0.96 0.51 0.60 1.19 0.30 1.10 0.33 0.01 0.99Obs./R2 868 0.24 972 0.25 1,432 0.22 744 0.23 848 0.21 1,711 0.18
LK i 0.1145 0.66 0.0259 0.91 - - 0.3162 0.03 0.3326 0.02 - - LL i 2.2895 0.00 2.2830 0.00 2.7008 0.00 3.8294 0.00 3.9638 0.00 3.5439 0.00LM i -1.6181 0.00 -1.6322 0.00 -1.6376 0.00 -2.3147 0.00 -2.4568 0.00 -2.2813 0.00LE i -0.0266 0.76 0.0187 0.83 0.0361 0.61 0.0765 0.64 0.0572 0.71 0.1849 0.06RD i -0.5072 0.58 0.4204 0.73 -0.3219 0.78 -6.2639 0.07 -6.1871 0.08 -4.6991 0.13SM i 0.0116 0.54 0.0098 0.58 0.0058 0.69 -0.0156 0.43 -0.0123 0.52 -0.0180 0.29SH i 0.0169 0.81 0.0136 0.84 -0.0053 0.92 0.0665 0.42 0.0448 0.56 0.0987 0.13YR i 0.0793 0.04 0.0668 0.07 0.0767 0.02 -0.0104 0.83 -0.0136 0.77 0.0528 0.12DS i -0.8752 0.75 -0.9236 0.73 -0.8822 0.65 6.4073 0.15 6.8196 0.12 -1.4511 0.45DF i -3.0950 0.07 -2.9576 0.08 -2.1041 0.14 -2.2913 0.45 -1.6446 0.56 -4.6052 0.01Obs./R2 1,217 0.53 1,288 0.53 1,595 0.50 672 0.24 710 0.25 1,275 0.27
LK i 0.1102 0.67 0.0168 0.95 - - 0.3034 0.03 0.3206 0.02 - - LL i 2.2438 0.00 2.2348 0.00 2.6919 0.00 4.1300 0.00 4.2326 0.00 3.6404 0.00LM i -0.0274 0.75 0.0179 0.83 0.0369 0.60 -2.3487 0.00 -2.4816 0.00 -2.2909 0.00LE i -1.5902 0.00 -1.6039 0.00 -1.6306 0.00 0.0423 0.79 0.0248 0.87 0.1751 0.08RD i -0.6438 0.47 0.3266 0.79 -0.4240 0.72 -5.7579 0.08 -5.6684 0.08 -4.6695 0.12SM i 0.0127 0.50 0.0108 0.55 0.0061 0.68 -0.0142 0.47 -0.0111 0.56 -0.0168 0.32SH i 0.0180 0.80 0.0146 0.83 -0.0042 0.94 0.0581 0.49 0.0402 0.61 0.0925 0.17YR i 0.0798 0.04 0.0672 0.07 0.0767 0.03 -0.0038 0.94 -0.0076 0.87 0.0540 0.11DS i -0.8654 0.76 -0.8941 0.74 -0.8802 0.66 6.2261 0.15 6.6048 0.12 -1.5117 0.43DFMIN i -1.1694 0.76 -0.4555 0.91 -1.4996 0.69 -8.6518 0.00 -7.5979 0.00 -6.8755 0.03DFMAJ i -4.9749 0.02 -4.9252 0.02 -2.8240 0.08 -7.2340 0.03 -6.6375 0.03 -7.3382 0.00DFHVY i -1.0907 0.54 -1.4620 0.42 -0.7750 0.65 1.5077 0.74 1.5874 0.69 -1.6037 0.57TestDFs 1.23 0.29 1.17 0.31 0.40 0.67 2.09 0.12 2.19 0.11 1.74 0.18Obs./R2 1,217 0.53 1,288 0.53 1,595 0.50 672 0.25 710 0.26 1,275 0.27
RUBBER & PLASTIC PRODUCTS, eq. (2)
NON-METALLIC MINERAL PRODUCTS, eq. (1)
NON-METALLIC MINERAL PRODUCTS, eq. (2)
57
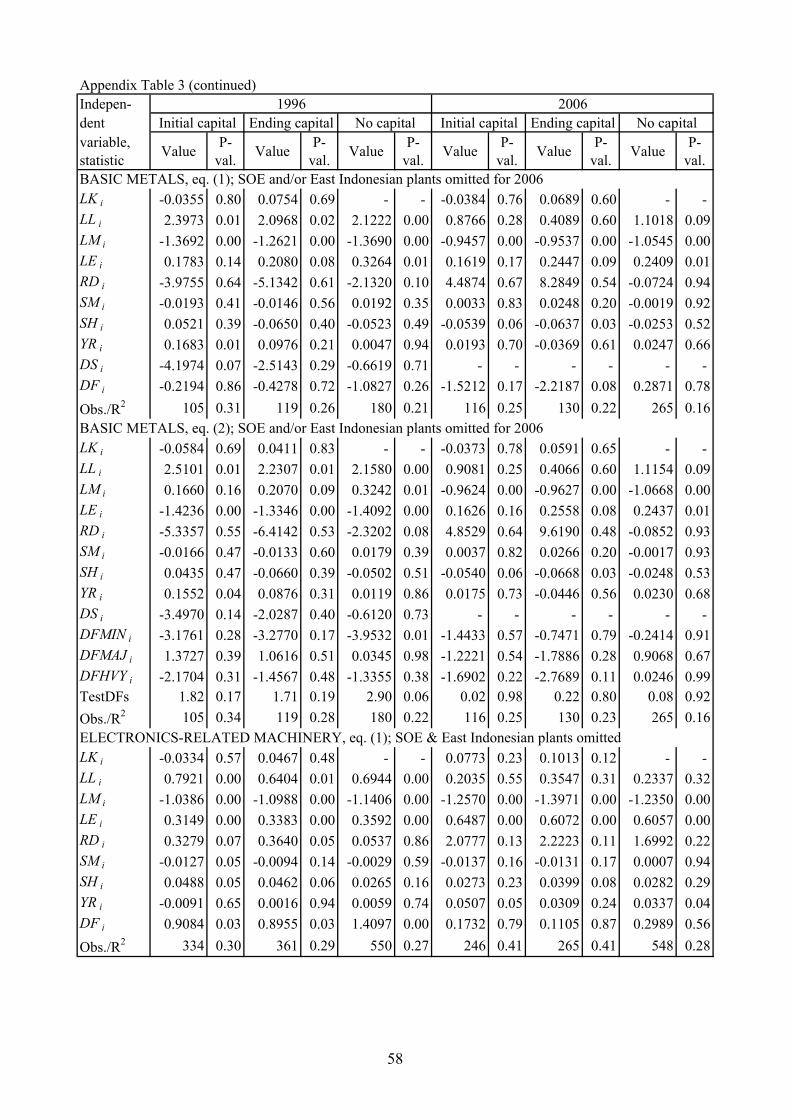
Appendix Table 3 (continued)Indepen- 1996 2006dent Initial capital Ending capital No capital Initial capital Ending capital No capitalvariable,statistic Value P-
val. Value P-val. Value P-
val. Value P-val. Value P-
val. Value P-val.
LK i -0.0355 0.80 0.0754 0.69 - - -0.0384 0.76 0.0689 0.60 - - LL i 2.3973 0.01 2.0968 0.02 2.1222 0.00 0.8766 0.28 0.4089 0.60 1.1018 0.09LM i -1.3692 0.00 -1.2621 0.00 -1.3690 0.00 -0.9457 0.00 -0.9537 0.00 -1.0545 0.00LE i 0.1783 0.14 0.2080 0.08 0.3264 0.01 0.1619 0.17 0.2447 0.09 0.2409 0.01RD i -3.9755 0.64 -5.1342 0.61 -2.1320 0.10 4.4874 0.67 8.2849 0.54 -0.0724 0.94SM i -0.0193 0.41 -0.0146 0.56 0.0192 0.35 0.0033 0.83 0.0248 0.20 -0.0019 0.92SH i 0.0521 0.39 -0.0650 0.40 -0.0523 0.49 -0.0539 0.06 -0.0637 0.03 -0.0253 0.52YR i 0.1683 0.01 0.0976 0.21 0.0047 0.94 0.0193 0.70 -0.0369 0.61 0.0247 0.66DS i -4.1974 0.07 -2.5143 0.29 -0.6619 0.71 - - - - - - DF i -0.2194 0.86 -0.4278 0.72 -1.0827 0.26 -1.5212 0.17 -2.2187 0.08 0.2871 0.78Obs./R2 105 0.31 119 0.26 180 0.21 116 0.25 130 0.22 265 0.16
LK i -0.0584 0.69 0.0411 0.83 - - -0.0373 0.78 0.0591 0.65 - - LL i 2.5101 0.01 2.2307 0.01 2.1580 0.00 0.9081 0.25 0.4066 0.60 1.1154 0.09LM i 0.1660 0.16 0.2070 0.09 0.3242 0.01 -0.9624 0.00 -0.9627 0.00 -1.0668 0.00LE i -1.4236 0.00 -1.3346 0.00 -1.4092 0.00 0.1626 0.16 0.2558 0.08 0.2437 0.01RD i -5.3357 0.55 -6.4142 0.53 -2.3202 0.08 4.8529 0.64 9.6190 0.48 -0.0852 0.93SM i -0.0166 0.47 -0.0133 0.60 0.0179 0.39 0.0037 0.82 0.0266 0.20 -0.0017 0.93SH i 0.0435 0.47 -0.0660 0.39 -0.0502 0.51 -0.0540 0.06 -0.0668 0.03 -0.0248 0.53YR i 0.1552 0.04 0.0876 0.31 0.0119 0.86 0.0175 0.73 -0.0446 0.56 0.0230 0.68DS i -3.4970 0.14 -2.0287 0.40 -0.6120 0.73 - - - - - - DFMIN i -3.1761 0.28 -3.2770 0.17 -3.9532 0.01 -1.4433 0.57 -0.7471 0.79 -0.2414 0.91DFMAJ i 1.3727 0.39 1.0616 0.51 0.0345 0.98 -1.2221 0.54 -1.7886 0.28 0.9068 0.67DFHVY i -2.1704 0.31 -1.4567 0.48 -1.3355 0.38 -1.6902 0.22 -2.7689 0.11 0.0246 0.99TestDFs 1.82 0.17 1.71 0.19 2.90 0.06 0.02 0.98 0.22 0.80 0.08 0.92Obs./R2 105 0.34 119 0.28 180 0.22 116 0.25 130 0.23 265 0.16
LK i -0.0334 0.57 0.0467 0.48 - - 0.0773 0.23 0.1013 0.12 - - LL i 0.7921 0.00 0.6404 0.01 0.6944 0.00 0.2035 0.55 0.3547 0.31 0.2337 0.32LM i -1.0386 0.00 -1.0988 0.00 -1.1406 0.00 -1.2570 0.00 -1.3971 0.00 -1.2350 0.00LE i 0.3149 0.00 0.3383 0.00 0.3592 0.00 0.6487 0.00 0.6072 0.00 0.6057 0.00RD i 0.3279 0.07 0.3640 0.05 0.0537 0.86 2.0777 0.13 2.2223 0.11 1.6992 0.22SM i -0.0127 0.05 -0.0094 0.14 -0.0029 0.59 -0.0137 0.16 -0.0131 0.17 0.0007 0.94SH i 0.0488 0.05 0.0462 0.06 0.0265 0.16 0.0273 0.23 0.0399 0.08 0.0282 0.29YR i -0.0091 0.65 0.0016 0.94 0.0059 0.74 0.0507 0.05 0.0309 0.24 0.0337 0.04DF i 0.9084 0.03 0.8955 0.03 1.4097 0.00 0.1732 0.79 0.1105 0.87 0.2989 0.56Obs./R2 334 0.30 361 0.29 550 0.27 246 0.41 265 0.41 548 0.28
BASIC METALS, eq. (1); SOE and/or East Indonesian plants omitted for 2006
BASIC METALS, eq. (2); SOE and/or East Indonesian plants omitted for 2006
ELECTRONICS-RELATED MACHINERY, eq. (1); SOE & East Indonesian plants omitted
58

Appendix Table 3 (continued)Indepen- 1996 2006dent Initial capital Ending capital No capital Initial capital Ending capital No capitalvariable,statistic Value P-
val. Value P-val. Value P-
val. Value P-val. Value P-
val. Value P-val.
LK i -0.0333 0.57 0.0475 0.47 - - 0.0926 0.15 0.1158 0.07 - - LL i 0.8098 0.00 0.6578 0.01 0.6874 0.00 0.1327 0.70 0.2793 0.42 0.1976 0.40LM i 0.3088 0.00 0.3305 0.00 0.3557 0.00 -1.2853 0.00 -1.4210 0.00 -1.2372 0.00LE i -1.0477 0.00 -1.1070 0.00 -1.1433 0.00 0.6412 0.00 0.6029 0.00 0.6068 0.00RD i 0.3030 0.11 0.3355 0.08 0.0394 0.90 1.7286 0.21 1.8093 0.21 1.4052 0.30SM i -0.0125 0.05 -0.0092 0.15 -0.0032 0.57 -0.0139 0.15 -0.0133 0.16 0.0004 0.97SH i 0.0490 0.05 0.0465 0.05 0.0268 0.15 0.0280 0.22 0.0396 0.08 0.0307 0.25YR i -0.0066 0.75 0.0044 0.84 0.0093 0.60 0.0647 0.03 0.0457 0.12 0.0439 0.01DFMIN i 0.1314 0.68 0.1766 0.60 0.3854 0.30 -1.8094 0.21 -1.8516 0.27 -1.4761 0.17DFMAJ i 0.8313 0.07 0.7317 0.12 1.4497 0.01 -1.6610 0.08 -1.8266 0.04 -1.3683 0.05DFHVY i 1.2260 0.06 1.3036 0.04 1.6683 0.00 0.7197 0.40 0.6542 0.43 0.7440 0.18TestDFs 1.80 0.17 1.58 0.21 2.71 0.07 1.99 0.14 2.17 0.12 5.08 0.01Obs./R2 334 0.30 361 0.30 550 0.27 246 0.42 265 0.43 548 0.29
LK i 0.1524 0.26 0.0647 0.66 - - -0.0612 0.71 -0.0777 0.56 - - LL i 2.0697 0.00 2.1575 0.00 1.7695 0.00 2.1934 0.01 1.8175 0.03 0.6706 0.14LM i -2.3532 0.00 -2.3252 0.00 -1.8999 0.00 -2.6102 0.00 -2.3459 0.00 -1.6509 0.00LE i 0.5181 0.01 0.5488 0.01 0.5083 0.00 0.8227 0.00 0.9323 0.00 0.8497 0.00RD i -0.7919 0.24 -0.7520 0.12 -1.0821 0.01 0.8605 0.79 -0.1973 0.93 -1.7729 0.28SM i 0.0054 0.62 0.0050 0.62 0.0086 0.31 0.0106 0.67 0.0007 0.98 0.0014 0.95SH i 0.0586 0.20 0.0606 0.17 0.0496 0.11 -0.0671 0.23 -0.0487 0.33 -0.0514 0.22YR i -0.0961 0.04 -0.0951 0.04 -0.0526 0.12 0.0023 0.97 0.0317 0.54 0.1136 0.01DF i 0.8239 0.41 0.4092 0.68 -0.1996 0.78 -0.2242 0.85 -0.4547 0.70 0.6541 0.35Obs./R2 168 0.39 185 0.38 261 0.38 131 0.46 150 0.41 320 0.29
LK i 0.1233 0.37 0.0424 0.77 - - -0.0609 0.72 -0.0807 0.54 - - LL i 2.1543 0.00 2.2262 0.00 1.8724 0.00 2.1936 0.01 1.8193 0.03 0.7164 0.13LM i 0.5257 0.01 0.5531 0.00 0.5135 0.00 -2.6098 0.00 -2.3565 0.00 -1.6735 0.00LE i -2.3690 0.00 -2.3396 0.00 -1.9462 0.00 0.8224 0.00 0.9360 0.00 0.8339 0.00RD i -1.0767 0.24 -0.9191 0.14 -1.1922 0.01 0.8621 0.79 -0.2005 0.93 -1.3587 0.40SM i 0.0036 0.74 0.0034 0.74 0.0073 0.39 0.0106 0.67 0.0009 0.97 0.0032 0.88SH i 0.0697 0.13 0.0700 0.12 0.0623 0.05 -0.0672 0.24 -0.0476 0.34 -0.0511 0.22YR i -0.1002 0.03 -0.0977 0.03 -0.0561 0.10 0.0024 0.97 0.0301 0.57 0.1051 0.03DFMIN i -0.4658 0.68 -0.7116 0.53 -1.9092 0.11 -0.1911 0.90 -0.9142 0.54 4.8395 0.31DFMAJ i 2.0377 0.30 1.2121 0.52 0.6098 0.54 -0.2458 0.88 -0.0612 0.97 0.5244 0.74DFHVY i 0.7931 0.41 0.7361 0.42 -0.1751 0.83 -0.2222 0.87 -0.5131 0.71 -0.1605 0.84TestDFs 0.70 0.50 0.64 0.53 1.43 0.24 0.00 1.00 0.10 0.90 0.52 0.59Obs./R2 168 0.40 185 0.39 261 0.38 131 0.46 150 0.41 320 0.31
ELECTRONICS-RELATED MACHINERY, eq. (2); SOE & East Indonesian plants omitted
MOTOR VEHICLES, eq. (1); SOE & East Indonesian plants omitted
MOTOR VEHICLES, eq. (2); SOE and East Indonesian plants omitted
59

Appendix Table 3 (continued)Indepen- 1996 2006dent Initial capital Ending capital No capital Initial capital Ending capital No capitalvariable,statistic Value P-
val. Value P-val. Value P-
val. Value P-val. Value P-
val. Value P-val.
LK i 0.0450 0.74 0.2134 0.19 - - 0.3409 0.18 0.3466 0.11 - - LL i 1.2495 0.01 0.7558 0.13 0.4354 0.19 -0.8188 0.33 -0.8789 0.26 1.0465 0.19LM i -1.6373 0.00 -1.3919 0.00 -1.0617 0.00 -1.0299 0.13 -0.9680 0.11 -1.4881 0.01LE i 0.4192 0.00 0.3240 0.00 0.3302 0.00 0.5297 0.00 0.5238 0.00 0.5607 0.06RD i -0.2404 0.67 -0.4582 0.40 0.1639 0.76 1.1882 0.14 1.2525 0.11 1.4273 0.25SM i 0.0225 0.07 0.0337 0.02 0.0249 0.02 0.0474 0.02 0.0432 0.03 0.0340 0.03SH i 0.0120 0.79 0.0429 0.51 0.1032 0.05 -0.0072 0.89 0.0018 0.97 0.0105 0.82YR i 0.0442 0.28 0.0417 0.32 0.0500 0.16 -0.0192 0.57 -0.0331 0.28 0.0038 0.90DS i -2.1724 0.05 -2.7168 0.01 -3.4650 0.00 -1.0354 0.53 -0.7599 0.63 -1.5572 0.26DF i 0.2072 0.77 -1.0595 0.21 -0.8539 0.26 -0.3054 0.85 0.5313 0.70 0.0881 0.95Obs./R2 207 0.34 227 0.25 320 0.24 166 0.18 187 0.18 357 0.17
LK i 0.0444 0.74 0.2134 0.19 - - 0.3502 0.17 0.3615 0.10 - - LL i 1.2160 0.02 0.7466 0.15 0.4463 0.19 -0.8653 0.30 -0.9044 0.24 1.0622 0.18LM i 0.4212 0.00 0.3245 0.00 0.3282 0.00 -1.0050 0.14 -0.9489 0.12 -1.4755 0.01LE i -1.6268 0.00 -1.3888 0.00 -1.0486 0.00 0.5306 0.00 0.5271 0.00 0.5624 0.06RD i -0.2356 0.68 -0.4593 0.41 0.1928 0.71 1.2481 0.13 1.3124 0.11 1.4847 0.24SM i 0.0222 0.08 0.0336 0.03 0.0241 0.02 0.0477 0.02 0.0434 0.03 0.0340 0.03SH i 0.0132 0.77 0.0431 0.52 0.1094 0.04 -0.0083 0.88 -0.0008 0.99 0.0075 0.88YR i 0.0456 0.28 0.0421 0.33 0.0560 0.12 -0.0163 0.63 -0.0308 0.31 0.0069 0.83DS i -2.1725 0.05 -2.7153 0.02 -3.5940 0.00 -1.0014 0.54 -0.7045 0.66 -1.5354 0.27DFMAJ i 0.0756 0.93 -1.0814 0.30 -1.1621 0.21 -2.0938 0.38 -1.0176 0.57 -1.0290 0.43DFHVY i 0.8307 0.60 -0.8661 0.61 0.1676 0.91 0.1250 0.94 0.9587 0.52 0.6209 0.71TestDFs 0.17 0.68 0.01 0.91 0.71 0.40 0.87 0.35 1.28 0.26 0.97 0.33Obs./R2 206 0.34 226 0.25 314 0.24 165 0.19 186 0.18 355 0.17
Notes: - = estimate could not be obtained; in the Obs./R2 rows, the coefficient column contains the number of observations and the P-value column contains the R-squared; the TestDFs rows show Wald tests of the hypothesis that coefficients on all foreign ownership dummies are equal and associated p-values; industry and region dummies also included as relevant (see explanation in the text); full results including the constant and all dummies are available from the authors.
OTHER TRANSPORTATION MACHINERY, eq. (1)
OTHER TRANSPORTATION MACHINERY, eq. (2); minority-foreign plants omitted
60

Indepen- 1996 2006dent Initial capital Ending capital No capital Initial capital Ending capital No capitalvariable,statistic Value P-
val. Value P-val. Value P-
val. Value P-val. Value P-
val. Value P-val.
LK i 0.0500 0.02 0.0568 0.01 - - 0.0474 0.00 0.0480 0.00 - - LL i 0.5276 0.00 0.5116 0.00 0.5231 0.00 0.6664 0.00 0.6842 0.00 0.4607 0.00LM i -0.8279 0.00 -0.8312 0.00 -0.7884 0.00 -1.0993 0.00 -1.1585 0.00 -1.0463 0.00LE i 0.4118 0.00 0.4186 0.00 0.4086 0.00 0.5738 0.00 0.5974 0.00 0.6319 0.00RD i -0.0381 0.84 -0.0084 0.96 -0.0339 0.80 0.0109 0.87 0.0106 0.87 -0.0465 0.37SM i 0.0095 0.00 0.0098 0.00 0.0103 0.00 0.0183 0.00 0.0186 0.00 0.0243 0.00SH i 0.0041 0.61 0.0002 0.98 -0.0009 0.88 0.0218 0.00 0.0264 0.00 0.0236 0.00YR i 0.0065 0.13 0.0071 0.09 0.0073 0.04 0.0149 0.01 0.0120 0.02 0.0218 0.00DS i 0.6268 0.09 0.5490 0.11 0.7569 0.01 1.0727 0.04 1.1904 0.02 0.9896 0.00DF i -0.0228 0.87 -0.0300 0.82 -0.0381 0.71 -0.1277 0.47 -0.1860 0.27 -0.0468 0.78Obs./R2 10,342 0.48 11,173 0.47 15,465 0.45 9,336 0.24 10,191 0.24 17,862 0.22
LK i 0.0500 0.02 0.0567 0.01 - - 0.0480 0.00 0.0485 0.00 - - LL i 0.5263 0.00 0.5112 0.00 0.5231 0.00 0.6729 0.00 0.6906 0.00 0.4611 0.00LM i -0.8267 0.00 -0.8306 0.00 -0.7880 0.00 -1.1044 0.00 -1.1640 0.00 -1.0469 0.00LE i 0.4116 0.00 0.4185 0.00 0.4086 0.00 0.5737 0.00 0.5972 0.00 0.6319 0.00RD i -0.0411 0.83 -0.0096 0.96 -0.0345 0.80 0.0143 0.83 0.0145 0.82 -0.0462 0.37SM i 0.0095 0.00 0.0098 0.00 0.0103 0.00 0.0183 0.00 0.0186 0.00 0.0243 0.00SH i 0.0043 0.59 0.0002 0.98 -0.0009 0.89 0.0221 0.00 0.0268 0.00 0.0236 0.00YR i 0.0067 0.12 0.0072 0.08 0.0074 0.04 0.0147 0.01 0.0118 0.02 0.0218 0.00DS i 0.6233 0.09 0.5473 0.12 0.7556 0.01 1.0812 0.04 1.1987 0.02 0.9909 0.00DFMIN i -0.0656 0.85 -0.0732 0.83 -0.1794 0.50 -0.8677 0.03 -0.9784 0.01 -0.0153 0.98DFMAJ i -0.1662 0.36 -0.0933 0.59 -0.0652 0.64 0.7727 0.03 0.6803 0.04 0.0956 0.73DFHVY i 0.1794 0.35 0.0644 0.72 0.0489 0.72 -0.3844 0.04 -0.4111 0.02 -0.1056 0.58TestDFs 1.01 0.36 0.24 0.78 0.39 0.67 6.60 0.00 6.75 0.00 0.21 0.81Obs./R2 10,342 0.48 11,173 0.47 15,465 0.45 9,336 0.24 10,191 0.24 17,862 0.22
LK i 0.0250 0.61 0.0421 0.37 - - 0.0261 0.45 0.0397 0.22 - - LL i 0.5362 0.00 0.5313 0.00 0.4094 0.00 0.7952 0.00 0.7643 0.00 0.7390 0.00LM i -0.8078 0.00 -0.8346 0.00 -0.6920 0.00 -1.6668 0.00 -1.7543 0.00 -1.5177 0.00LE i 0.4129 0.00 0.4121 0.00 0.3912 0.00 0.7417 0.00 0.7648 0.00 0.6499 0.00RD i 0.5847 0.43 0.5602 0.45 0.4859 0.47 -0.1077 0.34 -0.1218 0.26 -0.2043 0.06SM i 0.0126 0.05 0.0132 0.03 0.0163 0.00 0.0387 0.00 0.0401 0.00 0.0440 0.00SH i 0.0137 0.66 0.0099 0.70 -0.0059 0.78 0.0498 0.00 0.0523 0.00 0.0462 0.00YR i 0.0012 0.90 0.0014 0.88 0.0035 0.66 0.0187 0.05 0.0147 0.10 0.0265 0.00DS i 0.3160 0.62 0.3232 0.59 0.8616 0.09 1.1138 0.05 1.6166 0.01 1.5036 0.00DF i 0.0592 0.85 0.0200 0.95 -0.0671 0.75 0.4484 0.28 0.6274 0.13 0.7628 0.02Obs./R2 3,073 0.60 3,267 0.59 4,298 0.59 3,267 0.23 3,527 0.23 5,542 0.22
Appendix Table 4: OLS Estimates of SOE-Private and MNC-Private Electricity Intensity Differentials and Other Slope Coefficients from Equations (1) and (2); all p-values based on robust standard errors
12 LARGE ELECTRICITY USING INDUSTRIES COMBINED, eq. (1)
12 LARGE ELECTRICITY USING INDUSTRIES COMBINED, eq. (1)
FOOD AND BEVERAGES, eq. (1)
61

Appendix Table 4 (continued)Indepen- 1996 2006dent Initial capital Ending capital No capital Initial capital Ending capital No capitalvariable,statistic Value P-
val. Value P-val. Value P-
val. Value P-val. Value P-
val. Value P-val.
LK i 0.0227 0.64 0.0402 0.39 - - 0.0306 0.37 0.0436 0.18 - - LL i 0.5403 0.00 0.5382 0.00 0.4164 0.00 0.7944 0.00 0.7683 0.00 0.7362 0.00LM i -0.8064 0.00 -0.8344 0.00 -0.6927 0.00 -1.6663 0.00 -1.7564 0.00 -1.5156 0.00LE i 0.4135 0.00 0.4128 0.00 0.3920 0.00 0.7426 0.00 0.7657 0.00 0.6495 0.00RD i 0.5809 0.44 0.5572 0.46 0.4923 0.47 -0.0951 0.44 -0.1075 0.36 -0.1957 0.07SM i 0.0126 0.05 0.0132 0.03 0.0163 0.00 0.0385 0.00 0.0400 0.00 0.0439 0.00SH i 0.0143 0.65 0.0099 0.70 -0.0062 0.76 0.0520 0.00 0.0545 0.00 0.0465 0.00YR i 0.0011 0.91 0.0013 0.89 0.0035 0.66 0.0190 0.04 0.0148 0.10 0.0267 0.00DS i 0.3170 0.62 0.3213 0.59 0.8589 0.09 1.1209 0.05 1.6225 0.01 1.4993 0.00DFMIN i -0.9167 0.01 -0.9938 0.00 -0.9400 0.00 -1.7607 0.05 -1.7101 0.05 0.3468 0.72DFMAJ i 0.1440 0.74 0.0780 0.85 -0.0824 0.79 2.0729 0.01 2.3687 0.00 1.6271 0.01DFHVY i 0.3802 0.48 0.3602 0.47 0.3934 0.20 -0.2135 0.60 -0.0445 0.91 0.3888 0.27TestDFs 3.93 0.02 4.04 0.02 6.30 0.00 5.88 0.00 7.07 0.00 1.57 0.21Obs./R2 3,073 0.60 3,267 0.59 4,298 0.59 3,267 0.23 3,527 0.23 5,542 0.22
LK i -0.0545 0.31 -0.0401 0.42 - - 0.0504 0.18 0.0275 0.48 - - LL i 0.9597 0.00 0.8872 0.00 0.9751 0.00 0.9155 0.00 1.0090 0.00 0.7247 0.01LM i -1.1058 0.00 -1.0800 0.00 -1.1390 0.00 -1.2210 0.00 -1.3516 0.00 -1.6535 0.00LE i 0.4640 0.00 0.4881 0.00 0.4749 0.00 0.7914 0.00 0.8695 0.00 0.9573 0.00RD i -0.7012 0.14 -0.7597 0.11 -0.4728 0.01 -1.0927 0.34 -1.5047 0.18 -1.4972 0.40SM i 0.0103 0.06 0.0120 0.03 0.0085 0.04 0.0075 0.15 0.0074 0.17 0.0352 0.00SH i 0.0216 0.44 0.0191 0.48 0.0135 0.41 0.0400 0.04 0.0365 0.05 -0.0038 0.86YR i 0.0183 0.12 0.0196 0.07 0.0108 0.22 0.0057 0.70 -0.0031 0.83 0.0054 0.69DS i 2.7050 0.01 2.2783 0.02 2.1513 0.01 11.0569 0.07 11.0423 0.07 2.8022 0.11DF i -0.0035 0.99 -0.0459 0.92 0.0088 0.98 -0.3145 0.53 -0.5102 0.29 -0.5944 0.30Obs./R2 1,306 0.34 1,430 0.34 1,839 0.33 1,185 0.40 1,285 0.39 2,107 0.31
LK i -0.0543 0.31 -0.0397 0.42 - - 0.0495 0.19 0.0268 0.49 - - LL i 0.9594 0.00 0.8860 0.00 0.9753 0.00 0.9162 0.00 1.0111 0.00 0.7252 0.01LM i -1.1062 0.00 -1.0805 0.00 -1.1400 0.00 -1.2218 0.00 -1.3535 0.00 -1.6526 0.00LE i 0.4642 0.00 0.4886 0.00 0.4754 0.00 0.7892 0.00 0.8670 0.00 0.9584 0.00RD i -0.7252 0.16 -0.7998 0.12 -0.4868 0.01 -1.0476 0.36 -1.4580 0.20 -1.4753 0.41SM i 0.0103 0.06 0.0120 0.03 0.0084 0.04 0.0076 0.14 0.0075 0.17 0.0351 0.00SH i 0.0217 0.44 0.0192 0.48 0.0136 0.40 0.0399 0.04 0.0363 0.05 -0.0037 0.87YR i 0.0182 0.12 0.0195 0.07 0.0107 0.23 0.0055 0.71 -0.0034 0.81 0.0057 0.67DS i 2.7058 0.01 2.2796 0.02 2.1517 0.01 11.0608 0.07 11.0469 0.07 2.7990 0.11DFMIN i 0.1665 0.88 0.2224 0.84 0.1611 0.85 0.8818 0.50 0.7549 0.56 -0.8519 0.48DFMAJ i 0.0433 0.96 0.0474 0.95 0.1001 0.86 0.0091 0.99 -0.1447 0.86 -0.8692 0.26DFHVY i -0.0756 0.88 -0.1779 0.69 -0.1229 0.76 -0.6019 0.26 -0.8053 0.12 -0.4413 0.56TestDFs 0.02 0.98 0.08 0.93 0.08 0.92 0.72 0.49 0.85 0.43 0.10 0.90Obs./R2 1,306 0.34 1,430 0.34 1,839 0.33 1,185 0.40 1,285 0.39 2,107 0.31
TEXTILES, eq. (2)
TEXTILES, eq. (1)
FOOD AND BEVERAGES, eq. (2)
62

Appendix Table 4 (continued)Indepen- 1996 2006dent Initial capital Ending capital No capital Initial capital Ending capital No capitalvariable,statistic Value P-
val. Value P-val. Value P-
val. Value P-val. Value P-
val. Value P-val.
LK i 0.0265 0.35 0.0010 0.97 - - 0.0231 0.14 0.0341 0.03 - - LL i -0.0459 0.47 -0.0432 0.47 -0.0466 0.46 0.4055 0.02 0.3942 0.01 0.0329 0.83LM i -0.4270 0.00 -0.4207 0.00 -0.5260 0.00 -0.6929 0.00 -0.7016 0.00 -0.6790 0.00LE i 0.3184 0.00 0.3289 0.00 0.3949 0.00 0.3095 0.00 0.3544 0.00 0.7575 0.00RD i -0.1934 0.03 -0.1937 0.02 0.4208 0.54 -0.0433 0.00 -0.0371 0.03 0.0971 0.00SM i 0.0033 0.25 0.0030 0.25 0.0061 0.03 -0.0009 0.78 -0.0005 0.87 0.0097 0.00SH i 0.0314 0.16 0.0291 0.16 0.0265 0.11 -0.0106 0.18 -0.0157 0.03 0.0001 0.99YR i 0.0165 0.00 0.0186 0.00 0.0213 0.00 0.0211 0.00 0.0256 0.00 0.0458 0.00DS i -0.6162 0.07 -0.6483 0.04 -0.2038 0.72 -0.9446 0.01 -1.0169 0.01 3.3154 0.03DF i 0.7898 0.02 0.8807 0.00 0.5747 0.01 -0.2328 0.37 -0.2782 0.36 0.1749 0.80Obs./R2 1,131 0.33 1,252 0.34 1,993 0.25 1,305 0.27 1,422 0.27 2,634 0.20
LK i 0.0291 0.30 0.0018 0.94 - - 0.0235 0.13 0.0341 0.03 - - LL i -0.0456 0.46 -0.0405 0.49 -0.0446 0.48 0.4067 0.02 0.3933 0.01 0.0317 0.83LM i -0.4219 0.00 -0.4186 0.00 -0.5256 0.00 -0.6928 0.00 -0.7011 0.00 -0.6748 0.00LE i 0.3176 0.00 0.3289 0.00 0.3954 0.00 0.3092 0.00 0.3543 0.00 0.7537 0.00RD i -0.2948 0.01 -0.2689 0.01 0.3909 0.58 -0.0437 0.00 -0.0370 0.03 0.0960 0.00SM i 0.0034 0.22 0.0031 0.23 0.0061 0.03 -0.0009 0.77 -0.0005 0.88 0.0098 0.00SH i 0.0307 0.14 0.0281 0.15 0.0254 0.12 -0.0101 0.20 -0.0156 0.04 0.0016 0.94YR i 0.0163 0.00 0.0186 0.00 0.0214 0.00 0.0211 0.00 0.0257 0.00 0.0463 0.00DS i -0.6192 0.07 -0.6544 0.04 -0.2102 0.71 -0.9457 0.01 -1.0167 0.01 3.3161 0.03DFMIN i -0.3082 0.17 -0.2649 0.19 -0.2620 0.05 -0.4602 0.17 -0.6364 0.09 -1.7549 0.04DFMAJ i -0.0964 0.69 0.3334 0.26 0.2861 0.29 0.4453 0.60 -0.3125 0.61 3.6374 0.31DFHVY i 1.5496 0.00 1.4713 0.00 0.8669 0.01 -0.3015 0.23 -0.2537 0.45 -0.1280 0.83TestDFs 6.22 0.00 7.33 0.00 7.41 0.00 0.59 0.55 0.37 0.69 2.39 0.09Obs./R2 1,131 0.35 1,252 0.35 1,993 0.25 1,305 0.28 1,422 0.27 2,634 0.21
LK i 0.1100 0.00 0.1018 0.00 - - 0.0647 0.04 0.0439 0.20 - - LL i 0.8010 0.00 0.8517 0.00 0.9069 0.00 0.7835 0.00 0.8406 0.00 0.5873 0.00LM i -1.0056 0.00 -1.0345 0.00 -0.9915 0.00 -0.8057 0.00 -0.8913 0.00 -0.9208 0.00LE i 0.2982 0.00 0.2975 0.00 0.3085 0.00 0.3617 0.00 0.3710 0.00 0.5174 0.00RD i 0.2437 0.46 0.3753 0.53 -0.1586 0.08 -0.2339 0.70 -0.4851 0.43 0.4266 0.66SM i 0.0121 0.07 0.0122 0.06 0.0125 0.01 0.0078 0.06 0.0075 0.08 0.0080 0.06SH i 0.0574 0.08 0.0423 0.16 0.0276 0.29 0.0121 0.55 0.0464 0.22 0.0469 0.13YR i -0.0192 0.09 -0.0207 0.05 -0.0006 0.95 -0.0154 0.22 -0.0212 0.10 0.0281 0.08DS i 0.8619 0.12 0.8650 0.12 0.1416 0.75 5.2096 0.27 5.1175 0.26 -0.5610 0.67DF i -0.5964 0.04 -0.1231 0.69 -0.0790 0.77 -0.4185 0.52 -0.4395 0.43 -0.1779 0.69Obs./R2 1,107 0.31 1,181 0.31 1,647 0.32 775 0.32 851 0.31 1,489 0.21
APPAREL, eq. (1)
APPAREL, eq. (2)
WOOD PRODUCTS, eq. (1)
63
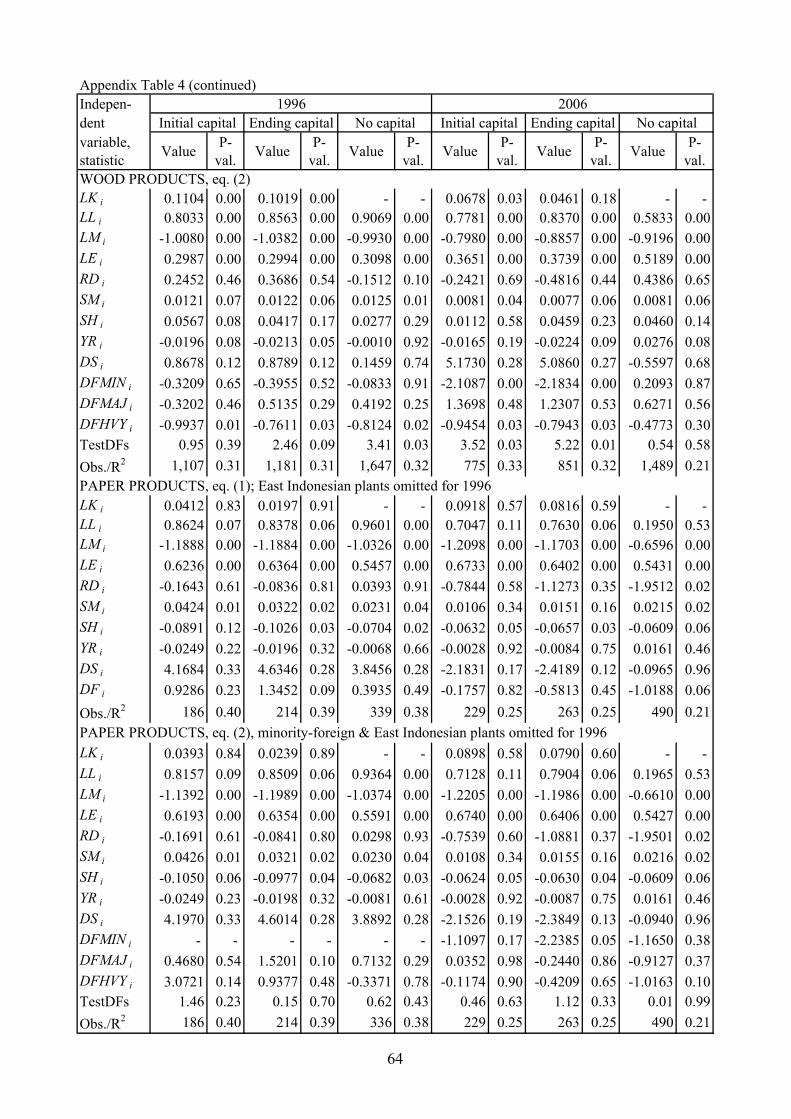
Appendix Table 4 (continued)Indepen- 1996 2006dent Initial capital Ending capital No capital Initial capital Ending capital No capitalvariable,statistic Value P-
val. Value P-val. Value P-
val. Value P-val. Value P-
val. Value P-val.
LK i 0.1104 0.00 0.1019 0.00 - - 0.0678 0.03 0.0461 0.18 - - LL i 0.8033 0.00 0.8563 0.00 0.9069 0.00 0.7781 0.00 0.8370 0.00 0.5833 0.00LM i -1.0080 0.00 -1.0382 0.00 -0.9930 0.00 -0.7980 0.00 -0.8857 0.00 -0.9196 0.00LE i 0.2987 0.00 0.2994 0.00 0.3098 0.00 0.3651 0.00 0.3739 0.00 0.5189 0.00RD i 0.2452 0.46 0.3686 0.54 -0.1512 0.10 -0.2421 0.69 -0.4816 0.44 0.4386 0.65SM i 0.0121 0.07 0.0122 0.06 0.0125 0.01 0.0081 0.04 0.0077 0.06 0.0081 0.06SH i 0.0567 0.08 0.0417 0.17 0.0277 0.29 0.0112 0.58 0.0459 0.23 0.0460 0.14YR i -0.0196 0.08 -0.0213 0.05 -0.0010 0.92 -0.0165 0.19 -0.0224 0.09 0.0276 0.08DS i 0.8678 0.12 0.8789 0.12 0.1459 0.74 5.1730 0.28 5.0860 0.27 -0.5597 0.68DFMIN i -0.3209 0.65 -0.3955 0.52 -0.0833 0.91 -2.1087 0.00 -2.1834 0.00 0.2093 0.87DFMAJ i -0.3202 0.46 0.5135 0.29 0.4192 0.25 1.3698 0.48 1.2307 0.53 0.6271 0.56DFHVY i -0.9937 0.01 -0.7611 0.03 -0.8124 0.02 -0.9454 0.03 -0.7943 0.03 -0.4773 0.30TestDFs 0.95 0.39 2.46 0.09 3.41 0.03 3.52 0.03 5.22 0.01 0.54 0.58Obs./R2 1,107 0.31 1,181 0.31 1,647 0.32 775 0.33 851 0.32 1,489 0.21
LK i 0.0412 0.83 0.0197 0.91 - - 0.0918 0.57 0.0816 0.59 - - LL i 0.8624 0.07 0.8378 0.06 0.9601 0.00 0.7047 0.11 0.7630 0.06 0.1950 0.53LM i -1.1888 0.00 -1.1884 0.00 -1.0326 0.00 -1.2098 0.00 -1.1703 0.00 -0.6596 0.00LE i 0.6236 0.00 0.6364 0.00 0.5457 0.00 0.6733 0.00 0.6402 0.00 0.5431 0.00RD i -0.1643 0.61 -0.0836 0.81 0.0393 0.91 -0.7844 0.58 -1.1273 0.35 -1.9512 0.02SM i 0.0424 0.01 0.0322 0.02 0.0231 0.04 0.0106 0.34 0.0151 0.16 0.0215 0.02SH i -0.0891 0.12 -0.1026 0.03 -0.0704 0.02 -0.0632 0.05 -0.0657 0.03 -0.0609 0.06YR i -0.0249 0.22 -0.0196 0.32 -0.0068 0.66 -0.0028 0.92 -0.0084 0.75 0.0161 0.46DS i 4.1684 0.33 4.6346 0.28 3.8456 0.28 -2.1831 0.17 -2.4189 0.12 -0.0965 0.96DF i 0.9286 0.23 1.3452 0.09 0.3935 0.49 -0.1757 0.82 -0.5813 0.45 -1.0188 0.06Obs./R2 186 0.40 214 0.39 339 0.38 229 0.25 263 0.25 490 0.21
LK i 0.0393 0.84 0.0239 0.89 - - 0.0898 0.58 0.0790 0.60 - - LL i 0.8157 0.09 0.8509 0.06 0.9364 0.00 0.7128 0.11 0.7904 0.06 0.1965 0.53LM i -1.1392 0.00 -1.1989 0.00 -1.0374 0.00 -1.2205 0.00 -1.1986 0.00 -0.6610 0.00LE i 0.6193 0.00 0.6354 0.00 0.5591 0.00 0.6740 0.00 0.6406 0.00 0.5427 0.00RD i -0.1691 0.61 -0.0841 0.80 0.0298 0.93 -0.7539 0.60 -1.0881 0.37 -1.9501 0.02SM i 0.0426 0.01 0.0321 0.02 0.0230 0.04 0.0108 0.34 0.0155 0.16 0.0216 0.02SH i -0.1050 0.06 -0.0977 0.04 -0.0682 0.03 -0.0624 0.05 -0.0630 0.04 -0.0609 0.06YR i -0.0249 0.23 -0.0198 0.32 -0.0081 0.61 -0.0028 0.92 -0.0087 0.75 0.0161 0.46DS i 4.1970 0.33 4.6014 0.28 3.8892 0.28 -2.1526 0.19 -2.3849 0.13 -0.0940 0.96DFMIN i - - - - - - -1.1097 0.17 -2.2385 0.05 -1.1650 0.38DFMAJ i 0.4680 0.54 1.5201 0.10 0.7132 0.29 0.0352 0.98 -0.2440 0.86 -0.9127 0.37DFHVY i 3.0721 0.14 0.9377 0.48 -0.3371 0.78 -0.1174 0.90 -0.4209 0.65 -1.0163 0.10TestDFs 1.46 0.23 0.15 0.70 0.62 0.43 0.46 0.63 1.12 0.33 0.01 0.99Obs./R2 186 0.40 214 0.39 336 0.38 229 0.25 263 0.25 490 0.21
WOOD PRODUCTS, eq. (2)
PAPER PRODUCTS, eq. (1); East Indonesian plants omitted for 1996
PAPER PRODUCTS, eq. (2), minority-foreign & East Indonesian plants omitted for 1996
64

Appendix Table 4 (continued)Indepen- 1996 2006dent Initial capital Ending capital No capital Initial capital Ending capital No capitalvariable,statistic Value P-
val. Value P-val. Value P-
val. Value P-val. Value P-
val. Value P-val.
LK i 0.1014 0.16 0.0795 0.25 - - 0.0742 0.31 0.0627 0.36 - - LL i 0.4518 0.06 0.4785 0.04 0.5482 0.00 0.8323 0.00 0.9100 0.00 0.1227 0.63LM i -1.0526 0.00 -1.0182 0.00 -0.9049 0.00 -0.8277 0.00 -0.9469 0.00 -0.5281 0.00LE i 0.5954 0.00 0.5734 0.00 0.5110 0.00 0.3766 0.00 0.3975 0.00 0.5115 0.00RD i -0.1519 0.17 -0.1457 0.17 -0.1434 0.11 0.1474 0.58 -0.1604 0.24 -0.2667 0.04SM i 0.0208 0.06 0.0213 0.03 0.0198 0.01 -0.0014 0.84 -0.0016 0.81 -0.0025 0.71SH i -0.0029 0.86 -0.0065 0.66 -0.0035 0.77 -0.0024 0.79 0.0104 0.53 -0.0007 0.96YR i -0.0188 0.15 -0.0124 0.33 -0.0016 0.89 0.0079 0.50 0.0105 0.43 0.0097 0.37DS i 2.4050 0.14 1.9553 0.21 1.5991 0.18 0.1561 0.86 0.1060 0.90 -0.3842 0.47DF i -0.2061 0.68 -0.0684 0.88 -0.0226 0.95 -0.4705 0.28 -0.4931 0.27 -0.8315 0.09Obs./R2 630 0.30 665 0.30 993 0.26 493 0.24 544 0.25 1,099 0.18
LK i 0.0959 0.18 0.0761 0.27 - - 0.0741 0.31 0.0636 0.35 - - LL i 0.4638 0.05 0.4832 0.04 0.5526 0.00 0.8291 0.00 0.9072 0.00 0.1209 0.64LM i -1.0650 0.00 -1.0251 0.00 -0.9150 0.00 -0.8271 0.00 -0.9489 0.00 -0.5239 0.00LE i 0.5990 0.00 0.5757 0.00 0.5132 0.00 0.3771 0.00 0.3971 0.00 0.5132 0.00RD i -0.1437 0.21 -0.1398 0.19 -0.1330 0.15 0.1313 0.62 -0.1662 0.22 -0.2776 0.03SM i 0.0209 0.06 0.0213 0.03 0.0198 0.01 -0.0014 0.84 -0.0016 0.80 -0.0026 0.69SH i -0.0007 0.96 -0.0047 0.76 -0.0031 0.80 -0.0021 0.82 0.0110 0.51 -0.0008 0.96YR i -0.0189 0.14 -0.0124 0.33 -0.0019 0.86 0.0076 0.51 0.0100 0.45 0.0097 0.37DS i 2.4316 0.14 1.9736 0.21 1.6139 0.18 0.1699 0.85 0.1209 0.89 -0.3913 0.46DFMIN i 1.0114 0.30 0.9511 0.27 0.6538 0.44 -0.1901 0.81 -0.1812 0.80 -0.2565 0.74DFMAJ i -0.2520 0.66 -0.1248 0.81 0.1748 0.69 -0.4414 0.60 -0.2707 0.75 -1.3361 0.02DFHVY i -0.8847 0.09 -0.5790 0.21 -0.8950 0.03 -0.5504 0.22 -0.6686 0.14 -0.6318 0.34TestDFs 1.94 0.15 1.60 0.20 3.09 0.05 0.10 0.91 0.27 0.76 1.03 0.36Obs./R2 630 0.30 665 0.30 993 0.27 493 0.24 544 0.25 1,099 0.18
LK i 0.2252 0.00 0.2465 0.00 - - -0.0455 0.39 -0.0378 0.46 - - LL i 0.3120 0.07 0.3539 0.04 0.4291 0.00 0.4024 0.05 0.4054 0.04 0.2494 0.12LM i -1.1175 0.00 -1.1821 0.00 -1.0277 0.00 -1.1329 0.00 -1.1303 0.00 -0.9616 0.00LE i 0.5568 0.00 0.5901 0.00 0.5577 0.00 0.5757 0.00 0.5944 0.00 0.6187 0.00RD i -0.2800 0.01 -0.2803 0.01 -0.0722 0.57 -0.5169 0.64 -0.1797 0.85 -0.3715 0.67SM i -0.0026 0.60 -0.0028 0.58 -0.0019 0.66 0.0167 0.02 0.0123 0.09 0.0072 0.19SH i -0.0156 0.39 -0.0392 0.02 -0.0334 0.01 -0.0145 0.42 -0.0096 0.57 0.0046 0.79YR i 0.0031 0.75 0.0012 0.90 0.0026 0.75 -0.0129 0.36 -0.0114 0.40 -0.0012 0.90DS i 0.4918 0.38 0.3627 0.50 1.0593 0.03 0.0583 0.94 -0.3466 0.63 -0.2048 0.64DF i 0.1052 0.83 -0.2390 0.60 -0.0259 0.94 0.2058 0.76 0.1949 0.75 0.2891 0.63Obs./R2 868 0.32 972 0.32 1,432 0.30 744 0.31 848 0.30 1,711 0.24
CHEMICALS, eq. (1)
CHEMICALS, eq. (2)
RUBBER & PLASTIC PRODUCTS, eq. (1)
65

Appendix Table 4 (continued)Indepen- 1996 2006dent Initial capital Ending capital No capital Initial capital Ending capital No capitalvariable,statistic Value P-
val. Value P-val. Value P-
val. Value P-val. Value P-
val. Value P-val.
LK i 0.2260 0.00 0.2465 0.00 - - -0.0450 0.40 -0.0376 0.46 - - LL i 0.3130 0.07 0.3538 0.04 0.4293 0.00 0.4068 0.05 0.4088 0.04 0.2519 0.12LM i -1.1186 0.00 -1.1819 0.00 -1.0276 0.00 -1.1367 0.00 -1.1326 0.00 -0.9538 0.00LE i 0.5566 0.00 0.5900 0.00 0.5577 0.00 0.5750 0.00 0.5938 0.00 0.6177 0.00RD i -0.2846 0.00 -0.2809 0.01 -0.0741 0.56 -0.5658 0.60 -0.2117 0.82 -0.3365 0.71SM i -0.0027 0.60 -0.0028 0.58 -0.0019 0.66 0.0168 0.02 0.0123 0.09 0.0070 0.20SH i -0.0155 0.40 -0.0392 0.02 -0.0333 0.01 -0.0142 0.43 -0.0093 0.58 0.0041 0.81YR i 0.0031 0.75 0.0013 0.90 0.0027 0.74 -0.0127 0.37 -0.0113 0.41 -0.0008 0.94DS i 0.4841 0.39 0.3613 0.51 1.0569 0.03 0.0573 0.94 -0.3481 0.63 -0.2142 0.62DFMIN i -0.1798 0.91 -0.1259 0.94 -0.3830 0.70 -0.8191 0.54 -0.7447 0.56 -0.9246 0.18DFMAJ i 0.0069 0.99 -0.2891 0.66 -0.0362 0.94 0.5977 0.49 0.5000 0.55 -0.3187 0.53DFHVY i 0.2816 0.69 -0.2115 0.75 0.0682 0.89 0.1650 0.84 0.1687 0.82 0.6256 0.44TestDFs 0.06 0.94 0.01 0.99 0.08 0.92 0.41 0.66 0.35 0.70 1.23 0.29Obs./R2 868 0.32 972 0.32 1,432 0.30 744 0.31 848 0.30 1,711 0.24
LK i 0.0531 0.39 0.0516 0.39 - - -0.0457 0.32 -0.0315 0.45 - - LL i 0.3645 0.09 0.3253 0.09 0.3220 0.10 1.1033 0.00 1.2093 0.00 0.5109 0.02LM i -0.2752 0.01 -0.3077 0.00 -0.2809 0.01 -0.5302 0.00 -0.5730 0.00 -0.3234 0.02LE i 0.3191 0.00 0.3385 0.00 0.3377 0.00 0.4142 0.00 0.4384 0.00 0.4503 0.00RD i -0.4412 0.40 0.3345 0.70 0.3746 0.63 1.4792 0.47 1.3415 0.52 0.7026 0.57SM i 0.0097 0.19 0.0135 0.09 0.0111 0.06 0.0145 0.06 0.0107 0.17 0.0104 0.08SH i -0.0301 0.17 -0.0171 0.42 -0.0175 0.32 0.0199 0.37 0.0116 0.58 0.0163 0.36YR i 0.0109 0.09 0.0060 0.35 0.0080 0.21 -0.0067 0.71 -0.0127 0.49 -0.0023 0.85DS i -1.2577 0.05 -1.4644 0.02 -1.3118 0.01 1.1867 0.52 1.3509 0.46 0.2545 0.76DF i -0.4375 0.59 -0.5632 0.51 -0.5133 0.46 -1.0599 0.20 -0.3498 0.72 -0.7919 0.16Obs./R2 1,217 0.30 1,288 0.27 1,596 0.27 672 0.34 710 0.33 1,276 0.30
LK i 0.0391 0.51 0.0363 0.53 - - -0.0467 0.31 -0.0336 0.42 - - LL i 0.3330 0.12 0.2932 0.12 0.2949 0.12 1.1580 0.00 1.2898 0.00 0.5377 0.02LM i -0.2584 0.02 -0.2905 0.01 -0.2737 0.01 -0.5467 0.00 -0.5901 0.00 -0.3251 0.02LE i 0.3189 0.00 0.3382 0.00 0.3372 0.00 0.4091 0.00 0.4302 0.00 0.4466 0.00RD i -0.3651 0.42 0.4185 0.62 0.4285 0.57 1.9862 0.30 1.8840 0.33 0.9412 0.44SM i 0.0098 0.19 0.0136 0.09 0.0108 0.07 0.0141 0.07 0.0104 0.18 0.0103 0.09SH i -0.0303 0.17 -0.0173 0.41 -0.0168 0.34 0.0218 0.33 0.0131 0.53 0.0165 0.36YR i 0.0109 0.09 0.0060 0.36 0.0077 0.23 -0.0048 0.78 -0.0103 0.57 -0.0015 0.91DS i -1.2099 0.06 -1.4089 0.03 -1.2628 0.01 1.1742 0.52 1.3111 0.47 0.2446 0.76DFMIN i 1.7126 0.44 1.7971 0.43 1.4086 0.52 -3.9047 0.00 -3.6958 0.00 -2.9676 0.00DFMAJ i -1.3190 0.10 -1.4998 0.06 -1.1021 0.04 0.6814 0.67 0.6679 0.68 -0.5630 0.44DFHVY i -0.9941 0.18 -1.2817 0.16 -1.1725 0.14 -0.8209 0.44 0.2265 0.86 -0.4738 0.58TestDFs 1.05 0.35 1.14 0.32 0.68 0.51 4.40 0.01 4.95 0.01 2.79 0.06Obs./R2 1,217 0.30 1,288 0.28 1,596 0.27 672 0.35 710 0.33 1,276 0.30
NON-METALLIC MINERAL PRODUCTS, eq. (2)
NON-METALLIC MINERAL PRODUCTS, eq. (1)
RUBBER & PLASTIC PRODUCTS, eq. (2)
66

Appendix Table 4 (continued)Indepen- 1996 2006dent Initial capital Ending capital No capital Initial capital Ending capital No capitalvariable,statistic Value P-
val. Value P-val. Value P-
val. Value P-val. Value P-
val. Value P-val.
LK i 0.0110 0.90 0.0539 0.63 - - -0.0734 0.33 0.0522 0.60 - - LL i 1.7186 0.01 1.6363 0.01 1.0797 0.06 0.9008 0.14 0.4374 0.46 0.3906 0.24LM i -0.8434 0.01 -0.8460 0.00 -0.8208 0.00 -0.6746 0.00 -0.6530 0.00 -0.5646 0.00LE i 0.3231 0.00 0.3786 0.00 0.4626 0.00 0.3066 0.00 0.3767 0.00 0.3641 0.00RD i -7.5507 0.34 -9.7777 0.25 -1.0416 0.34 6.0495 0.30 8.7602 0.09 -0.2499 0.31SM i -0.0107 0.48 -0.0005 0.98 0.0170 0.30 0.0213 0.03 0.0372 0.02 0.0295 0.01SH i -0.0005 0.99 -0.0534 0.20 -0.0267 0.70 -0.0220 0.33 -0.0282 0.21 0.0058 0.82YR i 0.0741 0.14 0.0328 0.52 0.0067 0.89 0.0099 0.69 -0.0498 0.42 -0.0281 0.37DS i -2.2071 0.14 -1.3903 0.36 0.2543 0.90 - - - - - - DF i -0.4087 0.64 -0.3146 0.72 -0.7111 0.33 -0.0741 0.93 -0.9321 0.40 0.1650 0.79Obs./R2 105 0.37 119 0.35 180 0.25 116 0.40 130 0.26 265 0.25
LK i -0.0055 0.95 0.0378 0.74 - - -0.0529 0.48 0.0641 0.49 - - LL i 1.7642 0.01 1.6395 0.02 1.0700 0.06 1.0782 0.04 0.5556 0.33 0.3860 0.24LM i -0.8876 0.01 -0.8753 0.00 -0.8335 0.00 -0.7596 0.00 -0.7211 0.00 -0.5683 0.00LE i 0.3216 0.00 0.3803 0.00 0.4605 0.00 0.3005 0.00 0.3801 0.00 0.3675 0.00RD i -8.1538 0.32 ####### 0.24 -1.2204 0.28 7.7213 0.24 11.6891 0.06 -0.2478 0.31SM i -0.0096 0.52 -0.0006 0.97 0.0161 0.33 0.0218 0.03 0.0401 0.02 0.0299 0.01SH i -0.0020 0.95 -0.0518 0.23 -0.0248 0.72 -0.0206 0.33 -0.0298 0.17 0.0049 0.85YR i 0.0768 0.14 0.0428 0.44 0.0197 0.70 0.0059 0.82 -0.0570 0.40 -0.0305 0.35DS i -1.8997 0.21 -1.2513 0.42 0.2537 0.90 - - - - - - DFMIN i -3.8117 0.05 -3.9843 0.02 -3.5316 0.00 -0.7783 0.44 -0.4172 0.78 1.0120 0.44DFMAJ i 0.6667 0.54 0.4633 0.69 -0.1907 0.85 1.6562 0.35 0.9733 0.54 0.3417 0.68DFHVY i -1.0242 0.26 -0.1815 0.87 -0.2588 0.78 -0.7048 0.40 -1.9038 0.21 -0.0952 0.92TestDFs 3.29 0.04 3.15 0.05 3.50 0.03 0.89 0.41 1.41 0.25 0.24 0.79Obs./R2 105 0.40 119 0.37 180 0.26 116 0.42 130 0.28 265 0.25
LK i -0.0231 0.56 0.0024 0.95 - - 0.0742 0.19 0.0855 0.13 - - LL i 0.3579 0.01 0.2784 0.06 0.3417 0.00 0.1061 0.72 0.2382 0.42 0.1770 0.35LM i -0.6924 0.00 -0.6793 0.00 -0.7673 0.00 -1.0382 0.00 -1.1560 0.00 -0.9987 0.00LE i 0.3854 0.00 0.3915 0.00 0.3943 0.00 0.6217 0.00 0.5860 0.00 0.5553 0.00RD i 0.4825 0.00 0.4888 0.00 0.0729 0.77 2.3643 0.09 2.6169 0.05 1.8727 0.18SM i -0.0069 0.07 -0.0062 0.09 0.0016 0.66 -0.0059 0.50 -0.0057 0.50 0.0041 0.61SH i 0.0350 0.09 0.0345 0.08 0.0195 0.22 0.0280 0.18 0.0378 0.07 0.0318 0.21YR i 0.0043 0.68 0.0093 0.40 0.0016 0.85 0.0274 0.21 0.0162 0.43 0.0216 0.08DF i 0.6982 0.00 0.6558 0.01 0.9443 0.00 0.1072 0.84 0.1032 0.84 0.3331 0.46Obs./R2 334 0.43 361 0.43 550 0.36 246 0.46 265 0.46 549 0.28
BASIC METALS, eq. (1); SOE and/or East Indonesian plants omitted for 2006
BASIC METALS, eq. (2); SOE and/or East Indonesian plants omitted for 2006
ELECTRONICS-RELATED MACHINERY, eq. (1); SOE & East Indonesian plants omitted
67

Appendix Table 4 (continued)Indepen- 1996 2006dent Initial capital Ending capital No capital Initial capital Ending capital No capitalvariable,statistic Value P-
val. Value P-val. Value P-
val. Value P-val. Value P-
val. Value P-val.
LK i -0.0208 0.58 0.0044 0.91 - - 0.0797 0.16 0.0916 0.10 - - LL i 0.3938 0.01 0.3076 0.03 0.3453 0.00 0.0784 0.79 0.2061 0.49 0.1580 0.40LM i -0.7078 0.00 -0.6914 0.00 -0.7772 0.00 -1.0498 0.00 -1.1671 0.00 -1.0005 0.00LE i 0.3708 0.00 0.3773 0.00 0.3872 0.00 0.6179 0.00 0.5834 0.00 0.5553 0.00RD i 0.4322 0.00 0.4408 0.01 0.0520 0.84 2.2044 0.11 2.4111 0.08 1.7091 0.22SM i -0.0064 0.09 -0.0059 0.11 0.0014 0.70 -0.0060 0.50 -0.0057 0.50 0.0039 0.63SH i 0.0352 0.08 0.0349 0.08 0.0196 0.22 0.0288 0.17 0.0382 0.06 0.0332 0.19YR i 0.0090 0.40 0.0139 0.22 0.0073 0.41 0.0348 0.14 0.0242 0.28 0.0275 0.03DFMIN i -0.3173 0.12 -0.3042 0.11 0.2326 0.56 -1.4598 0.35 -1.4833 0.39 -0.8454 0.42DFMAJ i 0.3760 0.12 0.3084 0.21 0.7063 0.02 -0.4241 0.51 -0.5640 0.38 -0.5571 0.40DFHVY i 1.4220 0.00 1.3754 0.00 1.5158 0.00 0.3338 0.58 0.3483 0.55 0.5802 0.22TestDFs 8.71 0.00 8.89 0.00 3.50 0.03 0.95 0.39 1.06 0.35 2.23 0.11Obs./R2 334 0.45 361 0.44 550 0.37 246 0.46 265 0.47 549 0.28
LK i 0.1183 0.29 0.0228 0.87 - - -0.0524 0.74 -0.0502 0.68 - - LL i 0.7645 0.09 0.9384 0.04 0.7975 0.02 1.3805 0.06 1.2911 0.05 0.5066 0.15LM i -1.2538 0.00 -1.2936 0.00 -1.1322 0.00 -1.8475 0.00 -1.7536 0.00 -1.2658 0.00LE i 0.5309 0.00 0.5694 0.00 0.5425 0.00 0.7891 0.00 0.8699 0.00 0.7919 0.00RD i -0.4225 0.20 -0.4610 0.05 -0.7163 0.00 1.4831 0.60 0.5123 0.80 -0.9330 0.56SM i 0.0031 0.62 0.0019 0.75 0.0026 0.60 0.0018 0.94 0.0015 0.95 -0.0021 0.92SH i 0.0372 0.29 0.0409 0.24 0.0253 0.28 -0.0821 0.17 -0.0634 0.23 -0.0448 0.23YR i -0.0458 0.12 -0.0384 0.18 -0.0229 0.30 -0.0046 0.93 0.0119 0.80 0.0563 0.03DF i -0.1124 0.84 -0.2590 0.65 -0.4821 0.27 -0.0470 0.96 -0.4883 0.59 0.7662 0.18Obs./R2 168 0.39 185 0.39 261 0.39 131 0.41 150 0.37 320 0.29
LK i 0.1112 0.34 0.0143 0.00 - - -0.0575 0.71 -0.0560 0.64 - - LL i 0.7904 0.09 0.9713 0.00 0.8522 0.01 1.3654 0.07 1.2783 0.05 0.5428 0.13LM i -1.2635 0.00 -1.3073 0.00 -1.1586 0.00 -1.8386 0.00 -1.7561 0.00 -1.2935 0.00LE i 0.5310 0.00 0.5686 0.00 0.5437 0.00 0.7911 0.00 0.8751 0.00 0.7854 0.00RD i -0.4614 0.23 -0.4880 0.00 -0.7599 0.00 1.4156 0.62 0.4520 0.83 -0.5727 0.72SM i 0.0027 0.67 0.0014 0.00 0.0019 0.70 0.0018 0.94 0.0018 0.94 -0.0007 0.97SH i 0.0399 0.28 0.0445 0.00 0.0314 0.20 -0.0809 0.19 -0.0615 0.25 -0.0449 0.23YR i -0.0455 0.13 -0.0378 0.00 -0.0233 0.31 -0.0035 0.95 0.0116 0.81 0.0481 0.08DFMIN i -0.3706 0.66 -0.5954 0.00 -1.2590 0.14 -0.7674 0.53 -1.6115 0.17 3.8616 0.30DFMAJ i -0.0281 0.97 -0.2320 0.00 -0.2373 0.66 -0.0345 0.98 -0.1017 0.94 1.0873 0.43DFHVY i 0.3042 0.67 0.4769 0.00 0.0852 0.88 0.0731 0.94 -0.4416 0.68 -0.0019 1.00TestDFs 0.24 0.78 0.66 0.52 1.04 0.36 0.20 0.82 0.62 0.54 0.68 0.51Obs./R2 168 0.39 185 0.39 261 0.40 131 0.41 150 0.37 320 0.31
MOTOR VEHICLES, eq. (2); SOE and East Indonesian plants omitted
ELECTRONICS-RELATED MACHINERY, eq. (2); SOE & East Indonesian plants omitted
MOTOR VEHICLES, eq. (1); SOE & East Indonesian plants omitted
68

Appendix Table 4 (continued)Indepen- 1996 2006dent Initial capital Ending capital No capital Initial capital Ending capital No capitalvariable,statistic Value P-
val. Value P-val. Value P-
val. Value P-val. Value P-
val. Value P-val.
LK i -0.0402 0.32 -0.0416 0.46 - - 0.0718 0.45 0.1117 0.17 - - LL i 0.3774 0.13 0.2690 0.32 0.4699 0.11 -0.4838 0.10 -0.5601 0.05 -0.1312 0.76LM i -0.5010 0.00 -0.4913 0.00 -0.7617 0.00 -0.3349 0.05 -0.2751 0.08 -0.5875 0.00LE i 0.3188 0.00 0.3130 0.00 0.3551 0.00 0.3447 0.00 0.3593 0.00 0.7147 0.00RD i 0.0583 0.89 0.0223 0.96 0.0031 0.99 -0.2292 0.13 -0.1961 0.18 -0.2269 0.49SM i 0.0006 0.93 0.0037 0.59 0.0012 0.84 0.0065 0.41 0.0025 0.71 0.0015 0.85SH i -0.0302 0.15 0.0035 0.90 0.0396 0.18 0.0095 0.61 0.0088 0.62 0.0322 0.26YR i 0.0621 0.00 0.0680 0.00 0.0615 0.01 0.0061 0.69 -0.0044 0.76 0.0241 0.30DS i -0.8876 0.12 -1.2453 0.03 -1.7666 0.02 -0.2077 0.71 -0.1066 0.84 -0.4786 0.60DF i 0.3097 0.58 -0.2563 0.70 0.0900 0.89 -0.5001 0.54 -0.0574 0.94 -0.3272 0.79Obs./R2 206 0.45 226 0.42 320 0.00 166 0.32 187 0.28 358 0.00
LK i -0.0429 0.29 -0.0421 0.45 - - 0.0799 0.40 0.1319 0.10 - - LL i 0.2582 0.32 0.1210 0.66 0.4742 0.11 -0.5119 0.07 -0.5806 0.04 -0.1057 0.80LM i 0.3252 0.00 0.3186 0.00 0.3525 0.00 -0.3197 0.06 -0.2572 0.10 -0.5690 0.00LE i -0.4611 0.00 -0.4384 0.01 -0.7404 0.00 0.3464 0.00 0.3642 0.00 0.7178 0.00RD i 0.0971 0.81 0.0782 0.84 0.0317 0.93 -0.2056 0.12 -0.1679 0.17 -0.1969 0.54SM i -0.0004 0.95 0.0025 0.72 0.0000 1.00 0.0065 0.41 0.0024 0.72 0.0014 0.86SH i -0.0255 0.23 0.0085 0.75 0.0470 0.12 0.0088 0.64 0.0058 0.75 0.0269 0.37YR i 0.0671 0.00 0.0743 0.00 0.0692 0.00 0.0085 0.57 -0.0014 0.93 0.0291 0.21DS i -0.8985 0.10 -1.2539 0.03 -1.9163 0.01 -0.1968 0.72 -0.0701 0.90 -0.4544 0.62DFMAJ i -0.2723 0.65 -1.0233 0.15 -0.2439 0.75 -1.8716 0.09 -1.8904 0.02 -2.1550 0.04DFHVY i 2.3473 0.00 2.3667 0.00 1.4210 0.28 -0.2436 0.77 0.3200 0.70 0.3592 0.80TestDFs 7.06 0.01 9.09 0.00 1.22 0.27 2.38 0.12 6.96 0.01 3.54 0.06Obs./R2 206 0.46 226 0.43 314 0.40 166 0.32 186 0.29 356 0.22
OTHER TRANSPORTATION MACHINERY, eq. (1)
OTHER TRANSPORTATION MACHINERY, eq. (2); minority-foreign plants omitted
Notes: - = estimate could not be obtained; in the Obs./R2 rows, the coefficient column contains the number of observations and the P-value column contains the R-squared; the TestDFs rows show Wald tests of the hypothesis that coefficients on all foreign ownership dummies are equal and associated p-values; industry and region dummies also included as relevant (see explanation in the text); full results including the constant and all dummies are available from the authors.
69

Indepen- 1996 2006dent Initial capital Ending capital No capital Initial capital Ending capital No capitalvariable,statistic Value P-
val. Value P-val. Value P-
val. Value P-val. Value P-
val. Value P-val.
LK i -0.0007 0.97 0.0086 0.65 - - 0.0078 0.60 0.0051 0.72 - - LL i 0.3344 0.00 0.3038 0.00 0.2753 0.00 0.2043 0.00 0.1582 0.02 0.0952 0.05LM i -0.7793 0.00 -0.7534 0.00 -0.7105 0.00 -0.8842 0.00 -0.8486 0.00 -0.7797 0.00LE i 0.3658 0.00 0.3643 0.00 0.3823 0.00 0.5233 0.00 0.5178 0.00 0.5139 0.00RD i 0.0175 0.83 0.0281 0.72 0.1547 0.23 0.0818 0.42 0.0594 0.50 0.0463 0.62SM i 0.0098 0.00 0.0093 0.00 0.0084 0.00 0.0080 0.00 0.0077 0.00 0.0099 0.00SH i 0.0085 0.17 0.0070 0.23 0.0047 0.31 0.0093 0.17 0.0099 0.13 0.0049 0.36YR i 0.0037 0.28 0.0027 0.39 0.0020 0.50 0.0140 0.02 0.0129 0.02 0.0227 0.00DS i 0.1662 0.53 0.1788 0.48 -0.0444 0.85 0.1451 0.63 0.2050 0.47 -0.2287 0.18DF i 0.1487 0.21 0.1321 0.23 -0.0700 0.47 0.3102 0.21 0.2450 0.28 0.2117 0.17Obs./R2 8,875 0.35 9,557 0.34 12,919 0.33 7,782 0.29 8,501 0.29 14,672 0.26
LK i -0.0011 0.96 0.0083 0.66 - - 0.0073 0.62 0.0048 0.73 - - LL i 0.3344 0.00 0.3049 0.00 0.2756 0.00 0.2017 0.01 0.1563 0.02 0.0913 0.06LM i -0.7782 0.00 -0.7527 0.00 -0.7104 0.00 -0.8826 0.00 -0.8475 0.00 -0.7790 0.00LE i 0.3659 0.00 0.3642 0.00 0.3823 0.00 0.5234 0.00 0.5178 0.00 0.5138 0.00RD i 0.0146 0.85 0.0260 0.74 0.1545 0.23 0.0772 0.45 0.0569 0.52 0.0398 0.67SM i 0.0098 0.00 0.0093 0.00 0.0083 0.00 0.0080 0.00 0.0077 0.00 0.0099 0.00SH i 0.0087 0.17 0.0070 0.23 0.0048 0.31 0.0091 0.18 0.0098 0.13 0.0047 0.38YR i 0.0038 0.26 0.0028 0.38 0.0020 0.50 0.0140 0.02 0.0129 0.02 0.0226 0.00DS i 0.1625 0.54 0.1756 0.49 -0.0449 0.84 0.1462 0.63 0.2060 0.47 -0.2260 0.19DFMIN i -0.2012 0.34 -0.2678 0.19 -0.1409 0.57 0.9441 0.42 0.6924 0.53 1.6705 0.07DFMAJ i 0.0967 0.51 0.1300 0.36 -0.0702 0.56 0.1436 0.57 0.1497 0.54 0.0950 0.63DFHVY i 0.3847 0.07 0.2945 0.12 -0.0364 0.81 0.3049 0.31 0.2321 0.39 0.0991 0.56TestDFs 2.11 0.12 2.38 0.09 0.07 0.93 0.30 0.74 0.14 0.87 1.43 0.24Obs./R2 8,875 0.35 9,557 0.34 12,919 0.33 7,782 0.29 8,501 0.29 14,672 0.26
LK i -0.0487 0.17 -0.0337 0.34 - - 0.0446 0.07 0.0407 0.08 - - LL i 0.6307 0.00 0.6342 0.00 0.5364 0.00 0.2758 0.03 0.2320 0.06 0.2650 0.00LM i -1.0304 0.00 -1.0298 0.00 -0.9275 0.00 -1.0780 0.00 -1.0528 0.00 -0.9615 0.00LE i 0.3774 0.00 0.3740 0.00 0.3830 0.00 0.5704 0.00 0.5677 0.00 0.5395 0.00RD i 0.1646 0.53 0.1533 0.57 0.1943 0.43 -0.0224 0.85 -0.0287 0.81 -0.0840 0.62SM i 0.0191 0.01 0.0186 0.00 0.0161 0.00 0.0116 0.00 0.0119 0.00 0.0129 0.00SH i -0.0163 0.47 -0.0123 0.51 -0.0152 0.24 0.0107 0.39 0.0141 0.23 0.0086 0.36YR i 0.0040 0.54 0.0025 0.68 0.0016 0.77 0.0275 0.01 0.0233 0.01 0.0277 0.00DS i 0.0910 0.84 0.1473 0.73 -0.3635 0.27 0.5671 0.18 0.6466 0.11 0.4532 0.16DF i 0.2141 0.41 0.2125 0.41 -0.0501 0.83 0.6773 0.28 0.6170 0.31 0.7679 0.08Obs./R2 3,074 0.38 3,268 0.38 4,299 0.37 3,268 0.29 3,528 0.29 5,543 0.29
Appendix Table 5: OLS Estimates of SOE-Private and MNC-Private Diesel Intensity Differentials and Other Slope Coefficients from Equations (1) and (2); all p-values based on robust standard errors
10 LARGE DIESEL FUEL USING INDUSTRIES COMBINED, eq. (1)
10 LARGE DIESEL FUEL USING INDUSTRIES COMBINED, eq. (2)
FOOD AND BEVERAGES, eq. (1)
70

Appendix Table 5 (continued)Indepen- 1996 2006dent Initial capital Ending capital No capital Initial capital Ending capital No capitalvariable,statistic Value P-
val. Value P-val. Value P-
val. Value P-val. Value P-
val. Value P-val.
LK i -0.0498 0.17 -0.0347 0.32 - - 0.0422 0.09 0.0386 0.10 - - LL i 0.6338 0.00 0.6384 0.00 0.5329 0.00 0.2670 0.04 0.2234 0.07 0.2461 0.01LM i -1.0306 0.00 -1.0299 0.00 -0.9275 0.00 -1.0736 0.00 -1.0483 0.00 -0.9547 0.00LE i 0.3775 0.00 0.3739 0.00 0.3832 0.00 0.5696 0.00 0.5672 0.00 0.5371 0.00RD i 0.1623 0.54 0.1519 0.57 0.1900 0.44 -0.0219 0.85 -0.0284 0.82 -0.0701 0.66SM i 0.0191 0.01 0.0187 0.00 0.0160 0.00 0.0116 0.00 0.0120 0.00 0.0128 0.00SH i -0.0167 0.46 -0.0127 0.49 -0.0150 0.25 0.0091 0.49 0.0129 0.30 0.0058 0.55YR i 0.0041 0.53 0.0025 0.67 0.0017 0.76 0.0275 0.01 0.0233 0.01 0.0279 0.00DS i 0.0857 0.85 0.1425 0.74 -0.3630 0.27 0.5681 0.18 0.6475 0.11 0.4604 0.16DFMIN i 0.0660 0.88 -0.0778 0.86 0.5329 0.53 3.1712 0.47 2.6981 0.51 6.4158 0.06DFMAJ i -0.0554 0.86 0.0409 0.90 -0.2064 0.41 0.2506 0.47 0.1793 0.59 0.3266 0.32DFHVY i 0.7942 0.10 0.6442 0.15 -0.1165 0.69 0.6089 0.45 0.5871 0.45 0.2531 0.58TestDFs 1.22 0.30 0.88 0.41 0.38 0.69 0.33 0.72 0.33 0.72 1.66 0.19Obs./R2 3,074 0.38 3,268 0.38 4,299 0.37 3,268 0.29 3,528 0.29 5,543 0.29
LK i 0.0331 0.44 0.0289 0.48 - - 0.0174 0.38 0.0146 0.44 - - LL i -0.0044 0.96 0.0065 0.94 0.0153 0.86 -0.1075 0.27 -0.1683 0.08 -0.2187 0.01LM i -0.4526 0.00 -0.4624 0.00 -0.4979 0.00 -0.2780 0.00 -0.2461 0.00 -0.2766 0.00LE i 0.3371 0.00 0.3381 0.00 0.3622 0.00 0.3059 0.00 0.3115 0.00 0.3661 0.00RD i 0.8575 0.13 1.2953 0.10 1.6209 0.00 1.5615 0.25 1.5128 0.27 3.8715 0.16SM i 0.0065 0.05 0.0063 0.05 0.0096 0.01 0.0081 0.00 0.0082 0.00 0.0086 0.00SH i 0.0388 0.19 0.0356 0.20 0.0416 0.03 0.0054 0.65 0.0068 0.56 0.0108 0.39YR i 0.0026 0.66 0.0035 0.50 0.0066 0.36 0.0054 0.39 0.0067 0.26 0.0143 0.01DS i -0.0161 0.97 -0.0273 0.95 1.0566 0.43 0.0297 0.97 0.0367 0.96 -0.5818 0.12DF i 0.1988 0.54 0.2855 0.37 -0.0040 0.99 -0.1648 0.62 -0.2562 0.40 -0.3257 0.22Obs./R2 1,306 0.31 1,430 0.32 1,839 0.31 1,185 0.32 1,285 0.31 2,109 0.29
LK i 0.0337 0.43 0.0302 0.47 - - 0.0171 0.39 0.0144 0.44 - - LL i -0.0039 0.97 0.0059 0.95 0.0172 0.84 -0.1099 0.26 -0.1694 0.08 -0.2216 0.01LM i -0.4544 0.00 -0.4645 0.00 -0.5001 0.00 -0.2802 0.00 -0.2499 0.00 -0.2796 0.00LE i 0.3376 0.00 0.3387 0.00 0.3625 0.00 0.3072 0.00 0.3129 0.00 0.3667 0.00RD i 0.8282 0.15 1.2506 0.12 1.5917 0.00 1.6011 0.24 1.5518 0.25 3.7972 0.15SM i 0.0064 0.05 0.0061 0.05 0.0096 0.01 0.0081 0.00 0.0083 0.00 0.0087 0.00SH i 0.0391 0.19 0.0359 0.19 0.0417 0.03 0.0050 0.68 0.0062 0.60 0.0102 0.41YR i 0.0024 0.68 0.0033 0.53 0.0064 0.37 0.0049 0.43 0.0061 0.31 0.0136 0.02DS i -0.0139 0.97 -0.0243 0.95 1.0581 0.43 0.0306 0.97 0.0394 0.96 -0.5754 0.12DFMIN i -0.0195 0.98 -0.0744 0.94 -0.0443 0.95 -0.0668 0.93 -0.1089 0.88 -0.5728 0.35DFMAJ i 0.3882 0.38 0.5981 0.18 0.2192 0.52 0.3286 0.61 0.2530 0.68 0.3986 0.50DFHVY i 0.0637 0.90 0.0482 0.92 -0.2341 0.50 -0.5010 0.11 -0.5824 0.04 -0.6769 0.00TestDFs 0.17 0.85 0.47 0.62 0.47 0.62 0.82 0.44 0.94 0.39 1.54 0.22Obs./R2 1,306 0.31 1,430 0.32 1,839 0.31 1,185 0.32 1,285 0.32 2,109 0.29
TEXTILES, eq. (1)
FOOD AND BEVERAGES, eq. (2)
TEXTILES, eq. (2)
71

Appendix Table 5 (continued)Indepen- 1996 2006dent Initial capital Ending capital No capital Initial capital Ending capital No capitalvariable,statistic Value P-
val. Value P-val. Value P-
val. Value P-val. Value P-
val. Value P-val.
LK i 0.0180 0.59 0.0163 0.61 - - 0.0220 0.64 0.0213 0.63 - - LL i 0.6322 0.00 0.5807 0.00 0.4314 0.00 0.6693 0.00 0.6365 0.00 0.2199 0.15LM i -1.1383 0.00 -1.1014 0.00 -0.9559 0.00 -1.4688 0.00 -1.3766 0.00 -1.4905 0.00LE i 0.4300 0.00 0.4292 0.00 0.4243 0.00 0.6369 0.00 0.6182 0.00 0.8176 0.00RD i -0.1380 0.70 -0.7149 0.33 0.2259 0.28 0.4083 0.77 0.7131 0.56 0.7512 0.55SM i 0.0060 0.06 0.0058 0.06 0.0061 0.02 -0.0079 0.08 -0.0087 0.04 0.0054 0.28SH i 0.0070 0.71 0.0171 0.34 -0.0017 0.92 0.0204 0.17 0.0172 0.21 0.0100 0.55YR i 0.0141 0.18 0.0162 0.12 0.0071 0.36 -0.0043 0.77 -0.0023 0.88 0.0481 0.02DS i 0.3106 0.63 0.2786 0.67 0.0096 0.98 -2.6113 0.00 -2.4617 0.00 -2.7071 0.00DF i 0.4004 0.24 0.2562 0.39 0.0590 0.81 0.2934 0.63 0.3292 0.54 0.2633 0.56Obs./R2 1,107 0.42 1,181 0.41 1,647 0.39 775 0.32 851 0.31 1,489 0.28
LK i 0.0180 0.60 0.0160 0.62 - - 0.0208 0.66 0.0207 0.64 - - LL i 0.6329 0.00 0.5807 0.00 0.4319 0.00 0.6688 0.00 0.6355 0.00 0.2195 0.15LM i -1.1385 0.00 -1.1005 0.00 -0.9554 0.00 -1.4694 0.00 -1.3768 0.00 -1.4904 0.00LE i 0.4299 0.00 0.4294 0.00 0.4243 0.00 0.6378 0.00 0.6197 0.00 0.8186 0.00RD i -0.1379 0.71 -0.7172 0.33 0.2246 0.29 0.3994 0.77 0.6927 0.57 0.7322 0.56SM i 0.0060 0.06 0.0058 0.06 0.0061 0.02 -0.0082 0.07 -0.0090 0.04 0.0053 0.29SH i 0.0068 0.72 0.0169 0.35 -0.0020 0.90 0.0211 0.15 0.0178 0.20 0.0112 0.51YR i 0.0140 0.19 0.0164 0.12 0.0072 0.35 -0.0036 0.81 -0.0015 0.92 0.0484 0.02DS i 0.3106 0.63 0.2762 0.67 0.0085 0.99 -2.5976 0.00 -2.4500 0.00 -2.7065 0.00DFMIN i 0.3670 0.21 0.0069 0.99 -0.1788 0.54 -0.3158 0.59 -0.3993 0.44 -0.6113 0.17DFMAJ i 0.4683 0.29 0.2378 0.49 0.0532 0.86 -0.7696 0.40 -0.7710 0.39 -0.2080 0.81DFHVY i 0.3455 0.58 0.3850 0.50 0.1778 0.72 0.7403 0.34 0.6779 0.28 0.4853 0.37TestDFs 0.02 0.98 0.19 0.83 0.29 0.75 1.03 0.36 1.38 0.26 1.45 0.24Obs./R2 1,107 0.42 1,181 0.41 1,647 0.39 775 0.32 851 0.31 1,489 0.28
LK i 0.1497 0.49 0.1793 0.41 - - 0.0286 0.72 -0.0532 0.54 - - LL i -0.0864 0.82 -0.1956 0.59 -0.0020 0.99 0.3123 0.50 0.3515 0.43 0.2346 0.36LM i -0.7093 0.00 -0.6593 0.00 -0.5820 0.00 -0.6940 0.01 -0.7063 0.01 -0.5423 0.00LE i 0.4133 0.00 0.4116 0.00 0.3712 0.00 0.4219 0.00 0.4528 0.00 0.3869 0.00RD i 1.0301 0.22 1.0743 0.19 1.2247 0.14 0.2026 0.91 0.6349 0.70 -0.3406 0.72SM i 0.0108 0.14 0.0137 0.04 0.0103 0.04 0.0091 0.25 0.0042 0.62 0.0026 0.70SH i -0.0023 0.96 -0.0322 0.45 -0.0127 0.54 -0.0323 0.17 -0.0423 0.06 -0.0387 0.02YR i 0.0130 0.44 0.0156 0.33 0.0029 0.82 0.0207 0.32 0.0269 0.19 0.0210 0.09DS i -1.2558 0.01 -1.3995 0.00 -1.0341 0.03 -2.4388 0.07 -2.5753 0.05 -0.6630 0.45DF i 0.5846 0.30 1.0136 0.14 0.7027 0.14 0.6735 0.38 0.4475 0.52 0.1578 0.74Obs./R2 186 0.35 214 0.36 339 0.33 229 0.21 263 0.23 490 0.19
WOOD PRODUCTS, eq. (1)
WOOD PRODUCTS, eq. (2)
PAPER PRODUCTS, eq. (1); East Indonesian plants omitted for 1996
72

Appendix Table 5 (continued)Indepen- 1996 2006dent Initial capital Ending capital No capital Initial capital Ending capital No capitalvariable,statistic Value P-
val. Value P-val. Value P-
val. Value P-val. Value P-
val. Value P-val.
LK i 0.1463 0.49 0.1640 0.46 - - 0.0285 0.73 -0.0534 0.54 - - LL i -0.1373 0.73 -0.2459 0.50 -0.0212 0.90 0.3223 0.49 0.3827 0.39 0.2408 0.35LM i -0.6692 0.00 -0.6174 0.00 -0.5595 0.00 -0.7050 0.01 -0.7378 0.01 -0.5527 0.00LE i 0.4179 0.00 0.4127 0.00 0.3720 0.00 0.4185 0.00 0.4478 0.00 0.3814 0.00RD i 1.0232 0.23 1.0786 0.20 1.2288 0.14 0.2294 0.90 0.6766 0.67 -0.2707 0.76SM i 0.0110 0.14 0.0144 0.03 0.0107 0.03 0.0094 0.24 0.0048 0.57 0.0033 0.63SH i -0.0160 0.72 -0.0503 0.23 -0.0256 0.24 -0.0317 0.18 -0.0399 0.08 -0.0391 0.02YR i 0.0129 0.44 0.0164 0.31 0.0046 0.71 0.0207 0.32 0.0266 0.20 0.0204 0.11DS i -1.2212 0.01 -1.2904 0.00 -0.9691 0.03 -2.3954 0.08 -2.5126 0.06 -0.6280 0.47DFMIN i - - - - - - -0.0568 0.93 -1.1039 0.26 -0.6287 0.48DFMAJ i 0.1890 0.74 0.3430 0.56 0.1840 0.67 1.0548 0.62 1.1181 0.59 1.3249 0.42DFHVY i 2.4790 0.14 2.5658 0.05 2.4796 0.03 0.6525 0.39 0.5107 0.45 0.0292 0.95TestDFs 1.63 0.20 2.77 0.10 3.51 0.06 0.37 0.69 1.22 0.30 0.58 0.56Obs./R2 186 0.34 214 0.36 339 0.34 229 0.21 263 0.23 490 0.19
LK i 0.0664 0.34 0.0617 0.35 - - -0.1285 0.14 -0.1417 0.07 - - LL i -0.1129 0.42 -0.1654 0.22 0.1763 0.29 0.6182 0.03 0.6077 0.02 0.2061 0.30LM i -0.5504 0.00 -0.4987 0.00 -0.6018 0.00 -1.0871 0.00 -1.1180 0.00 -0.7855 0.00LE i 0.2990 0.00 0.2954 0.00 0.3420 0.00 0.4802 0.00 0.5023 0.00 0.4394 0.00RD i -0.0916 0.04 -0.0823 0.03 -0.1001 0.01 0.4099 0.31 -0.1275 0.64 -0.1292 0.59SM i 0.0039 0.41 0.0028 0.55 0.0024 0.59 0.0070 0.52 0.0122 0.29 0.0081 0.32SH i 0.0040 0.63 -0.0007 0.93 -0.0027 0.72 0.0243 0.26 0.0265 0.17 0.0091 0.54YR i 0.0184 0.04 0.0173 0.05 0.0118 0.13 -0.0030 0.83 -0.0026 0.85 0.0060 0.52DS i 1.0070 0.46 0.9122 0.46 0.2980 0.76 0.8634 0.39 1.0135 0.28 -0.5227 0.25DF i 0.3064 0.37 0.2888 0.36 -0.2394 0.34 0.1233 0.88 -0.0893 0.90 -0.3986 0.29Obs./R2 630 0.29 665 0.29 994 0.24 493 0.30 544 0.31 1,099 0.26
LK i 0.0704 0.31 0.0648 0.33 - - -0.1314 0.13 -0.1455 0.07 - - LL i -0.1197 0.40 -0.1658 0.22 0.1878 0.27 0.6274 0.03 0.6098 0.02 0.2133 0.28LM i -0.5473 0.00 -0.4989 0.00 -0.6073 0.00 -1.0810 0.00 -1.1073 0.00 -0.7859 0.00LE i 0.2998 0.00 0.2965 0.00 0.3423 0.00 0.4828 0.00 0.5054 0.00 0.4395 0.00RD i -0.0915 0.04 -0.0822 0.03 -0.0980 0.01 0.4607 0.27 -0.1166 0.68 -0.1147 0.64SM i 0.0038 0.42 0.0027 0.55 0.0023 0.60 0.0073 0.51 0.0123 0.28 0.0081 0.32SH i 0.0023 0.78 -0.0022 0.79 -0.0033 0.65 0.0222 0.32 0.0247 0.21 0.0084 0.57YR i 0.0185 0.04 0.0171 0.05 0.0120 0.12 -0.0012 0.93 -0.0013 0.92 0.0062 0.50DS i 0.9933 0.46 0.9016 0.47 0.2896 0.77 0.7830 0.44 0.9600 0.31 -0.5324 0.24DFMIN i -0.6358 0.06 -0.6121 0.04 -1.0605 0.00 -0.7437 0.45 -0.7266 0.42 -1.1914 0.05DFMAJ i 0.5409 0.24 0.5153 0.23 -0.0350 0.91 -0.7309 0.26 -0.9994 0.10 -0.5382 0.12DFHVY i 0.4151 0.35 0.3851 0.34 -0.1724 0.61 0.7284 0.52 0.4839 0.64 -0.2015 0.69TestDFs 4.77 0.01 5.48 0.00 4.03 0.02 0.97 0.38 1.18 0.31 0.99 0.37Obs./R2 630 0.30 665 0.29 994 0.24 493 0.30 544 0.31 1,099 0.26
PAPER PRODUCTS, eq. (2), minority-foreign & East Indonesian plants omitted for 1996
CHEMICALS, eq. (1)
CHEMICALS, eq. (2)
73

Appendix Table 5 (continued)Indepen- 1996 2006dent Initial capital Ending capital No capital Initial capital Ending capital No capitalvariable,statistic Value P-
val. Value P-val. Value P-
val. Value P-val. Value P-
val. Value P-val.
LK i 0.0382 0.49 0.0761 0.09 - - 0.0014 0.96 -0.0004 0.99 - - LL i 0.0886 0.42 0.0380 0.69 0.0676 0.36 0.0919 0.38 -0.0345 0.77 -0.1337 0.13LM i -0.6022 0.00 -0.5773 0.00 -0.5853 0.00 -0.6077 0.00 -0.5657 0.00 -0.4754 0.00LE i 0.2985 0.00 0.2916 0.00 0.3252 0.00 0.3457 0.00 0.3551 0.00 0.3619 0.00RD i 0.1710 0.16 0.1732 0.15 0.0893 0.36 1.2470 0.31 1.1197 0.31 1.2103 0.26SM i 0.0074 0.02 0.0045 0.14 0.0050 0.06 0.0025 0.43 0.0002 0.95 0.0025 0.41SH i -0.0081 0.31 -0.0039 0.63 0.0050 0.53 0.0172 0.24 0.0175 0.22 -0.0005 0.97YR i -0.0035 0.61 -0.0028 0.64 -0.0033 0.49 -0.0050 0.54 -0.0040 0.65 0.0052 0.55DS i -0.3923 0.09 -0.4841 0.03 -0.2700 0.18 0.0645 0.91 -0.1045 0.85 -0.3620 0.16DF i -0.0201 0.92 -0.1024 0.56 0.0007 1.00 0.2705 0.41 0.3230 0.29 0.0525 0.81Obs./R2 868 0.24 972 0.25 1,432 0.24 744 0.25 848 0.23 1,712 0.20
LK i 0.0397 0.48 0.0776 0.09 - - 0.0036 0.91 0.0014 0.96 - - LL i 0.0899 0.41 0.0354 0.71 0.0651 0.38 0.0935 0.38 -0.0320 0.79 -0.1333 0.13LM i -0.6074 0.00 -0.5783 0.00 -0.5806 0.00 -0.6092 0.00 -0.5677 0.00 -0.4768 0.00LE i 0.3013 0.00 0.2934 0.00 0.3260 0.00 0.3439 0.00 0.3532 0.00 0.3620 0.00RD i 0.1554 0.16 0.1621 0.14 0.0874 0.35 1.2370 0.29 1.1025 0.29 1.2304 0.25SM i 0.0071 0.02 0.0043 0.16 0.0048 0.08 0.0024 0.43 0.0002 0.95 0.0024 0.42SH i -0.0079 0.32 -0.0036 0.65 0.0050 0.53 0.0165 0.26 0.0170 0.23 -0.0007 0.95YR i -0.0027 0.69 -0.0023 0.71 -0.0030 0.53 -0.0055 0.50 -0.0045 0.60 0.0050 0.57DS i -0.4177 0.07 -0.5024 0.02 -0.2704 0.18 0.0776 0.89 -0.0913 0.87 -0.3579 0.16DFMIN i -0.2142 0.53 -0.2476 0.42 -0.2626 0.22 2.7630 0.21 2.7773 0.21 1.7606 0.23DFMAJ i -0.5502 0.01 -0.5006 0.01 -0.4486 0.01 0.4985 0.50 0.6368 0.39 -0.0386 0.93DFHVY i 0.5867 0.06 0.3431 0.22 0.5252 0.18 0.0200 0.95 0.0672 0.81 -0.0186 0.93TestDFs 5.03 0.01 3.59 0.03 2.74 0.06 0.94 0.39 1.01 0.37 0.76 0.47Obs./R2 868 0.24 972 0.25 1,432 0.24 744 0.25 848 0.23 1,712 0.20
LK i 0.0677 0.36 0.0437 0.47 - - -0.0204 0.75 0.0126 0.83 - - LL i 0.2481 0.32 0.1900 0.43 0.1052 0.62 0.0011 1.00 -0.0008 1.00 0.0542 0.85LM i -0.6270 0.00 -0.5022 0.00 -0.4752 0.00 -1.2036 0.00 -1.2104 0.00 -1.0898 0.00LE i 0.4143 0.00 0.4148 0.00 0.4983 0.00 0.9267 0.00 0.9178 0.00 0.8778 0.00RD i -0.3180 0.49 -0.3034 0.51 -0.1452 0.78 -2.0922 0.13 -2.0908 0.13 -2.3275 0.02SM i 0.0061 0.48 0.0029 0.73 0.0015 0.82 0.0160 0.06 0.0159 0.05 0.0117 0.11SH i 0.0033 0.90 0.0038 0.88 -0.0019 0.93 -0.0120 0.79 -0.0105 0.80 0.0156 0.63YR i 0.0085 0.32 0.0057 0.48 0.0032 0.72 0.0009 0.96 0.0059 0.73 0.0369 0.01DS i 0.9386 0.31 0.8224 0.35 0.2186 0.78 -0.1585 0.91 -0.1968 0.89 -1.5017 0.02DF i -1.1835 0.02 -1.2284 0.01 -0.8209 0.13 -0.1072 0.94 -0.0826 0.95 -0.9925 0.18Obs./R2 1,217 0.33 1,288 0.33 1,596 0.33 672 0.36 710 0.36 1,276 0.34
NON-METALLIC MINERAL PRODUCTS, eq. (1)
RUBBER & PLASTIC PRODUCTS, eq. (1)
RUBBER & PLASTIC PRODUCTS, eq. (2)
74

Appendix Table 5 (continued)Indepen- 1996 2006dent Initial capital Ending capital No capital Initial capital Ending capital No capitalvariable,statistic Value P-
val. Value P-val. Value P-
val. Value P-val. Value P-
val. Value P-val.
LK i 0.0766 0.30 0.0525 0.39 - - -0.0227 0.72 0.0100 0.86 - - LL i 0.2539 0.31 0.1953 0.41 0.1213 0.57 0.0441 0.92 0.0441 0.91 0.0870 0.76LM i -0.6279 0.00 -0.5031 0.00 -0.4764 0.00 -1.2101 0.00 -1.2168 0.00 -1.0950 0.00LE i 0.4138 0.00 0.4143 0.00 0.4981 0.00 0.9261 0.00 0.9169 0.00 0.8770 0.00RD i -0.4264 0.34 -0.4117 0.35 -0.2220 0.66 -2.1732 0.13 -2.1346 0.12 -2.3694 0.02SM i 0.0064 0.47 0.0032 0.70 0.0019 0.79 0.0163 0.05 0.0162 0.05 0.0121 0.10SH i 0.0038 0.88 0.0043 0.86 -0.0020 0.92 -0.0143 0.76 -0.0121 0.77 0.0131 0.69YR i 0.0087 0.31 0.0059 0.46 0.0035 0.71 0.0014 0.94 0.0066 0.71 0.0372 0.01DS i 0.9059 0.32 0.7888 0.37 0.1835 0.82 -0.1917 0.89 -0.2429 0.86 -1.5255 0.02DFMIN i -2.0768 0.00 -2.1100 0.00 -2.0077 0.00 -0.4260 0.75 -0.6045 0.65 -1.4887 0.20DFMAJ i -1.2283 0.06 -1.2901 0.05 -0.6566 0.41 -1.6901 0.06 -1.6775 0.06 -2.1487 0.00DFHVY i -0.0115 0.99 -0.0089 0.99 0.1558 0.87 0.5869 0.77 0.5846 0.75 0.1664 0.90TestDFs 1.79 0.17 1.98 0.14 2.30 0.10 0.71 0.49 0.74 0.48 1.44 0.24Obs./R2 1,217 0.33 1,288 0.33 1,596 0.33 672 0.36 710 0.36 1,276 0.34
LK i 0.0642 0.45 0.0944 0.32 - - -0.0135 0.79 -0.0232 0.56 - - LL i 0.5723 0.04 0.3588 0.17 0.3592 0.07 -0.1958 0.61 -0.0979 0.76 0.5029 0.05LM i -0.5944 0.01 -0.5642 0.01 -0.4974 0.00 -0.2169 0.23 -0.1850 0.20 -0.2854 0.02LE i 0.2731 0.00 0.3031 0.00 0.2918 0.00 0.2582 0.00 0.2396 0.00 0.2658 0.00RD i 8.4627 0.16 11.2901 0.04 -0.5474 0.07 -2.8121 0.46 -1.7903 0.65 0.4648 0.60SM i -0.0061 0.65 -0.0070 0.57 0.0087 0.33 0.0049 0.46 0.0007 0.91 -0.0175 0.10SH i 0.0589 0.14 0.0433 0.22 0.0375 0.17 -0.0062 0.66 -0.0086 0.54 -0.0047 0.79YR i -0.0073 0.76 -0.0309 0.26 -0.0294 0.15 -0.0309 0.05 -0.0313 0.04 -0.0029 0.90DS i -2.1196 0.16 -1.9136 0.14 -0.4534 0.59 - - - - - - DF i 0.0085 0.99 -0.4291 0.39 -0.6177 0.10 0.1374 0.80 0.2112 0.67 1.0146 0.14Obs./R2 105 0.39 119 0.38 180 0.33 116 0.35 130 0.35 265 0.28
LK i 0.0688 0.41 0.0977 0.31 - - -0.0184 0.70 -0.0267 0.47 - - LL i 0.5280 0.05 0.3497 0.18 0.3582 0.07 -0.1657 0.70 -0.0927 0.79 0.5292 0.05LM i -0.5760 0.01 -0.5552 0.01 -0.4929 0.00 -0.2333 0.23 -0.1874 0.21 -0.3134 0.02LE i 0.2694 0.00 0.3023 0.00 0.2913 0.00 0.2577 0.00 0.2374 0.00 0.2725 0.00RD i 8.7980 0.14 11.3713 0.04 -0.5155 0.09 -2.4810 0.54 -1.5050 0.72 0.4309 0.62SM i -0.0073 0.58 -0.0071 0.55 0.0089 0.33 0.0057 0.40 0.0012 0.84 -0.0170 0.09SH i 0.0624 0.12 0.0430 0.23 0.0370 0.17 -0.0067 0.64 -0.0091 0.52 -0.0036 0.84YR i 0.0022 0.93 -0.0314 0.30 -0.0313 0.16 -0.0337 0.04 -0.0330 0.03 -0.0054 0.79DS i -2.3420 0.12 -1.9552 0.12 -0.4559 0.59 - - - - - - DFMIN i -0.0324 0.94 0.1048 0.80 -0.1335 0.76 0.6072 0.71 0.6359 0.69 -0.0744 0.95DFMAJ i -0.3595 0.58 -0.5883 0.32 -0.7325 0.09 0.3631 0.51 0.3223 0.46 2.1876 0.19DFHVY i 0.7994 0.51 -0.3855 0.69 -0.6634 0.37 -0.1133 0.88 0.0486 0.94 0.5499 0.32TestDFs 0.47 0.62 0.52 0.58 0.58 0.56 0.15 0.86 0.10 0.91 0.59 0.55Obs./R2 105 0.40 119 0.38 180 0.33 116 0.35 130 0.35 265 0.29
NON-METALLIC MINERAL PRODUCTS, eq. (2)
BASIC METALS, eq. (1); SOE and East Indonesian plants omitted for 2006
BASIC METALS, eq. (2); SOE and East Indonesian plants omitted for 2006
75

Appendix Table 5 (continued)Indepen- 1996 2006dent Initial capital Ending capital No capital Initial capital Ending capital No capitalvariable,statistic Value P-
val. Value P-val. Value P-
val. Value P-val. Value P-
val. Value P-val.
LK i -0.0076 0.85 -0.0106 0.78 - - -0.0169 0.72 0.0118 0.73 - - LL i 0.0477 0.74 0.0509 0.71 0.0302 0.74 0.3344 0.11 0.1993 0.25 -0.1086 0.48LM i -0.4192 0.00 -0.4043 0.00 -0.3167 0.00 -0.5194 0.00 -0.4451 0.00 -0.2400 0.01LE i 0.1852 0.00 0.1937 0.00 0.1713 0.00 0.2199 0.00 0.2146 0.00 0.1792 0.00RD i -0.1717 0.66 -0.3642 0.17 -0.3315 0.06 -0.9116 0.01 -1.0593 0.00 -1.1179 0.01SM i -0.0043 0.26 -0.0032 0.38 -0.0030 0.31 0.0039 0.69 0.0028 0.75 0.0037 0.57SH i 0.0011 0.92 -0.0016 0.89 0.0060 0.54 0.0135 0.37 0.0147 0.30 -0.0029 0.82YR i -0.0434 0.02 -0.0451 0.01 -0.0261 0.04 -0.0183 0.27 -0.0124 0.39 0.0295 0.07DF i 0.7964 0.01 0.7109 0.02 0.3919 0.08 -0.0602 0.89 -0.1476 0.71 0.2343 0.26Obs./R2 168 0.35 185 0.34 261 0.30 131 0.35 150 0.34 320 0.27
LK i -0.0050 0.91 -0.0076 0.84 - - -0.0063 0.89 0.0191 0.58 - - LL i 0.0316 0.83 0.0340 0.81 0.0019 0.98 0.3513 0.09 0.2208 0.21 -0.0999 0.52LM i -0.4206 0.00 -0.4074 0.00 -0.3070 0.00 -0.5359 0.00 -0.4645 0.00 -0.2438 0.01LE i 0.1892 0.00 0.1983 0.00 0.1745 0.00 0.2272 0.00 0.2225 0.00 0.1823 0.00RD i -0.1166 0.75 -0.3103 0.23 -0.3078 0.08 -0.7808 0.04 -0.9424 0.01 -1.0778 0.01SM i -0.0040 0.30 -0.0028 0.46 -0.0027 0.35 0.0038 0.70 0.0027 0.76 0.0041 0.52SH i -0.0008 0.95 -0.0039 0.76 0.0032 0.76 0.0106 0.47 0.0123 0.38 -0.0021 0.87YR i -0.0420 0.02 -0.0435 0.01 -0.0253 0.04 -0.0207 0.24 -0.0157 0.31 0.0296 0.07DFMIN i 1.0177 0.00 1.0067 0.00 0.7655 0.05 1.4639 0.00 1.4183 0.00 1.3418 0.08DFMAJ i 0.4904 0.38 0.3613 0.47 0.2059 0.45 -0.1694 0.73 -0.1860 0.68 -0.3465 0.06DFHVY i 1.0978 0.04 1.0870 0.05 0.4543 0.37 -0.2778 0.57 -0.3783 0.42 0.2445 0.36TestDFs 0.40 0.67 0.71 0.49 0.77 0.47 13.80 0.00 12.89 0.00 4.29 0.01Obs./R2 168 0.35 185 0.34 261 0.30 131 0.37 150 0.36 320 0.29
LK i 0.0704 0.50 0.1295 0.19 - - 0.0208 0.85 -0.0194 0.85 - - LL i 0.1495 0.46 -0.0692 0.78 -0.1391 0.38 -0.8723 0.01 -0.7294 0.01 -0.0950 0.71LM i -0.6677 0.00 -0.5813 0.01 -0.3533 0.00 -0.2483 0.12 -0.2384 0.08 -0.4235 0.01LE i 0.2684 0.00 0.2999 0.00 0.2545 0.00 0.5147 0.00 0.4843 0.00 0.4805 0.00RD i -0.3400 0.16 -0.4031 0.10 -0.1178 0.51 0.3904 0.70 0.4159 0.68 0.7357 0.55SM i 0.0089 0.09 0.0118 0.04 0.0066 0.10 0.0241 0.08 0.0235 0.07 0.0105 0.30SH i -0.0051 0.84 0.0010 0.98 0.0429 0.14 -0.0526 0.11 -0.0544 0.09 -0.0238 0.37YR i -0.0125 0.50 -0.0229 0.21 -0.0005 0.98 -0.0009 0.96 -0.0023 0.88 -0.0012 0.93DS i -0.3640 0.32 -0.6050 0.16 -0.8251 0.03 -0.3186 0.70 -0.2360 0.78 -0.8969 0.18DF i 0.2005 0.58 -0.0600 0.89 -0.0018 1.00 0.3198 0.69 0.2761 0.71 0.3068 0.61Obs./R2 207 0.34 227 0.35 320 0.29 166 0.35 187 0.35 358 0.26
MOTOR VEHICLES, eq. (2); SOE and East Indonesian plants omitted
OTHER TRANSPORTATION MACHINERY, eq. (1)
MOTOR VEHICLES, eq. (1); SOE & East Indonesian plants omitted
76

Appendix Table 5 (continued)Indepen- 1996 2006dent Initial capital Ending capital No capital Initial capital Ending capital No capitalvariable,statistic Value P-
val. Value P-val. Value P-
val. Value P-val. Value P-
val. Value P-val.
LK i 0.0694 0.51 0.1280 0.20 - - 0.0262 0.81 -0.0152 0.88 - - LL i 0.1587 0.47 -0.0423 0.87 -0.1441 0.38 -0.8769 0.01 -0.7292 0.01 -0.1065 0.68LM i -0.6778 0.00 -0.5993 0.00 -0.3622 0.00 -0.2499 0.13 -0.2409 0.08 -0.4450 0.01LE i 0.2769 0.00 0.3100 0.00 0.2698 0.00 0.5197 0.00 0.4893 0.00 0.4922 0.00RD i -0.3138 0.20 -0.3775 0.12 -0.0652 0.70 0.3613 0.72 0.3889 0.70 0.7058 0.56SM i 0.0089 0.09 0.0120 0.04 0.0063 0.12 0.0239 0.08 0.0233 0.08 0.0107 0.30SH i -0.0051 0.84 -0.0002 1.00 0.0426 0.15 -0.0529 0.11 -0.0550 0.08 -0.0234 0.38YR i -0.0134 0.48 -0.0247 0.19 -0.0021 0.90 0.0003 0.99 -0.0016 0.92 -0.0034 0.81DS i -0.3817 0.30 -0.6188 0.15 -0.8266 0.03 -0.3322 0.69 -0.2457 0.77 -0.8841 0.19DFMAJ i 0.0812 0.84 -0.1216 0.77 -0.4803 0.08 -0.3070 0.72 -0.0039 1.00 0.8859 0.31DFHVY i -0.3226 0.46 -0.9866 0.18 -0.4406 0.25 0.3129 0.72 0.2439 0.77 0.0122 0.99TestDFs 0.36 0.55 1.00 0.32 0.01 0.92 0.34 0.56 0.07 0.80 0.99 0.32Obs./R2 206 0.35 226 0.35 314 0.30 165 0.35 186 0.35 356 0.26
OTHER TRANSPORTATION MACHINERY, eq. (2); minority-foreign plants omitted
Notes: - = estimate could not be obtained; in the Obs./R2 rows, the coefficient column contains the number of observations and the P-value column contains the R-squared; the TestDFs rows show Wald tests of the hypothesis that coefficients on all foreign ownership dummies are equal and associated p-values; industry and region dummies also included as relevant (see explanation in the text); full results including the constant and all dummies are available from the authors.
77

Indepen- 1996 2006dent Initial capital Ending capital No capital Initial capital Ending capital No capitalvariable,statistic Value P-
val. Value P-val. Value P-
val. Value P-val. Value P-
val. Value P-val.
LK i 0.0051 0.17 0.0028 0.44 - - 0.0114 0.04 0.0077 0.16 - - LL i 0.0199 0.23 0.0280 0.07 0.0113 0.34 0.0440 0.02 0.0372 0.04 0.0647 0.00LM i -0.0457 0.00 -0.0463 0.00 -0.0359 0.00 -0.0236 0.00 -0.0224 0.00 -0.0275 0.00LE i 0.3090 0.00 0.2998 0.00 0.2760 0.00 0.3346 0.00 0.3341 0.00 0.2376 0.00RD i -0.0205 0.32 -0.0166 0.40 -0.0140 0.37 -0.0450 0.24 -0.0325 0.26 -0.0003 0.99SM i 0.0005 0.31 0.0005 0.24 0.0005 0.24 0.0007 0.05 0.0008 0.02 0.0006 0.02SH i -0.0019 0.32 -0.0016 0.43 -0.0016 0.46 -0.0046 0.02 -0.0041 0.02 -0.0009 0.40YR i 0.0012 0.36 0.0014 0.27 0.0007 0.46 -0.0009 0.37 -0.0006 0.55 0.0026 0.00DS i -0.1585 0.00 -0.1482 0.00 -0.0997 0.01 0.0448 0.70 0.0500 0.65 0.0097 0.83DF i -0.0684 0.28 -0.0782 0.18 -0.0765 0.09 -0.0593 0.56 -0.0590 0.53 0.0437 0.43Obs./R2 8,044 0.36 8,682 0.36 11,688 0.34 7,159 0.32 7,809 0.32 13,470 0.26
LK i 0.0050 0.18 0.0028 0.45 - - 0.0117 0.03 0.0080 0.14 - - LL i 0.0204 0.22 0.0287 0.06 0.0129 0.28 0.0454 0.02 0.0388 0.03 0.0654 0.00LM i -0.0455 0.00 -0.0463 0.00 -0.0364 0.00 -0.0243 0.00 -0.0232 0.00 -0.0276 0.00LE i 0.3092 0.00 0.2999 0.00 0.2761 0.00 0.3349 0.00 0.3345 0.00 0.2377 0.00RD i -0.0214 0.31 -0.0171 0.39 -0.0141 0.37 -0.0425 0.26 -0.0303 0.29 0.0007 0.98SM i 0.0005 0.31 0.0005 0.24 0.0004 0.24 0.0007 0.05 0.0007 0.03 0.0006 0.02SH i -0.0019 0.32 -0.0016 0.42 -0.0017 0.43 -0.0045 0.02 -0.0040 0.02 -0.0008 0.42YR i 0.0012 0.36 0.0014 0.27 0.0007 0.45 -0.0008 0.40 -0.0005 0.59 0.0026 0.00DS i -0.1602 0.00 -0.1495 0.00 -0.1013 0.01 0.0427 0.71 0.0475 0.67 0.0092 0.84DFMIN i -0.2896 0.20 -0.2777 0.19 -0.3166 0.03 -0.4642 0.03 -0.4954 0.02 -0.1804 0.08DFMAJ i -0.0544 0.55 -0.0530 0.52 -0.0187 0.77 -0.0269 0.85 -0.0366 0.78 0.0549 0.46DFHVY i -0.0025 0.97 -0.0442 0.46 -0.0642 0.17 -0.0234 0.87 -0.0157 0.91 0.0644 0.42TestDFs 0.85 0.43 0.59 0.56 1.93 0.15 1.82 0.16 2.19 0.11 2.25 0.11Obs./R2 8,044 0.36 8,682 0.36 11,688 0.34 7,159 0.32 7,809 0.33 13,470 0.26
LK i 0.0010 0.62 -0.0009 0.72 - - -0.0041 0.02 -0.0061 0.02 - - LL i -0.0093 0.46 -0.0018 0.88 0.0029 0.81 -0.0057 0.57 -0.0034 0.72 0.0264 0.03LM i -0.0297 0.06 -0.0325 0.02 -0.0285 0.01 -0.0096 0.19 -0.0106 0.15 -0.0256 0.00LE i 0.1718 0.00 0.1814 0.00 0.1662 0.00 0.2016 0.00 0.2136 0.00 0.1462 0.00RD i -0.0003 0.98 -0.0043 0.70 -0.0106 0.37 0.0025 0.58 0.0074 0.29 0.0509 0.43SM i 0.0007 0.17 0.0002 0.73 0.0001 0.81 0.0006 0.11 0.0007 0.05 0.0004 0.24SH i 0.0024 0.44 0.0078 0.18 0.0058 0.14 0.0001 0.94 0.0003 0.87 0.0012 0.44YR i -0.0004 0.36 -0.0003 0.42 -0.0004 0.27 0.0003 0.43 0.0003 0.37 0.0018 0.00DS i -0.0552 0.13 -0.0614 0.09 -0.0653 0.02 0.0083 0.67 0.0065 0.74 -0.0224 0.08DF i -0.0518 0.31 -0.0693 0.20 -0.0375 0.32 -0.1299 0.01 -0.1457 0.01 -0.0464 0.04Obs./R2 3,074 0.39 3,268 0.42 4,299 0.38 3,268 0.36 3,528 0.36 5,543 0.23
Appendix Table 6: OLS Estimates of SOE- and MNC-Private Natural Gas Fuel Intensity Differentials and Other Slope Coefficients from Equations (1) and (2); all p-values based on robust standard errors
8 LARGE NATURAL GAS FUEL USING INDUSTRIES COMBINED, eq. (1)
8 LARGE NATURAL GAS FUEL USING INDUSTRIES COMBINED, eq. (2)
FOOD & BEVERAGES, eq. (1)
78
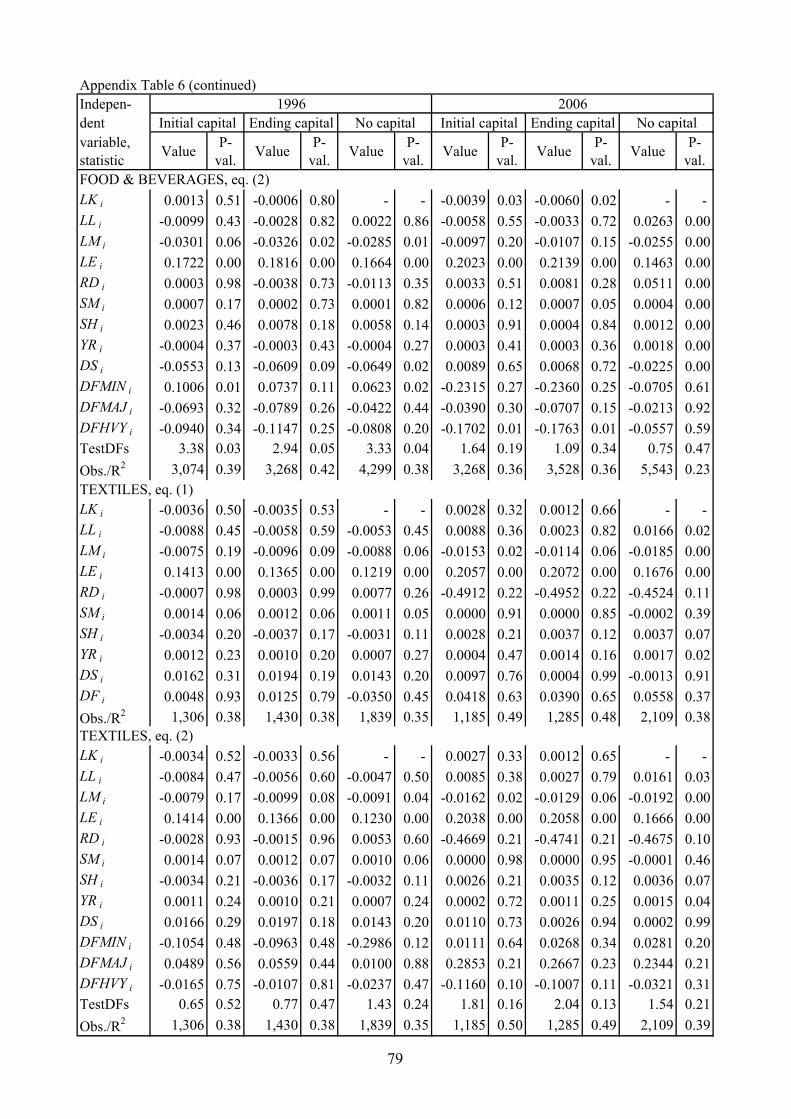
Appendix Table 6 (continued)Indepen- 1996 2006dent Initial capital Ending capital No capital Initial capital Ending capital No capitalvariable,statistic Value P-
val. Value P-val. Value P-
val. Value P-val. Value P-
val. Value P-val.
LK i 0.0013 0.51 -0.0006 0.80 - - -0.0039 0.03 -0.0060 0.02 - - LL i -0.0099 0.43 -0.0028 0.82 0.0022 0.86 -0.0058 0.55 -0.0033 0.72 0.0263 0.00LM i -0.0301 0.06 -0.0326 0.02 -0.0285 0.01 -0.0097 0.20 -0.0107 0.15 -0.0255 0.00LE i 0.1722 0.00 0.1816 0.00 0.1664 0.00 0.2023 0.00 0.2139 0.00 0.1463 0.00RD i 0.0003 0.98 -0.0038 0.73 -0.0113 0.35 0.0033 0.51 0.0081 0.28 0.0511 0.00SM i 0.0007 0.17 0.0002 0.73 0.0001 0.82 0.0006 0.12 0.0007 0.05 0.0004 0.00SH i 0.0023 0.46 0.0078 0.18 0.0058 0.14 0.0003 0.91 0.0004 0.84 0.0012 0.00YR i -0.0004 0.37 -0.0003 0.43 -0.0004 0.27 0.0003 0.41 0.0003 0.36 0.0018 0.00DS i -0.0553 0.13 -0.0609 0.09 -0.0649 0.02 0.0089 0.65 0.0068 0.72 -0.0225 0.00DFMIN i 0.1006 0.01 0.0737 0.11 0.0623 0.02 -0.2315 0.27 -0.2360 0.25 -0.0705 0.61DFMAJ i -0.0693 0.32 -0.0789 0.26 -0.0422 0.44 -0.0390 0.30 -0.0707 0.15 -0.0213 0.92DFHVY i -0.0940 0.34 -0.1147 0.25 -0.0808 0.20 -0.1702 0.01 -0.1763 0.01 -0.0557 0.59TestDFs 3.38 0.03 2.94 0.05 3.33 0.04 1.64 0.19 1.09 0.34 0.75 0.47Obs./R2 3,074 0.39 3,268 0.42 4,299 0.38 3,268 0.36 3,528 0.36 5,543 0.23
LK i -0.0036 0.50 -0.0035 0.53 - - 0.0028 0.32 0.0012 0.66 - - LL i -0.0088 0.45 -0.0058 0.59 -0.0053 0.45 0.0088 0.36 0.0023 0.82 0.0166 0.02LM i -0.0075 0.19 -0.0096 0.09 -0.0088 0.06 -0.0153 0.02 -0.0114 0.06 -0.0185 0.00LE i 0.1413 0.00 0.1365 0.00 0.1219 0.00 0.2057 0.00 0.2072 0.00 0.1676 0.00RD i -0.0007 0.98 0.0003 0.99 0.0077 0.26 -0.4912 0.22 -0.4952 0.22 -0.4524 0.11SM i 0.0014 0.06 0.0012 0.06 0.0011 0.05 0.0000 0.91 0.0000 0.85 -0.0002 0.39SH i -0.0034 0.20 -0.0037 0.17 -0.0031 0.11 0.0028 0.21 0.0037 0.12 0.0037 0.07YR i 0.0012 0.23 0.0010 0.20 0.0007 0.27 0.0004 0.47 0.0014 0.16 0.0017 0.02DS i 0.0162 0.31 0.0194 0.19 0.0143 0.20 0.0097 0.76 0.0004 0.99 -0.0013 0.91DF i 0.0048 0.93 0.0125 0.79 -0.0350 0.45 0.0418 0.63 0.0390 0.65 0.0558 0.37Obs./R2 1,306 0.38 1,430 0.38 1,839 0.35 1,185 0.49 1,285 0.48 2,109 0.38
LK i -0.0034 0.52 -0.0033 0.56 - - 0.0027 0.33 0.0012 0.65 - - LL i -0.0084 0.47 -0.0056 0.60 -0.0047 0.50 0.0085 0.38 0.0027 0.79 0.0161 0.03LM i -0.0079 0.17 -0.0099 0.08 -0.0091 0.04 -0.0162 0.02 -0.0129 0.06 -0.0192 0.00LE i 0.1414 0.00 0.1366 0.00 0.1230 0.00 0.2038 0.00 0.2058 0.00 0.1666 0.00RD i -0.0028 0.93 -0.0015 0.96 0.0053 0.60 -0.4669 0.21 -0.4741 0.21 -0.4675 0.10SM i 0.0014 0.07 0.0012 0.07 0.0010 0.06 0.0000 0.98 0.0000 0.95 -0.0001 0.46SH i -0.0034 0.21 -0.0036 0.17 -0.0032 0.11 0.0026 0.21 0.0035 0.12 0.0036 0.07YR i 0.0011 0.24 0.0010 0.21 0.0007 0.24 0.0002 0.72 0.0011 0.25 0.0015 0.04DS i 0.0166 0.29 0.0197 0.18 0.0143 0.20 0.0110 0.73 0.0026 0.94 0.0002 0.99DFMIN i -0.1054 0.48 -0.0963 0.48 -0.2986 0.12 0.0111 0.64 0.0268 0.34 0.0281 0.20DFMAJ i 0.0489 0.56 0.0559 0.44 0.0100 0.88 0.2853 0.21 0.2667 0.23 0.2344 0.21DFHVY i -0.0165 0.75 -0.0107 0.81 -0.0237 0.47 -0.1160 0.10 -0.1007 0.11 -0.0321 0.31TestDFs 0.65 0.52 0.77 0.47 1.43 0.24 1.81 0.16 2.04 0.13 1.54 0.21Obs./R2 1,306 0.38 1,430 0.38 1,839 0.35 1,185 0.50 1,285 0.49 2,109 0.39
FOOD & BEVERAGES, eq. (2)
TEXTILES, eq. (1)
TEXTILES, eq. (2)
79

Appendix Table 6 (continued)Indepen- 1996 2006dent Initial capital Ending capital No capital Initial capital Ending capital No capitalvariable,statistic Value P-
val. Value P-val. Value P-
val. Value P-val. Value P-
val. Value P-val.
LK i -0.0662 0.09 -0.0443 0.38 - - 0.0614 0.13 0.0531 0.16 - - LL i 0.0190 0.72 0.0328 0.56 -0.0081 0.78 0.0082 0.93 -0.0084 0.92 0.0833 0.28LM i 0.0329 0.12 0.0169 0.57 0.0008 0.94 -0.0791 0.26 -0.0495 0.40 -0.0491 0.24LE i 0.2419 0.00 0.1905 0.00 0.1888 0.00 0.2211 0.01 0.2067 0.01 0.1388 0.01RD i 0.0179 0.43 0.0201 0.48 0.0325 0.29 0.2777 0.31 0.2525 0.33 0.3462 0.28SM i -0.0003 0.81 0.0017 0.20 0.0011 0.22 0.0006 0.59 0.0002 0.82 -0.0002 0.79SH i 0.0008 0.89 -0.0161 0.16 -0.0117 0.11 -0.0077 0.31 -0.0091 0.23 0.0005 0.87YR i -0.0037 0.15 0.0010 0.76 0.0008 0.73 0.0096 0.51 0.0101 0.46 0.0177 0.21DS i 0.9655 0.19 1.3146 0.19 1.0597 0.23 4.8174 0.25 4.8381 0.25 1.2219 0.29DF i 0.0718 0.28 -0.1955 0.18 -0.1770 0.14 0.0163 0.91 -0.0316 0.81 0.0185 0.84Obs./R2 186 0.72 214 0.59 339 0.58 229 0.40 263 0.39 490 0.23
LK i -0.0662 0.09 -0.0394 0.42 - - 0.0616 0.13 0.0526 0.16 - - LL i 0.0187 0.73 0.0457 0.43 -0.0031 0.92 0.0072 0.94 -0.0007 0.99 0.0850 0.29LM i 0.0332 0.14 0.0026 0.93 -0.0084 0.50 -0.0786 0.25 -0.0581 0.30 -0.0514 0.20LE i 0.2419 0.00 0.1937 0.00 0.1939 0.00 0.2207 0.01 0.2066 0.01 0.1375 0.02RD i 0.0179 0.44 0.0211 0.42 0.0338 0.23 0.2758 0.31 0.2647 0.29 0.3515 0.23SM i -0.0003 0.81 0.0016 0.22 0.0010 0.22 0.0006 0.60 0.0004 0.71 -0.0001 0.89SH i 0.0007 0.92 -0.0107 0.30 -0.0073 0.19 -0.0078 0.32 -0.0083 0.27 0.0005 0.88YR i -0.0037 0.16 0.0007 0.83 0.0001 0.96 0.0096 0.51 0.0100 0.47 0.0176 0.22DS i 0.9658 0.20 1.2738 0.19 1.0268 0.23 4.8179 0.25 4.8494 0.24 1.2264 0.29DFMIN i - - - - - - 0.1002 0.58 -0.4716 0.38 -0.1889 0.37DFMAJ i 0.0690 0.22 0.0143 0.82 0.0050 0.87 0.0431 0.94 0.1063 0.84 0.2316 0.61DFHVY i 0.0846 0.63 -0.6697 0.12 -0.7918 0.10 -0.0027 0.99 -0.0012 0.99 0.0080 0.92TestDFs 0.01 0.92 2.69 0.10 2.85 0.09 0.14 0.87 0.43 0.65 0.81 0.44Obs./R2 186 0.72 214 0.59 336 0.59 229 0.34 263 0.39 490 0.23
LK i -0.0127 0.11 -0.0120 0.11 - - 0.0105 0.31 -0.0060 0.74 - - LL i 0.0214 0.46 0.0221 0.43 0.0117 0.80 0.0742 0.21 0.0561 0.35 0.0545 0.04LM i -0.0179 0.27 -0.0180 0.27 -0.0196 0.27 -0.0411 0.10 -0.0417 0.06 -0.0319 0.01LE i 0.2489 0.00 0.2388 0.00 0.2827 0.00 0.2556 0.00 0.2342 0.00 0.1754 0.00RD i -0.0257 0.40 -0.0243 0.41 -0.0247 0.44 -0.0941 0.31 -0.0281 0.45 -0.0242 0.37SM i -0.0005 0.54 -0.0004 0.55 -0.0017 0.19 0.0008 0.39 0.0010 0.29 0.0005 0.31SH i -0.0004 0.80 -0.0006 0.73 -0.0026 0.23 -0.0013 0.64 0.0000 0.99 -0.0009 0.60YR i -0.0032 0.11 -0.0028 0.12 -0.0028 0.35 0.0015 0.42 0.0023 0.25 0.0037 0.03DS i -0.0155 0.86 -0.0026 0.98 -0.0527 0.54 -0.0311 0.62 -0.0006 0.99 -0.0132 0.56DF i 0.0427 0.43 0.0555 0.28 0.0758 0.31 -0.2206 0.03 -0.1482 0.08 -0.0611 0.08Obs./R2 630 0.42 665 0.40 994 0.38 493 0.41 544 0.38 1,099 0.30
PAPER PRODUCTS, eq. (1); East Indonesian plants omitted for 1996
PAPER PRODUCTS, eq. (2), minority-foreign & East Indonesian plants omitted for 1996
CHEMICALS, eq. (1)
80

Appendix Table 6 (continued)Indepen- 1996 2006dent Initial capital Ending capital No capital Initial capital Ending capital No capitalvariable,statistic Value P-
val. Value P-val. Value P-
val. Value P-val. Value P-
val. Value P-val.
LK i -0.0128 0.11 -0.0120 0.12 - - 0.0091 0.38 -0.0069 0.71 - - LL i 0.0228 0.43 0.0236 0.40 0.0150 0.75 0.0736 0.21 0.0546 0.36 0.0549 0.03LM i -0.0192 0.24 -0.0192 0.24 -0.0223 0.24 -0.0380 0.12 -0.0387 0.08 -0.0315 0.01LE i 0.2489 0.00 0.2386 0.00 0.2822 0.00 0.2587 0.00 0.2364 0.00 0.1757 0.00RD i -0.0245 0.39 -0.0232 0.41 -0.0225 0.45 -0.0976 0.30 -0.0296 0.43 -0.0242 0.38SM i -0.0005 0.55 -0.0004 0.54 -0.0017 0.19 0.0009 0.34 0.0011 0.29 0.0005 0.31SH i -0.0004 0.80 -0.0006 0.74 -0.0026 0.23 -0.0016 0.58 -0.0002 0.93 -0.0010 0.58YR i -0.0032 0.11 -0.0029 0.12 -0.0028 0.35 0.0018 0.37 0.0025 0.23 0.0037 0.03DS i -0.0139 0.88 -0.0015 0.99 -0.0515 0.55 -0.0382 0.55 -0.0051 0.92 -0.0145 0.53DFMIN i 0.0579 0.23 0.0543 0.21 0.0535 0.19 -0.1363 0.45 -0.0859 0.54 -0.0676 0.36DFMAJ i 0.0782 0.32 0.0901 0.22 0.1440 0.17 -0.4942 0.05 -0.3718 0.07 -0.1186 0.08DFHVY i -0.0397 0.64 -0.0121 0.87 -0.0613 0.55 -0.1117 0.25 -0.0573 0.51 -0.0273 0.45TestDFs 0.64 0.53 0.57 0.56 1.20 0.30 1.05 0.35 1.07 0.35 0.82 0.44Obs./R2 630 0.42 665 0.40 994 0.38 493 0.41 544 0.38 1,099 0.30
LK i -0.0016 0.25 0.0005 0.82 - - 0.0089 0.15 0.0070 0.20 - - LL i -0.0131 0.04 -0.0051 0.48 -0.0092 0.15 -0.0562 0.18 -0.0466 0.22 0.0310 0.06LM i 0.0045 0.06 0.0028 0.38 0.0025 0.36 0.0083 0.46 0.0069 0.49 -0.0130 0.02LE i 0.0581 0.00 0.0858 0.00 0.0975 0.00 0.3680 0.00 0.3830 0.00 0.1858 0.00RD i 0.0012 0.75 0.0022 0.43 0.0005 0.86 -0.2130 0.26 -0.1923 0.25 -0.1857 0.06SM i -0.0001 0.65 -0.0002 0.24 -0.0002 0.29 0.0008 0.26 0.0006 0.29 -0.0004 0.12SH i -0.0011 0.20 -0.0015 0.12 -0.0020 0.05 -0.0024 0.18 -0.0025 0.13 0.0013 0.34YR i 0.0005 0.13 0.0003 0.49 0.0000 0.99 0.0000 1.00 -0.0004 0.78 0.0016 0.13DS i 0.0214 0.05 0.0136 0.10 0.0138 0.05 0.0109 0.73 0.0146 0.57 -0.0005 0.98DF i 0.0242 0.02 -0.0002 0.99 0.0061 0.58 0.0021 0.99 -0.0089 0.93 0.0552 0.39Obs./R2 868 0.41 972 0.52 1,432 0.54 744 0.46 848 0.49 1,712 0.30
LK i -0.0016 0.24 0.0005 0.84 - - 0.0092 0.14 0.0071 0.19 - - LL i -0.0131 0.04 -0.0051 0.48 -0.0092 0.14 -0.0537 0.20 -0.0445 0.24 0.0305 0.06LM i 0.0046 0.06 0.0029 0.37 0.0025 0.36 0.0056 0.62 0.0049 0.62 -0.0135 0.01LE i 0.0580 0.00 0.0858 0.00 0.0975 0.00 0.3691 0.00 0.3841 0.00 0.1858 0.00RD i 0.0014 0.68 0.0026 0.36 0.0006 0.84 -0.2402 0.21 -0.2126 0.21 -0.1939 0.05SM i -0.0001 0.68 -0.0002 0.25 -0.0002 0.29 0.0008 0.24 0.0007 0.28 -0.0004 0.14SH i -0.0011 0.20 -0.0015 0.12 -0.0020 0.05 -0.0023 0.19 -0.0024 0.14 0.0014 0.30YR i 0.0005 0.12 0.0003 0.48 0.0000 1.00 0.0000 0.97 -0.0003 0.81 0.0015 0.13DS i 0.0218 0.04 0.0141 0.09 0.0139 0.05 0.0111 0.72 0.0142 0.58 -0.0003 0.98DFMIN i 0.0258 0.03 0.0283 0.02 0.0199 0.04 -0.5270 0.30 -0.5541 0.29 -0.1283 0.43DFMAJ i 0.0335 0.09 0.0063 0.70 0.0066 0.58 0.2220 0.23 0.1883 0.25 0.1484 0.23DFHVY i 0.0142 0.08 -0.0130 0.62 0.0023 0.90 -0.0241 0.85 -0.0297 0.81 0.0274 0.73TestDFs 1.43 0.24 1.32 0.27 0.70 0.50 1.32 0.27 1.31 0.27 0.96 0.38Obs./R2 868 0.41 972 0.52 1,432 0.54 744 0.46 848 0.50 1,712 0.30
CHEMICALS, eq. (2)
RUBBER & PLASTIC PRODUCTS, eq. (1)
RUBBER & PLASTIC PRODUCTS, eq. (2)
81

Appendix Table 6 (continued)Indepen- 1996 2006dent Initial capital Ending capital No capital Initial capital Ending capital No capitalvariable,statistic Value P-
val. Value P-val. Value P-
val. Value P-val. Value P-
val. Value P-val.
LK i 0.0681 0.11 0.0600 0.15 - - 0.0168 0.65 0.0103 0.76 - - LL i 0.2316 0.11 0.1891 0.14 0.0394 0.69 0.1970 0.24 0.1893 0.23 0.2407 0.03LM i -0.3310 0.00 -0.2895 0.00 -0.1702 0.01 -0.0196 0.80 -0.0230 0.75 0.0199 0.63LE i 0.7878 0.00 0.7690 0.00 0.7379 0.00 0.8477 0.00 0.8580 0.00 0.6707 0.00RD i 0.2350 0.42 0.2290 0.40 -0.0230 0.92 0.2780 0.66 0.2765 0.66 0.1617 0.69SM i 0.0038 0.35 0.0033 0.36 0.0025 0.44 -0.0016 0.64 -0.0014 0.66 -0.0001 0.96SH i -0.0055 0.76 -0.0053 0.76 -0.0231 0.31 -0.0123 0.45 -0.0118 0.43 -0.0127 0.24YR i 0.0144 0.08 0.0136 0.07 0.0110 0.12 -0.0074 0.41 -0.0077 0.37 -0.0020 0.69DS i -0.7077 0.28 -0.6475 0.29 -0.5623 0.27 -3.0625 0.02 -3.0637 0.02 -0.9211 0.03DF i -1.9192 0.02 -1.8845 0.02 -1.5271 0.02 0.0004 1.00 -0.0672 0.96 0.0969 0.88Obs./R2 1,217 0.59 1,288 0.59 1,596 0.56 672 0.53 710 0.54 1,276 0.50
LK i 0.0844 0.05 0.0755 0.07 - - 0.0111 0.75 0.0045 0.89 - - LL i 0.2419 0.10 0.1986 0.13 0.0643 0.52 0.3267 0.05 0.3008 0.05 0.2813 0.01LM i -0.3357 0.00 -0.2943 0.00 -0.1734 0.01 -0.0502 0.52 -0.0483 0.51 0.0124 0.77LE i 0.7914 0.00 0.7727 0.00 0.7426 0.00 0.8480 0.00 0.8615 0.00 0.6702 0.00RD i 0.0514 0.83 0.0553 0.80 -0.1480 0.43 0.4627 0.57 0.4834 0.55 0.2940 0.49SM i 0.0042 0.28 0.0036 0.30 0.0030 0.34 -0.0013 0.69 -0.0012 0.70 0.0001 0.97SH i -0.0045 0.80 -0.0044 0.80 -0.0236 0.30 -0.0159 0.37 -0.0137 0.38 -0.0144 0.19YR i 0.0147 0.08 0.0139 0.06 0.0114 0.10 -0.0051 0.53 -0.0056 0.48 -0.0013 0.79DS i -0.7662 0.25 -0.7061 0.25 -0.6264 0.22 -3.1435 0.02 -3.1705 0.02 -0.9444 0.02DFMIN i -3.7310 0.05 -3.6754 0.05 -3.7978 0.02 -2.7115 0.15 -2.6911 0.15 -1.7687 0.12DFMAJ i -1.8370 0.10 -1.7843 0.11 -1.1336 0.14 -2.1399 0.36 -2.2287 0.34 -0.5515 0.34DFHVY i 0.0320 0.88 0.0374 0.85 0.0629 0.70 1.6578 0.47 1.3500 0.50 1.1324 0.39TestDFs 3.13 0.04 3.17 0.04 3.68 0.03 1.06 0.35 1.11 0.33 1.31 0.27Obs./R2 1,217 0.59 1,288 0.59 1,596 0.57 672 0.55 710 0.55 1,276 0.51
LK i -0.0098 0.36 -0.0029 0.82 - - -0.0025 0.83 0.0091 0.49 - - LE i 0.0250 0.56 -0.0116 0.79 0.0861 0.18 0.0488 0.71 -0.0754 0.64 0.0058 0.93LM i -0.0205 0.13 -0.0182 0.16 -0.0309 0.11 -0.0327 0.36 -0.0190 0.59 -0.0179 0.49LL i 0.0556 0.00 0.0600 0.00 0.0914 0.00 0.1122 0.00 0.1281 0.00 0.0980 0.00RD i 1.1244 0.12 0.9602 0.18 0.0045 0.96 -0.2667 0.86 -0.1476 0.91 -0.0011 0.97SM i 0.0006 0.55 0.0006 0.45 0.0009 0.48 -0.0011 0.70 -0.0001 0.96 -0.0007 0.64SH i 0.0041 0.22 0.0014 0.55 -0.0005 0.90 -0.0015 0.65 -0.0023 0.49 -0.0004 0.87YR i 0.0024 0.67 0.0026 0.61 -0.0102 0.32 -0.0028 0.57 -0.0048 0.33 0.0112 0.09DS i -0.0102 0.92 0.0546 0.55 -0.0424 0.72 - - - - - - DF i 0.1078 0.22 0.0992 0.19 -0.0314 0.70 -0.0662 0.51 0.0845 0.57 0.2272 0.19Obs./R2 105 0.68 119 0.68 180 0.49 116 0.52 130 0.51 265 0.34
NON-METALLIC MINERAL PRODUCTS, eq. (2)
NON-METALLIC MINERAL PRODUCTS, eq. (1)
BASIC METALS, eq. (1); SOE and East Indonesian plants omitted for 2006
82

Appendix Table 6 (continued)Indepen- 1996 2006dent Initial capital Ending capital No capital Initial capital Ending capital No capitalvariable,statistic Value P-
val. Value P-val. Value P-
val. Value P-val. Value P-
val. Value P-val.
LK i -0.0104 0.34 -0.0040 0.75 - - 0.0046 0.55 0.0151 0.16 - - LL i 0.0272 0.53 -0.0068 0.88 0.0876 0.18 0.0503 0.71 -0.0736 0.65 0.0053 0.93LM i -0.0219 0.14 -0.0206 0.16 -0.0310 0.11 -0.0369 0.34 -0.0208 0.57 -0.0134 0.58LE i 0.0554 0.00 0.0598 0.00 0.0915 0.00 0.1157 0.00 0.1303 0.00 0.0980 0.00RD i 1.1087 0.13 0.9269 0.21 0.0120 0.90 -0.2521 0.86 -0.3609 0.76 0.0031 0.91SM i 0.0006 0.54 0.0007 0.44 0.0009 0.47 -0.0014 0.61 -0.0006 0.80 -0.0010 0.52SH i 0.0040 0.23 0.0014 0.57 -0.0006 0.89 -0.0010 0.77 -0.0015 0.66 0.0001 0.97YR i 0.0023 0.66 0.0023 0.65 -0.0109 0.31 -0.0019 0.71 -0.0030 0.54 0.0128 0.08DS i -0.0006 1.00 0.0690 0.48 -0.0409 0.73 - - - - - - DFMIN i 0.0125 0.67 0.0180 0.54 0.0871 0.36 -0.4797 0.23 -0.4625 0.26 -0.2803 0.26DFMAJ i 0.1409 0.29 0.1443 0.26 -0.0383 0.76 0.0520 0.45 0.0547 0.49 0.0468 0.39DFHVY i 0.0834 0.18 0.0655 0.22 -0.0684 0.52 0.0044 0.97 0.2344 0.24 0.4310 0.13TestDFs 0.55 0.58 0.48 0.62 0.48 0.62 0.95 0.39 1.23 0.30 1.34 0.26Obs./R2 105 0.68 119 0.68 180 0.49 116 0.54 130 0.53 265 0.36
LK i 0.0033 0.44 0.0029 0.53 - - 0.0093 0.22 0.0065 0.40 - - LL i -0.0176 0.49 -0.0053 0.85 -0.0493 0.29 0.0085 0.81 -0.0678 0.39 -0.0097 0.73LM i -0.0132 0.13 -0.0169 0.09 -0.0048 0.79 -0.0181 0.27 -0.0233 0.19 -0.0163 0.18LE i 0.0969 0.00 0.1025 0.00 0.1173 0.00 0.1452 0.00 0.1723 0.00 0.1220 0.00RD i -0.0223 0.06 -0.0134 0.26 -0.0027 0.82 -0.0923 0.31 -0.0608 0.53 -0.0915 0.15SM i 0.0002 0.82 0.0000 0.97 0.0010 0.25 0.0000 0.95 0.0012 0.36 0.0006 0.27SH i 0.0009 0.23 0.0012 0.19 -0.0013 0.61 -0.0033 0.27 -0.0051 0.16 0.0000 0.99YR i -0.0016 0.15 -0.0004 0.79 -0.0009 0.55 -0.0039 0.11 0.0011 0.84 0.0039 0.24DS i -0.1507 0.13 -0.1682 0.11 -0.1470 0.20 -0.1523 0.29 -0.6258 0.13 -0.1088 0.19DF i -0.0542 0.21 -0.0617 0.16 -0.0872 0.31 -0.0484 0.54 -0.0299 0.71 0.0137 0.72Obs./R2 657 0.39 724 0.37 1,006 0.20 450 0.46 497 0.37 968 0.29
LK i 0.0024 0.51 0.0021 0.61 - - 0.0108 0.16 0.0080 0.29 - - LL i -0.0132 0.60 -0.0020 0.94 -0.0450 0.32 0.0009 0.98 -0.0750 0.34 -0.0104 0.71LM i -0.0140 0.11 -0.0170 0.09 -0.0057 0.75 -0.0156 0.36 -0.0211 0.26 -0.0156 0.21LE i 0.0983 0.00 0.1035 0.00 0.1197 0.00 0.1461 0.00 0.1733 0.00 0.1220 0.00RD i -0.0225 0.05 -0.0134 0.27 -0.0043 0.71 -0.0930 0.30 -0.0632 0.50 -0.0899 0.15SM i 0.0001 0.87 0.0000 1.00 0.0009 0.29 -0.0002 0.75 0.0010 0.43 0.0006 0.31SH i 0.0009 0.27 0.0010 0.26 -0.0016 0.54 -0.0026 0.39 -0.0044 0.23 0.0001 0.95YR i -0.0015 0.17 -0.0002 0.91 -0.0007 0.66 -0.0034 0.14 0.0015 0.78 0.0040 0.22DS i -0.1580 0.12 -0.1736 0.11 -0.1583 0.19 -0.1495 0.30 -0.6236 0.13 -0.1097 0.18DFMIN i -0.2892 0.16 -0.2650 0.18 -0.4620 0.08 -0.5044 0.08 -0.5075 0.16 -0.1183 0.32DFMAJ i -0.0411 0.42 -0.0653 0.26 -0.0381 0.71 -0.0305 0.75 0.0033 0.98 0.0034 0.93DFHVY i 0.0064 0.78 0.0167 0.42 -0.0278 0.63 -0.0137 0.88 -0.0012 0.99 0.0315 0.51TestDFs 1.40 0.25 1.80 0.17 1.57 0.21 1.45 0.24 0.98 0.37 0.76 0.47Obs./R2 657 0.40 724 0.38 1,006 0.20 450 0.46 497 0.38 968 0.29
BASIC METALS, eq. (2); SOE and East Indonesian plants omitted for 2006
METAL PRODUCTS
METAL PRODUCTS
83

Appendix Table 6 (continued)
Notes: - = estimate could not be obtained; in the Obs./R2 rows, the coefficient column contains the number of observations and the P-value column contains the R-squared; the TestDFs rows show Wald tests of the hypothesis that coefficients on all foreign ownership dummies are equal and associated p-values; industry and region dummies also included as relevant (see explanation in the text); full results including the constant and all dummies are available from the authors.
84

Indepen- 1996 2006dent Initial capital Ending capital No capital Initial capital Ending capital No capitalvariable,statistic Value P-
val. Value P-val. Value P-
val. Value P-val. Value P-
val. Value P-val.
LK i -0.0066 0.39 -0.0069 0.33 - - -0.0151 0.17 -0.0162 0.11 - - LL i 0.0130 0.33 0.0108 0.37 -0.0075 0.64 0.0101 0.89 0.0148 0.83 0.0747 0.10LM i -0.0054 0.24 -0.0041 0.32 -0.0081 0.02 -0.1674 0.03 -0.1504 0.03 -0.1195 0.01LE i 0.3001 0.00 0.2592 0.00 0.2867 0.00 0.3466 0.00 0.3381 0.00 0.2956 0.00RD i 0.0034 0.43 0.0051 0.31 0.0026 0.59 0.0873 0.45 0.0331 0.49 0.0047 0.91SM i 0.0002 0.38 0.0004 0.12 0.0006 0.22 0.0025 0.02 0.0024 0.01 0.0008 0.21SH i 0.0003 0.78 -0.0013 0.32 -0.0008 0.47 0.0087 0.03 0.0083 0.02 0.0071 0.01YR i 0.0006 0.21 0.0006 0.18 0.0004 0.33 -0.0047 0.20 -0.0034 0.30 0.0008 0.66DS i -0.1215 0.16 -0.1094 0.18 -0.0987 0.16 1.2397 0.00 1.1477 0.00 0.3858 0.00DF i -0.0565 0.16 -0.0757 0.06 -0.0644 0.06 0.0549 0.59 0.0527 0.55 0.0783 0.20Obs./R2 3,340 0.66 3,599 0.65 4,771 0.45 2,579 0.36 2,802 0.36 4,974 0.35
LK i -0.0065 0.38 -0.0069 0.33 - - -0.0150 0.17 -0.0161 0.11 - - LL i 0.0122 0.36 0.0111 0.35 -0.0071 0.66 0.0103 0.89 0.0152 0.83 0.0726 0.11LM i -0.0048 0.30 -0.0043 0.30 -0.0083 0.02 -0.1683 0.03 -0.1514 0.03 -0.1190 0.01LE i 0.3003 0.00 0.2593 0.00 0.2867 0.00 0.3466 0.00 0.3381 0.00 0.2954 0.00RD i 0.0027 0.50 0.0053 0.31 0.0025 0.60 0.0940 0.42 0.0359 0.46 -0.0021 0.96SM i 0.0002 0.36 0.0004 0.13 0.0006 0.22 0.0025 0.02 0.0024 0.01 0.0008 0.21SH i 0.0003 0.78 -0.0013 0.31 -0.0009 0.46 0.0088 0.03 0.0084 0.02 0.0073 0.01YR i 0.0007 0.18 0.0006 0.18 0.0004 0.31 -0.0047 0.20 -0.0035 0.29 0.0007 0.71DS i -0.1232 0.16 -0.1093 0.18 -0.0993 0.16 1.2406 0.00 1.1489 0.00 0.3873 0.00DFMIN i -0.1030 0.43 -0.0960 0.44 -0.1205 0.30 -0.0499 0.82 -0.0607 0.75 0.4048 0.22DFMAJ i -0.0797 0.14 -0.0576 0.21 -0.0499 0.22 0.1471 0.45 0.1377 0.44 0.1071 0.34DFHVY i 0.0001 0.99 -0.0948 0.14 -0.0633 0.24 0.0255 0.82 0.0305 0.75 0.0197 0.74TestDFs 1.40 0.25 0.15 0.86 0.19 0.82 0.28 0.76 0.33 0.72 0.90 0.41Obs./R2 3,340 0.67 3,599 0.65 4,771 0.45 2,579 0.36 2,802 0.36 4,974 0.35
LK i 0.0000 1.00 0.0000 0.90 - - 0.0024 0.91 -0.0036 0.85 - - LL i 0.0009 0.22 0.0007 0.23 0.0009 0.18 -0.0222 0.89 -0.0119 0.93 0.1243 0.22LM i -0.0004 0.30 0.0003 0.28 -0.0004 0.04 -0.3161 0.05 -0.2792 0.05 -0.2602 0.01LE i 0.0345 0.03 0.0345 0.03 0.0257 0.01 0.3796 0.00 0.3644 0.00 0.3133 0.00RD i -0.0023 0.37 0.0023 0.35 -0.0015 0.45 0.0661 0.96 0.1730 0.91 0.0385 0.98SM i 0.0000 0.47 0.0000 0.48 0.0000 0.69 0.0023 0.25 0.0017 0.34 0.0002 0.87SH i -0.0001 0.40 0.0001 0.40 0.0000 0.34 0.0213 0.07 0.0225 0.05 0.0210 0.03YR i -0.0001 0.22 0.0001 0.22 -0.0001 0.15 -0.0078 0.32 -0.0057 0.41 -0.0005 0.89DS i 0.0005 0.43 0.0004 0.46 0.0000 1.00 0.6334 0.01 0.5592 0.01 0.1727 0.06DF i 0.0006 0.56 0.0006 0.53 -0.0015 0.60 0.1966 0.36 0.1783 0.35 0.0788 0.49Obs./R2 1,306 0.55 1,440 0.55 1,839 0.50 1,185 0.33 1,285 0.32 2,109 0.31
Appendix Table 7: OLS Estimates of SOE- and MNC-Private Coal Fuel Intensity Differentials and Other Slope Coefficients from Equations (1) and (2); all p-values based on robust standard errors
4 LARGE COAL FUEL USING INDUSTRIES COMBINED, eq. (1)
4 LARGE COAL FUEL USING INDUSTRIES COMBINED, eq. (2)
TEXTILES, eq. (1)
85

Appendix Table 7 (continued)Indepen- 1996 2006dent Initial capital Ending capital No capital Initial capital Ending capital No capitalvariable,statistic Value P-
val. Value P-val. Value P-
val. Value P-val. Value P-
val. Value P-val.
LK i 0.0000 0.99 0.0000 0.90 - - 0.0021 0.92 -0.0037 0.85 - - LL i 0.0009 0.22 0.0007 0.23 0.0009 0.18 -0.0234 0.88 -0.0120 0.93 0.1236 0.22LM i -0.0004 0.30 -0.0003 0.27 -0.0004 0.04 -0.3173 0.05 -0.2812 0.05 -0.2609 0.01LE i 0.0345 0.03 0.0345 0.03 0.0257 0.01 0.3800 0.00 0.3647 0.00 0.3133 0.00RD i -0.0025 0.35 -0.0024 0.34 -0.0013 0.54 0.0911 0.95 0.1968 0.89 0.0235 0.99SM i 0.0000 0.46 0.0000 0.48 0.0000 0.70 0.0023 0.25 0.0018 0.33 0.0002 0.86SH i -0.0001 0.40 -0.0001 0.40 0.0000 0.34 0.0211 0.07 0.0221 0.05 0.0209 0.03YR i -0.0001 0.22 -0.0001 0.22 -0.0001 0.14 -0.0081 0.30 -0.0061 0.39 -0.0007 0.85DS i 0.0005 0.42 0.0004 0.46 0.0000 0.99 0.6373 0.01 0.5641 0.01 0.1750 0.06DFMIN i 0.0007 0.61 0.0007 0.60 0.0006 0.40 0.2927 0.67 0.2619 0.68 0.2636 0.38DFMAJ i 0.0012 0.38 0.0010 0.38 -0.0033 0.56 0.4933 0.19 0.4772 0.17 0.2509 0.30DFHVY i 0.0001 0.95 0.0001 0.84 0.0000 0.96 -0.0053 0.98 -0.0110 0.95 -0.0183 0.87TestDFs 0.86 0.42 0.79 0.45 0.79 0.46 0.83 0.44 0.91 0.40 0.85 0.43Obs./R2 1,306 0.55 1,440 0.55 1,839 0.50 1,185 0.33 1,285 0.32 2,109 0.31
LK i -0.0025 0.28 -0.0009 0.44 - - -0.0044 0.60 -0.0172 0.22 - - LL i 0.0024 0.42 0.0011 0.69 0.0181 0.42 0.0281 0.17 0.0587 0.11 0.0739 0.20LM i -0.0010 0.56 0.0008 0.76 -0.0089 0.36 -0.0232 0.18 -0.0444 0.06 -0.0509 0.03LE i 0.0811 0.00 0.0633 0.00 0.1163 0.00 0.1462 0.00 0.1750 0.00 0.2421 0.00RD i 0.0038 0.31 0.0039 0.37 -0.0041 0.71 0.0054 0.95 -0.1240 0.58 -0.0421 0.79SM i -0.0001 0.40 0.0001 0.55 0.0006 0.27 0.0009 0.12 0.0027 0.07 0.0040 0.00SH i 0.0006 0.25 -0.0015 0.50 -0.0035 0.22 -0.0040 0.30 -0.0023 0.59 -0.0062 0.31YR i 0.0004 0.28 0.0002 0.49 -0.0006 0.66 0.0006 0.76 -0.0021 0.59 -0.0003 0.90DS i 0.0063 0.60 0.0123 0.38 0.0275 0.37 -0.0084 0.90 0.1254 0.47 0.1409 0.04DF i 0.0006 0.82 -0.0179 0.39 -0.1658 0.09 -0.1093 0.15 -0.0961 0.19 0.0900 0.58Obs./R2 186 0.81 214 0.83 339 0.61 229 0.72 263 0.60 490 0.67
LK i -0.0025 0.28 -0.0007 0.60 - - -0.0039 0.64 -0.0170 0.23 - - LL i 0.0025 0.42 0.0022 0.42 0.0242 0.28 0.0252 0.23 0.0563 0.13 0.0603 0.23LM i -0.0011 0.53 -0.0004 0.81 -0.0160 0.16 -0.0244 0.17 -0.0469 0.06 -0.0486 0.04LE i 0.0811 0.00 0.0644 0.00 0.1294 0.00 0.1473 0.00 0.1763 0.00 0.2414 0.00RD i 0.0039 0.31 0.0039 0.36 -0.0029 0.77 0.0095 0.91 -0.1137 0.61 0.0542 0.77SM i -0.0001 0.40 0.0001 0.55 0.0007 0.21 0.0010 0.12 0.0028 0.07 0.0039 0.00SH i 0.0007 0.25 -0.0010 0.55 -0.0010 0.71 -0.0042 0.27 -0.0025 0.56 -0.0062 0.28YR i 0.0004 0.28 0.0002 0.52 -0.0007 0.62 0.0005 0.80 -0.0022 0.58 -0.0005 0.86DS i 0.0062 0.61 0.0103 0.40 0.0169 0.46 0.0068 0.93 0.1462 0.42 0.1483 0.03DFMIN i - - - - - - 0.0209 0.68 -0.0474 0.38 0.9545 0.30DFMAJ i 0.0021 0.49 0.0018 0.54 -0.0132 0.34 0.0450 0.50 0.0957 0.22 0.2920 0.01DFHVY i -0.0066 0.49 -0.0669 0.39 -0.4608 0.14 -0.1729 0.12 -0.1481 0.16 -0.1279 0.26TestDFs 0.65 0.42 0.77 0.38 2.16 0.14 1.31 0.27 1.40 0.25 3.66 0.03Obs./R2 186 0.81 214 0.83 336 0.66 229 0.73 263 0.61 490 0.68
TEXTILES, eq. (2)
PAPER PRODUCTS, eq. (1); East Indonesian plants omitted for 1996
PAPER PRODUCTS, eq. (2), minority-foreign & East Indonesian plants omitted for 1996
86
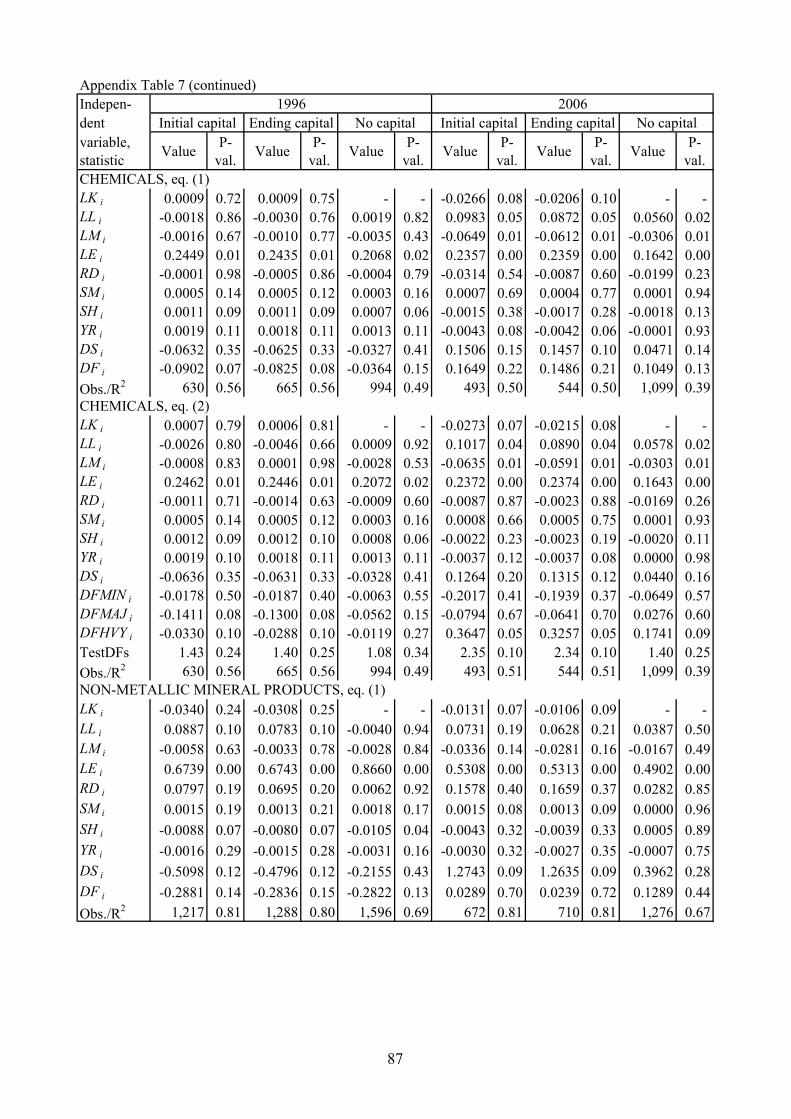
Appendix Table 7 (continued)Indepen- 1996 2006dent Initial capital Ending capital No capital Initial capital Ending capital No capitalvariable,statistic Value P-
val. Value P-val. Value P-
val. Value P-val. Value P-
val. Value P-val.
LK i 0.0009 0.72 0.0009 0.75 - - -0.0266 0.08 -0.0206 0.10 - - LL i -0.0018 0.86 -0.0030 0.76 0.0019 0.82 0.0983 0.05 0.0872 0.05 0.0560 0.02LM i -0.0016 0.67 -0.0010 0.77 -0.0035 0.43 -0.0649 0.01 -0.0612 0.01 -0.0306 0.01LE i 0.2449 0.01 0.2435 0.01 0.2068 0.02 0.2357 0.00 0.2359 0.00 0.1642 0.00RD i -0.0001 0.98 -0.0005 0.86 -0.0004 0.79 -0.0314 0.54 -0.0087 0.60 -0.0199 0.23SM i 0.0005 0.14 0.0005 0.12 0.0003 0.16 0.0007 0.69 0.0004 0.77 0.0001 0.94SH i 0.0011 0.09 0.0011 0.09 0.0007 0.06 -0.0015 0.38 -0.0017 0.28 -0.0018 0.13YR i 0.0019 0.11 0.0018 0.11 0.0013 0.11 -0.0043 0.08 -0.0042 0.06 -0.0001 0.93DS i -0.0632 0.35 -0.0625 0.33 -0.0327 0.41 0.1506 0.15 0.1457 0.10 0.0471 0.14DF i -0.0902 0.07 -0.0825 0.08 -0.0364 0.15 0.1649 0.22 0.1486 0.21 0.1049 0.13Obs./R2 630 0.56 665 0.56 994 0.49 493 0.50 544 0.50 1,099 0.39
LK i 0.0007 0.79 0.0006 0.81 - - -0.0273 0.07 -0.0215 0.08 - - LL i -0.0026 0.80 -0.0046 0.66 0.0009 0.92 0.1017 0.04 0.0890 0.04 0.0578 0.02LM i -0.0008 0.83 0.0001 0.98 -0.0028 0.53 -0.0635 0.01 -0.0591 0.01 -0.0303 0.01LE i 0.2462 0.01 0.2446 0.01 0.2072 0.02 0.2372 0.00 0.2374 0.00 0.1643 0.00RD i -0.0011 0.71 -0.0014 0.63 -0.0009 0.60 -0.0087 0.87 -0.0023 0.88 -0.0169 0.26SM i 0.0005 0.14 0.0005 0.12 0.0003 0.16 0.0008 0.66 0.0005 0.75 0.0001 0.93SH i 0.0012 0.09 0.0012 0.10 0.0008 0.06 -0.0022 0.23 -0.0023 0.19 -0.0020 0.11YR i 0.0019 0.10 0.0018 0.11 0.0013 0.11 -0.0037 0.12 -0.0037 0.08 0.0000 0.98DS i -0.0636 0.35 -0.0631 0.33 -0.0328 0.41 0.1264 0.20 0.1315 0.12 0.0440 0.16DFMIN i -0.0178 0.50 -0.0187 0.40 -0.0063 0.55 -0.2017 0.41 -0.1939 0.37 -0.0649 0.57DFMAJ i -0.1411 0.08 -0.1300 0.08 -0.0562 0.15 -0.0794 0.67 -0.0641 0.70 0.0276 0.60DFHVY i -0.0330 0.10 -0.0288 0.10 -0.0119 0.27 0.3647 0.05 0.3257 0.05 0.1741 0.09TestDFs 1.43 0.24 1.40 0.25 1.08 0.34 2.35 0.10 2.34 0.10 1.40 0.25Obs./R2 630 0.56 665 0.56 994 0.49 493 0.51 544 0.51 1,099 0.39
LK i -0.0340 0.24 -0.0308 0.25 - - -0.0131 0.07 -0.0106 0.09 - - LL i 0.0887 0.10 0.0783 0.10 -0.0040 0.94 0.0731 0.19 0.0628 0.21 0.0387 0.50LM i -0.0058 0.63 -0.0033 0.78 -0.0028 0.84 -0.0336 0.14 -0.0281 0.16 -0.0167 0.49LE i 0.6739 0.00 0.6743 0.00 0.8660 0.00 0.5308 0.00 0.5313 0.00 0.4902 0.00RD i 0.0797 0.19 0.0695 0.20 0.0062 0.92 0.1578 0.40 0.1659 0.37 0.0282 0.85SM i 0.0015 0.19 0.0013 0.21 0.0018 0.17 0.0015 0.08 0.0013 0.09 0.0000 0.96SH i -0.0088 0.07 -0.0080 0.07 -0.0105 0.04 -0.0043 0.32 -0.0039 0.33 0.0005 0.89YR i -0.0016 0.29 -0.0015 0.28 -0.0031 0.16 -0.0030 0.32 -0.0027 0.35 -0.0007 0.75DS i -0.5098 0.12 -0.4796 0.12 -0.2155 0.43 1.2743 0.09 1.2635 0.09 0.3962 0.28DF i -0.2881 0.14 -0.2836 0.15 -0.2822 0.13 0.0289 0.70 0.0239 0.72 0.1289 0.44Obs./R2 1,217 0.81 1,288 0.80 1,596 0.69 672 0.81 710 0.81 1,276 0.67
NON-METALLIC MINERAL PRODUCTS, eq. (1)
CHEMICALS, eq. (1)
CHEMICALS, eq. (2)
87
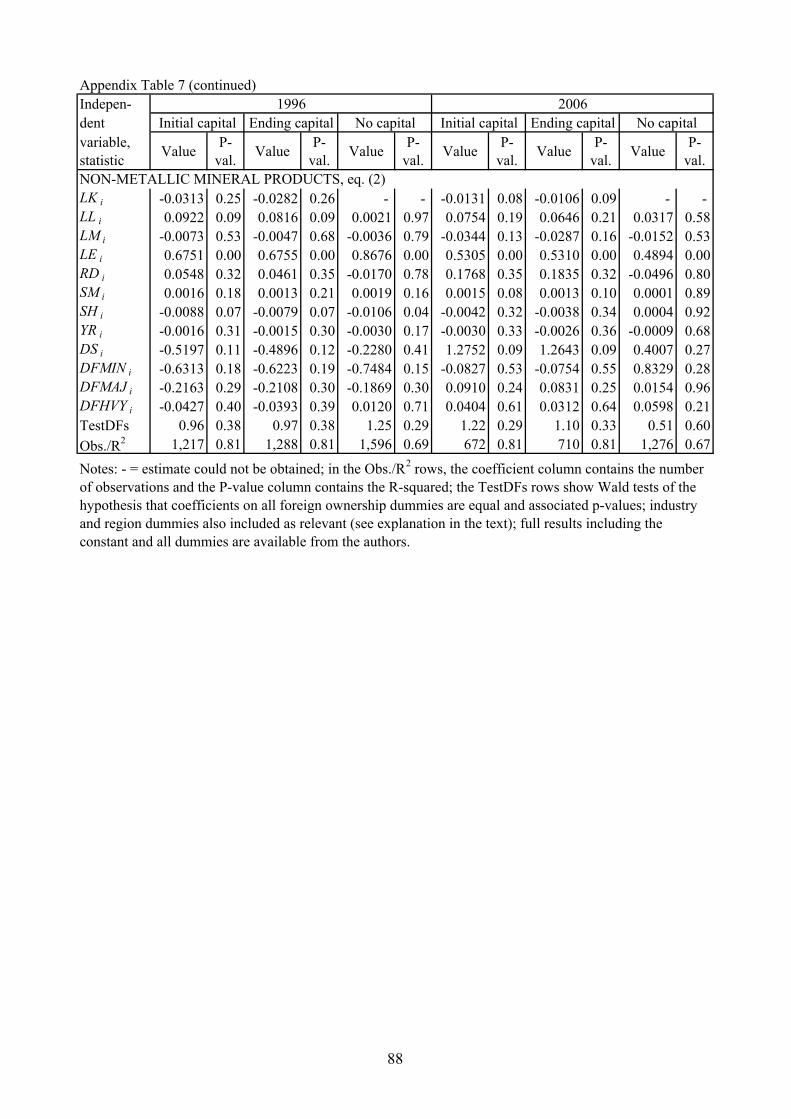
Appendix Table 7 (continued)Indepen- 1996 2006dent Initial capital Ending capital No capital Initial capital Ending capital No capitalvariable,statistic Value P-
val. Value P-val. Value P-
val. Value P-val. Value P-
val. Value P-val.
LK i -0.0313 0.25 -0.0282 0.26 - - -0.0131 0.08 -0.0106 0.09 - - LL i 0.0922 0.09 0.0816 0.09 0.0021 0.97 0.0754 0.19 0.0646 0.21 0.0317 0.58LM i -0.0073 0.53 -0.0047 0.68 -0.0036 0.79 -0.0344 0.13 -0.0287 0.16 -0.0152 0.53LE i 0.6751 0.00 0.6755 0.00 0.8676 0.00 0.5305 0.00 0.5310 0.00 0.4894 0.00RD i 0.0548 0.32 0.0461 0.35 -0.0170 0.78 0.1768 0.35 0.1835 0.32 -0.0496 0.80SM i 0.0016 0.18 0.0013 0.21 0.0019 0.16 0.0015 0.08 0.0013 0.10 0.0001 0.89SH i -0.0088 0.07 -0.0079 0.07 -0.0106 0.04 -0.0042 0.32 -0.0038 0.34 0.0004 0.92YR i -0.0016 0.31 -0.0015 0.30 -0.0030 0.17 -0.0030 0.33 -0.0026 0.36 -0.0009 0.68DS i -0.5197 0.11 -0.4896 0.12 -0.2280 0.41 1.2752 0.09 1.2643 0.09 0.4007 0.27DFMIN i -0.6313 0.18 -0.6223 0.19 -0.7484 0.15 -0.0827 0.53 -0.0754 0.55 0.8329 0.28DFMAJ i -0.2163 0.29 -0.2108 0.30 -0.1869 0.30 0.0910 0.24 0.0831 0.25 0.0154 0.96DFHVY i -0.0427 0.40 -0.0393 0.39 0.0120 0.71 0.0404 0.61 0.0312 0.64 0.0598 0.21TestDFs 0.96 0.38 0.97 0.38 1.25 0.29 1.22 0.29 1.10 0.33 0.51 0.60Obs./R2 1,217 0.81 1,288 0.81 1,596 0.69 672 0.81 710 0.81 1,276 0.67
Notes: - = estimate could not be obtained; in the Obs./R2 rows, the coefficient column contains the number of observations and the P-value column contains the R-squared; the TestDFs rows show Wald tests of the hypothesis that coefficients on all foreign ownership dummies are equal and associated p-values; industry and region dummies also included as relevant (see explanation in the text); full results including the constant and all dummies are available from the authors.
NON-METALLIC MINERAL PRODUCTS, eq. (2)
88

Appendix Table 8: Industry definitionsIndustry definition in this paper 1996, ISIC revision 2 definitions 2006, ISIC revision 3 defintionsManufacturing (19 industries) 114 4-digit categories 132 4-digit categoriesLarge energy users (12 industries) 80 4-digit categories; 78 in regressions 91 4-digit categories; 80 in regressions Food & beverages 311+312+313 15 Textiles 321 17 Apparel 322 18 Wood products 331 20 Paper products 341 21 Chemicals 351+352 24 Rubber & plastic products 355+356 25 Non-metallic mineral products 36 26 Basic metals 37 27 Electronics-related machinery 3825+383+385 30+31+32+33 Motor vehicles 3843 34 Other transportation machinery 3841+3842+3844+3845+3849 35Small energy users (7 industries) Tobacco 314 16 Leather & footwear 323+324 19 Printing & publishing 342 22 Oil & coal products 353+354 23 Metal products 381 28 General machinery 3821+3822+3823+3824+3829 29 Miscellaneous manufacturing & recycling 39+332 36+37Note: There are numerous discrepancies at the 3-, 4-, or 5-digit levels in revisions 2 and 3 that are impossible to resolve precisely; in 1996, 3825 (4 observations) is combined with 3839 and 3845 (1 observation) is combined with 3849; in 2006, 1553 (6 obs.) is combined with 1552, 1510 (4 obs.) with 1511, 1720 (1 obs.) with 1721, 2420 (1 obs.) with 2421, 2610 (1 obs.) with 2611, 3310 (1 obs.) with 3311, 3520 (3 obs.), 3530 (2 obs.), 3540 (1 obs.) with 3590; most combinations in 2006 result from lack of 4-digit defintions (observations where the 4-digit categories listed end in 0) and are arbitrary.
89