Embed Size (px)
Citation preview

Ovostar Union N.V. Annual Report 2016 |

Ovostar Union N.V. Annual Report 2016 | 2
Dear Shareholders,
During 2016 Ovostar Union has accomplished a
lot: we installed one of the largest egg sorting
machines in the world, we completed 4 new lay-
ing hens houses, we increased the share of ex-
port to the EU by more than 3 times. Even
though 2016 was a challenging year due to still
rather turbulent economic and legal environ-
ment in Ukraine, we are pleased that good oper-
ating and financial results were achieved.
Despite the decline in total industrial egg pro-
duction in Ukraine over 2016, we increased the
volume of eggs produced by 24% and expanded
our share to almost 1/5th of the Ukrainian mar-
ket. We kept our position of market maker in
production of liquid egg products and also in-
creased our share in production of dry egg prod-
ucts.
CEO statement
Over the year our geography of sales has expanded by a number of EU countries, which share in ex-
port revenue reached 20% in 2016. The export sales allowed us to partially offset the impact of
Ukrainian Hryvnia devaluation. In 2017 we will continue developing our export markets in order to
diversify the country and currency risks.
I am grateful for the outstanding performance of Ovostar Union team. I have an optimistic view of
our future.
Sincerely,
Borys Bielikov
Chief Executive Officer

Ovostar Union N.V. Annual Report 2016 | 3
Key financial highlights 5
Corporate summary 7
Market overview and competitive position 11
Activity in key segments 13
Financial results overview 16
Strategy and outlook for 2017 18
Human resources 20
Risk management and internal control 21
Shareholder and share information 24
Management Report
Table of Contents
Governance Report
Financial Statements
The Board of Directors 26
Committees of the Board of Directors 29
Meetings with Stakeholders 30
Corporate governance and control 33
Consolidated financial statements 37
Notes to consolidated financial statements 42
Company financial statements 90
Notes to the company's financial statements 93
Other Information
Other information 98
Independent Auditor’s Report 99

Ovostar Union N.V. Annual Report 2016 | 4

Ovostar Union N.V. Annual Report 2016 | 5
Key financials
Balance Sheet
2016 2015 YoY
Assets 110.0 100.7 9%
Non-current assets 65.0 59.5 9%
Current assets 45.0 41.2 9%
Equity and Liabilities 110.0 100.7 9%
Equity 88.4 78.5 13%
Non-current liabilities 12.2 14.2 (14%)
Current liabilities 9.4 8.0 18%
Management Report
Governance Report
Financial Statements
Other information
Income Statement
2016 2015 YoY
Revenue 77.7 75.6 3%
Gross profit 26.1 32.4 (19%)
EBITDA 24.1 34.8 (31%)
Profit before tax 22.7 32.7 (30%)
Net profit 22.5 31.9 (29%)

Ovostar Union N.V. Annual Report 2016 | 6
Key financials Management Report
Governance Report
Financial Statements
Other information
Net debt position
2016 2015 YoY
Total debt 15.3 17.0 (10%)
Cash and cash equivalents as at 31 December 12.2 10.9 11%
Net debt 3.1 6.1 (49%)
Cash Flows
2016 2015 YoY
Net cash generated by operating activities 23.6 26.1 (9%)
Net cash used in investing activities (17.1) (15.2) 13%
Net cash generated by financing activities (4.1) (1.4) 2.9x
Operating Cash Flow, mUSD Net Debt to EBITDA

Ovostar Union N.V. Annual Report 2016 | 7
Management Report
Governance Report
Financial Statements
Other information
Ovostar Union N.V. is a holding entity incorporated under the laws of the Netherlands consolidating
companies with production assets located in Ukraine (hereinafter referred to as “we, us”). Our shares
have been quoted on the Warsaw Stock Exchange since June 2011.
Our mission is to produce ecologically clean and healthy food for Ukrainians and our international cli-
ents. We are growing organically and increasing gradually the volume of eggs produced, we are develop-
ing the export markets and supplying the shell eggs and egg products of consistently high quality around
the countries of Middle East, Europe, Africa and Asia.
Within the egg segment, we constantly focus on meeting the demand of Ukrainian middle class consum-
ers. With the shell egg portfolio of over 20 sub-brands we supply branded eggs to the largest retail
chains in Ukraine. In addition, as a result of export markets development we are gradually increasing the
deliveries of shell eggs outside of Ukraine.
Within the egg products segment, we offer the full range of egg products of both liquid and dry forms.
The loyalty of largest food processing companies in and outside of Ukraine is achieved by adjusting the
products to the clients’ needs while maintaining the superior quality.
Business Geography
Our production facilities are located in the Cen-
tral part of Ukraine in Kyiv and Cherkasy regions
within 130 km from each other. Production
premises include one breeder farm with parent
flock, one hatchery producing day-old pullets,
two young laying hens sites and two laying hen
farms. The egg processing plant is located on the
premises of the laying hen farm in Vasylkiv. The
fresh egg is delivered to the egg processing
plant within 24 hours - this ensures the high
quality of final egg products.
Auxiliary production consists of two fodder mills
with a total capacity of 56 tons of fodder per
hour and one oilseed processing plant, which
produces two products: the oilseed meal and oil
for internal use as a component of poultry feed.
The remaining oil, which is not used internally, is
sold. In 2015 there was a switch from sunflower
seed to rapeseed processing due to attractive
spot price of sunflower meal in Ukraine. In 2016
we continued to process the rapeseeds.
Laying hens farm
Laying hens farm + Egg processing plant +
Fodder mill
Young laying hens farm
Hatchery + Breeder farm
Fodder mill
To ensure the high quality of final egg products,
the fresh eggs are delivered to the egg pro-
cessing plant within 24 hours
Corporate Summary

Ovostar Union N.V. Annual Report 2016 | 8
Business Model
We employ the most up-to-date poultry and processing equipment and progressive technological con-
cepts at our production sites in order to ensure the efficiency of production processes and superior
quality of final products.
Corporate Summary
Having initially adopted a large-scale production
approach, our vertically integrated business
model makes full production cycle spanning
from parent flock to egg processing. In addition
to core business we maintain our own fodder
production, processing of rapeseeds and grain
storage in order to ensure the high quality of the
poultry fodder provided to our poultry flock.
High level of vertical integration allows us to op-
timize production costs and control product
quality at each stage of the production process.
Our products are compliant with international
quality standards ISO 9001:2008 and ISO
22000:2005, FSSC 22000 as well as applicable
national Ukrainian standards and sanitary
norms. We also possess the Halal Certificate to
export internationally and are certified to export
the egg products to the EU.
Management Report
Governance Report
Financial Statements
Other information

Ovostar Union N.V. Annual Report 2016 | 9
Shell Eggs
We supply Ukrainian market with the widest
range of packaged shell eggs under brand name
Yasensvit™. Key customers of egg segment are
large local and international retail chains in
Ukraine as well as our international clients.
Price for branded packaged eggs is traditionally
higher than the average egg price on the mar-
ket. Having Yasensvit™ for over 15 years on the
Ukrainian market, the price premium is justified
by consumers’ recognition of consistently high
quality of products under Yasensvit™ brand and
the wide range of assortment adjusted to spe-
cific consumer preferences.
In 2016 we kept the position of major producer
of private label eggs in Ukraine. Our eggs brand-
ed by retail network labels are supplied to Auch-
an, Silpo, Metro, Novus, Furshet, ATB, Velyka
Kyshenya, Eko and a number of smaller regional
retail chains.
Over 15 years on the Ukrainian market
The most recognizable trademark
Consistently high product quality
Supplier to the largest retail chains in
Ukraine
Whole product portfolio of premium,
standard, economy and private label cat-
egories
Our brands
Corporate Summary Management Report
Governance Report
Financial Statements
Other information
Shell eggs portfolio
Premium
Standard
Economy
Private label

Ovostar Union N.V. Annual Report 2016 | 10
Egg Products
We offer the whole range of separated and
whole egg products in dry and liquid form under
the Ovostar™ brand. The demand for egg prod-
ucts mainly comes from food companies in
Ukraine and abroad.
The egg products segment is B2B-oriented as
the egg products are used for production of con-
fectionary, mayonnaise, meat products. Each
client demands the egg product with specific
characteristics needed for the final good. Our
flexibility to adjust to clients’ needs maintains
the loyalty of our major clients as well as our
position of largest producer of liquid egg prod-
ucts in Ukraine.
Among our key local customers are Roshen,
Mondelez Ukraine, Kharkiv Biscuit, and Kyivkhlib
(Kyiv Bread). We are also the exclusive supplier
of eggs and egg products to McDonalds Ukraine.
As commodities the egg products allow us to
offset the seasonal price fluctuations that are
present on local shell egg market throughout
the year, and to even the profitability through-
out the reporting periods.
Management Report
Governance Report
Financial Statements
Other information
Corporate Summary
Over 10 years on the Ukrainian market
Market maker in liquid egg products
Consistently high product quality
Supplier to the largest food processing
companies in and outside of Ukraine
Whole assortment of liquid and dry egg
products
Egg products portfolio
Dry Liquid
Whole egg Whole egg Egg white Egg white Egg yolk and fer-
mented egg yolk
Egg yolk and fer-
mented egg yolk

Ovostar Union N.V. Annual Report 2016 | 11
During 2016 the inflation rate in Ukraine and
devaluation of Ukrainian hryvnia has slowed
down in comparison to 2015. The economy of
Ukraine is showing the signs of recovery. How-
ever, instability of the country’s macroeconomic
situation and low purchasing power of Ukraini-
ans have a negative impact on the egg produc-
ers.
Laying hens flock
Ukrainian egg market is characterized by signifi-
cant share of laying hens farmed by households
from April to September, therefore, it can be
assumed that the number of laying hens provid-
ed by State Statistics Service of Ukraine as at the
end of the year presents the industrial flock.
As at 31 December 2016 the industrial laying
hens flock again decreased by 14% and reached
31.6 million heads (2015: 36.8 million heads).
The main reasons are the complicated market
conditions and legal environment in Ukraine
over the last 2 years.
Despite that, Ovostar Union continues as de-
clared to follow its investment program and ex-
pand its production facilities. The number of lay-
ing hens of Ovostar Union has increased by 47%
over past 3 years: from 4.4 to 6.5 million heads.
The growth in volumes produced is mainly di-
rected to export markets.
Market overview and competitive position
Management Report
Governance Report
Financial Statements
Other information
20% - share of Ovostar Union in industrial
laying hens flock of Ukraine (2015: 15%).
Laying Hens Flock: Ukraine and Ovostar as at 31
December, mln heads (excluding Crimea and parts of Donetsk - Lugansk regions)
Source: State Statistics Service of Ukraine

Ovostar Union N.V. Annual Report 2016 | 12
Shell egg market
As a result of decrease in laying hens flock in
Ukraine during the reporting period, the total
volume of shell eggs produced in Ukraine de-
clined by 10% and amounted to 15.1 billion
(Source: State Statistics Service of Ukraine).
The Ukrainian shell egg market is historically di-
vided into industrial and household production.
While the household egg production remained
unchanged, the industrial egg production experi-
enced a decrease of 17%. The share of eggs pro-
duced in industrial format declined to 53% (8.1
bln pieces) in 2016 from 58% (9.8 bln pieces) in
2015.
In 2016 egg consumption rate in Ukraine
reached approximately 258 eggs per capita ac-
cording to the data of Ukrainian Poultry Farmers
Union.
Egg products market
As a consequence of the lower volume of egg
production in 2016, the volume of egg pro-
cessing also decreased. Over the reporting peri-
od, the production of dry egg products de-
creased by 24%.
On the contrary, the production volume of liquid
egg products market in Ukraine significantly in-
creased due to growth in production by our
company. We kept our leading position in this
sector.
18% - share of Ovostar Union in industrial egg
production of Ukraine (2015: 12%).
Management Report
Governance Report
Financial Statements
Other information
Market overview and competitive position
23% - share of Ovostar Union in production of
dry egg products in Ukraine (2015: 15%).
97% - share of Ovostar Union in production
of liquid egg products in Ukraine (2015: 94%).
Source: State Statistics Service of Ukraine
19.9
16.8 15.1
Total Egg Production in Ukraine, bln pcs (excluding Crimea and parts of Donetsk - Lugansk regions)
Source: State Statistics Service of Ukraine
Production of Egg Products in Ukraine, ths tons (excluding Crimea and parts of Donetsk - Lugansk regions)
36.3
20.3 19.1

Ovostar Union N.V. Annual Report 2016 | 13
Egg segment
Production | In 2016 our egg production volume
increased by 24% year-on-year to 1 479 mln
eggs (2015: 1 196 mln eggs). Following our in-
vestment program, we are gradually expanding
our production capacities. As at 31 December
2016 our total flock grew by 16% to 7.6 mln
hens, while our laying hens flock increased by
22% and reached 6.5 mln hens.
Sales | Volume of eggs sold in 2016 increased by
22% to 1 054 mln eggs, what resulted into USD
53.6 million of total revenue including other
sales (2015: USD 53.2 million).
Ukraine is our major market and our supply of
eggs on the local market amounted to 746 mln
eggs or 71% of our sales volume (2015: 634 mln
eggs or 73%). In 2016 the volume of eggs ex-
ported increased by 34% from 229 to 307 mln
eggs. The export price in 2016 was slightly high-
er than the local price in USD terms.
Our average selling price of shell eggs over the
year remained mostly the same and amounted
to 1.348 UAH/egg compared to 1.374 UAH/egg
in 2015. In USD terms the average selling price
was lower by the rate of the UAH devaluation.
Activity in key segments
Management Report
Governance Report
Financial Statements
Other information
Shell Eggs Sales
Shell Eggs Sales Structure in 2016
USD 55.7 million
segment revenue in 2016 (2015:USD 55.6 million)

Ovostar Union N.V. Annual Report 2016 | 14
Egg products segment
Production | In 2016 the Company processed
407 mln eggs (2015: 347 mln eggs). The produc-
tion plan of egg products was adjusted to the
stronger demand on liquid egg products from
the EU countries. In 2016 this segment generat-
ed USD 21.1 million of total revenue (2015: USD
18.2 million).
Sales | Volume of dry egg products sold in-
creased by 9% to 2 125 tons, while volume of
dry egg products exported reached 1 320 tons
compared to 908 tons in 2015. Average selling
price of dry egg products increased by 13% year-
on-year in UAH terms to 121.44 UAH/kg and de-
clined by 3% in USD terms to 4.75 USD/kg.
Sales volume of liquid egg products increased by
30% to 8 689 tons (2015: 6 692 tons). As a result
of EU-Ukraine Free Trade Agreement, we man-
aged to direct 25% of sales volume to the EU
countries. Average selling price of liquid egg
products increased by 10% year-on-year in UAH
terms to 29.56 UAH/kg and declined by 5% in
USD terms to 1.16 USD/kg.
Management Report
Governance Report
Financial Statements
Other information
Activity in key segments
USD 21.1 million
segment revenue in 2016 (2015:USD 18.2 million)
Liquid Egg Product Sales
Dry Egg Product Sales

Ovostar Union N.V. Annual Report 2016 | 15
Management Report
Governance Report
Financial Statements
Other information
Activity in key segments
USD 24.0 million
export revenue in 2016 (2015:USD 21.6 million)
Middle East
24%
European Union
6%
Other
1%
Ukraine 69%
Sales Geography by Revenue
Export markets development
The revenue from export sales over 2016 increased by 11% to USD 24.0 million and was received mostly
in USD and EUR.
Middle East remains our key export market as the region is rather close in distance via sea transporta-
tion and can offer an attractive price for eggs and egg products.
As EU-Ukraine deep and comprehensive free trade agreement was enforced, we are gradually increasing
our export sales to the EU since June 2015.

Ovostar Union N.V. Annual Report 2016 | 16
Management Report
Governance Report
Financial Statements
Other information Financial results overview
Revenue | The revenue in 2016 increased by 3%
to USD 77 740 ths from USD 75 606 ths. Histori-
cally, the egg segment contributed the most
(USD 55 660 ths) generating 72% of total reve-
nue. The egg products segment achieved USD
21 111 ths or 27% of total revenue in 2016. The
remaining has been contributed by the oilseed
segment (USD 969 ths).
Gross profit and cost of sales | The cost of sales
increased by 15% year-on-year as a result of the
growth in production volumes and recovery of
fodder price in UAH. Therefore, the gross profit
reached USD 26 097 ths, a 19% decline com-
pared to 2015.
EBITDA | The main factor that negatively affect-
ed EBITDA was the significant decline of 80% in
income from special VAT treatment, when com-
paring 2016 and 2015. In addition to that, the
transportation costs increased by slightly more
than 2 times mainly as a consequence of growth
in export volumes, especially the increase in ex-
port to the EU countries. Consequently, EBITDA
reached USD 24 130 ths, a 31% decrease year-
on-year.
Net profit | In 2016 net profit declined by 29%
to USD 22 533 ths.
Financial Performance
The devaluation of Ukrainian Hryvnia, which during 2016 amounted to 17%, continues to affect our fi-
nancial results. Despite the over-15%-increase in sales volumes of our products, the revenue increased
by 3% only. Besides that the new amendments to the Tax Code of Ukraine on special VAT treatment re-
gime and cancellation of export tax for grain producers were introduced for the year of 2016, which
have negatively affected our EBITDA margin.
Profitability Dynamics, mUSD
Sales Structure by Revenue
2015 2016

Ovostar Union N.V. Annual Report 2016 | 17
Financial position
Assets, liabilities and equity | In 2016 value of
our total assets increased by 9% to USD 110 003
ths. Over the year we constructed four new lay-
ing hens houses and the total flock by 16%, con-
sequently, the value of non-current assets went
up by 9%. Accumulated cash reserves together
with increased current biological assets and ac-
counts receivable resulted in 9% growth of cur-
rent assets.
The total equity in 2016 increased by 13% and
amounted to USD 88 404 ths. Even though the
retained earnings grew up by 24%, the accumu-
lated foreign currency translation reserve also
increased by 11%.
Loans and borrowings | During 2016 no loans
were obtained. We have been meeting our pay-
ment obligations on time. The total amount of
interest-bearing loans and borrowings at the
end of the year decreased by 10% and amount-
ed to USD 15 275 ths. We experienced a positive
effect from strengthening USD against EUR. His-
torically being debt-averse, we consistently keep
the net debt indicator at low level via accumula-
tion of a significant amount of cash in our bank
accounts in Ukraine and outside (USD 12 178 ths
in 2016). The net debt to EBITDA ratio at 31 De-
cember 2016 amounted to 0.13.
Management Report
Governance Report
Financial Statements
Other information
Financial results overview
Cash flow
In 2016 we maintained positive operating cash
flow of USD 23.6 million.
Net cash flow used in investment activities
mostly consisted of purchase of plant, property
and equipment in the amount of USD 6.4 million
and expenditures on biological assets of USD 9.7
million.
Net cash flow used in financing activities in 2016
amounted to USD 4.1 million.
Notes to the Financial Statements
Financial reporting standards | The Consolidated
Financial Statements (CFS) of Ovostar Union N.V.
have been prepared in accordance with IFRS
standards, as adopted by the European Union.
Note 2 to the Consolidated Financial Statements
contains more detailed information on this item.
Transactions with related parties | Note 26 to
the CFS of Ovostar Union N.V. contains more
information on transactions with related parties.
Changes in accounting policy | Note 6 to the CFS
of Ovostar Union N.V. contains more infor-
mation on changes in accounting policy.
Financial instruments | Note 29 to the CFS of
Ovostar Union N.V. contains more information
on financial instruments.
2014 2015 2016
Operating CF,
mUSD 16.1 26.1 23.6
Investing CF,
mUSD (17.6) (15.2) (17.1)
Financing CF,
mUSD (3.5) (1.4) (4.1)

Ovostar Union N.V. Annual Report 2016 | 18
Management Report
Governance Report
Financial Statements
Other information Strategy and outlook for 2017
Organic growth and advance in vertical integration:
4 laying hens houses were constructed during 2016
Increase of 22% in laying hens flock and 24% in egg production volume
A new egg sorting machine with capacity of 240 ths eggs per hour was in-
stalled
Strengthening of Yasensvit and Ovostar brand positions:
10 new types of egg products have been developed for the EU countries
A number of promoting events were organized throughout 2016
A stable demand on branded products
Development of export markets:
Increase in share of the EU in export revenue from 6% to 20%
Export to Middle East countries remains stable
Strategy
We aim to strengthen our market position via gradual organic growth, customer loyalty, and expansion
of our presence outside of Ukraine. Operating in turbulent conditions of Ukrainian economic situation
and legal environment we focus on consistently high quality of our products and long-term relationships
with our clients.
The results we deliver are based on commitment of every employee. The cooperation across depart-
ments results in higher productivity of day-to-day operations and stronger synergy effect. During 2017
we are intended to continue advancing employee skills to be even more competitive and efficient.
Key elements of the Group’s strategy and achievements in 2016:

Ovostar Union N.V. Annual Report 2016 | 19
Management Report
Governance Report
Financial Statements
Other information
Outlook for 2017
Following our investment program we continue
expanding our production capacities and, conse-
quently, increasing egg production volumes. As
Ukrainian Hryvnia has still been volatile during
2016, we strongly focus on increasing the export
volumes of shell eggs and egg products further.
The export revenue that is mostly generated in
USD and EUR is a natural hedge on our currency
risk and it also increases the predictability of our
periodic financial results in the presentation cur-
rency.
In 2017 our export sales are expected to gener-
ate over 35% of our total revenue. In terms of
operating numbers, we expect the share of ex-
port in total sales volume of shell eggs to be
over 30%, of dry egg products - over 60% and of
liquid egg products - over 30%.
Forecasted Production Volumes
Strategy and outlook for 2017
Investment program update
With aim to produce over 2 billion eggs per year
we continue to follow our organic growth strate-
gy. During 2016 four laying hens houses were
constructed at Stavysche production site.
60% - of investment program is completed
As EU-Ukraine trade agreement was enforced,
we started to export egg products to the EU in
June 2015. European shell egg market is attrac-
tive for us, but has more demanding require-
ments for poultry farming – the enriched cage.
All sets of equipment that were installed at
Stavysche production site are compliant with
the EU standards. Currently, we are in the pro-
cess of obtaining a certificate that allows ex-
porting the shell eggs of class A (table eggs) to
the EU countries.
During 2017 we plan to focus on strengthening
our vertical integration and advancing the effi-
ciency of operations by constructing several
units of supporting infrastructure.
2015 YoY
(16/15)
2016 YoY (17/16)
2017
Laying hens flock mln heads 5.3 22% 6.5 9% 7.1
Shell eggs production mln eggs 1 196 24% 1 479 15% 1 700
Dry egg products production tons 1 924 17% 2 252 11% 2 500
Liquid egg products production tons 6 787 30% 8 823 11% 9 800
Ovostar Union N.V. Annual Report 2016 | 20
Management Report
Governance Report
Financial Statements
Other information
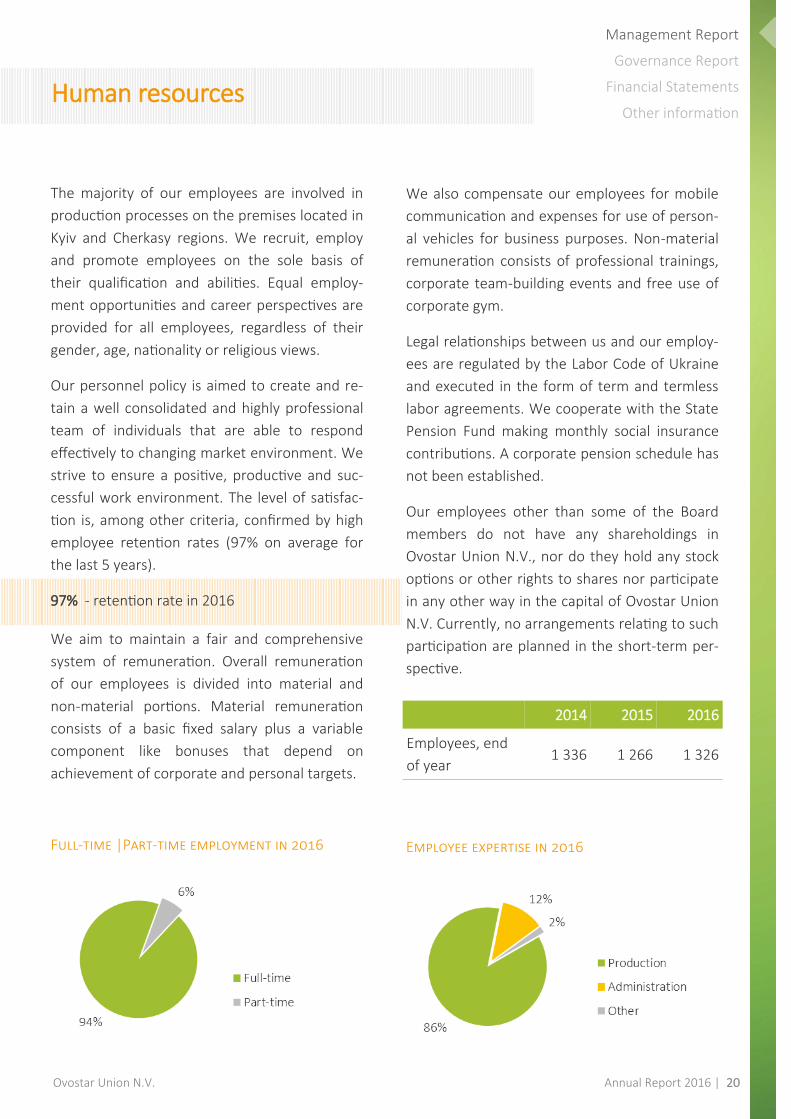
The majority of our employees are involved in
production processes on the premises located in
Kyiv and Cherkasy regions. We recruit, employ
and promote employees on the sole basis of
their qualification and abilities. Equal employ-
ment opportunities and career perspectives are
provided for all employees, regardless of their
gender, age, nationality or religious views.
Our personnel policy is aimed to create and re-
tain a well consolidated and highly professional
team of individuals that are able to respond
effectively to changing market environment. We
strive to ensure a positive, productive and suc-
cessful work environment. The level of satisfac-
tion is, among other criteria, confirmed by high
employee retention rates (97% on average for
the last 5 years).
97% - retention rate in 2016
We aim to maintain a fair and comprehensive
system of remuneration. Overall remuneration
of our employees is divided into material and
non-material portions. Material remuneration
consists of a basic fixed salary plus a variable
component like bonuses that depend on
achievement of corporate and personal targets.
Full-time |Part-time employment in 2016
We also compensate our employees for mobile
communication and expenses for use of person-
al vehicles for business purposes. Non-material
remuneration consists of professional trainings,
corporate team-building events and free use of
corporate gym.
Legal relationships between us and our employ-
ees are regulated by the Labor Code of Ukraine
and executed in the form of term and termless
labor agreements. We cooperate with the State
Pension Fund making monthly social insurance
contributions. A corporate pension schedule has
not been established.
Our employees other than some of the Board
members do not have any shareholdings in
Ovostar Union N.V., nor do they hold any stock
options or other rights to shares nor participate
in any other way in the capital of Ovostar Union
N.V. Currently, no arrangements relating to such
participation are planned in the short-term per-
spective.
Employee expertise in 2016
Human resources
2014 2015 2016
Employees, end
of year 1 336 1 266 1 326

Ovostar Union N.V. Annual Report 2016 | 21
Management Report
Governance Report
Financial Statements
Other information Risk management and internal control
Risk Impact Mitigation 2016 status / Notes
Biological
risks
Outbreaks of highly-
pathogenic avian influenza
in Europe and in the south
of Ukraine may severely lim-
it our ability to perform nor-
mal operations and reduce
the possibility to export
Adherence to biosecurity
standards in line with the
best international practices.
Egg production and egg pro-
cessing facilities are compli-
ant with ISO 9001: 2008 and
ISO 22000: 2005. Diversifica-
tion of sales channels
No occurrences of danger-
ous poultry diseases have
been ever registered on our
premises. We control all the
processes along the full pro-
duction cycle in order to
provide the highest quality
and ability to react fast in
case of need
Macroeco-nomic risks
Depreciation of Ukrainian
Hryvnia leads to deteriora-
tion of income per house-
hold and change in consum-
er preferences
Worsening economic condi-
tions has little effect on con-
sumption of eggs per capita
because eggs remain the
most affordable source of
animal-based protein
In 2016 egg consumption
amounted to 258 eggs per
capita. The decrease in con-
sumption is caused by lower
purchasing power of Ukrain-
ians. Despite that our vol-
ume supplied to Ukraine
was not affected
Poor economic conditions
result in lack of debt financ-
ing available
Historically, we have been
reliant primarily on own
positive cash flow and debt
financing is used only for
implementation of long-
term investment programs.
To eliminate the current in-
stability of Ukrainian econo-
my, we accumulated the
cash on our bank accounts
in foreign-owned banks in
Ukraine and outside
We use export financing
with comparatively low
effective interest rate. As at
31 December 2016 the net
debt amounted to USD 3.1
mln, while the net debt to
EBITDA ratio was 0.13
VAT reimbursement and
other advantages to agricul-
tural companies are can-
celled
We are primarily focused on
operational efficiency
Starting from 2017 special
VAT treatment policy is can-
celled, while the govern-
mental subsidies are intro-
duced instead

Ovostar Union N.V. Annual Report 2016 | 22
Management Report
Governance Report
Financial Statements
Other information
Risk Impact Mitigation 2016 status / Notes
Price risk Devaluation of Ukrainian
Hryvnia leads to lower price
per item in USD terms and
thereby decreases periodic
financial results
Increase of export sales is a
natural hedge against cur-
rency rate fluctuations.
Higher cost incurred in UAH
is being steadily transferred
to the final consumer
through an increase of UAH-
based prices for shell eggs
and egg products on the lo-
cal market
In 2016:
− share of revenue generat-
ed from export sales
reached 31% (2015: 29%)
− UAH-based price of shell
eggs remained the same, of
dry egg products increased
by +13%, liquid egg products
by +10% YoY
Liquidity risk Current capital restrictions
of National Bank of Ukraine
may limit the possibility to
meet the financial obliga-
tions when due
We strictly control our work-
ing capital
As at 31 December 2016 all
payment obligations were
met on time. In 2016 a trad-
ing company was estab-
lished in order to accumu-
late part of the revenue out-
side of Ukraine
Concentra-tion of sales
Excessive concentration of
sales may lead to financial
instability in case of loss of
key customer
Our customer base is mixed
in terms of size and industry.
We are building a balanced
customer portfolio
In 2016 only 2 clients gener-
ated more than 10% of our
total revenue (14% and
12%)
Competition Offering from the existing
competitors or new market
entrants may weaken our
competitive position
We have a unique for
Ukraine vertically integrated
business model with facili-
ties in close proximity to
each other, what results in
high production efficiency.
Having been offering prod-
ucts of consistently superior
quality and adjusting to the
market demands, we
achieved the recognition
and loyalty of our customers
In 2016 YasensvitTM brand
celebrated its 15th anniver-
sary maintaining the posi-
tion of the most-recognized
brand in Ukraine.
We also have a possibility to
effectively diversify our sales
to destinations outside
Ukraine
Risk management and internal control

Ovostar Union N.V. Annual Report 2016 | 23
Management Report
Governance Report
Financial Statements
Other information
Risk management
Risk management is an essential part of the de-
cision-making process providing reasonable as-
surance that risks are controlled to the furthest
extent possible. Risk management and internal
control systems are being regularly discussed
with the executive management and the Audit
Committee. In their review of our risk profile,
the main focus is placed on principal risks that
could significantly deteriorate our operational
and financial results.
It has to be noted that proper identification of
risks significantly reduces but does not com-
pletely eliminate the possibility of human error,
poor judgment in decision making, fraud or oc-
currence of unforeseeable events. The risks that
we face in the course of regular operations are
not limited to the risks described above, but
those above are regarded as the most significant
in the short-term perspective. At the moment
no anti-takeover measures are in place. Some
risks are yet unknown and some risks that are
insignificant at the moment could become ma-
terial in the future.
Internal control system
The Board of Directors is ultimately responsible
for establishing, controlling and enhancing our
internal control system. We consider risk man-
agement to be a continuous process of
monitoring, assessing and mitigating risks
through internal control systems and proce-
dures at each level within the organization.
We use guidelines, instructions and procedures
applied to operations, financial reporting, plan-
ning, human resource and customer manage-
ment etc.; these are being reviewed and updat-
ed on a regular basis. Our employees are trained
to implement and comply with these guidelines,
instructions and procedures.
Key elements of the internal control system are
budgeting, investment management, operation-
al management and financial reporting. They
monitor the progress and the actual results of
the company’s operating activities. We also use
a staff evaluation and appraisal system. The pro-
cess of enhancement of the internal control sys-
tem will be continued in 2017.
For more information on risks please refer to
Note 28 of the 2016 Consolidated Financial
Statements.
Deficiencies of the system
In 2016, we did not identify any material weak-
nesses of the internal control system that might
adversely impact our operational activity, finan-
cial results and financial position. The risks are
clearly identified and controlled to the highest
possible extent by our top management within
their relevant function.
Risk management and internal control
Risk Impact Mitigation 2016 status / Notes
Climate risks Extreme weather conditions
can have a detrimental
effect on the well-being of
poultry flock and their pro-
duction efficiency
Our egg production facilities
are equipped with an auto-
matic climate-control sys-
tem
Optimal climate conditions
for laying hens include 40-
60% humidity and ambient
temperature within 20-25oC
Ovostar Union N.V. Annual Report 2016 | 24
Management Report
Governance Report
Financial Statements
Other information
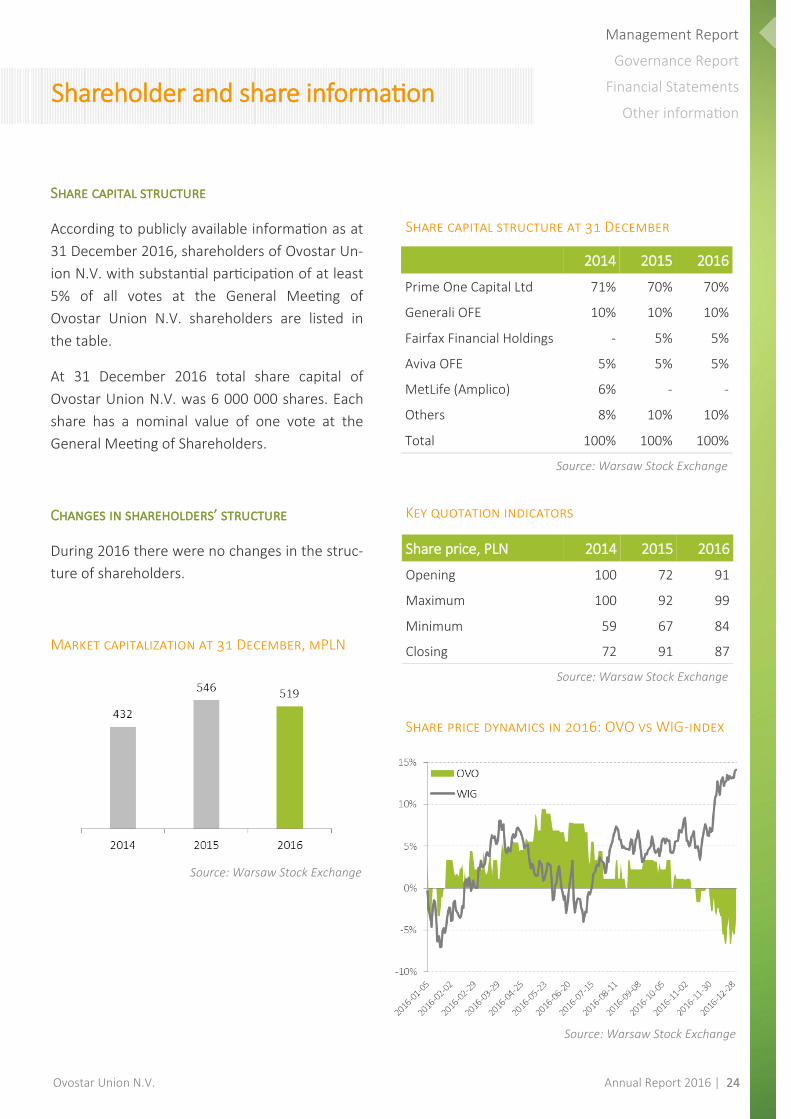
Share capital structure
According to publicly available information as at
31 December 2016, shareholders of Ovostar Un-
ion N.V. with substantial participation of at least
5% of all votes at the General Meeting of
Ovostar Union N.V. shareholders are listed in
the table.
At 31 December 2016 total share capital of
Ovostar Union N.V. was 6 000 000 shares. Each
share has a nominal value of one vote at the
General Meeting of Shareholders.
Changes in shareholders’ structure
During 2016 there were no changes in the struc-
ture of shareholders.
Market capitalization at 31 December, mPLN
Shareholder and share information
2014 2015 2016
Prime One Capital Ltd 71% 70% 70%
Generali OFE 10% 10% 10%
Fairfax Financial Holdings - 5% 5%
Aviva OFE 5% 5% 5%
MetLife (Amplico) 6% - -
Others 8% 10% 10%
Total 100% 100% 100%
Share capital structure at 31 December
Key quotation indicators
Share price dynamics in 2016: OVO vs WIG-index
Share price, PLN 2014 2015 2016
Opening 100 72 91
Maximum 100 92 99
Minimum 59 67 84
Closing 72 91 87
Source: Warsaw Stock Exchange
Source: Warsaw Stock Exchange
Source: Warsaw Stock Exchange
Source: Warsaw Stock Exchange

Ovostar Union N.V. Annual Report 2016 | 25

Ovostar Union N.V. Annual Report 2016 | 26
Management Report
Governance Report
Financial Statements
Other information
Composition and duties of the Board
Our Board of Directors has a one-tier structure,
consisting of executive and non-executive direc-
tors. The executive director is authorized to rep-
resent Ovostar Union Group in its everyday op-
erations, while the non-executive directors mon-
itor the activities, supervise and advise the exec-
utive director. Currently, the Board consists of
four members: one executive director Mr. Borys
Bielikov and three non-executive directors Mr.
Vitalii Veresenko, Mr. Marc van Campen, and
Mr. Sergii Karpenko.
Duties of the non-executive directors include
among other things supervision of the executive
management’s adherence to the established
corporate strategy, proper compliance with best
practices of corporate governance and general
operational issues. Performing their duties, the
non-executive directors have participated in the
meetings of the Board of Directors in 2016. No
cases of non-compliance with rules and require-
ments that would have required the interven-
tion of the non-executive directors have been
detected in 2016.
The Terms of Reference, governing the decision-
making process of the Board, is available on our
website http://ovostar.ua/en/ipo/rules/.
Chairman of the Board and Corporate Secre-
tary
The Chairman of the Board of Directors deter-
mines the agenda, heads the Board meetings
and is responsible for the proper functioning of
the Board. This position is always selected
among the non-executive directors, and is ap-
pointed during the first meeting of the Board.
Our Chairman of the Board currently is Mr.
Veresenko.
Chairman of the Board is assisted by the Group’s
Corporate Secretary, whose duty is the ob-
servance of all necessary procedures for the
Board of directors and compliance of their activ-
ities with the requirements specified in the
Group’s Articles of Association. The Corporate
Secretary is appointed and dismissed by the
Board.
Voting
Each member of the Board is entitled to one
vote taking resolutions during the Board
meeting. All resolutions of the Board are taken
by an absolute majority of votes. In the case of a
tie in votes, the Chairman of the Board of Direc-
tors has a casting vote.
The Board of Directors

Ovostar Union N.V. Annual Report 2016 | 27
Management Report
Governance Report
Financial Statements
Other information
Representation
Members of the Board represent Ovostar Union
Group and the Board has the authority to ap-
point any official as a representative, and to de-
termine the list of his/her powers. The executive
director is authorized to represent the Group on
his own and to sign documents on behalf of the
Group. In case of a conflict of interest between
the Group and one of the directors, the conflict-
ed director may not participate in the decision-
making process concerning the matter causing
the conflict.
Members of the Board are appointed and may
be suspended or dismissed from their position
by the General Meeting of Shareholders. Any
suspension may be extended several times, but
the total period of suspension from duties shall
not exceed three (3) months. Share ownership
in the Group is not required to qualify as a mem-
ber of the Board.
Shareholding by the Board members and insid-er trading
We have established the Securities Rules, fol-
lowed by the Board members at the acquisition
of securities share and transactions with them.
Regarding the acquisition of shares and equity
participation, the Board members and other
persons related to us follow the conditions and
requirements of the EU Market Abuse Directive
and our Insider Trading Rules, which reflect the
essence of this directive. Securities Rules and
Insider Trading Rules are available on our web-
site: http://ovostar.ua/en/ipo/rules/
Statement of the Board of Directors
The Board of Directors of Ovostar Union N.V.
hereby confirms that (1) neither of the Board
members is a member of the Supervisory Board
of - or holds the position of non-executive direc-
tor at more than two listed companies; (2) nei-
ther of the Board members holds the position of
the Chairman of the Supervisory Board - or of
the board of directors, in case such board con-
sists of executive and non-executive directors -
of other companies, except for our enterprises.
Change in the Board structure
During 2016 there were no changes in the struc-
ture of the Board of Directors.
The Board of Directors

Ovostar Union N.V. Annual Report 2016 | 28
Management Report
Governance Report
Financial Statements
Other information The Board of Directors
Name Borys Bielikov
Vitalii Veresenko Marc van Campen Sergii Karpenko
Biography Mr. Bielikov has over 17
years of experience in
poultry industry. Mr.
Bielikov has started his
career in UkrOptServis
LLC in 1993. From 1997
to 1998 he occupied the
position of deputy direc-
tor at UkrAgroTrade LLC.
Mr. Bielikov graduated
from the National Avia-
tion University in 1994.
Mr. Veresenko has over
18 years of experience
in poultry industry. Mr.
Veresenko formerly oc-
cupied position of direc-
tor at Dyvosvit LLC.
Mr. Veresenko graduat-
ed from Kiev Air De-
fence Radio Technical
Engineers College in
1990.
Mr. van Campen held
several positions at Océ
van der Grinten N.V.,
and until 2002 had been
the general counsel at
NBM-Amstelland N.V.,
at that time one of the
largest companies in the
construction sector in
the Netherlands listed
on the Amsterdam Stock
Exchange. In addition
Mr. Van Campen held
the director’s position in
a number of other
Dutch companies.
Mr. Van Campen gradu-
ated from Nijmegen Uni-
versity in 1968.
Mr. Karpenko served as
a Deputy Head of invest-
ment policy and agrarian
business in Ministry of
agrarian policy of
Ukraine from 1997 to
2003. Starting from
2003 Mr. Karpenko has
been working at Associ-
ation «Union of Poultry
Farmers of Ukraine» and
since 2006 he is an Exec-
utive Director of Associ-
ation.
Mr. Karpenko graduated
from National agrarian
university majoring in
Agricultural manage-
ment (1997).
First ap-pointment
2011 2011 2011 2015
(Possible) reappoint-ment
2019 2019 2019 2019
Dependency status
Dependent Dependent Independent Independent
External appoint-ments
No No Director at Astarta Hold-
ing N.V. listed on the
WSE as well as in
Montferland Beheer
B.V., the European sub-
sidiaries (outside Italy)
of Salvatore Ferragamo
SpA and Lugo Terminal
Srl.
Executive Director of
Association «Union of
Poultry Farmers of
Ukraine»

Ovostar Union N.V. Annual Report 2016 | 29
Management Report
Governance Report
Financial Statements
Other information
Audit Committee
The Board of Directors has established an Audit
Committee in order to meet the necessary cor-
porate governance requirements and to ensure
our financial transparency.
The Audit Committee is responsible for advising
and monitoring the activities of the Board of Di-
rectors in the areas of, among other things, the
completeness of financial reporting, our finan-
cial strategy, tax planning, including:
(i) functioning of control and internal risk man-
agement systems;
(ii) provision of financial information (including
choice of the accounting policy, application of
new rules and evaluation of their impact on our
performance, interaction with internal and ex-
ternal auditors, etc.);
(iii) monitoring the compliance of our activities
with the recommendations of internal and ex-
ternal auditors;
(iv) interaction with external auditors, including
control of the auditor’s independence, their re-
muneration and provision of any services out-
side the audit scope;
(v) our tax planning policy;
(vi) sources of our funding;
(vii) review of the annual budget and capital in-
vestments of the Group.
At least one of the committee members must be
a financial expert as defined in the Dutch Corpo-
rate Governance Code, and all committee mem-
bers must be financially literate. Our Audit Com-
mittee satisfies these requirements.
The document describing Terms of Reference
Governing the Audit Committee is available on
our website http://ovostar.ua/en/ipo/rules/.
Mr. van Campen is the Chairman of the Audit
Committee and Mr. Karpenko is the second in-
dependent member of the Audit Committee
since June 2015.
Committees of the Board of Directors
Ovostar Union N.V. Annual Report 2016 | 30
Management Report
Governance Report
Financial Statements
Other information
Meetings of Shareholders (the “General Meet-
ing”)
We, as a Dutch legal entity, must hold at least
one annual General Meeting, to be held in the
Netherlands and not later than six (6) months
after the end of the financial year. The annual
General Meeting is, among other things, entitled
to discuss the annual report of the Board with
respect to the general state of affairs in the
company, approve the financial statements for
the previous financial year, vote whether to
grant discharge to members of the company’s
corporate bodies, and/or appoint members to
fill any vacancies on any of the corporate bodies.
Notices of shareholders’ meetings must be pub-
lished on the company’s website and via any
other electronic communication method in ac-
cordance with applicable regulations in Poland,
at least forty two (42) days before the day of the
meeting.
The Board of Directors determines the items on
the agenda for the General Meeting. Further-
more, the agenda shall contain such items as
requested in writing by one or more persons
entitled to attend the general meeting, repre-
senting solely or jointly at least 1% of the issued
capital or holding shares of the company which
according to the official price list of the regulat-
ed market represent a value of at least EUR
50,000,000 at least sixty days (60) before the
date of the meeting. The meeting shall not
adopt resolutions on matters other than those
that have been placed on the agenda.
An extraordinary General Meeting may be con-
vened as often as the Board of Directors or
shareholders together representing at least 10%
of the issued capital deem necessary.
Voting at the General Meeting | Shareholders
may participate in the General Meeting and ex-
ercise their voting right personally or by written
proxy. Each share in the capital of the company
confers the right to cast one vote, subject to the
relevant provisions of the Articles of Association.
Every holder of shares and every other party en-
titled to attend the General Meeting who de-
rives his/her rights from such shares, is only en-
titled to attend the General Meeting in person,
or represented by a person holding a written
proxy, to address the General Meeting and, in as
far as he/she has voting rights, to vote at the
meeting, if he/she has lodged documentary evi-
dence of his/her voting rights. The requirement
of a written proxy is also met if the proxy is rec-
orded electronically. For this purpose, Dutch law
prescribes a mandatory record date to establish
which shareholders are entitled to attend and
vote at the General Meeting.
Such record date is fixed at the twenty eighth
(28th) day before said General Meeting. The
voting rights and the right to attend the General
Meeting shall accrue to those holding such enti-
tlements and are registered as such in a register
designated for that purpose by the Board of Di-
rectors on this record date. The convocation to
the General Meeting shall state the record date,
the place where and the manner in which regis-
tration shall take place.
The Chairman of the General Meeting shall fur-
ther decide whether persons other than those
who are entitled to admittance pursuant to the
aforementioned shall be admitted to the
Meeting.
Meetings with Stakeholders

Ovostar Union N.V. Annual Report 2016 | 31
Management Report
Governance Report
Financial Statements
Other information
The Members of the Board of Directors shall
have the right to attend the General Meeting. In
these Meetings they shall have an advisory vote.
Unless provided otherwise in the Articles of As-
sociation or the law, all resolutions are adopted
by absolute majority of votes. The company
must record the voting results for each resolu-
tion adopted at a shareholders’ meeting. These
results must be posted on the company’s web-
site not later than on the fifteenth (15th) day
following the day of the shareholders’ meeting
and should be available on the website for at
least one year.
We conducted one General Meeting of share-
holders on 17 June 2016 in Amsterdam, the
Netherlands. During that meeting the 2015 an-
nual accounts have been adopted, the Board has
been authorized to appoint the external auditor
for the 2016 annual accounts, and a number of
other standard items have been discussed and
approved.
Amendment of the Articles of Association | The
General Meeting can resolve to amend the Arti-
cles of Association upon the proposal of the
Board of Directors. Such resolution is to be tak-
en by an absolute majority of votes cast. If a pro-
posal to amend the Articles of Association is to
be submitted to the General Meeting, the con-
vening notice must state this fact. At the same
time, if the proposal is for an amendment to the
Articles of Association, a copy of the motion
containing a verbatim text of the proposed
amendment must be deposited at the compa-
ny’s office for inspection by the shareholders
and depositary receipt holders until the meeting
is adjourned.
Issuance of Shares | The company may only is-
sue shares pursuant to a resolution of the Gen-
eral Meeting or of another corporate body des-
ignated to do so by a resolution of the General
Meeting for a fixed period not exceeding five (5)
years. Such designation must specify the maxi-
mum number of shares that may be issued pur-
suant to the designation. The designation may
each time be extended for a further period of up
to five (5) years. The designation may not be re-
voked, unless the designation provides other-
wise.
Pre-emptive Rights | Each shareholder has a
pre-emptive right in respect of all share issuanc-
es or grants of the right to acquire shares, in
proportion to the number of shares held by such
holder. Shareholders, however, have no pre-
emptive right in respect of the issuance of
shares, or the grant of the right to acquire
shares, which are issued or granted for a consid-
eration other than cash, to employees of the
company or of a group company of the compa-
ny, or in respect of the issuance of shares to any
person who exercises a previously existing right
to subscribe for shares. Pre-emptive rights may
be restricted or excluded by a resolution of the
General Meeting. Pre-emptive rights may also
be excluded or restricted by the corporate body
to which the power to exclude or restrict pre-
emptive rights has been granted by a resolution
of the General Meeting for a fixed period not
exceeding five (5) years.
On 17 June 2016, by a resolution of the General
Meeting the Board was designated to issue
shares and to limit or exclude any pre-emptive
rights in connection with such share issue for a
period of 5 (five) years.
Meetings with Stakeholders

Ovostar Union N.V. Annual Report 2016 | 32
Management Report
Governance Report
Financial Statements
Other information
Board of Directors meetings
In 2016 the Board of Directors held five (5)
meetings.
8 April 2016 | The first meeting was convened
on in Amsterdam, the Netherlands. During the
meeting the Board of Directors approved the
2015 annual report of Ovostar Union N.V.
12 May 2016 | The second meeting was held on
12 May 2016 in Kyiv, Ukraine. During the
meeting the Board has approved the financial
statements of Ovostar Union N.V. for the first
quarter of 2016.
17 June 2016 | The third meeting was held on in
Amsterdam, the Netherlands. During the
meeting the Board has authorized the Manage-
ment of Ovostar Union N.V. to hold a tender for
an external auditor for financial year of 2016.
29 August 2016 | The fourth meeting was held
on in Kyiv, Ukraine. During the meeting the
Board approved the 2016 semi-annual report of
Ovostar Union N.V. and appointed the external
auditor for financial year of 2016.
11 November 2016 | The fifth meeting was held
in Amsterdam, the Netherlands. The Board of
Directors has approved the financial statements
of Ovostar Union N.V. for the nine months of
2016 and discussed the outlook for the year
2017.
Audit committee meetings
In 2016 the Audit Committee of Ovostar Union
N.V. held three (3) meetings.
07 April 2016 | During the meeting the Audit
Committee together with Baker Tilly Berk, the
auditor for the year of 2015, reviewed the au-
diting process for the year of 2015 and dis-
cussed the Group’s Annual Report for 2015.
10 August 2016 | Agenda of this meeting includ-
ed discussion on 2016 audit process and the Au-
dit Committee proposed to approve Baker Tilly
Berk as the auditor for the year 2016. Addition-
ally, the operational management updated the
Audit Committee on Ovostar Union’s plans for
development in the following 2-3 years and out-
look for the second half of the year.
11 November 2016 | During the meeting the
Audit Committee discussed potential risks for
the business and their possible impact on the
Group’s operations and results in the year of
2016.
Meetings with Stakeholders

Ovostar Union N.V. Annual Report 2016 | 33
Management Report
Governance Report
Financial Statements
Other information
Being a Dutch holding company listed on the
Warsaw Stock Exchange, we have to comply
with both of the applicable best practice provi-
sions of the Dutch Corporate Governance Code
(the “Code”) and the requirements of the Code
of Best Practice for WSE Listed Companies (the
“Rules” and together referred to as the
“Codes”).
Dutch Corporate Governance Code
The Code includes the principles and describes
the best practices for boards of directors, super-
visory boards and general meetings of share-
holders, financial statements, auditors, stand-
ards compliance and procedures of information
disclosure. Dutch companies listed on the stock
markets are obligated, under Dutch law, to pub-
lish an annual report, regardless of whether they
comply with the Code fully, partially, or do not
comply at all. If a company does not comply with
the conditions of the Code or does not meet the
requirements and conditions described in the
Code, it shall specify the reasons for non-use
and/or inconsistencies in the annual report.
Please refer to section “Deviations from the
Dutch Corporate Governance Code” below for
more information on the Group’s compliance
with the Code.
WSE Corporate Governance Rules
Companies listed on the Warsaw Stock Exchange
are guided by the Rules. In 2016 the Best Prac-
tice for GPW Listed Companies was updated ac-
cording to the European Commission Recom-
mendation of 09 April 2014 on the quality of
corporate governance reporting. As the rules of
the updated Code became stricter, the non-
compliance items are described in the section
“Deviations from the WSE Corporate Govern-
ance Code” below.
Deviations from the Dutch Corporate Govern-ance Code
The Codes are similar in their requirements and
we meet most of the applicable principles and
requirements of both. In case of non-
compliance to certain requirements of the
Codes, we undertake to publish the non-
compliance items stating the reasons for existing
discrepancies.
Currently, we do not comply with the following
requirements of the Code:
Best Practice Provision III | Since we have a one-
tier governance structure the functions attribut-
ed to supervisory board members in a two-tier
governance structure are distributed among the
non-executive directors of the Group.
Best Practice Provision III.5 | Since we have a
one-tier governance structure and only two non-
executive directors, we are not obliged to have
separate committees for audit, remuneration
and appointment. Currently, we have estab-
lished the Audit Committee. No remuneration
committee nor appointment committee have
been installed.
Corporate governance and control

Ovostar Union N.V. Annual Report 2016 | 34
Management Report
Governance Report
Financial Statements
Other information
Best Practice Provision III.8.4 | Under this re-
quirement, most of the Board of Directors mem-
bers shall be independent non-executive direc-
tors. We partially comply with this requirement
meaning that three out of four of our directors
are non-executive, but only two are independ-
ent. Mr. van Campen and Mr. Karpenko are the
independent non-executive directors, while Mr.
Veresenko is a dependent non-executive direc-
tor. The Board of Directors has decided not to
overcome this non-compliance by increasing the
number of Board members, as it may directly
affect the efficiency and speed of decision mak-
ing by the Board.
Deviations from the WSE Corporate Govern-ance Rules
Due to amendments to the Code of Best Prac-
tice for WSE listed companies enforced in 2016,
currently we do not comply with the following
requirements of the Code:
Best Practice Principle I.Z.1 | Currently we have
no audio or video recording of a general
meeting published at the company’s website as
all the information related to the general
meeting is available in writing at our website.
Additionally, we have not published the internal
rule of changing the company’s auditor as the
company strictly follows guidelines stated in the
Directive 2014/56/EU the European Union that
was adopted in April 2014 and enforced in June
2016.
Best Practice Principle II.Z.1 | Since we have a
one-tier governance structure we have not pub-
lished the chart describing the division of re-
sponsibilities among the Board of Directors be-
cause their areas of responsibility are provided
in writing at the website.
Confirmations required by the Codes
The Board of Directors confirms that during
2016 no conflicts of interest between the Direc-
tors and the Group occurred. In case of a con-
flict of interest, the Board would have acted in
accordance with the Best Practice Provisions
II.3.2, II.3.3 and III.6.1 to III.6.3 of the Dutch Cor-
porate Governance Code.
The Board of Directors confirms that during
2016 no conflicts of interest between the Group
and the shareholders owning more than 10%
equity share in the Group occurred. In case of
such a situation, the Board would have acted in
accordance with the Best Practice Provision
III.6.4 of the Dutch Corporate Governance Code.
Other items of non-compliance
The Board of Directors hereby confirms that cur-
rently its composition is not balanced within the
meaning of the Simplification and Flexibilisation
Act for the Dutch companies—the Flex BV Act.
Such principle was also added to the WSE Cor-
porate Governance Code and requires the com-
panies to publish the diversity policy or explana-
tion on its absence at the website. At the date of
publication of this report the Board (4 persons)
consisted of 100% male members. At the same
time, 2 out of 5 key management personnel are
female. The personnel are selected according to
their professional qualifications, therefore, the
Group deems such composition as healthy.
Corporate governance and control

Ovostar Union N.V. Annual Report 2016 | 35

Ovostar Union N.V. Annual Report 2016 | 36
Management Report
Governance Report
Financial Statements
Other information
Statement of the Board of Directors on com-
pliance of the annual financial statements
With this statement the Board of Directors of
Ovostar Union N.V. confirms that, as far as their
knowledge, the financial statements of the
Group and its subsidiaries for the year ended 31
December 2016 have been prepared in accord-
ance with all applicable accounting standards,
and they truly and fairly reflect the data on the
assets, liabilities, financial position and results of
the Group and its subsidiaries, and the report of
the Board of Directors for the year ended 31 De-
cember 2016 truly and fairly reflects the posi-
tion of the Group and its subsidiaries as of 31
December 2016 and includes a description of
the key events and results and the key risks
faced by the Group and its subsidiaries during
the year 2016.
Statement of the Board of Directors on the appointment of an independent auditor to con-duct audit of the consolidated annual finan-cial statements
With this statement the Board of Directors of
Ovostar Union N.V. confirms that Baker Tilly
Berk N.V., acting as the independent auditor of
the Group’s consolidated financial statements
for the year ended 31 December 2016,
was appointed in accordance with the legal re-
quirements and that the auditing company and
the person conducting the audit meet all the
legal requirements for issuing an objective and
independent auditor’s opinion.
Statement of the Board of Directors on the
internal control system
The Board of Directors assessed the effective-
ness of the internal control system at the end of
2016. During the investigation on which the as-
sessment was based, no shortcomings were
identified that might possibly have a material
impact on the operational results or financial
reporting of the Group. Based on the assess-
ment results the Board members have come to
a decision that the internal control system of the
Group provides a reasonable degree of certainty
that it is functioning well. It should be noted,
however, that the system of internal control
cannot provide a full certainty as regards the
prevention of material inaccuracies in the finan-
cial reporting and the prevention of losses and
fraud.
12 April 2017
Amsterdam, the Netherlands
Statement of Directors’ responsibilities
[signed]
Borys Bielikov
Chief Executive Officer, Executive Director
[signed]
Marc Van Campen
Head of Audit Committee, Non-executive Director
[signed]
Vitalii Veresenko
Chairman of the Board, Non-executive Director
[signed]
Sergii Karpenko
Non-executive Director

Ovostar Union N.V. Annual Report 2016 | 37

Ovostar Union N.V. Annual Report 2016 | 38
Management Report
Governance Report
Financial Statements
Other information
Consolidated Statement of Comprehensive Income
For the year ended 31 December 2016
(in USD thousand, unless otherwise stated)
Note For year
2016
For year
2015
Revenue 8 77 740 75 606
Changes in fair value of biological assets 17 647 2 410
Cost of sales 9 (52 290) (45 601)
Gross profit 26 097 32 415
Other operating income 12 1 202 4 803
Selling and distribution costs 10 (4 162) (2 588)
Administrative expenses 11 (1 230) (1 237)
Other operating expenses 13 (269) (1 010)
Operating profit 21 638 32 383
Finance costs 14 (1 095) (1 236)
Finance income 15 2 165 1 505
Profit before tax 22 708 32 652
Income tax expense 16 (175) (708)
Profit for the year 22 533 31 944
Other comprehensive income
Items that are or may be reclassified to profit or loss:
Exchange differences on translation to presentation currency (12 636) (38 502)
Other comprehensive income for the year, net of tax (12 636) (38 502)
Total comprehensive income for the year, net of tax 9 897 (6 558)
Profit for the period attributable to:
Equity holders of the parent company 22 153 30 954
Non-controlling interests 380 990
Total profit for the year 22 533 31 944
Other comprehensive income attributable to:
Equity holders of the parent company (12 331) (37 615)
Non-controlling interests (305) (887)
Total other comprehensive income (12 636) (38 502)
Total comprehensive income attributable to:
Equity holders of the parent company 9 822 (6 661)
Non-controlling interests 75 103
Total comprehensive income 9 897 (6 558)
Earnings per share:
Weighted average number of shares 6 000 000 6 000 000
Basic and diluted, profit for the year attributable to ordinary equi-
ty holders of the parent (USD per share) 3.69 5.16
Notes on pages 42-89 form an integral part of these consolidated financial statements

Ovostar Union N.V. Annual Report 2016 | 39
Management Report
Governance Report
Financial Statements
Other information
Consolidated Statement of Financial Position
For the year ended 31 December 2016
(in USD thousand, unless otherwise stated)
Note 31 Decem-
ber 2016
31 Decem-
ber 2015
Assets Non-current assets
Biological assets 17 28 500 26 041
Property, plant and equipment and intangible assets 18 35 512 33 370
Deferred tax assets 16 46 145 Other non-current assets 19 958 -
Total non-current assets 65 016 59 556
Current assets Inventories 20 9 123 10 990 Biological assets 17 10 679 8 409 Trade and other receivables 21 12 244 10 355 Prepayments to suppliers 757 420 Prepayments for income tax 6 26 Cash and cash equivalents 22 12 178 10 962
Total current assets 44 987 41 162
Total assets 110 003 100 718
Equity and liabilities Equity
Issued capital 23 63 65 Share premium 30 933 30 933 Foreign currency translation reserve (127 993) (115 664) Retained earnings 160 737 129 783 Result for the year 22 153 30 954
Equity attributable to equity holders of the parent 85 893 76 071 Non-controlling interests 7 2 511 2 436
Total equity 88 404 78 507
Non-current liabilities Interest-bearing loans and other financial liabilities 24 11 445 13 398 Deferred tax liability 16 782 850
Total non-current liabilities 12 227 14 248
Current liabilities Trade and other payables 25 5 008 4 184 Advances received 534 145 Interest-bearing loans and other financial liabilities 24 3 830 3 634
Total current liabilities 9 372 7 963
Total liabilities 21 599 22 211
Total equity and liabilities 110 003 100 718
Notes on pages 42-89 form an integral part of these consolidated financial statements

Ovostar Union N.V. Annual Report 2016 | 40
Management Report
Governance Report
Financial Statements
Other information
Consolidated Statement of Changes in Equity
For the year ended 31 December 2016
(in USD thousand, unless otherwise stated)
Attributable to equity holders of the parent company
Non-
control-
ling in-
terests
Total
equity Issued
capital
Share
premi-
um
Foreign
currency
transla-
tion re-
Re-
tained
earn-
ings
Result
for the
year
Total
As at 31 December
2014 73 30 933 (78 057) 104 444 25 339 82 732 2 333 85 065
Profit for the year - - - - 30 954 30 954 990 31 944 Other comprehen-
sive income - - (37 615) - - (37 615) (887) (38 502)
Total comprehensive
income - - (37 615) - 30 954 (6 661) 103 (6 558)
Allocation of prior
year result - - - 25 339 (25 339) - - -
Exchange differences (8) - 8 - - - - -
As at 31 December
2015 65 30 933 (115 664) 129 783 30 954 76 071 2 436 78 507
Profit for the year - - - - 22 153 22 153 380 22 533 Other comprehen-
sive income - - (12 331) - - (12 331) (305) (12 636)
Total comprehensive
income - - (12 331) - 22 153 9 822 75 9 897
Allocation of prior
year result - - - 30 954 (30 954) - - -
Exchange differences (2) - 2 - - - - -
As at 31 December
2016 63 30 933 (127 993) 160 737 22 153 85 893 2 511 88 404
Notes on pages 42-89 form an integral part of these consolidated financial statements

Ovostar Union N.V. Annual Report 2016 | 41
Management Report
Governance Report
Financial Statements
Other information
Consolidated Statement of Cash Flows
For the year ended 31 December 2016
(in USD thousand, unless otherwise stated)
Note For year
2016
For year
2015
Operating activities Profit before tax 22 708 32 652
Non-cash adjustment to reconcile profit before tax to net cash flows: Depreciation of property, plant and equipment and amortisation of
intangible assets 9, 10, 11 2 492 2 427
Net change in fair value of biological assets 17 (647) (2 410) Disposal of property, plant and equipment - 28 Disposal of biological assets 1 003 1 734 Finance income (2 164) (1 505) Finance costs 1 095 1 236 Recovery of assets previously written-off 12 (223) (237) Income from special VAT treatment 12 (908) (4 514) Impairment of doubtful accounts receivable and prepayments to sup-
pliers 13 69 292
VAT written off 13 153 627 Working capital adjustments:
Increase in trade and other receivables (3 819) (2 804) (Increase)/Decrease in prepayments to suppliers (424) 129 Decrease/(Increase) in inventories 472 (5 399) Decrease in trade and other payables and advances received 3 788 3 827
23 595 26 082 Income tax paid (5) (31)
Net cash flows from operating activities 23 590 26 051
Investing activities Purchase of property, plant and equipment (6 444) (4 797) Increase in biological assets 17 (9 714) (10 356) Interest-free loans issues 19 (958) -
Net cash flows used in investing activities (17 116) (15 153)
Financing activities Proceeds from borrowings - 2 505
Repayment of borrowings (3 937) (3 778)
Interest received 898 345 Interest paid (1 095) (452)
Net cash flows used in financing activities (4 134) (1 380)
Net (decrease)/increase in cash and cash equivalents 2 340 9 518
Effect from translation into presentation currency (1 124) (1 027)
Cash and cash equivalents at 1 January 10 962 2 471
Cash and cash equivalents at 31 December 12 178 10 962
For translating results and financial position into a presentation currency, the Group applies IAS 21 "The Effects of Changes in Foreign Exchange Rates". Procedures and rules applied by the Group are specified in Note 2.3.
Notes on pages 42-89 form an integral part of these consolidated financial statements

Ovostar Union N.V. Annual Report 2016 | 42
Management Report
Governance Report
Financial Statements
Other information
Notes to the Consolidated Financial Statements
(in USD thousand, unless otherwise stated)
1. Corporate information
Ovostar Union N.V. (referred to herein as the “Company”), a limited liability company registered under
the laws of the Netherlands, was incorporated on 22 March 2011 in Amsterdam. Ovostar Union N.V.
was formed to serve as the ultimate holding company of LLC “Ovostar Union” and its subsidiaries.
Hereinafter, LLC “Ovostar Union” and its subsidiaries are referred to as the “Ovostar Union Group” or
the “Group”. The registered office and principal place of business of the Company is Jan van Goy-
enkade 8, 1075 HP Amsterdam.
Principal activities of the Group include egg production, distribution, egg products manufacturing and
production of sunflower oil, rapeseed oil and related products The largest shareholder is Prime One
Capital Ltd., Cyprus. Its principal activity is the holding of ownership interests in its subsidiary and stra-
tegic management.
The Group operates through a number of subsidiaries in Ukraine and British Virgin Islands (the list of
the subsidiaries is disclosed in Note 7) and has a concentration of its business in Ukraine, where its pro-
duction facilities are located. Subsidiary companies are registered under the laws of Ukraine and British
Virgin Islands. The registered office and principal place of business of the subsidiary companies in
Ukraine is 34 Petropavlivska Street, Kyiv, Ukraine.
Information on other related party relationships of the Group is provided in Note 26.
Total number of employees were presented as follows:
The company is listed on Warsaw Stock Exchange.
The Group is controlled by the Beneficial Owners – Mr. Borys Bielikov and Mr. Vitalii Veresenko
(hereinafter, the “Beneficial Owners”)
The consolidated financial statements for the year ended 31 December 2016 were authorized by the
Board of Directors on 12 April 2017.
2. Basis of preparation
2.1. Statement of compliance and basis of measurement
The consolidated financial statements are prepared in accordance with International Financial Re-
porting Standards as adopted by the European Union (“IFRS EU” hereinafter).
The companies of the Group maintain their accounting records under Ukrainian Accounting Standards
(“UAS” hereinafter). UAS principles and procedures may differ from those generally accepted under
IFRS EU. Accordingly, the consolidated financial statements, which have been prepared from the Group
31 December 2016 31 December 2015
Production personnel 1 138 1 095 Administrative personnel 165 149 Other personnel 23 22 Total 1 326 1 266
Notes on pages 42-89 form an integral part of these consolidated financial statements

Ovostar Union N.V. Annual Report 2016 | 43
Management Report
Governance Report
Financial Statements
Other information
Notes to the Consolidated Financial Statements
(in USD thousand, unless otherwise stated)
entities’ UAS records, reflect adjustments necessary for such financial statements to be presented in
accordance with IFRS EU.
The consolidated financial statements have been prepared on the historical cost basis except for the
following items, which are measured on an alternative basis on each reporting date.
Details of the Group accounting policies are included in Note 5.
2.2. Going concern basis
The financial statements are prepared on a going concern basis, under which assets are sold and liabili-
ties are repaid in the ordinary course of business. The accompanying consolidated financial statements
do not include adjustments that would need to be made in case if the Group was unable to continue as
a going concern.
2.3. Functional and presentation currency
The functional currency of the Company is U.S. dollar (USD). The consolidated financial statements are
presented in the company’s functional currency, that is, U.S. dollar (USD). The operating subsidiary
have Ukrainian hryvnia (UAH) as their functional currency. All values are rounded to the nearest thou-
sands, except when otherwise is indicated.
The USD has been selected as the presentation currency for the Group as: (a) management of the
Group manages business risks and exposures, and measures the performance of its businesses in the
USD; (b) the USD is widely used as a presentation currency of companies engaged primarily in agricul-
tural; and (c) the USD is the most convenient presentation currency for non-Ukrainian users of these
IFRS consolidated financial statements.
The Group translates its results and financial position into the presentation currency as the follows:
assets and liabilities for each statement of financial position presented (ie including compara-
tives) shall be translated at the closing rate at the date of that statement of financial position;
income and expenses for each statement of comprehensive income or separate income state-
ment presented (ie including comparatives) shall be translated at exchange rates at the dates of
the transactions; and
all resulting exchange differences shall be recognised in other comprehensive income.
During 2016 and 2015, the exchange rate had significant fluctuations. Consistent with IAS 21, if ex-
change rates fluctuate significantly, the use of the average rate for a period is inappropriate. Consider-
ing significant depreciation of Ukrainian currency against major foreign currencies and seasonality of
sales, Management of the Group decided to translate income and expense items at average quarterly
rates. On consolidation, the assets and liabilities of the Subsidiaries are translated at exchange rates
prevailing on the reporting date.
Items Measurement bases
Biological assets Fair value less costs to sell
Notes on pages 42-89 form an integral part of these consolidated financial statements

Ovostar Union N.V. Annual Report 2016 | 44
Management Report
Governance Report
Financial Statements
Other information
Notes to the Consolidated Financial Statements
(in USD thousand, unless otherwise stated)
Income and expense items are translated at the average quarterly rates, unless the exchange rates
fluctuate significantly during that period, in which case the exchange rates at the dates of the transac-
tions are used. Exchange differences arising, if any, are recognized in “Other comprehensive income”
and accumulated in the “Foreign currency translation reserve”.
Relevant exchange rates are presented as follows:
3. Basis of consolidation
The consolidated financial statements comprise the financial statements of the Group and its subsidiar-
ies as at 31 December 2016. Control is achieved when the Group is exposed, or has rights, to variable
returns from its involvement with the investee and has the ability to affect those returns through its
power over the investee. Specifically, the Group controls an investee if, and only if, the Group has:
Power over the investee (i.e., existing rights that give it the current ability to direct the relevant
activities of the investee)
Exposure, or rights, to variable returns from its involvement with the investee
The ability to use its power over the investee to affect its returns.
Generally, there is a presumption that a majority of voting rights result in control. To support this pre-
sumption and when the Group has less than a majority of the voting or similar rights of an investee, the
Group considers all relevant facts and circumstances in assessing whether it has power over an inves-
tee, including:
The contractual arrangement with the other vote holders of the investee
Closing rate as at
31 December 2016
Closing rate as at
31 December 2015
USD/UAH 27.1909 24.0007
EUR/UAH 28.4226 26.2231
PLN/USD 4.1975 3.9148
EUR/USD 0.9510 0.9169
Average rate for the
1-st quarter 2016
Average rate for the 2-nd quarter 2016
Average rate for the 3-rd quarter 2016
Average rate for the 4-th quarter 2016
USD/UAH 25.6537 25.2618 25.3760 25.8896
EUR/UAH 28.2764 28.5535 28.3463 27.9580
PLN/USD 3.9594 3.8747 3.8938 4.0657
EUR/USD 0.9069 0.8857 0.8964 0.9273
Average rate for the
1-st quarter 2015
Average rate for the 2-nd quarter 2015
Average rate for the 3-rd quarter 2015
Average rate for the 4-th quarter 2015
USD/UAH 21.1157 21.6115 21.7219 22.8491
EUR/UAH 23.7893 23.8709 24.1325 25.0161
PLN/USD 5.6802 5.8454 5.7639 5.8684
EUR/USD 0.8874 0.9047 0.8992 0.9135
Notes on pages 42-89 form an integral part of these consolidated financial statements

Ovostar Union N.V. Annual Report 2016 | 45
Management Report
Governance Report
Financial Statements
Other information
Notes to the Consolidated Financial Statements
(in USD thousand, unless otherwise stated)
Rights arising from other contractual arrangements
The Group’s voting rights and potential voting rights.
The Group re-assesses whether or not it controls an investee if facts and circumstances indicate that
there are changes to one or more of the three elements of control. Consolidation of a subsidiary begins
when the Group obtains control over the subsidiary and ceases when the Group loses control of the
subsidiary. Assets, liabilities, income and expenses of a subsidiary acquired or disposed of during the
year are included in the consolidated financial statements from the date the Group gains control until
the date the Group ceases to control the subsidiary.
Profit or loss and each component of other comprehensive income (OCI) are attributed to the equity
holders of the parent of the Group and to the non-controlling interests, even if this results in the non-
controlling interests having a deficit balance. When necessary, adjustments are made to the financial
statements of subsidiaries to bring their accounting policies into line with the Group’s accounting poli-
cies. All intra-group assets and liabilities, equity, income, expenses and cash flows relating to transac-
tions between members of the Group are eliminated in full on consolidation.
A change in the ownership interest of a subsidiary, without a loss of control, is accounted for as an eq-
uity transaction.
If the Group loses control over a subsidiary, it derecognises the related assets (including goodwill), lia-
bilities, non-controlling interest and other components of equity while any resultant gain or loss is rec-
ognised in profit or loss. Any investment retained is recognised at fair value.
4. Use of estimates and assumptions
The preparation of the financial statements requires management to make estimates and assumptions
that affect the reported amounts of revenues, expenses, assets and liabilities, and the disclosure of
contingent liabilities, at the end of the reporting period. However, due to uncertainty about these esti-
mates, actual results recorded in future periods may differ from such estimates.
These consolidated financial statements include management's estimates regarding the value of assets,
liabilities, revenues, expenses, and recognized contractual obligations. These estimates mainly include:
4.1. Impairment of property, plant and equipment
In accordance with IAS 36 "Impairment of Assets" the Group reviews the carrying amount of non-
current tangible assets (mainly property, plant and equipment) to identify signs of impairment of these
assets.
If there is an indication that an asset may be impaired, the Group uses a model of strategic planning in
order to calculate the discounted cash flows (using the "value in use" method, as defined in IAS 36)
and, thus, assess the recoverability of the carrying amount of property, plant and equipment. The mod-
el was based on budgets and forecasts approved by the management for the next 5 years.
Expected future cash flows reflect long-term production plans formed on the basis of past experience
and market expectations. The plans take into account all relevant characteristics of poultry farming,
Notes on pages 42-89 form an integral part of these consolidated financial statements

Ovostar Union N.V. Annual Report 2016 | 46
Management Report
Governance Report
Financial Statements
Other information
Notes to the Consolidated Financial Statements
(in USD thousand, unless otherwise stated)
including egg production, volume of egg processing, prices for main components of mixed fodder.
Thus, the production capacity is the basis for forecasting the future production volume for each subse-
quent year and related production costs.
Levels of costs included in projected cash flows are based on current long-term production plans.
When conducting impairment testing, recent levels of costs are taken into account, as well as the ex-
pected cost changes based on the current condition of operating activities and in accordance with the
requirements of IAS 36. IAS 36 provides a number of restrictions on future cash flows, which may be
recognized in respect of future restructuring and capital modernization expenses.
Below are the key assumptions that formed the basis for forecasting future cash flows in the models:
prices for main components of mixed fodder are based on internal forecasts of the Group's man-
agement;
production data (production of eggs, safety of livestock, meat production volume, production of
egg products) based on internal forecasts of the Group's management from past experience;
selling prices for eggs, egg products and poultry meat are based on forecasts of the Group's man-
agement and market expectations.
Management believes that calculations of the recoverable amount are most sensitive to changes in
such assumptions as the price of poultry meat, price of eggs and eggs product, price of poultry fodder
and production data. Management believes that any reasonably possible change in key assumptions on
which the recoverable amount of the Group is based will not cause the excess of carrying amount of
the Group over its recoverable amount.
Application of IAS 36 requires extensive judgments by the management regarding estimates and as-
sumptions related to future cash flows and discount rate. Given the nature of the current global eco-
nomic environment, such assumptions and estimates have a high degree of uncertainty. Therefore,
other similar assumptions may lead to significantly different results.
4.2. Fair value of biological assets
Estimation of fair value of biological assets is based on the discounted cash flow model. The fair value
of biological assets might be affected by the fact that the actual future cash flows will differ from the
current forecast, which typically occurs as a result of significant changes in any factors or assumptions
used in the calculations. Among such factors are:
differences between actual prices and price assumptions used in estimating net realizable value
of eggs;
changes in productivity of laying hens;
unforeseen operational problems inherent in the branch specificity;
age of hens at the end of the reporting period;
changes in production costs, costs of processing and products sales, discount and inflation rates
and exchange rates that could adversely affect the fair value of biological assets.
Notes on pages 42-89 form an integral part of these consolidated financial statements

Ovostar Union N.V. Annual Report 2016 | 47
Management Report
Governance Report
Financial Statements
Other information
Notes to the Consolidated Financial Statements
(in USD thousand, unless otherwise stated)
The key assumptions concerning biological assets based on discounted cash flow approach are present-
ed as follows:
cost planning at each stage of poultry farming will remain constant in future periods;
egg production volume will not be significantly changed;
egg sale price in future periods;
long-term inflation rate of Ukrainian UAH in future periods;
discount rate for determining the present value of future cash flows expected from the biological
assets (Note 17).
Management determined that calculations of the fair value of biological assets are the most sensitive
to changes in such assumptions as the volume of egg production, cost planning and prices of eggs, eggs
product and poultry meat. Management believes that any reasonably possible change in key assump-
tions will not cause any significant change in the fair value of biological assets.
All assets and liabilities for which fair value is measured or disclosed in the financial statements are cat-
egorized within the fair value hierarchy, described as follows, based on the lowest level input that is
significant to the fair value measurement as a whole:
Level 1: Quoted (unadjusted) market prices in active markets for identical assets or liabilities.
Level 2: Valuation techniques for which the lowest level input that is significant to the fair value
measurement is directly or indirectly observable.
Level 3: Valuation techniques for which the lowest level input that is significant to the fair value
measurement is unobservable.
Although some of these assumptions are obtained from published market data, the majority of these
assumptions are estimated based on the Group’s historical and projected results.
Fair value related disclosures for financial instruments and non-financial assets that are measured at
fair value or where fair values are disclosed, are summarized in Notes 17, 29.
Fair value is the price that would be received to sell an asset or paid to transfer a liability in an orderly
transaction between market participants at the measurement date. The fair value measurement is
based on the presumption that the transaction to sell the asset or transfer the liability takes place ei-
ther:
In the principal market for the asset or liability
Or
In the absence of a principal market, in the most advantageous market for the asset or liability.
4.3. Allowances for doubtful debts
The Group forms allowances for doubtful debts to cover any potential losses arising in case of buyer's
insolvency. In assessing the adequacy of the allowance for doubtful debts the management takes into
account overall current economy conditions, terms of balances for outstanding receivables, the
Group's experience to write-off liabilities, customers' solvency and changes in conditions of payment.
Notes on pages 42-89 form an integral part of these consolidated financial statements

Ovostar Union N.V. Annual Report 2016 | 48
Management Report
Governance Report
Financial Statements
Other information
Notes to the Consolidated Financial Statements
(in USD thousand, unless otherwise stated)
Changes in the economy, industry or financial position of individual buyers may cause adjustment to
the amount of allowance for doubtful debts reflected in the consolidated financial statements.
4.4. Useful lives of property, plant and equipment
The Group estimates useful lives of property, plant and equipment at least at the end of each financial
year and, if expectations differ from previous estimates, changes are recorded as changes in accounting
estimates in accordance with IAS 8 "Accounting Policies, Changes in Accounting Estimates and Errors".
These estimates can have a significant impact on the carrying amount of property, plant and equip-
ment and depreciation expenses during the period.
4.5. Deferred tax assets
Deferred tax assets are recognized for all unused tax losses to the extent that the inflow of taxable
profit is possible, at the expense of which these losses may be implemented. Significant judgments are
required from the management in determining the amount of deferred tax assets that can be recog-
nized on the basis of the possible terms of receipt and the level of future taxable profit together with
the future tax planning strategy.
5. Summary of significant accounting policies
5.1. Recognition and measurement of financial instruments
Financial assets and financial liabilities are recorded in the Group's consolidated statement of financial
position when the Group becomes a contractual party regarding the corresponding financial instru-
ment. The Group records the acquisition and sale of financial assets and financial liabilities at the
settlement date.
Financial assets and financial liabilities are initially measured at fair value. Transaction costs that are
directly attributable to the acquisition or issue of financial assets and financial liabilities (other than fi-
nancial assets and financial liabilities at fair value through profit or loss) are added to or deducted from
the fair value of the financial assets or financial liabilities, as appropriate, on initial recognition. Trans-
action costs directly attributable to the acquisition of financial assets or financial liabilities at fair value
through profit or loss are recognised immediately in profit or loss.
Fair value of investments that are actively traded in organized financial markets is calculated on the
basis of current market value at the close of trading on the reporting date. Regarding investments in
securities for which there is no active market, fair value is calculated using other methods of valuation
of financial instruments. Such valuation methods include the use of information on recent market
transactions between well informed, willing to commit such transaction, independent parties, or data
about the current market value of another similar instrument, discounted cash flow analysis or other
pricing models.
Accounting policy for subsequent revaluation of these items is disclosed below in the appropriate sec-
tions of accounting policy.
Notes on pages 42-89 form an integral part of these consolidated financial statements

Ovostar Union N.V. Annual Report 2016 | 49
Management Report
Governance Report
Financial Statements
Other information
Notes to the Consolidated Financial Statements
(in USD thousand, unless otherwise stated)
5.2. Financial assets
Initial recognition and measurement
Financial assets are recognised initially at transaction costs that are attributable to the acquisition of
the financial asset.
Purchases or sales of financial assets that require delivery of assets within a time frame established by
regulation or convention in the market place (regular way trades) are recognised on the trade date,
i.e., the date that the Group commits to purchase or sell the asset
5.3. Effective interest rate method
The effective interest rate method is used to calculate the amortized cost of a financial asset and dis-
tribute interest income during the relevant period. The effective interest rate is the rate that enables
discounting of estimated future cash receipts through the expected life of a financial asset or a shorter
period, if applicable.
Revenues relating to debt instruments are recorded using the effective interest rate method, except
for financial assets at fair value through profit or loss.
Financial assets at fair value through profit or loss - a financial asset is classified as at fair value through
profit or loss if it is held for trading or designated at fair value through profit or loss.
A financial asset is classified as held-for-trading if it is:
purchased originally for the purpose of sale / repayment within a short period of time; or
a part of the portfolio of identified financial instruments that are managed together, and struc-
ture of which demonstrates the intention of profit earning in the short term; or
a derivative that is not classified as a hedging instrument and is not effective for these purposes.
A financial asset that is not a financial asset held-for-trading may be classified as a financial asset at fair
value through profit or loss at the time of recognition in the accounting records if:
application of such classification eliminates or significantly reduces discrepancies in valuation or
accounting, that otherwise might arise, or
a financial asset is a part of a group of financial assets, financial liabilities or both groups, which
are managed and controlled on the basis of fair value in accordance with a documented risk or
investment management strategy, and information about this group is provided internally on
that basis, or
it exists in the framework of the contract containing one or more embedded derivatives, and IAS
39 “Financial Instruments: Recognition and Measurement” permits to classify the whole contract
(asset or liability) as at fair value through profit or loss.
Financial assets at fair value through profit or loss are measured at fair value with arising gains or loss-
es recognized in the consolidated statement of comprehensive income. Net gains or losses recognized
in the income statement include dividends and interest received on the relevant financial asset.
Notes on pages 42-89 form an integral part of these consolidated financial statements

Ovostar Union N.V. Annual Report 2016 | 50
Management Report
Governance Report
Financial Statements
Other information
Notes to the Consolidated Financial Statements
(in USD thousand, unless otherwise stated)
Held-to-maturity investments - investments held to maturity are measured at amortized cost using the
effective interest rate method, less impairment, and income is recognized using the effective yield
method. During the reporting periods presented in these financial statements, the Group had no in-
vestments of this category.
Loans and receivables - accounts receivable regarding principal activities, loans, borrowings and other
receivables with fixed or determinable payments that are not quoted in an active market are classified
as "loans and receivables". Loans and receivables are measured at amortized cost using the effective
interest rate method less impairment and uncollectible debts. Interest income is recognized by apply-
ing the effective interest rate, except for short-term receivables for which the amount of such interest
income is insignificant.
Unquoted investments available for sale are accounted for at cost if their fair value cannot be reliably
measured.
5.4. Cash and cash equivalents
Cash and cash equivalents include cash on hand and cash in bank accounts and deposits with an origi-
nal maturity date of three months or less and are stated at fair value.
5.5. Cash deposits
Cash deposits in the statement of financial position are held for the investment activities. For the pur-
pose of the consolidated statement of cash flows, short-term deposits are included in the investing ac-
tivities.
5.6. Impairment of financial assets
Financial assets, except for financial assets at fair value through profit or loss, at each reporting date
are assessed for signs indicating impairment. Impairment loss is recognized when there is objective evi-
dence of reduction of the estimated future cash flows on this asset as a result of one or more events
that occurred after the financial asset was recorded in the accounting. For financial assets at amortized
cost, the amount of impairment is calculated as the difference between the asset's carrying amount
and present value of the expected future cash flows discounted using the effective interest rate.
Impairment loss directly reduces the carrying amount of all financial assets, except for accounts receiv-
able on principal activities, carrying amount of which is reduced due to the allowance formed. If the
accounts receivable on principal activities are uncollectible, they are written-off against the related al-
lowance. Subsequently received reimbursements of amounts previously written-off are recorded in
credit of the allowance account. Changes in the carrying amount of the allowance account are record-
ed in the profit and loss.
Except for equity instruments available for sale, if in a subsequent period the amount of impairment
loss decreases and such decrease can be objectively related to an event occurring after the impairment
was recognized, the impairment loss previously recognized is recovered by adjusting the items in the
income statement. In this case, the carrying amount of financial investments at the date of recovery of
impairment cannot exceed its amortized cost, which would be reflected in the case, if impairment was
not recognized.
Notes on pages 42-89 form an integral part of these consolidated financial statements

Ovostar Union N.V. Annual Report 2016 | 51
Management Report
Governance Report
Financial Statements
Other information
Notes to the Consolidated Financial Statements
(in USD thousand, unless otherwise stated)
In respect of equity securities available for sale, any increase in fair value after recognition of impair-
ment loss relates directly to equity.
5.7. Writing-off of financial assets
The Group writes-off a financial asset only if rights for cash flows under the corresponding contract ter-
minated the treaty or if a financial asset and corresponding risks and rewards are transferred to other
organization. If the Group does not transfer or retain all the principal risks and rewards of ownership of
the asset and continues to control the transferred asset, it shall record its share in the asset and relat-
ed liability in the amount of possible payment of corresponding amounts. If the Group retains all the
principal risks and rewards of ownership of the transferred financial asset, it shall continue to account
for the financial asset, and reflect a secured loan on income earned.
5.8. Financial liabilities and equity instruments issued by the Group
5.8.1 Accounting as liabilities or equity
Debt and equity financial instruments are classified as liabilities or equity based on the substance of
the corresponding contractual obligations.
5.8.2 Equity instruments
Equity instrument is any contract confirming the right for a share in the company's assets remaining
after deduction of all its liabilities. Equity instruments issued by the Group are recorded in the amount
of generated income net of direct expenses for their issue.
5.8.3 Liabilities under financial guarantee contracts
Liabilities under financial guarantee contracts are initially measured at fair value and subsequently rec-
orded at the higher of:
cost of contractual obligations determined in accordance with IAS 37 “Provisions, Contingent Lia-
bilities and Contingent Assets”, and
cost, less, where applicable, accumulated depreciation reflected in accordance with the principles
of revenue recognition set forth below.
5.8.4 Financial liabilities
Initial recognition and measurement
Financial liabilities are classified, at initial recognition as loans and borrowings, payables.
All financial liabilities are recognised initially at fair value and, in the case of loans and borrowings and
payables, net of directly attributable transaction costs.
The Group’s financial liabilities include trade and other payables, loans and borrowings including bank
overdrafts.
A financial liability is classified as held for trading if it is:
assumed mainly to be repurchased within a short period of time; or
a part of the portfolio of identified financial instruments that are managed together, and struc-
ture of which demonstrates the intention of profit earning in the short term; or
Notes on pages 42-89 form an integral part of these consolidated financial statements

Ovostar Union N.V. Annual Report 2016 | 52
Management Report
Governance Report
Financial Statements
Other information
Notes to the Consolidated Financial Statements
(in USD thousand, unless otherwise stated)
a derivative that is not classified as a hedging instrument and is not effective for these purposes.
A financial liability that is not a financial liability held-for-trading may be classified as a financial liability
at fair value through profit or loss at the time of recognition in the accounting records if:
application of such classification eliminates or significantly reduces discrepancies in valuation or
accounting, that otherwise might arise, or
a financial liability is a part of a group of financial assets, financial liabilities or both groups, which
are managed and controlled on the basis of fair value in accordance with a documented risk or
investment management strategy, and information about this group is provided internally on
that basis, or
it exists within the framework of the contract containing one or more embedded derivatives, and
IAS 39 “Financial Instruments: Recognition and Measurement” permits to classify the whole con-
tract (asset or liability) as at fair value through profit or loss.
Financial liabilities at fair value through profit or loss are measured at fair value with arising gains or
losses recognized in the financial results. Net gains or losses recognized in the income statement in-
clude interest paid on a financial liability.
Other financial liabilities - other financial liabilities, including borrowings, are accounted for at fair value
less transaction costs. Other financial liabilities are subsequently measured at amortized cost using the
effective interest rate method, with the recognition of interest expenses using the effective (actual)
yield.
5.8.5 Trade and other accounts payable
Trade payables are recognized when the counterparty fulfills its contractual obligations and measured
at amortized cost using the effective interest rate.
5.8.6 Loans and borrowings
Loans and borrowings are initially recognized at fair value less costs incurred in the transaction. Subse-
quently, loans and borrowings are stated at amortized cost; any difference between proceeds (net of
transaction costs) and the amount of repayment is reflected in the income statement over the period
for which loans and borrowings are issued using the effective interest rate method. Loans and borrow-
ings are classified as current liabilities, unless the Group has an unconditional right to defer settlement
of the obligation to at least one year after the date of balance sheet preparation.
5.8.7 Writing-off of financial liabilities
The Group writes-off financial liabilities only when they are repaid, cancelled or expire.
5.9. Foreign currency transactions
Transactions in currencies other than the functional currency are initially recorded at exchange rates
set on the dates of these transactions. Monetary assets and liabilities denominated in such currencies
are translated at the rates applicable at the reporting date. All realized and unrealized gains and losses
resulting from exchange rate differences are included in profit or loss for the period.
Notes on pages 42-89 form an integral part of these consolidated financial statements

Ovostar Union N.V. Annual Report 2016 | 53
Management Report
Governance Report
Financial Statements
Other information
Notes to the Consolidated Financial Statements
(in USD thousand, unless otherwise stated)
5.10. Biological assets
Biological assets represented by the commercial herd and herd replacements are recorded at fair value
less estimated selling and distribution expenses. Estimate of fair value of biological assets of the Group
is based on discounted cash flow models, according to which the fair value of biological assets is calcu-
lated using present value of the expected net cash flows from biological assets discounted at the ap-
propriate rate.
The Group recognizes a biological asset only where it controls an asset as a result of past events; it is
probable that the economic benefits from the asset will flow to the Group; fair value or cost of an asset
can be estimated with reasonable certainty.
Profit or loss arising on initial recognition of biological assets at fair value less estimated selling and dis-
tribution expenses is included in the consolidated income statement as incurred.
Agricultural products collected from a biological asset are measured at fair value less estimated selling
and distribution expenses. Profit or loss arising on initial recognition of agricultural products at fair val-
ue, less estimated selling and distribution expenses, is recognized in the consolidated statement of
comprehensive income.
5.11. Inventories
Inventories consist mainly of raw materials, package and packing materials, agricultural produce and
finished goods. Inventories are valued at the lower of cost and net realisable value.
Cost of goods includes the cost of acquisition and, where appropriate, costs incurred in bringing inven-
tories to their present condition and location. Cost is calculated using the weighted average method.
Initial cost of inventories includes the transfer of gains and losses on qualifying cash flow hedges, rec-
ognised in OCI, in respect to the purchases of raw materials.
Net realisable value is the estimated selling price in the ordinary course of business, less estimated
costs of completion and the estimated costs necessary to make the sale.
5.12. Property, plant and equipment
Property, plant and equipment are recorded at historical cost or deemed cost, equal to fair value at the
date of transition to IFRS, less accumulated depreciation and accumulated impairment losses. Histori-
cal cost of an asset of property, plant and equipment includes (a) the purchase price, including non-
recoverable import duties and taxes net of trade and other discounts; (b) any costs directly related to
bringing an asset to the location and condition, which allow its functioning in accordance with the in-
tentions of the Group's management; (c) initial assessment of the costs of dismantling and removal in
the asset of property, plant and equipment and restoring the occupied territory; this obligation is as-
sumed by the Company either upon the acquisition of an asset, or as a result of its operation for a cer-
tain period of time for the purposes not related to the production of inventories during this period.
Cost of assets created in-house includes cost of materials, direct labor costs and an appropriate propor-
tion of production overheads.
Notes on pages 42-89 form an integral part of these consolidated financial statements
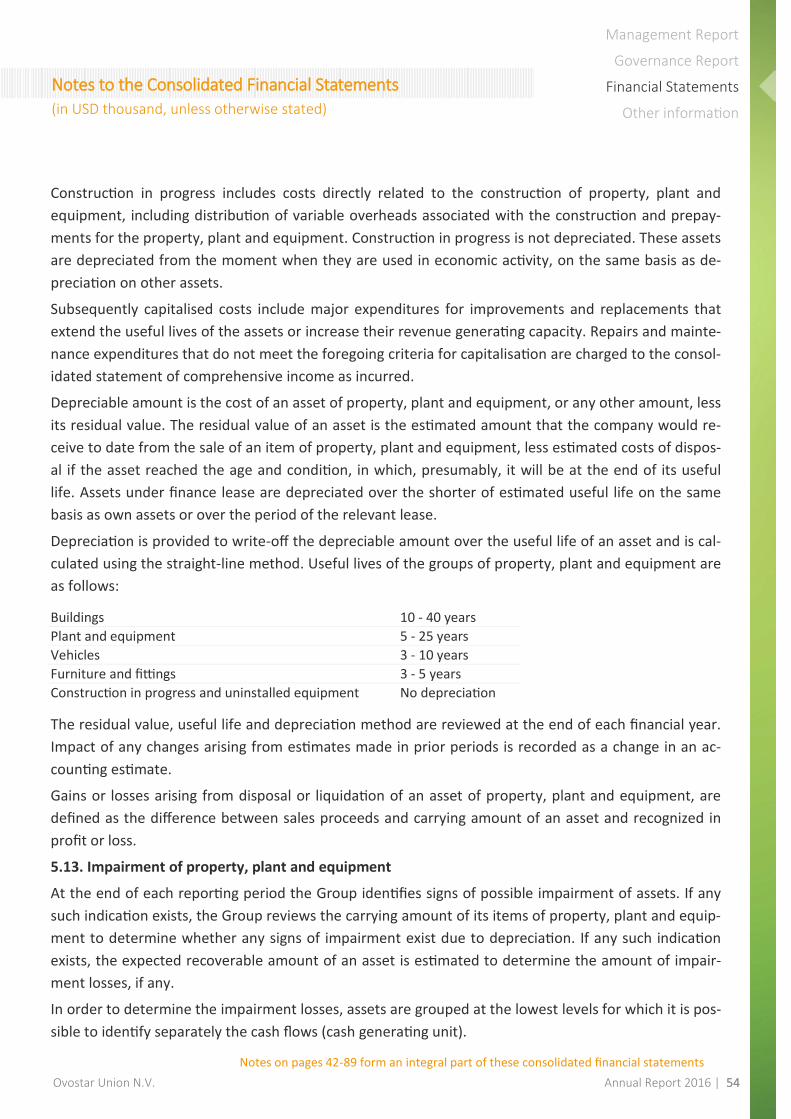
Ovostar Union N.V. Annual Report 2016 | 54
Management Report
Governance Report
Financial Statements
Other information
Notes to the Consolidated Financial Statements
(in USD thousand, unless otherwise stated)
Construction in progress includes costs directly related to the construction of property, plant and
equipment, including distribution of variable overheads associated with the construction and prepay-
ments for the property, plant and equipment. Construction in progress is not depreciated. These assets
are depreciated from the moment when they are used in economic activity, on the same basis as de-
preciation on other assets.
Subsequently capitalised costs include major expenditures for improvements and replacements that
extend the useful lives of the assets or increase their revenue generating capacity. Repairs and mainte-
nance expenditures that do not meet the foregoing criteria for capitalisation are charged to the consol-
idated statement of comprehensive income as incurred.
Depreciable amount is the cost of an asset of property, plant and equipment, or any other amount, less
its residual value. The residual value of an asset is the estimated amount that the company would re-
ceive to date from the sale of an item of property, plant and equipment, less estimated costs of dispos-
al if the asset reached the age and condition, in which, presumably, it will be at the end of its useful
life. Assets under finance lease are depreciated over the shorter of estimated useful life on the same
basis as own assets or over the period of the relevant lease.
Depreciation is provided to write-off the depreciable amount over the useful life of an asset and is cal-
culated using the straight-line method. Useful lives of the groups of property, plant and equipment are
as follows:
The residual value, useful life and depreciation method are reviewed at the end of each financial year.
Impact of any changes arising from estimates made in prior periods is recorded as a change in an ac-
counting estimate.
Gains or losses arising from disposal or liquidation of an asset of property, plant and equipment, are
defined as the difference between sales proceeds and carrying amount of an asset and recognized in
profit or loss.
5.13. Impairment of property, plant and equipment
At the end of each reporting period the Group identifies signs of possible impairment of assets. If any
such indication exists, the Group reviews the carrying amount of its items of property, plant and equip-
ment to determine whether any signs of impairment exist due to depreciation. If any such indication
exists, the expected recoverable amount of an asset is estimated to determine the amount of impair-
ment losses, if any.
In order to determine the impairment losses, assets are grouped at the lowest levels for which it is pos-
sible to identify separately the cash flows (cash generating unit).
Buildings 10 - 40 years
Plant and equipment 5 - 25 years
Vehicles 3 - 10 years
Furniture and fittings 3 - 5 years
Construction in progress and uninstalled equipment No depreciation
Notes on pages 42-89 form an integral part of these consolidated financial statements

Ovostar Union N.V. Annual Report 2016 | 55
Management Report
Governance Report
Financial Statements
Other information
Notes to the Consolidated Financial Statements
(in USD thousand, unless otherwise stated)
The recoverable amount is the higher of fair value less selling and distribution expenses and value of an
asset in use. In assessing the value of an asset in use, the estimated future cash flows associated with
the asset, are discounted to their present value using pre-tax discount rate that reflects current market
estimates of time value of money and the risks inherent in the asset.
If, according to the estimates, the recoverable amount of an asset (cash generating unit) is less than its
carrying amount, the carrying amount of an asset (cash generating unit) is reduced to the recoverable
amount. An impairment loss is recognized immediately in the income statement, except when the as-
set is recorded at a revalued amount. In this case the impairment loss is considered as a revaluation
decrease.
In cases where impairment losses are subsequently reversed, the carrying amount of the asset (cash
generating unit) is increased to the revised estimate of recovery amount, however, in such a way that
the increased carrying amount does not exceed the carrying amount that would be determined, if an
impairment loss was not recognized in respect of an asset (cash generating unit) in previous years. Re-
versal of impairment loss is recognized immediately in the income statement, except when the asset is
recorded at a revalued amount. In this case, the reversal of an impairment loss is considered as a reval-
uation increase.
5.14. Intangible assets
Intangible assets acquired separately are measured on initial recognition at cost. The cost of intangible
assets acquired in a business combination is its fair value as at the date of acquisition. Following initial
recognition, intangible assets are carried at cost less any accumulated amortization and any accumulat-
ed impairment losses. Internally generated intangible assets are not capitalized and expenditure is re-
flected in the income statement in the year in which the expenditure is incurred.
The useful lives of intangible assets are assessed as either finite or indefinite.
Intangible assets with finite lives are amortised over the useful economic life and assessed for impair-
ment whenever there is an indication that the intangible asset may be impaired. The amortisation peri-
od and the amortisation method for an intangible asset with a finite useful life are reviewed at least at
each financial year end. Changes in the expected useful life or the expected pattern of consumption of
future economic benefits embodied in the asset is accounted for by changing the amortisation period
or method, as appropriate, and are treated as changes in accounting estimates. The amortisation ex-
pense on intangible assets with finite lives is recognised in the income statement in the expense cate-
gory consistent with the function of the intangible asset.
Intangible assets with indefinite useful lives are not amortised, but are tested for impairment annually,
either individually or at the cash generating unit level. The assessment of indefinite life is reviewed an-
nually to determine whether the indefinite life continues to be supportable. If not, the change in useful
life from indefinite to finite is made on a prospective basis.
Notes on pages 42-89 form an integral part of these consolidated financial statements

Ovostar Union N.V. Annual Report 2016 | 56
Management Report
Governance Report
Financial Statements
Other information
Notes to the Consolidated Financial Statements
(in USD thousand, unless otherwise stated)
Gains or losses arising from derecognition of an intangible asset are measured as the difference be-
tween the net disposal proceeds and the carrying amount of the asset and are recognised in the in-
come statement when the asset is derecognised.
Amortization is calculated on a straight line basis over the useful life of an asset, which is 10 years.
5.15. Borrowing costs
Borrowing costs directly attributable to the acquisition, construction or production of an asset that nec-
essarily takes a substantial period of time to get ready for its intended use or sale are capitalised as
part of the cost of the asset. All other borrowing costs are expensed in the period in which they occur.
Borrowing costs consist of interest and other costs that an entity incurs in connection with the borrow-
ing of funds.
5.16. Leases
Leases are classified as finance leases when according to the terms of lease the lessee assumes all prin-
cipal risks and rewards incident to ownership of the leased property. Other leases are classified as op-
erating leases. Income and expenses associated with operating leases are accrued on a straight-line
basis and recorded in the income statement over the lease term.
5.17. Group as a lessee
Finance leases, which transfer to the Group substantially all the risks and benefits incidental to owner-
ship of the leased item, are capitalised at the commencement of the lease at the fair value of the
leased property or, if lower, at the present value of the minimum lease payments. Lease payments are
apportioned between finance charges and reduction of the lease liability so as to achieve a constant
rate of interest on the remaining balance of the liability. Finance charges are recognised in the state-
ment of comprehensive income. Operating lease payments are recognized as an expense in the income
statement evenly over the lease term.
5.18. Group as a lessor
Leases where the Group does not transfer substantially all the risks and rewards of ownership of the
asset are classified as operating leases. Initial direct costs incurred in negotiating an operating lease are
added to the carrying amount of the leased asset and recognised over the lease term on the same base
as rental income. Contingent rents are recognised as revenue in the period in which they are earned.
5.19. Contingent assets and liabilities
Contingent liabilities are not recognized in the financial statements. Such liabilities are disclosed in the
notes to the financial statements, except where the probability of outflow of resources embodying eco-
nomic benefits is insignificant.
Contingent assets are not recognized in the financial statements, but disclosed in the notes to the ex-
tent that it is probable that the economic benefits will flow to the Group.
Notes on pages 42-89 form an integral part of these consolidated financial statements

Ovostar Union N.V. Annual Report 2016 | 57
Management Report
Governance Report
Financial Statements
Other information
Notes to the Consolidated Financial Statements
(in USD thousand, unless otherwise stated)
5.20. Provisions
Provisions are recognised when the Group has a present obligation (legal or constructive) as a result of
a past event, it is probable that an outflow of resources embodying economic benefits will be required
to settle the obligation and a reliable estimate can be made of the obligation amount.
The amount recognized as a provision is the best estimate of compensation necessary to repay a cur-
rent liability on the reporting date, which takes into account all the risks and uncertainties inherent in
this liability. In cases where the amount of provision is estimated using cash flows that can be required
to repay current liabilities, its carrying amount represents the present value of these cash flows.
Where there is a possibility that one or all of the economic benefits necessary to recover the amount of
provision will be reimbursed by a third party, the receivables are recognized as an asset if there is actu-
al assurance that such reimbursement will be received and the amount of receivables can be measured
reliably.
5.21. Revenue recognition
Revenues from the sale of goods are recognized when the Group has transferred to the buyer all sig-
nificant risks and rewards of ownership of the goods, and it is probable that the economic benefits as-
sociated with this transaction will flow to the Group.
Revenues from rendering of services are recognized in the reporting period in which the services were
provided, based on the level of completion of the specific transaction and only when the amount of
revenue can be reliably measured and it is probable that the economic benefits associated with this
transaction will flow to the Group.
Income and expenses relating to the same transaction or event are recognized simultaneously. Interest
income is recognized using the effective interest rate method.
5.22. Income tax
Income tax is calculated in accordance with the requirements of the applicable legislation of Ukraine.
Income tax is calculated on the basis of financial results for the year adjusted to items that are not in-
cluded in taxable income or that cannot be attributed to gross expenses. It is calculated using tax rates
effective at the reporting date.
Deferred tax is accounted for using the balance sheet liability method in respect of temporary differ-
ences arising from differences between the carrying amount of assets and liabilities in the financial
statements and the corresponding tax base used to calculate taxable income. Deferred tax liabilities
are generally recognized for all taxable temporary differences and deferred tax assets are recorded tak-
ing into account the degree of certainty in sufficient taxable income, which enables to realize tempo-
rary differences related to gross expenses.
Deferred tax is calculated at tax rates, which presumably will be applied during the sale of related as-
sets or repayment of related liabilities.
Notes on pages 42-89 form an integral part of these consolidated financial statements

Ovostar Union N.V. Annual Report 2016 | 58
Management Report
Governance Report
Financial Statements
Other information
Notes to the Consolidated Financial Statements
(in USD thousand, unless otherwise stated)
Assets and liabilities on deferred income tax are offset when: a) the Group has a legally enforceable
right to offset the recognized current income tax assets and liabilities; b) the Group intends either to
perform settlement by offsetting counterclaims, or simultaneously sell the asset and settle the liability;
c) deferred tax assets and liabilities relate to income taxes levied by the same taxation authority in
each future period in which it is intended to repay or reimburse a significant amount of deferred tax
liabilities and assets.
Deferred income tax is recognized in the income statement, except when it relates to items recognized
directly in equity. In this case the deferred tax is also recognized in equity.
In 2016, Ukrainian corporate income tax was levied at a rate of 18% (2015: 18%)
Fixed agricultural tax: The majority of the Group companies that are involved in agricultural production
(poultry farms and other entities engaged in agricultural production) benefit substantially from the sta-
tus of an agricultural producer. These companies are exempt from income taxes and pay the Fixed Ag-
ricultural Tax instead (Note 16).
5.23. Value Added Tax
For the year ended 31 December 2016 and 2015, VAT was levied at two rates: 20% on Ukrainian do-
mestic sales and imports of goods, works and services and 0% on export of goods and provision of
works or services to be used outside Ukraine. In 2016 VAT rate remains at the same level.
VAT output equals the total amount of VAT collected within a reporting period, and arises on the earli-
er of the date of shipping goods to the customer or the date of receiving payment from the customer.
VAT input is the amount that a taxpayer is entitled to offset against his VAT liability in the reporting pe-
riod. According to Ukrainian legislation, rights to VAT input arise on the earlier of the date of payment
to the supplier or the date goods are received.
5.24. Government grants
Government grants are stated at fair value when there is reasonable assurance that the grant will be
received.
Ukrainian legislation provides a variety of tax benefits and subsidies for agricultural companies. Such
benefits and subsidies are approved by the Supreme Council of Ukraine, the Ministry of Agrarian Policy,
Ministry of Finance, local authorities. Under the applicable legislation, agricultural producers are enti-
tled to use VAT benefit regarding agricultural transactions.
VAT refunds and other government grants
The Group’s companies are subject to special tax treatment for VAT (Note 12). The Group’s enterprises,
which qualify as agricultural producers, are entitled to retain the net VAT payable. VAT amounts paya-
ble are not transferred to the State, but credited to the entity’s separate special account to support the
agriculture activities of the Group. Net result on VAT operations, calculated as excess of VAT liability
over VAT credit is charged to profit or loss. VAT receivable exceeding VAT liability is used as a reduction
in tax liabilities of the next period.
Notes on pages 42-89 form an integral part of these consolidated financial statements

Ovostar Union N.V. Annual Report 2016 | 59
Management Report
Governance Report
Financial Statements
Other information
Notes to the Consolidated Financial Statements
(in USD thousand, unless otherwise stated)
Government grants are recognised as income over the periods necessary to match them with the relat-
ed costs, or as an offset against finance costs when received as compensation for the finance costs for
agricultural producers. To the extent the conditions attached to the grants are not met at the reporting
date, the received funds are recorded in the Group’s consolidated financial statements as deferred in-
come.
Other government grants are recognised at the moment when the decision to disburse the amounts to
the Group is made.
Government grants are not recognised until there is reasonable assurance that the Group will comply
with the conditions attached to them and that the grants will be received.
5.25. Partial compensation of interest rates on loans raised by the agricultural companies from finan-
cial institutions
The Group companies are entitled to compensation from the government of a share of interest expens-
es incurred on loans which were received for agricultural purposes. The amount of interest compensa-
tion depends on the term and purpose of the loan. Due to the fact that the payment of interest com-
pensations depends on the capabilities of the country's budget, they are recognized on a cash basis as
other operating income in the period of receipt.
5.26. Related party transactions
For the purposes of these consolidated financial statements, the parties are considered to be related if
one of the parties has a possibility to control or considerably influence the operational and financial
decisions of the other company. While considering any relation which can be defined as related party
transactions it is necessary to take into consideration the substance of the transaction not only their
legal form.
5.27. Reclassification
Certain comparative information presented in the consolidated financial statements for the year ended
31 December 2015 has been revised in order to achieve comparability with the presentation used in
the consolidated financial statements for the year ended 31 December 2016. Such reclassifications and
revisions were not significant to the Group financial statements.
6. New and amended standards
(a) New and amended standards and interpretations adopted
The Group applied for the first time certain standards and amendments, which are effective for annual
periods beginning on or after 1 January 2016. The Group has not early adopted any other standard, in-
terpretation or amendment that has been issued but is not yet effective.
Notes on pages 42-89 form an integral part of these consolidated financial statements

Ovostar Union N.V. Annual Report 2016 | 60
Management Report
Governance Report
Financial Statements
Other information
Notes to the Consolidated Financial Statements
(in USD thousand, unless otherwise stated)
The nature and the effect of these changes are disclosed below. Although these new standards and
amendments applied for the first time in 2016, they did not have a material impact on the annual con-
solidated financial statements of the Group. The nature and the impact of each new standard or
amendment are described below:
Amendments to IAS 1 Presentation of Financial Statements: Disclosure Initiative
The amendments aim at clarifying IAS 1 to address perceived impediments to preparers exercising their
judgement in presenting their financial reports.
IAS 7 Disclosure Initiative – Amendments to IAS 7
The amendments to IAS 7 Statement of Cash Flows are part of the IASB’s Disclosure Initiative and re-
quire an entity to provide disclosures that enable users of financial statements to evaluate changes in
liabilities arising from financing activities, including both changes arising from cash flows and non-cash
changes. On initial application of the amendment, entities are not required to provide comparative in-
formation for preceding periods. These amendments are effective for annual periods beginning on or
after 1 January 2017, with early application permitted. Application of amendments will result in addi-
tional disclosure provided by the Group.
IAS 12 Recognition of Deferred Tax Assets for Unrealised Losses – Amendments to IAS 12
The amendments clarify that an entity needs to consider whether tax law restricts the sources of taxa-
ble profits against which it may make deductions on the reversal of that deductible temporary differ-
ence. Furthermore, the amendments provide guidance on how an entity should determine future taxa-
ble profits and explain the circumstances in which taxable profit may include the recovery of some as-
sets for more than their carrying amount.
Entities are required to apply the amendments retrospectively. However, on initial application of the
amendments, the change in the opening equity of the earliest comparative period may be recognised
in opening retained earnings (or in another component of equity, as appropriate), without allocating
the change between opening retained earnings and other components of equity. Entities applying this
relief must disclose that fact.
These amendments are effective for annual periods beginning on or after 1 January 2017 with early
application permitted. If an entity applies the amendments for an earlier period, it must disclose that
fact. These amendments are not expected to have any impact on the Group.
IFRS 14 Regulatory Deferral Accounts
IFRS 14 is an optional standard that allows an entity, whose activities are subject to rate-regulation, to
continue applying most of its existing accounting policies for regulatory deferral account balances upon
its first-time adoption of IFRS. Entities that adopt IFRS 14 must present the regulatory deferral accounts
as separate line items on the statement of financial position and present movements in these account
balances as separate line items in the statement of profit or loss and other comprehensive income. The
standard requires disclosures on the nature of, and risks associated with, the entity’s rate-regulation
and the effects of that rate-regulation on its financial statements.
Notes on pages 42-89 form an integral part of these consolidated financial statements
Ovostar Union N.V. Annual Report 2016 | 61
Management Report
Governance Report
Financial Statements
Other information
Notes to the Consolidated Financial Statements
(in USD thousand, unless otherwise stated)
Amendments to IFRS 11 Joint Arrangements: Accounting for Acquisitions of Interests
The amendments to IFRS 11 require that a joint operator accounting for the acquisition of an interest
in a joint operation, in which the activity of the joint operation constitutes a business must apply the
relevant IFRS 3 principles for business combinations accounting. The amendments also clarify that a
previously held interest in a joint operation is not remeasured on the acquisition of an additional inter-
est in the same joint operation while joint control is retained. In addition, scope exclusion has been
added to IFRS 11 to specify that the amendments do not apply when the parties sharing joint control,
including the reporting entity, are under common control of the same ultimate controlling party.
The amendments apply to both the acquisition of the initial interest in a joint operation and the acqui-
sition of any additional interests in the same joint operation. These amendments do not have any im-
pact on the Group as there has been no interest acquired in a joint operation during the period.
Amendments to IAS 16 and IAS 41 Agriculture: Bearer Plants
The amendments change the accounting requirements for biological assets that meet the definition of
bearer plants. Under the amendments, biological assets that meet the definition of bearer plants will
no longer be within the scope of IAS 41. Instead, IAS 16 will apply.
Amendments to IAS 16 and IAS 38: Clarification of Acceptable Methods of Depreciation and Amorti-
sation
The amendments clarify the principle in IAS 16 and IAS 38 that revenue reflects a pattern of economic
benefits that are generated from operating a business (of which the asset is part) rather than the eco-
nomic benefits that are consumed through use of the asset. As a result, a revenue-based method can-
not be used to depreciate property, plant and equipment and may only be used in very limited circum-
stances to amortise intangible assets.
Amendments to IFRS 10 and IAS 28: Sale or Contribution of Assets between an Investor and its Asso-
ciate or Joint Venture
The amendments address the conflict between IFRS 10 and IAS 28 in dealing with the loss of control of
a subsidiary that is sold or contributed to an associate or joint venture. The amendments clarify that
the gain or loss resulting from the sale or contribution of assets that constitute a business, as defined in
IFRS 3, between an investor and its associate or joint venture, is recognised in full. Any gain or loss re-
sulting from the sale or contribution of assets that do not constitute a business, however, is recognised
only to the extent of unrelated investors’ interests in the associate or joint venture. The IASB has de-
ferred the effective date of these amendments indefinitely, but an entity that early adopts the amend-
ments must apply them prospectively.
Notes on pages 42-89 form an integral part of these consolidated financial statements

Ovostar Union N.V. Annual Report 2016 | 62
Management Report
Governance Report
Financial Statements
Other information
Notes to the Consolidated Financial Statements
(in USD thousand, unless otherwise stated)
Amendments to IAS 27: Equity Method in Separate Financial Statements
The amendments will allow entities to use the equity method to account for investments in subsidiar-
ies, joint ventures and associates in their separate financial statements. Entities already applying IFRS
and electing to change to the equity method in its separate financial statements will have to apply that
change retrospectively. For first-time adopters of IFRS electing to use the equity method in its separate
financial statements, they will be required to apply this method from the date of transition to IFRS.
Annual improvements 2012-2014 Cycle
IFRS 5 Non-current Assets Held for Sale and Discontinued Operations
This improvement adds specific guidance in IFRS 5 for cases in which an entity reclassifies an asset from
held for sale to held for distribution or vice versa and cases in which held-for-distribution accounting is
discontinued.
IFRS 7 Financial Instruments: Disclosures (with consequential amendments to IFRS 1)
The amendment adds additional guidance to clarify whether a servicing contract is continuing involve-
ment in a transferred asset for the purpose of determining the disclosures required.
This improvement clarifies the applicability of the amendments to IFRS 7 on offsetting disclosures to
condensed interim financial statements.
IAS 19 Employee Benefits
This amendment clarifies that the high quality corporate bonds used in estimating the discount rate for
post-employment benefits should be denominated in the same currency as the benefits to be paid
(thus, the depth of the market for high quality corporate bonds should be assessed at currency level).
IAS 34 Interim Financial Reporting
The amendment clarifies the meaning of 'elsewhere in the interim report' and requires a cross-
reference
These changes had no significant impact on the disclosures or amounts recognised in the Group’s con-
solidated financial statements.
(b) New and amended standards and interpretations not yet adopted
The standards and interpretations that are issued, but not yet effective, up to the date of issuance of
the Group’s financial statements are disclosed below. The Group intends to adopt these standards, if
applicable, when they become effective.
IFRS 2 Classification and Measurement of Share-based Payment Transactions — Amendments to IFRS
2
The IASB issued amendments to IFRS 2 Share-based Payment that address three main areas: the effects
of vesting conditions on the measurement of a cash-settled share-based payment transaction; the clas-
sification of a share-based payment transaction with net settlement features for withholding tax obli-
gations; and accounting where a modification to the terms and conditions of a share-based payment
transaction changes its classification from cash settled to equity settled.
Notes on pages 42-89 form an integral part of these consolidated financial statements

Ovostar Union N.V. Annual Report 2016 | 63
Management Report
Governance Report
Financial Statements
Other information
Notes to the Consolidated Financial Statements
(in USD thousand, unless otherwise stated)
On adoption, entities are required to apply the amendments without restating prior periods, but retro-
spective application is permitted if elected for all three amendments and other criteria are met. The
amendments are effective for annual periods beginning on or after 1 January 2018, with early applica-
tion permitted. The Group is assessing the potential effect of the amendments on its consolidated fi-
nancial statements.
Clarifications to IFRS 15 Revenue from contracts with customers effective for annual period beginning
on or after 1 January 2018
Amendments to IFRS 4: Applying IFRS 9 Financial Instruments with IFRS 4 Insurance Contracts effec-
tive for annual period beginning on or after 1 January 2018
IFRS 9 Financial Instruments
In July 2014, the IASB issued the final version of IFRS 9 Financial Instruments which reflects all phases
of the financial instruments project and replaces IAS 39 Financial Instruments: Recognition and Meas-
urement and all previous versions of IFRS 9. The standard introduces new requirements for classifica-
tion and measurement, impairment, and hedge accounting. Retrospective application is required, but
comparative information is not compulsory. The Group will implement IFRS 9 per 1 January 2018. The
adoption of IFRS 9 will have an effect on the classification and measurement of the Group’s financial
assets, but will potentially have no impact on the classification and measurement of the Group’s finan-
cial liabilities.
IFRS 15 Revenue from Contracts with Customers
IFRS 15 was issued in May 2014 and establishes a new five-step model that will apply to revenue arising
from contracts with customers. Under IFRS 15 revenue is recognised at an amount that reflects the
consideration to which an entity expects to be entitled in exchange for transferring goods or services to
a customer. The principles in IFRS 15 provide a more structured approach to measuring and recognising
revenue.
It replaces existing revenue recognition guidance, including IAS 18 Revenue, IAS 11 Construction Con-
tracts and IFRIC 13 Customer Loyalty Programmes and will be implemented by the Group per 1 January
2018. The Group has started the identification of the areas where IFRS 15 changes the current ac-
counting policies. The impact of the standard will be further investigated in 2017.
IFRS 16 Leases
IFRS 16, published in January 2016, establishes a revised framework for determining whether a lease is
recognised on the (Consolidated) Statement of Financial Position. It replaces existing guidance on leas-
es, including IAS 17. The Group expects to implement IFRS 16 per 1 January 2019. In 2016, the Group
has started to collect rental and lease contracts from the key operating companies. The Group is cur-
rently in the process of determining to what extent these commitments will result in the recognition of
an asset and a liability for future payments and how this will affect the Group’s profit and classification
of cash flows. Ovostar Union will further analyse the lease contracts in 2017 to prepare an initial im-
pact assessment.
Notes on pages 42-89 form an integral part of these consolidated financial statements

Ovostar Union N.V. Annual Report 2016 | 64
Management Report
Governance Report
Financial Statements
Other information
Notes to the Consolidated Financial Statements
(in USD thousand, unless otherwise stated)
7. Subsidiaries and Non-controlling interests
As at 31 December 2016 and 2015 the Group included the following subsidiaries:
The tables on the following page summarise the information relating to each of the Group’s subsidiar-
ies that has material NCI, before any intra-group elimination:
Name of the company Business activities 31 December
2016
31 December
2015
Limited Liability Company
“Ovostar Union”
Strategic management of subsidiary com-
panies in Ukraine 100.0% 100.0%
International Food Trade
Limited Trade company (British Virgin Islands) 100.0% -
Limited Liability Company
“Yasensvit”
Breeder farms, production of hatching
eggs, farms for growing young laying
flock and for laying flock, production and
distribution of shell eggs, poultry feed
production
98.0% 98.0%
Limited Liability Company
“Ovostar” Egg-products production and distribution 100.0% 100.0%
Public Joint Stock Company
“Poultry Farm Ukraine” Production of shell eggs, assets holding 92.0% 92.0%
Public Joint Stock Company
“Malynove” Production of shell eggs, assets holding 94.0% 94.0%
Public Joint Stock Company
“Krushynskyy Poultry Complex”
Trading company, egg trading – non op-
erational activity 76.0% 76.0%
Limited Liability Company
“Skybynskyy Fodder Plant” In the process of liquidation 98.6% 98.6%
Notes on pages 42-89 form an integral part of these consolidated financial statements

Ovostar Union N.V. Annual Report 2016 | 65
Management Report
Governance Report
Financial Statements
Other information
Notes to the Consolidated Financial Statements
(in USD thousand, unless otherwise stated)
As at 31 December 2016 LLC
“Yasensvit”
PJSC
“Poultry
Farm
Ukraine”
PJSC
“Malynove”
PJSC
“Krushynsky
y Poultry
Complex”
Intra-
group
elimina-
tions
Total
NCI percentage 2.0% 8.0% 6.0% 24.0% Non-current assets 35 038 1 181 7 082 - Current assets 60 425 4 971 1 962 568 Non-current liabilities - - (203) (3) Current liabilities (6 439) (472) (6 475) (8)
Net assets 89 024 5 680 2 366 557
Carrying amount of NCI 1 780 454 142 134 - 2 511 Revenue 72 896 7 463 4 080 -
Profit (loss) 25 562 (1 523) (151) - OCI (10 020) (795) (323) (95)
Total comprehensive income 15 542 (2 318) (474) (95) Profit allocated to NCI 511 (122) (9) - 380 OCI allocated to NCI (200) (64) (19) (23) (306) CF from operating activities 13 784 17 848 (1) CF from investment activities (10 250) (11) (382) -
CF from financing activities (dividend to NCI: nil)
898 - - -
Net (decrease)/ increase in cash and cash equivalents
4 432 6 466 (1)
As at 31 December 2015 LLC
“Yasensvit”
PJSC “Poultry
Farm
Ukraine”
PJSC
“Malynove”
PJSC
“Krushynsky
y Poultry
Complex”
Intra-
group
elimina-
tions
Total
NCI percentage 2.0% 8.0% 6.0% 24.0% Non-current assets 27 595 5 431 5 777 - Current assets 49 650 2 879 500 642
Non-current liabilities - (41) (245) (3) Current liabilities (3 726) (270) (3 192) 9
Net assets 73 519 7 999 2 840 648
Carrying amount of NCI 1 470 640 170 156 - 2 436 Revenue 71 196 6 201 2 652 -
Profit (loss) 30 449 5 262 (647) (5) OCI (26 267) (2 178) (1 761) (341)
Total comprehensive income 4 182 3 084 (2 408) (346) Profit allocated to NCI 609 421 (39) (1) 990 OCI allocated to NCI (525) (174) (106) (82) (887)
CF from operating activities 11 091 1 150 3 889 1 CF from investment activities (7 684) (1 159) (3 817) -
CF from financing activities (dividend to NCI: nil)
- - - -
Net (decrease)/ increase in 2 868 (13) 32 1
Notes on pages 42-89 form an integral part of these consolidated financial statements

Ovostar Union N.V. Annual Report 2016 | 66
Management Report
Governance Report
Financial Statements
Other information
Notes to the Consolidated Financial Statements
(in USD thousand, unless otherwise stated)
8. Segment information
All of the Group’s operations are located within Ukraine.
Segment information is analyzed on the basis of the types of goods supplied by the Group’s operating
divisions. The Group’s reportable segments under IFRS 8 are therefore as follows:
The accounting policies of the reportable segments are the same as the Group’s accounting policies
described in Note 5. Sales between segments are mainly carried out at market prices. Operating profit
before tax represents segment result. This is the measure reported to the chief operating decision
maker for the purposes of resource allocation and assessment of segment performance.
For the purposes of monitoring segment performance and allocating resources between segments:
All assets are allocated to reportable segments.
All liabilities are allocated to reportable segments.
The following table presents revenue, results of operations and certain assets and liabilities infor-
mation regarding segments for the year ended 31 December 2016 and 2015:
In 2016 and 2015 no sales were settled by barter transactions.
Segment assets, liabilities and other information regarding segments as at 31 December 2016 and 2015
were presented as follows:
Egg operations segment sales of egg
sales of chicken meat
Egg products operations segment sales of egg processing products
Oilseed operations segment sales of sunflower oil, rapeseed oil and related products
For the year ended
31 December 2015
Operations segment Consolidated
Egg Egg products Oilseed
Revenue 94 354 23 001 3 427 120 782 Inter-segment revenue (38 802) (4 827) (1 547) (45 176) Revenue from external buyers 55 552 18 174 1 880 75 606
Profit before tax 28 408 4 244 - 32 652
For the year ended
31 December 2016
Operations segment Consolidated
Egg Egg products Oilseed
Revenue 99 280 23 531 3 143 125 954 Inter-segment revenue (43 620) (2 420) (2 174) (48 214) Revenue from external buyers 55 660 21 111 969 77 740
Profit before tax 15 253 7 455 - 22 708
Notes on pages 42-89 form an integral part of these consolidated financial statements

Ovostar Union N.V. Annual Report 2016 | 67
Management Report
Governance Report
Financial Statements
Other information
Notes to the Consolidated Financial Statements
(in USD thousand, unless otherwise stated)
Segment assets, liabilities and other information regarding segments as at 31 December 2016 and 2015
were presented as follows:
The following table presents information about revenue from external buyers divided by geographic
location for the year ended 31 December 2016 and 2015:
Revenue for the year ended 31 December 2016 from two customer amounted to USD 11 108 thou-
sand and USD 9 335 thousand (2015: USD 10 167 thousand and USD 9 413 thousand, respectively),
arising from sales in the egg operations segment.
As at 31 December 2016 Operations segment
Consolidated Egg Egg products Oilseed
Total segment assets 99 227 8 846 1 930 110 003
Total segment liabilities 20 613 986 - 21 599 Addition to property, plant and
equipment and intangible assets 8 436 507 - 8 943 Net change in fair value of biological
assets and agricultural produce 466 181 - 647 Depreciation and amortization (2 316) (168) (8) (2 492) Interest income 896 2 - 898 Interest on debts and borrowings (1 095) - - (1 095) Income tax expense (24) (151) - (175)
As at 31 December 2015 Operations segment
Consolidated Egg Egg products Oilseed
Total segment assets 91 569 9 035 114 100 718
Total segment liabilities 20 965 1 245 1 22 211 Addition to property, plant and
equipment and intangible assets 9 483 237 52 9 772 Net change in fair value of biological
assets and agricultural produce 1 718 692 - 2 410 Depreciation and amortization (2 243) (170) (14) (2 427) Interest income 337 8 - 345 Interest on debts and borrowings (1 160) (23) - (1 183) Income tax expense (435) (273) - (708)
Revenue by regions For year 2016 For year 2015
Ukraine 53 763 54 049 Middle East 18 949 19 161 European Union 4 856 1 362 CIS 141 239 Africa 1 436 Other 30 359
Total 77 740 75 606
Notes on pages 42-89 form an integral part of these consolidated financial statements
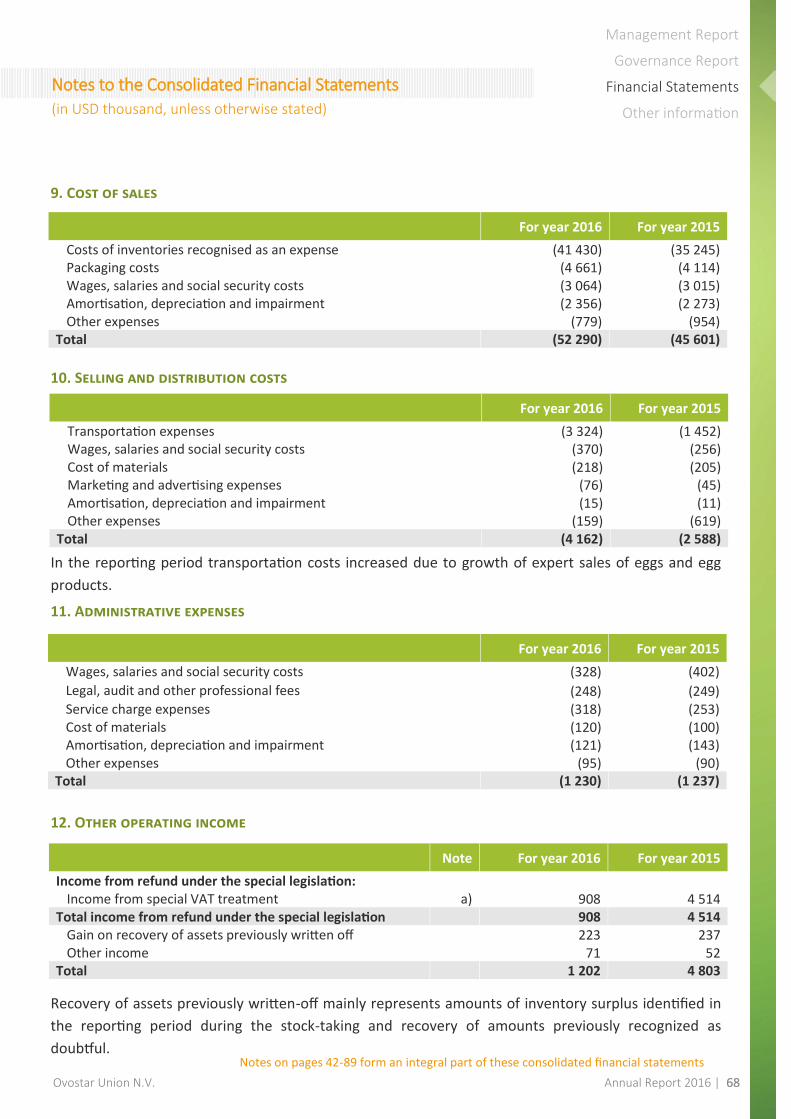
Ovostar Union N.V. Annual Report 2016 | 68
Management Report
Governance Report
Financial Statements
Other information
Notes to the Consolidated Financial Statements
(in USD thousand, unless otherwise stated)
9. Cost of sales
10. Selling and distribution costs
In the reporting period transportation costs increased due to growth of expert sales of eggs and egg
products.
11. Administrative expenses
12. Other operating income
Recovery of assets previously written-off mainly represents amounts of inventory surplus identified in
the reporting period during the stock-taking and recovery of amounts previously recognized as
doubtful.
For year 2016 For year 2015
Costs of inventories recognised as an expense (41 430) (35 245) Packaging costs (4 661) (4 114) Wages, salaries and social security costs (3 064) (3 015) Amortisation, depreciation and impairment (2 356) (2 273) Other expenses (779) (954)
Total (52 290) (45 601)
For year 2016 For year 2015
Transportation expenses (3 324) (1 452) Wages, salaries and social security costs (370) (256) Cost of materials (218) (205) Marketing and advertising expenses (76) (45) Amortisation, depreciation and impairment (15) (11) Other expenses (159) (619)
Total (4 162) (2 588)
For year 2016 For year 2015
Wages, salaries and social security costs (328) (402)
Legal, audit and other professional fees (248) (249) Service charge expenses (318) (253) Cost of materials (120) (100) Amortisation, depreciation and impairment (121) (143) Other expenses (95) (90)
Total (1 230) (1 237)
Note For year 2016 For year 2015
Income from refund under the special legislation: Income from special VAT treatment a) 908 4 514
Total income from refund under the special legislation 908 4 514 Gain on recovery of assets previously written off 223 237 Other income 71 52
Total 1 202 4 803
Notes on pages 42-89 form an integral part of these consolidated financial statements

Ovostar Union N.V. Annual Report 2016 | 69
Management Report
Governance Report
Financial Statements
Other information
Notes to the Consolidated Financial Statements
(in USD thousand, unless otherwise stated)
a) Income from special VAT treatment
According to the Tax Code of Ukraine, companies that generated not less than 75% of gross revenues
for the previous tax year from sales of own agricultural products are entitled to retain VAT on sales
products, net of VAT paid on purchases, for use in agricultural production. Producers of eggs, poultry
and other agriculture producers shall retain VAT in a portion of 50%.
In accordance with the changes in the tax legislation of Ukraine, from 1 January 2017, specific VAT sub-
sidies is canceled. From 1 January 2017, in order to continue state support for agricultural companies,
tax legislation introduces budget subsidies. From 2017 onwards, budget subsidies will be provided until
1 January 2022. The agricultural producers will be engaged in the production of farm animals, as well
as fruit and vegetable farmers. For each agricultural producer, the amount of the subsidy is not to ex-
ceed the amount of VAT tax paid by the producers, and will be distributed on a monthly basis.
In accordance with the Tax Code, the VAT rate is currently effective at 20%.
All members of the Group qualify for the use of VAT benefits except for Limited Liability Company
“Ovostar”, Open Joint Stock Company “Krushynskyy Poultry Complex”, Limited Liability Company
“Skybynskyy Fodder Plant”, Limited Liability Company “Ovostar Union”, Public Joint Stock Company
“Malynove”.
Included in VAT refunds for the years ended 31 December 2016, 2015 were specific VAT subsidies for
the production and sale of eggs and egg products for further processing.
Reconciliation of VAT refunds for the year ended 31 December 2016, 2015 was presented as follows:
13. Other operating expenses
For year 2016 For year 2015
As at 01 January - 1 Received during the year 908 4 515 Released to the statement of comprehensive income (908) (4 514) Exchange differences - (2)
As at 31 December - - Current - - Non-current - -
For year 2016 For year 2015
VAT writtеn-off (153) (627)
Impairment of doubtful accounts receivable and prepayments to suppliers
(69) (292)
Fines and penalties (25) (29) Other expenses (22) (62)
Total (269) (1 010)
Notes on pages 42-89 form an integral part of these consolidated financial statements

Ovostar Union N.V. Annual Report 2016 | 70
Management Report
Governance Report
Financial Statements
Other information
Notes to the Consolidated Financial Statements
(in USD thousand, unless otherwise stated)
14. Finance costs
15. Finance income
16. Income tax
Companies of the Group that are involved in agricultural production pay the Fixed Agricultural Tax (the
“FAT”) in accordance with the applicable laws. The FAT is paid in lieu of corporate income tax, land tax,
duties for geological survey works and duties for trade patents.
The FAT is calculated by local authorities and depends on the area and valuation of land occupied. This
tax regime is valid indefinitely. FAT does not constitute an income tax, and as such, is recognized in the
statement of comprehensive income in administrative expenses.
During the year ended 31 December 2016, the Group companies which have the status of the Corpo-
rate Income Tax (the “CIT”) payers in Ukraine were subject to income tax at a 18% rate (31 December
2015: at a 18% rate). The deferred income tax assets and liabilities as of 31 December 2016 were meas-
ured based on the tax rates expected to be applied to the period when the temporary differences are
expected to reverse.
The major components of income tax expense for year ended 31 December 2016 and 2015 were:
For year 2016 For year 2015
Interest on debts and borrowings (1 094) (1 172) Interest on financial lease (1) (11) Other financial expenses - (53)
Total (1 095) (1 236)
For year 2016 For year 2015
Foreign currency exchange gain 1 265 1 160 Interest income 900 345
Total 2 165 1 505
For year 2016 For year 2015
Current income tax (55) (26) Deferred tax (120) (682)
Income tax (expense)/benefit reported in the income statement (175) (708)
Notes on pages 42-89 form an integral part of these consolidated financial statements

Ovostar Union N.V. Annual Report 2016 | 71
Management Report
Governance Report
Financial Statements
Other information
Notes to the Consolidated Financial Statements
(in USD thousand, unless otherwise stated)
Reconciliation between tax expense and the product of accounting profit multiplied by Ukraine’s do-
mestic tax rate for the years ended 31 December 2016 and 2015 was as follows:
(1) Current year losses for which no deferred tax asset was recognized relate to Ovostar Union N.V., the
Dutch company. The income tax rate in the Netherlands is 25.0%.
Deferred tax
As at 31 December 2016 and 2015, deferred tax assets and liabilities comprised the following:
For year 2016 For year 2015
Accounting profit before income tax 22 708 32 652 At Ukraine’s statutory income tax rate of 18% (2014: 18%) 4 087 5 877
Tax effect of: Income generated by FAT payers (exempt from income tax) (4 636) (6 343)
Current year losses for which no deferred tax asset was recognised at a rate of 25.0% (1) 99 46
Effect of expenses that are not deductible in determining taxable profit 534 1 055 Effect of translation to presentation currency 91 73
Income tax expense/(benefit) 175 708
As at 31 De-
cember
2016
Recognized in
statement of
comprehen-
sive income
Effect of trans-
lation into
presentation
currency
As at 31 De-
cember
2015
Advances received and other payables 10 (25) (3) 38 Prepayments to suppliers 8 (57) (5) 70 Trade and other receivables 31 8 (3) 26 Inventories 1 (13) (1) 15 Tax losses 227 - (30) 257 Unrecognized deferred tax assets (231) 1 29 (261)
Netted off against deferred tax assets 46 (86) (13) 145 Property, plant and equipment and intan-
gible assets (770) (37) 100 (833)
Advances received and other payables (12) 3 2 (17)
Netted off against deferred tax liabilities (782) (34) 102 (850)
Net deferred tax asset/(liability) (736) (120) 89 (705)
Notes on pages 42-89 form an integral part of these consolidated financial statements

Ovostar Union N.V. Annual Report 2016 | 72
Management Report
Governance Report
Financial Statements
Other information
Notes to the Consolidated Financial Statements
(in USD thousand, unless otherwise stated)
Deferred income tax assets and liabilities are offset when there is a legally enforceable right to set off
current tax assets against current tax liabilities and when the deferred income taxes relate to the same
fiscal authority. The following amounts, determined after appropriate offsetting, are presented in the
consolidated balance sheet as at 31 December 2016 and 2015:
17. Biological assets
As at 31 December 2016 and 2015 commercial and replacement poultry were presented as follows:
As at 31 De-
cember
2015
Recognized in
statement of
comprehen-
sive income
Effect of trans-
lation into
presentation
currency
As at 31 De-
cember
2014
Advances received and other payables 38 39 (2) 1 Prepayments to suppliers 70 59 (10) 21 Trade and other receivables 26 4 (13) 35 Inventories 15 - (7) 22 Tax losses 257 - (134) 391 Unrecognized deferred tax assets (261) (174) 69 (156)
Netted off against deferred tax assets 145 (72) (97) 314
Property, plant and equipment and intan-
gible assets (833) (602) 164 (395)
Advances received and other payables (17) (8) 6 (15) Netted off against deferred tax liabilities (850) (610) 170 (410)
Net deferred tax asset/(liability) (705) (682) 73 (96)
As at 31 Decem-
ber 2016
As at 31 Decem-
ber 2015 Non-current assets 46 145 Long term liabilities (782) (850)
Net deferred tax asset/(liability) (736) (705)
As at 31 December 2016 As at 31 December 2015
Number, thou-
sand heads
Carrying
value
Number, thou-
sand heads
Carrying
value Non-current biological assets
Replacement poultry
Hy-line 4 365 28 500 3 947 26 041 Total non-current biological assets 4 365 28 500 3 947 26 041
Current biological assets Commercial poultry Hy-line 3 195 10 679 2 547 8 409
Total current biological assets 3 195 10 679 2 547 8 409 Total biological assets 7 560 39 179 6 494 34 450
Notes on pages 42-89 form an integral part of these consolidated financial statements

Ovostar Union N.V. Annual Report 2016 | 73
Management Report
Governance Report
Financial Statements
Other information
Notes to the Consolidated Financial Statements
(in USD thousand, unless otherwise stated)
Classification of biological assets into non-current and current component is based on the life cycle of a
biological asset. Biological assets that will generate cash flow more than one year are classified as non-
current biological assets, biological assets that will generate cash flow less than one year are classified
as current biological assets.
Reconciliation of commercial and replacement poultry carrying values for the year ended 31 December
2016 and 2015 was presented as follows:
For the year ended 31 December 2016 the Group produced shell eggs in the quantity of 1 479 mln
items (31 December 2015: 1 196 mln).
Fair value of biological assets was estimated by the Group's specialists which have experience in valua-
tion of such assets. Fair value was calculated by discounting of expected net cash flow (in nominal
measuring) at the moment of eggs produced, using corresponding discount rate which is equal to
29.36% (31 December 2015: 33.47%). Management supposes that sale price and production and distri-
bution costs fluctuations will comply with forecasted index of consumer price in Ukraine. The major
assumptions were performed on the basis of internal and external information and it reflected Man-
agement's assessment of the future agricultural prospect.
Biological assets of the Group are measured at fair value within Level 3 of the fair value hierarchy.
Value measurement is a maximum value exposed to the following assumptions which were used in fair
value calculations of biological assets:
Based on the current situation in Ukraine that provides a high degree of uncertainty in relation to many
of the assumptions in the biological assets revaluation model, and guided by the prudence concept, the
Group used conservative approach for calculation of fair value of biological assets as at 31 December
2016.
For year 2016 For year 2015
As at 01 January 34 450 37 178
Increase in value as a result of assets acquisition 306 1 272 Increase in value as a result of capitalization of cost 9 408 9 084 Income/(Losses) from presentation of biological assets at fair value 647 2 410 Decrease in value as a result of assets disposal (1 003) (1 734) Exchange differences (4 629) (13 760)
As at 31 December 39 179 34 450
Assumption as at
31 December
2016
Assumption as at
31 December
2015
Eggs sale price, USD per item (UAH per item) 0.061 (1.560) 0.067 (1.464) Discount rate, % 29.36% 33.47% Long-term inflation rate of Ukrainian hryvnia, % 114.10% 113.50%
Notes on pages 42-89 form an integral part of these consolidated financial statements

Ovostar Union N.V. Annual Report 2016 | 74
Management Report
Governance Report
Financial Statements
Other information
Notes to the Consolidated Financial Statements
(in USD thousand, unless otherwise stated)
Changes in key assumptions that were used in fair value estimation of biological assets had the follow-
ing influence on the value of biological assets as at 31 December 2016 and 2015:
18. Property, plant and equipment and intangible assets
31 December 2016 31 December 2015
1% decrease in egg sale price (1 015) (926) 1% increase in discount rate (532) (500) 1% increase in long-term inflation rate of Ukrainian hryvnia 458 416
Buildings
Plant and
equip-
ment
Vehi-
cles
Furni-
ture
and
fittings
Construction
-in-progress
and unin-
stalled
equipment
Intan-
gible
assets
Total
Cost or valuation As at 31 December 2014 21 919 25 022 744 375 4 392 36 52 488
Additions 892 5 323 33 38 3 486 - 9 772 Transfer 583 2 375 - 5 (2 963) - - Disposals (91) (191) (1) (3) - - (286) Currency translation
difference (7 672) (9 281) (257) (132) (1 405) (12) (18 759)
As at 31 December 2015 15 631 23 248 519 283 3 510 24 43 215 Additions 195 28 262 41 8 417 - 8 943
Transfer 3 089 6 808 91 26 (10 014) - - Disposals (158) (288) - (6) 1 - (451) Currency translation
difference (2 032) (3 097) (81) (36) (341) (2) (5 589)
As at 31 December 2016 16 725 26 699 791 308 1 573 22 46 118
Depreciation and amortization (D&A) As at 31 December 2014 (3 969) (7 301) (443) (260) - (8) (11 981)
D&A charge (920) (1 407) (42) (55) - (2) (2 426) Disposals 82 172 1 3 - - 258 Currency translation
difference 1 437 2 614 155 95 - 3 4 304
As at 31 December 2015 (3 370) (5 922) (329) (217) - (7) (9 845) D&A charge (753) (1 615) (62) (61) - (1) (2 492) Disposals 158 288 - 4 - - 450
Currency translation
difference 432 776 42 30 - 1 1 281
As at 31 December 2016 (3 533) (6 473) (349) (244) - (7) (10 606)
Net book value As at 31 December 2016 13 192 20 226 442 64 1 573 15 35 512 As at 31 December 2015 12 261 17 326 190 66 3 510 17 33 370 As at 31 December 2014 17 950 17 721 301 115 4 392 28 40 507
Notes on pages 42-89 form an integral part of these consolidated financial statements

Ovostar Union N.V. Annual Report 2016 | 75
Management Report
Governance Report
Financial Statements
Other information
Notes to the Consolidated Financial Statements
(in USD thousand, unless otherwise stated)
As at 31 December 2016 net book value of property plant and equipment which was used as collateral
for bank loans is nil and property, plant and equipment via finance lease amounted USD 139 thousand
(2015: USD 191 thousand and plant and equipment via finance lease USD 191 thousand).
As at 31 December 2016 construction-in-progress and uninstalled equipment also included prepay-
ments for the property, plant and equipment which amounted to USD 248 thousand (2015:
USD 1 553 thousand).
As at 31 December 2016, included within property, plant and equipment were fully depreciated assets
with the original cost of USD 2 235 thousand (2015: USD 2 632 thousand, 2014: USD 2 769 thousand).
Impairment assessment
The Group reviews its property, plant and equipment each period to determine if any indication of im-
pairment exists. Based on these reviews, there were no indicators of impairment as of 31 December
2016, 2015 and 2014.
19. Other non-current assets
Other non-current assets include interest-free loans issued to third parties BV Trading LLC and BVV
Equipment LLC in amounts of USD 564 thousand and USD 394 thousand correspondingly. The contrac-
tors provided production complex for the production of egg products as a pledge for those agreements
with total pledge value of USD 960 thousand. Since January 2017 the Group concluded operating lease
agreement for stated above property, plant and equipment with monthly payment USD 2 thousand
and maturity date 31 December 2018.
20. Inventories
21. Trade and Other Receivables
As at 31
December 2016 As at 31
December 2015
Raw materials 5 656 8 099 Agricultural produce and finished goods 1 563 1 458 Package and packing materials 795 684 Work in progress 120 50 Other inventories 994 752 (Less: impairment of agricultural produce and finished goods) (5) (53)
Total 9 123 10 990
As at 31
December 2016 As at 31
December 2015 Trade receivables 11 425 9 092 VAT for reimbursement 1 028 1 431 Receivables for securities sold but not yet settled - 70 Other accounts receivable 13 37 Provision for doubtful accounts receivable (222) (275)
Total 12 244 10 355
Notes on pages 42-89 form an integral part of these consolidated financial statements

Ovostar Union N.V. Annual Report 2016 | 76
Management Report
Governance Report
Financial Statements
Other information
Notes to the Consolidated Financial Statements
(in USD thousand, unless otherwise stated)
Trade receivables from third parties are non-interest bearing and are generally on 30-90 days credit
terms. For larger customers the Group grants credit for up to 45-180 days.
Trade and other receivables net of impairment loss provisions denominated in the following curren-
cies:
22. Cash and cash equivalents
a) Cash in banks by country of bank location denominated in the following currencies:
As at 31
December 2016 As at 31
December 2015 UAH 10 789 9 079 USD 1 417 1 242 EUR 38 34
Total 12 244 10 355
Note As at 31
December 2016 As at 31
December 2015 Cash in banks a) 9 596 8 000 Cash in deposit b) 2 574 2 955 Cash on hand 8 7
Total 12 178 10 962
Currency As at 31
December 2016 As at 31
December 2015
Ukraine UAH 7 903 3 727
Ukraine USD 2 375 5 192
Ukraine EUR 733 96
Ukraine PLN - 51
Total in Ukraine 11 011 9 066
Poland USD 475 1 782
Poland EUR 340 57
Poland PLN 1 -
Total in Poland 816 1 839
Netherlands EUR 32 47
Total in Netherlands 32 47
Denmark USD 110 2
Denmark EUR - 1
Total in Denmark 110 3
United Kingdom USD 79 - United Kingdom EUR 122 -
Total in United Kingdom 201 -
Total cash in banks 12 170 10 955
Notes on pages 42-89 form an integral part of these consolidated financial statements

Ovostar Union N.V. Annual Report 2016 | 77
Management Report
Governance Report
Financial Statements
Other information
Notes to the Consolidated Financial Statements
(in USD thousand, unless otherwise stated)
b) Deposits by country of bank location
As at 31 December 2016 cash at banks earns 9.8%-11% (2015: 11%-14%) interest based on daily bank
deposit rates. Short-term deposits are made for varying periods of between one day and two months,
depending on the immediate cash requirements of the Group, and earn interest at the respective
short-term deposit rates.
As at 31 December 2016 "Cash and cash equivalents” include cash in bank in amount to USD 287 thou-
sand (2015: nil) which encumbered to secure letter of credit under the agreement with «Big Dutchman
GmbH».
23. Equity
Issued capital and capital distribution
For the year ended 31 December 2016 there were no changes in issued capital. As referred to in Note
1, the Company was incorporated on 22 March 2011.
The Company's authorized share capital amounts to EUR 225 000 and consists of 22 500 000 ordinary
shares with a nominal value off EUR 0.01 each. As at 31 December 2011, 6 000 000 ordinary shares
were issued and fully paid. In June 2011 the shares of the Company were listed on the Warsaw Stock
Exchange.
At 31 December 2016 and 2015 the shareholder interest above 5% in the Share capital of Company
was as follows:
Country Currency Interest rate, % Maturity As at 31 Decem-
ber 2016 Ukraine UAH 11% 16.01.2017 1 103 Ukraine UAH 10% 24.02.2017 1 471 Total 2 574
Country Currency Interest rate, % Maturity As at 31 Decem-
ber 2015 Ukraine UAH 14% 18.01.2016 833 Ukraine UAH 15% 12.01.2016 1 250 Ukraine UAH 11% 05.01.2016 872 Total 2 955
As at 31
December 2016 As at 31
December 2015 Prime One Capital Ltd. 70.24% 70.24% Generali Otwarty Fundusz Emerytalny 9.94% 9.94% FAIRFAX FINANCIAL Holdings Limited 5.35% 5.35% AVIVA Otwarty Fundusz Emerytalny Aviva BZ WBK 5.02% 5.02%
Notes on pages 42-89 form an integral part of these consolidated financial statements

Ovostar Union N.V. Annual Report 2016 | 78
Management Report
Governance Report
Financial Statements
Other information
Notes to the Consolidated Financial Statements
(in USD thousand, unless otherwise stated)
Foreign currency translation reserve
According to section 373, Book 2 of the Dutch Civil Code, the Company's share capital has been con-
verted at the exchange rate prevailing at the reporting date. The EUR 60 000 (equivalent to 6 000 000
shares) has been converted into USD 63 151 (31 December 2015: USD 65 448). The result arising from
exchange rate differences has been recorded in the “Foreign currency translation reserve”.
The foreign currency translation reserve is used also to record exchange differences arising from the
translation of the financial statements of foreign subsidiaries.
Share premium
As has been mentioned previously, in June 2011 the Group’s shares have been placed on WSE. As a re-
sult of the transaction, USD 33 048 thousand was raised while the IPO costs amounted to USD 2 115
thousand. In these financial statements funds raised as a result of IPO are reflected in share premium
as at 31 December 2011. For the years ended 31 December 2016 and 2015, there were no movements
in share premium.
Dividends payable of the Company
During the year ended 31 December 2016 and 2015, no dividends have been declared and paid.
24. Interest-bearing loans and other financial liabilities
Curre-
ncy
Effective interest rate, %
Maturity As at 31
December 2016
As at 31 De-cember
2015 Current interest-bearing loans and other financial liabilities Landesbank Berlin AG / AKA Ausfuhrkredit-Gesellschaft mbH loan
EUR 2.25% +
EURIBOR (6m) 30.12.2021 1 517 1 572
Landesbank Berlin AG loan EUR 1.65% +
EURIBOR (6m) 30.12.2020 2 253 1 977
Other current loans UAH - - 25 28 Short-term financial lease liabilities (a) UAH 7.0% 28.09.2017 35 57
Total current interest-bearing loans and other financial liabilities 3 830 3 634
Non-current interest-bearing loans and other financial liabilities
Landesbank Berlin AG / AKA Ausfuhrkredit-Gesellschaft mbH loan
EUR 2.25% +
EURIBOR (6m) 30.12.2021 7 966 8 372
Landesbank Berlin AG loan EUR 1.65% +
EURIBOR (6m) 30.12.2020 3 479 4 985
Long-term financial lease liabilities (a) UAH 7.0% 28.09.2017 - 41
Total non-current interest-bearing loans and other financial liabilities 11 445 13 398
Total interest-bearing loans and other financial liabilities 15 275 17 032
Notes on pages 42-89 form an integral part of these consolidated financial statements

Ovostar Union N.V. Annual Report 2016 | 79
Management Report
Governance Report
Financial Statements
Other information
Notes to the Consolidated Financial Statements
(in USD thousand, unless otherwise stated)
Covenants
The Group’s loan agreements contain a number of covenants and restrictions, which include, but are
not limited to, financial ratios and other legal matters. Covenant breaches generally permit lenders to
demand accelerated repayment of principal and interest.
As at 31 December 2016 and 2015 the Group was not in breach of any financial covenants which allow
lenders to demand immediate repayment of loans.
As at 31 December 2016 net book value of property plant and equipment which was used as collateral
for bank loans is nil and property, plant and equipment via finance lease amounted USD 139 thousand
(2015: USD 191 thousand and plant and equipment via finance lease USD 191 thousand).
(a) Finance lease liabilities
Finance lease obligations represent amounts due under agreements for lease of poultry cage equip-
ment with Ukrainian companies. Net carrying value of property, plant and equipment acquired via fi-
nance lease as at 31 December 2016 and 2015 was as follows:
As at 31 December 2016 and 2015 there were no restrictions imposed by lease arrangements, in partic-
ular those concerning dividends, additional debt or further leasing.
As at 31 December 2016 As at 31 December 2015
Minimum
lease pay-
ments
Present value of
minimum lease
payments
Minimum
lease pay-
ments
Present value of
minimum lease
payments Amounts payable under finance lease:
Within a year 36 35 62 57 From one to five years - - 43 41 Above 5 years - - - -
36 35 105 98 Less: financial expenses of future periods (1) (7) Present value of lease liabilities 35 35 98 98 Less: amount to be paid within a year (35) (57) Amount to be paid after one year - 41
As at 31
December 2016 As at 31
December 2015 Plant and equipment 139 191
Total 139 191
Notes on pages 42-89 form an integral part of these consolidated financial statements

Ovostar Union N.V. Annual Report 2016 | 80
Management Report
Governance Report
Financial Statements
Other information
Notes to the Consolidated Financial Statements
(in USD thousand, unless otherwise stated)
25. Trade and other payables
Trade and other payables denominated in the following currencies:
26. Related party disclosures
For the purposes of these consolidated financial statements, the parties are considered to be related, if
one of the parties has the ability to exercise control over the other party or influence significantly the
other party in making financial and operating decisions. Considering the transactions with each possi-
ble related party, particular attention is paid to the essence of relationships, not merely their legal
form.
Related parties may enter into transactions, which may not always be available to unrelated parties,
and they may be subject to such conditions and such amounts that are impossible in transactions with
unrelated parties.
According to the criteria mentioned above, related parties of the Group are divided into the following
categories:
(A). Key management personnel;
(B). Companies which activities are significantly influenced by the Beneficial Owners;
(C). Other related parties.
As at 31
December 2016 As at 31
December 2015 Trade payables 4 091 3 474 Employee benefit liability 221 182 Taxes payable 89 111 Liability for unused vacation 211 151 VAT liabilities 335 37 Income tax payables 22 25 Other payables 39 204
Total 5 008 4 184
As at 31
December 2016 As at 31
December 2015 UAH 4 667 2 674 EUR 325 1 468 USD 15 40 PLN 1 1 RUB - 1
Total 5 008 4 184
Notes on pages 42-89 form an integral part of these consolidated financial statements

Ovostar Union N.V. Annual Report 2016 | 81
Management Report
Governance Report
Financial Statements
Other information
Notes to the Consolidated Financial Statements
(in USD thousand, unless otherwise stated)
The following companies and individuals are considered to be the Group's related parties as at 31 De-
cember 2016, and 2015:
As at 31 December 2016, and 2015 trade accounts receivable from related parties and advances issued
to related parties were presented as follows:
Compensation of key management personnel of the Group
The amount of remuneration of key management personnel of the group foe the year ended 31 De-
cember 2016 and 2015 was presented as follows:
(C). Other related parties:
For the year ended 31 December 2016, and 2015 the Group has no other related parties.
(A). Key management personnel: Position:
Borys Bielikov Executive Director / CEO
Vitalii Veresenko Non-executive director
Marc van Campen Non-executive director
Sergii Karpenko Non-executive director
Vladimir Polishchuk Chief Financial Officer
Natalia Malyovana First Deputy CEO / Commercial director
Arnis Veinbergs Deputy CEO in charge of Production activity
Vitalii Voron Production director
Liliia Chernyak HR director
(B). Companies which activities are significantly influenced by the Key management personnel:
Agrofirma Boryspilsky Hutir LLC
Aleksa LTD LLC
As at 31
December 2016 As at 31
December 2015 Prepayments to related parties
(B). Companies which activities are significantly influenced by
the Beneficial Owners:
Aleksa LTD LLC 50 56 Total 50 56
For year 2016 For year 2015
Salaries and contribution to social security fund (short-term employee benefits):
Borys Bielikov 6 9 Vitalii Veresenko 5 6 Marc van Campen 23 17 Other key management personnel 100 117
Total 134 149
Notes on pages 42-89 form an integral part of these consolidated financial statements

Ovostar Union N.V. Annual Report 2016 | 82
Management Report
Governance Report
Financial Statements
Other information
Notes to the Consolidated Financial Statements
(in USD thousand, unless otherwise stated)
27. Commitments and contingencies
Contingent liabilities
Operating environment. In 2016, the continued political and economic turmoil in Ukraine. In 2016,
Ukraine has also continued to suffer from the separatist movements in the Lugansk and Donetsk re-
gions. (The Group does not have any assets in Crimea, Donetsk or Luhansk regions).
These events resulted in devaluation of the Ukrainian hryvnia against major foreign currencies, in-
crease in annual inflation rate 12% (2015: 43%) and other negative influences on the economic envi-
ronment of Ukraine. Unfavorable conditions on markets where Ukraine’s primary commodities where
traded also influenced further devaluation of the Ukrainian hryvnia against major foreign currencies.
Ukrainian companies and banks continued to suffer from the lack of funding from domestic and inter-
national financial markets. However, in 2016 Ukraine economy has signs of stabilization, what also re-
sulted in decrease devaluation of the national currency against major foreign currencies in comparison
with the previous year and GDP growth around 1%. In 2016 National Bank of Ukraine canceled re-
striction about decrease of the required share of foreign currency proceeds sale to 65% and permission
of dividends remittance.
From 2015, political and economic relationships between Ukraine and the Russian Federation re-
mained strained, leading to a significant reduction in trade and economic cooperation. On 1 January
2016, the free-trade section of Ukraine’s Association Agreement with the European Union came into
force. As a result, the Russian Federation implemented a trade embargo or import duties on key
Ukrainian export products. In response, Ukraine implemented similar measures against Russian prod-
ucts.
Significant external financing is required to support economic stabilization and the political situation
depends, to a large extent, upon success of the Ukrainian government’s efforts. During 2015 and 2016,
Ukraine received the first tranches of extended fund facilities agreed with the IMF. Further economic
and political developments are currently difficult to predict and an adverse effect on the Ukrainian
economy may continue.
Taxation. Ukrainian tax authorities are increasingly directing their attention to the business community
as a result of the overall Ukrainian economic environment. In respect of this, the local and national tax
environment in Ukraine is constantly changing and subject to inconsistent application, interpretation
and enforcement. Non-compliance with Ukrainian laws and regulations can lead to the imposition of
severe penalties and interest. Future tax examinations could raise issues or assessments which are con-
trary to the Group companies’ tax filings. Such assessments could include taxes, penalties and interest,
and these amounts could be material. While the Group believes it has complied with local tax legisla-
tion, there have been many new tax and foreign currency laws and related regulations introduced in
recent years which are not always clearly written.
Notes on pages 42-89 form an integral part of these consolidated financial statements

Ovostar Union N.V. Annual Report 2016 | 83
Management Report
Governance Report
Financial Statements
Other information
Notes to the Consolidated Financial Statements
(in USD thousand, unless otherwise stated)
From 1 January 2017 Tax Code of Ukraine was changed in part which regulates the privileged VAT re-
gime for agricultural companies as a result, specific VAT subsidies is canceled. However, from 1 January
2017, in order to continue state support for agricultural companies, tax legislation introduces budget
subsidies. From 2017 onwards, budget subsidies will be provided until 1 January 2022. For each agricul-
tural producer, the amount of the subsidy is not to exceed the amount of VAT tax paid by the produc-
ers, and will be distributed on a monthly basis.
The Group is currently estimating the impact of these new changes but does not expect these to result
in a significant change in the Group’s effective tax rate.
Starting from 1 September 2013, the Tax Code of Ukraine introduced new rules, based on OECD trans-
fer pricing guidelines, for determining and applying fair market prices, which significantly changed
transfer pricing regulations in Ukraine. The Group exports goods and services, which may potentially
fall under the scope of the new Ukrainian transfer pricing regulations. The Group submitted a con-
trolled transaction report within the required deadline. Management believes that the Group is in com-
pliance with transfer pricing regulation requirements.
Legal issues. As at 31 December 2016 and 2015 the Group is involved in litigations and other claims
that are in the ordinary course of its business activities. Management believes that the resolution of
such matters will not have a material impact on its financial position or operating results
Capital commitments. As at 31 December 2016 the Group had contract liabilities for acquisition of
property, plant and equipment equal is nil (2015: USD 28 thousand).
28. Financial risk management
The Group manages its capital to ensure that entities in the Group will be able to continue as a going
concern while maximizing the return to shareholders through a combination of debt and equity capital.
The management of the Group reviews the capital structure on a regular basis. Based on the results of
this review, the Group takes steps to balance its overall capital structure through the issue of new debt
or the redemption of existing debt.
The capital structure of the Group consists of debt, which includes the borrowings and cash and cash
equivalents disclosed in Notes 24 and 22 respectively, and equity attributable to the equity holders of
the parent, comprising issued capital, share premium, reserves and retained earnings.
Gearing ratio
The Group’s management reviews quarterly the capital structure of the Group. As part of this review,
the management considers the cost of capital and the risks associated with each class of capital.
Notes on pages 42-89 form an integral part of these consolidated financial statements

Ovostar Union N.V. Annual Report 2016 | 84
Management Report
Governance Report
Financial Statements
Other information
Notes to the Consolidated Financial Statements
(in USD thousand, unless otherwise stated)
* Debts include short-term and long-term borrowings
** Equity includes the share capital, share premium, retained earnings and foreign currency translation reserve
Financial risk management
The main risks inherent to the Group’s operations are those related to credit risk exposures, liquidity
risk, market movements in currency rates and interest rates and potential negative impact of livestock
diseases.
Credit risk
The Group is exposed to credit risk which is the risk that one party to a financial instrument will fail to
discharge an obligation and cause the other party to incur a financial loss.
The Group's exposure to credit risk regarding trade accounts receivable is primarily dependent on spe-
cific characteristics of each client. The Group's policy for credit risk management provides systematic
work with debtors, which includes: analysis of solvency, determination of maximum amount of risk re-
lated to one customer or a group of customers and control over timeliness of debt repayment. The ma-
jority of Group's clients are longstanding clients, there were no significant losses during 2016 and 2015
resulting from non-fulfillment of obligations by clients. Concentration of credit risk on trade accounts
receivable is characterized by the following indicators:
For the year ended 31 December 2015 USD 29 635 thousand or 38% of Group's sales revenue is related
to sales transactions, realized with 5 major customers of the Group. As at 31 December 2015
USD 5 890 thousand or 52% of trade accounts receivable relates to 5 major debtors.
The credit quality of the gross trade receivables from related and third parties was as follows:
As at 31
December 2016 As at 31
December 2015 Debt liabilities* 15 274 17 032 Cash and cash equivalents and deposits (12 178) (10 962) Net debt 3 096 6 070 Equity** 88 404 78 507
Gearing ratio 4% 8%
As at 31
December 2016 As at 31
December 2015 Fully performing 7 879 7 421 Past due but not impaired 3 393 1 474 Impaired 153 197
Total trade receivables (gross) 11 425 9 092
Notes on pages 42-89 form an integral part of these consolidated financial statements

Ovostar Union N.V. Annual Report 2016 | 85
Management Report
Governance Report
Financial Statements
Other information
Notes to the Consolidated Financial Statements
(in USD thousand, unless otherwise stated)
As at 31 December 2016 and 2015 the ageing of trade account receivables that were not impaired was
as follows:
Liquidity risk
Liquidity risk is the risk of the Group's failure to fulfill its financial obligations at the date of maturity.
The Group's approach to liquidity management is to ensure, to the extent possible, permanent availa-
bility of sufficient liquidity for the Group to fulfill its financial obligations in due time (both in normal
conditions and in non-standard situations), by avoiding unacceptable losses or the risk of damage to
the reputation of the Group.
In accordance with plans of the Group, its working capital needs are satisfied by cash flows from oper-
ating activities, as well as by use of loans if cash flows from operating activities are insufficient for liabil-
ities to be settled.
The table below represents the expected maturity of components of working capital:
As at 31
December 2016 As at 31
December 2015 0-30 days 7 065 6 575 31-90 days 3 306 1 896 91-180 days 422 400 181-360 days 253 24 more than 360 days 279 -
Total 11 325 8 895
As at 31 December 2016 Carrying
value
Contrac-
tual cash
flows
Less than
3 months
3-6
months
6-12
months
Over 1
year
Non-derivative financial liabilities: Trade and other payables 5 008 5 008 4 590 189 135 94 Current interest-bearing loans and
other financial liabilities 3 830 3 830 - 1 915 1 915 - Non-current interest-bearing loans
and other financial liabilities 11 444 11 444 - - - 11 445 Total 20 282 20 282 4 590 2 104 2 050 11 539
As at 31 December 2015 Carrying
value
Contrac-
tual cash
flows
Less than
3 months
3-6
months
6-12
months
Over 1
year
Non-derivative financial liabilities: Trade and other payables 4 184 4 184 4 184 - - - Current interest-bearing loans and
other financial liabilities 3 634 3 634 - 1 817 1 817 - Non-current interest-bearing loans
and other financial liabilities 13 398 13 398 - - - 13 398 Total 21 216 21 216 4 184 1 817 1 817 13 398
Notes on pages 42-89 form an integral part of these consolidated financial statements

Ovostar Union N.V. Annual Report 2016 | 86
Management Report
Governance Report
Financial Statements
Other information
Notes to the Consolidated Financial Statements
(in USD thousand, unless otherwise stated)
Currency risk
Currency risk – Currency risk is the risk that the value of a financial instrument will fluctuate due to
changes in foreign exchange rates. The Group undertakes certain transactions denominated in foreign
currencies. The Group does not use any derivatives to manage foreign currency risk exposure, at the
same time the management of the Group sets limits on the level of exposure by currencies.
Exposure to foreign currency risk
The carrying amounts of the Group’s foreign currency denominated monetary assets and liabilities as
of 31 December 2016 and 2015 were as follows:
This sensitivity rate represents the management’s assessment of the reasonably possible change in for-
eign exchange rates. The sensitivity analysis includes only outstanding foreign currency denominated
monetary items and adjusts their translation at the period end for expected change in foreign currency
rates.
As at 31 December 2016 PLN RUB USD EUR UAH Total
(in conversion to USD thousand) Assets
Cash and cash equivalents 1 - 3 040 1 227 7 910 12 178 Trade receivables - - 1 417 38 9 748 11 203
Liabilities Current interest-bearing loans and other
financial liabilities - - - (3 771) (59) (3 830) Non-current interest-bearing loans and
other financial liabilities - - - (11 445) - (11 445) Trade accounts payable (1) - - (305) (3 785) (4 091) Other payables - - (15) (19) (5) (39)
Net exposure to foreign currency risk - - 4 442 (14 275) 13 809 3 976
As at 31 December 2015 PLN RUB USD EUR UAH Total
(in conversion to USD thousand) Assets
Cash and cash equivalents 51 - 6 976 200 3 735 10 962 Trade receivables - - 2 194 459 6 094 8 747
Liabilities Current interest-bearing loans and other
financial liabilities - - - (3 549) (85) (3 634) Non-current interest-bearing loans and
other financial liabilities - - - (13 357) (41) (13 398) Trade accounts payable - (1) (3) (1 440) (2 030) (3 474) Other payables (1) - (36) (28) (139) (204)
Net exposure to foreign currency risk 50 (1) 9 131 (17 715) 7 534 (1 001)
Notes on pages 42-89 form an integral part of these consolidated financial statements

Ovostar Union N.V. Annual Report 2016 | 87
Management Report
Governance Report
Financial Statements
Other information
Notes to the Consolidated Financial Statements
(in USD thousand, unless otherwise stated)
Effect in USD thousand:
The effect of foreign currency sensitivity on shareholders’ equity is equal to that on profit or loss.
Interest rate risk
Interest rate risk arises from the possibility that changes in interest rates will affect the value of the fi-
nancial instruments. The major part of the Group’s borrowings bear variable interest rates which are
linked to EURIBOR. Other borrowings are presented at fixed interest rates.
The below details the Group’s sensitivity to increase or decrease of floating rate by 1%. The analysis
was applied to interest bearing liabilities (bank borrowings under facility agreements) based on the as-
sumption that the amount of liability outstanding as of the balance sheet date was outstanding for the
whole year.
The effect of interest rate sensitivity on shareholders’ equity is equal to that on profit or loss.
Livestock diseases risk
The Group’s agro-industrial business is subject to risks of outbreaks of various diseases. The Group fac-
es the risk of outbreaks of diseases, which are highly contagious and destructive to susceptible live-
stock, such as avian influenza or bird flu for its poultry operations. The diseases could result in mortali-
ty losses. Disease control measures were adopted by the Group to minimize and manage this risk. The
Group’s management is satisfied with the its current existing risk management and quality control pro-
cesses are effective and sufficient to prevent any outbreak of livestock diseases and related losses.
Increase in
currency rate against UAH
Effect on profit before tax
31 December 2016 USD 15% 666 EUR 15% (2 141) PLN 15% -
31 December 2015 USD 35% 3 196 EUR 35% (6 200) PLN 35% 18
As at 31
December 2016 As at 31
December 2015
EURIBOR EURIBOR Profit/(loss) 152/(152) 169/(169)
Notes on pages 42-89 form an integral part of these consolidated financial statements

Ovostar Union N.V. Annual Report 2016 | 88
Management Report
Governance Report
Financial Statements
Other information
Notes to the Consolidated Financial Statements
(in USD thousand, unless otherwise stated)
29. Financial instruments
Estimated fair value disclosure of financial instruments is made in accordance with the requirements of
International Financial Reporting Standard 7 “Financial Instruments: Disclosure”. Fair value is defined
as the amount at which the instrument could be exchanged in a current transaction between knowl-
edgeable willing parties in an arm’s length transaction, other than in forced or liquidation sale. As no
readily available market exists for a large part of the Group’s financial instruments, judgment is neces-
sary in arriving at fair value, based on current economic conditions and specific risks attributable to the
instrument. The estimates presented herein are not necessarily indicative of the amounts the Group
could realize in a market exchange from the sale of its full holdings of a particular instrument.
The Group uses the following hierarchy for determining the fair value of financial instruments:
Level 1 ("L1") - quoted (unadjusted) prices in active markets for identical assets or liabilities;
Level 2 ("L2") - other techniques for which all inputs that have a significant effect on the recorded
fair value are observable, either directly or indirectly; and
Level 3 ("L3") - techniques which use inputs that have a significant effect on the recorded fair val-
ue that are not based on observable market data.
The Group does not acquire, hold or issue derivative financial instruments for trading purposes.
The following table presents the classification, subsequent measurement, carrying values and fair val-
ues of the Group's financial assets and liabilities:
31 December 2016 31 December 2015 Subsequent
measurement Carrying
value
Fair
value
Carrying
value
Fair
value Financial assets:
Trade and other receivables (a) Amortized cost 12 244 12 244 10 355 10 355 Cash and cash equivalents 12 178 12 178 10 962 10 962
24 422 24 422 21 317 21 317
Financial liabilities: Current interest-bearing loans and bor-
rowings (a) Amortized cost 3 830 3 830 3 634 3 634 Non-current interest-bearing loans and
borrowings (b) Amortized cost 11 445 11 445 13 398 13 398 Trade and other payables (current) (a) Amortized cost 5 008 5 008 4 184 4 184
20 283 20 283 21 216 21 216
Notes on pages 42-89 form an integral part of these consolidated financial statements

Ovostar Union N.V. Annual Report 2016 | 89
Management Report
Governance Report
Financial Statements
Other information
Notes to the Consolidated Financial Statements
(in USD thousand, unless otherwise stated)
The following methods and assumptions were used to estimate the fair values:
The Group's short-term financial instruments, comprising trade and other receivables, current
interest-bearing loans and borrowings, trade and other payables are carried at amortized cost
which, due to their short term nature, approximates their fair value.
The fair values of other financial assets and financial liabilities (excluding those described above)
are determined in accordance with generally accepted pricing models based on discounted cash
flow analysis.
Fair value of available-for-sale financial assets is derived from quoted market prices in active mar-
kets, if available.
Fair value of unquoted available-for-sale financial assets is estimated using appropriate valuation
techniques.
30. Subsequent events
There were no significant events that occurred after the balance sheet date.
Notes on pages 42-89 form an integral part of these consolidated financial statements

Ovostar Union N.V. Annual Report 2016 | 90

Ovostar Union N.V. Annual Report 2016 | 91
Management Report
Governance Report
Financial Statements
Other information
Balance Sheet
As at 31 December 2016
(in USD thousand, unless otherwise stated)
Note As at 31
December 2016 As at 31
December 2015
Assets Non-current assets
Financial fixed assets 3 103 838 91 682 Total non-current assets 103 838 91 682
Current assets Cash and cash equivalents 5 1 079 1 888 Other accounts receivables 4 205 24
Total current assets 1 284 1 912
Total assets 105 122 93 594
Equity and liabilities Equity
Issued capital 63 65 Foreign currency translation reserve (127 993) (115 664) Legal reserve subsidiary 83 373 91 644 Share premium reserve 30 933 30 933 Retained earnings 77 364 38 139 Profit for the year 22 153 30 954
Equity attributable to owners of the parent 85 893 76 071
Non-current liabilities Non-current loans and borrowings 7 11 445 13 357
Total non-current liabilities 11 445 13 357
Current liabilities Trade and other payables 8 339 617 Advance received 1 690 - Current loans and borrowings 7 5 755 3 549
Total current liabilities 7 784 4 166
Total liabilities 19 229 17 523
Total equity and liabilities 105 122 93 594
Notes on pages 93-98 form an integral part of these company’s financial statements
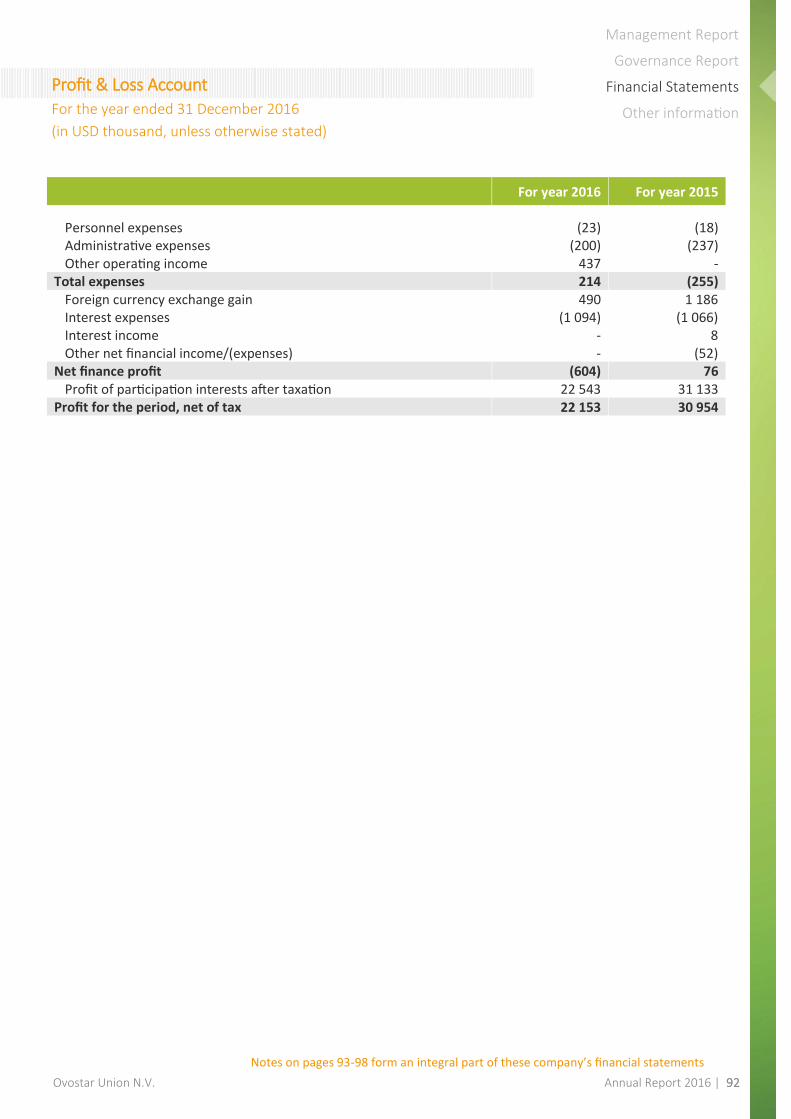
Ovostar Union N.V. Annual Report 2016 | 92
Management Report
Governance Report
Financial Statements
Other information
Profit & Loss Account
For the year ended 31 December 2016
(in USD thousand, unless otherwise stated)
For year 2016 For year 2015
Personnel expenses (23) (18) Administrative expenses (200) (237) Other operating income 437 -
Total expenses 214 (255) Foreign currency exchange gain 490 1 186 Interest expenses (1 094) (1 066) Interest income - 8 Other net financial income/(expenses) - (52)
Net finance profit (604) 76 Profit of participation interests after taxation 22 543 31 133
Profit for the period, net of tax 22 153 30 954
Notes on pages 93-98 form an integral part of these company’s financial statements

Ovostar Union N.V. Annual Report 2016 | 93
Management Report
Governance Report
Financial Statements
Other information
1. General
The Company financial statements are prepared in accordance with Title 9 of Book 2 of the Dutch Civil
Code. The Company uses the option provided in section 2:362 (8) of the Dutch Civil Code in that the
principles for the recognition and measurement of assets and liabilities and determination of result
(hereinafter referred to as “principles for recognition and measurement”) as applied in the Consolidat-
ed financial statements are also applied in the Company financial statements. Reference is made to the
notes to the Consolidated financial statements for a description of the principles for recognition and
measurement. Investments in Group companies are carried at equity value, calculated according to the
Group accounting policies.
Reporting entity
The Company financial statements of Ovostar Union N.V. (the ‘Company’) are included in the consoli-
dated financial statements of Ovostar Union Group.
Basis of preparation
The Company financial statements have been prepared in accordance with the provisions of Part 9,
Book 2, of the Dutch Civil Code. The Company uses the option of Article 362.8 of Part 9, Book 2, of the
Dutch Civil Code to prepare the Company financial statements, using the same accounting policies as in
the consolidated financial statements. Valuation is based on recognition and measurement require-
ments of accounting standards adopted by the EU (i.e. only IFRS that is adopted for use in the EU at the
date of authorization) as explained further in the notes to the consolidated financial statements.
For information on group companies of Ovostar Union N.V. please refer to Note 7 of the Consolidated
financial statements.
Going concern
As at 31 December 2016 current liabilities of the Company exceeded its current assets. In 2016,
Ovostar Union N.V. registered trade company «International Food Trade Limited». This trade company
sells the products to other countries and accumulates margin (and foreign currencies being USD) from
export sales. Loan repayment on the level of Ovostar Union N.V. will be secured by «International Food
Trade Limited» either in the form of dividends to the parent company or through an intra group loan
from subsidiary «International Food Trade Limited» and subsidiaries in Ukraine. As a consequence,
management of Ovostar Union N.V. considers that the Company will be able to continue its activities as
a going concern and will be able to repay its liabilities due to third party creditors. Therefore, Compa-
ny’s financial statements have been prepared under the going concern assumption. Based on the fore-
cast/budget 2017 the revenue from export sales is sufficient to cover the repayments due in 2017 (and
beginning of 2018). Also, group management is investigating the cost in distributing dividends to NV-
level form Ukraine.
Notes to the Company’s Financial Statements
(in USD thousand, unless otherwise stated)
Notes on pages 93-98 form an integral part of these company’s financial statements

Ovostar Union N.V. Annual Report 2016 | 94
Management Report
Governance Report
Financial Statements
Other information
2. Significant accounting policies
Financial fixed assets
Participating interests (subsidiaries, joint ventures and associates) are measured on the basis of the
equity method.
Shareholders’ equity
The translation reserve and other legal reserves were previously formed under, and are still recognized
in accordance with, the Dutch Civil Code.
Profit of participating interests
The share of profit of participating interests consists of the share of the Company in the results of these
participating interests. Results on transactions, where the transfer of assets and liabilities between the
Company and its participating interests and mutually between participating interests, themselves, are
not recognized.
3. Financial fixed assets
The financial fixed assets consist solely of participating interests in Group companies as follows:
Further investments in a group company amounting to USD 1 944 thousand consists of property, plant
and equipment transferred to the subsidiary (2015: USD 6 034 thousand).
The degree of control exercised by Ovostar Union N.V. over significant subsidiary is as follows:
4. Other accounts receivable
Notes to the Company’s Financial Statements
(in USD thousand, unless otherwise stated)
For year 2016 For year 2015
Group companies as at 01 January 91 682 92 129 Further investments in a group company 1 944 6 034 Result 22 543 31 133 FX rate difference (12 331) (37 614)
Group companies as at 31 December 103 838 91 682
Country of incorpora-
tion
% share as at
As at 31 December 2016
As at 31 December 2015
LLC Ovostar Union Ukraine 100 100 International Food Trade Limited British Virgin Islands 100 -
As at 31
December 2016 As at 31
December 2015 Ovostar LLC loan 10 10 Ovostar Union LLC loan 195 10 Other - 4
Total 205 24
Notes on pages 93-98 form an integral part of these company’s financial statements

Ovostar Union N.V. Annual Report 2016 | 95
Management Report
Governance Report
Financial Statements
Other information
5. Cash and cash equivalents
The Company’s cash balances are available upon demand.
As at 31 December 2016 “Cash and cash equivalents” include cash in bank in amount to USD 287 thou-
sand (2015: nil) which encumbered to secure letter of credit under the agreement with «Big Dutchman
GmbH».
6. Issued capital
The authorized share capital amounts to EUR 225,000 divided into 22 500 000 ordinary shares of EUR
0.01 nominal value each. During 2011, 6 000 000 shares have been issued. The issued shares are con-
verted into USD according to art 373 par 5 of the Dutch civil code using an exchange rate of 1 EUR =
1.091 USD.
For the movement schedule of issued capital, share premium, foreign currency translation reserve and
profit for the year please refer to the specification of the Consolidated statement of changes in equity
included in the Consolidated financial statements. Legal reserve subsidiary as at 31 December 2016
was in the amount of USD 83 373 thousand (in 2015: USD 91 644 thousand). The legal reserve for in-
vestments in subsidiaries (Section 2:389(6) of the Dutch Civil Code) is formed for the share in the posi-
tive results of the entities concerned and in fair value gains recognized directly in equity. Amounts are
not recognized in respect of entities whose cumulative results are not positive. The reserve is reduced
by the amount of dividend distributions, fair value losses recognized directly in equity and any distribu-
tions which Group would be able to effect without restriction.
7. Loans and borrowings
Notes to the Company’s Financial Statements
(in USD thousand, unless otherwise stated)
Note As at 31
December 2016 As at 31
December 2015 Current loans: Landesbank Berlin AG / AKA Ausfuhrkredit-Gesellschaft
mbH loan i) 1 517 1 572
Landesbank Berlin AG loan i) 2 253 1 977
International Food Trade Limited ii) 1 985 - Total current loans 5 755 3 549
Non-current loans: Landesbank Berlin AG / AKA Ausfuhrkredit-Gesellschaft
mbH loan i) 7 966 8 372
Landesbank Berlin AG loan i) 3 479 4 985
Total non-current loans 11 445 13 357
Total 17 200 16 906
Notes on pages 93-98 form an integral part of these company’s financial statements

Ovostar Union N.V. Annual Report 2016 | 96
Management Report
Governance Report
Financial Statements
Other information
As at 31 December 2016 and 2015 loan and borrowings comprised loans received from Landes-
bank Berlin AG and AKA Ausfuhrkredit-Gesellschaft mbH. Landesbank Berlin AG and AKA
Ausfuhrkredit-Gesellschaft mbH loan are guaranteed by subsidiaries. For detail information about
loans and borrowings refer to Note 24 in the Consolidated financial statements.
As at 31 December 2016 loan and borrowings comprised intra group loans received from Interna-
tional Food Trade Limited with interest rate 1.25%+EURIBOR and maturity date 14 December
2017.
8. Trade and other payables
Trade and other payables included payables from third parties and payables to supplier for property,
plant and equipment.
9. Employees
The Company has no employees other than directors.
10. Directors
The Company is managed by the Board of Directors which consists of four members: one Executive Di-
rector and three Non-Executive directors.
The Board of Directors as at 31 December 2016 comprised:
Changes in the Board of Directors of Ovostar Union N.V.
In June 2015 on the Annual General Meeting of Shareholders Board has approved (re)appointment of
the members of the Board. All members of the Board have been (re)appointed for a period of 4 years.
The Meeting approved Mr. Sergei Karpenko for the position of non-executive Board member.
Notes to the Company’s Financial Statements
(in USD thousand, unless otherwise stated)
Name Position
V. Veresenko Chairman of the Board, Non-Executive Director (non-independent)
B. Bielikov Chief Executive Officer, (non-independent)
M. van Campen Non-Executive Director
S. Karpenko Non-Executive Director
As at 31
December 2016 As at 31
December 2015
Big Dutchman 287 - Salmet 18 552 Other 34 65
Total 339 617
Notes on pages 93-98 form an integral part of these company’s financial statements

Ovostar Union N.V. Annual Report 2016 | 97
Management Report
Governance Report
Financial Statements
Other information
11. Audit fee
Fees paid to the Group’s auditor for 2016 and 2015 can be broken down into the following:
Audit fees of financial statements include the fees for professional services rendered by Baker Tilly
Berk N.V. and Baker Tilly Ukraine and relate to the audit of the Company’s Consolidated and Compa-
ny’s financial statements and its subsidiary.
Amsterdam, 12 April 2017
Notes to the Company’s Financial Statements
(in USD thousand, unless otherwise stated)
For year 2016 For year 2015
Baker Tilly Ukraine: Audit and review of financial statements 27 27
Baker Tilly Berk N.V. Audit fees 31 33
Total 58 60
[signed]
Borys Bielikov
Chief Executive Officer, Executive Director
[signed]
Marc Van Campen
Head of Audit Committee, Non-executive Director
[signed]
Vitalii Veresenko
Chairman of the Board, Non-executive Director
[signed]
Sergii Karpenko
Non-executive Director
Notes on pages 93-98 form an integral part of these company’s financial statements

Ovostar Union N.V. Annual Report 2016 | 98
Profit appropriation according to the Articles of Association
The salient points of Article 24 of the Articles of Association governing the appropriation of profit are:
Distribution of profits shall be made following the adoption of the annual accounts which show that
such distribution is allowed.
The company may only make distributions to shareholders and other persons entitled to distributable
profits to the extent that its equity exceeds the aggregate amount of the issued share capital and the
reserves which must be maintained pursuant to the law.
Proposed appropriation of result
The board of directors proposes to add the profit to the general reserves. The proposal is not reflected
in the financial statements.
Post balance sheet events
There were no significant events that occurred after the balance sheet date.
Notes on pages 93-98 form an integral part of these company’s financial statements
Management Report
Governance Report
Financial Statements
Other information Other information
Ovostar Union N.V. Annual Report 2016 | 99

Auditors ~AKER TILLYBERK
To the Shareholders and the Board of Directorsof Ovostar Union N.V.
Baker Tilly Berk N.V.Entrada 303POBox 941241090 GCAmsterdamNetherlandsT: +31(~206442840F: +31 (0)20 646 35 07E: [email protected]. : 24425560www.bakertillyberk.nl
INDEPENDENT AUDITOR'S REPORTON FINANCIAL STATEMENTS
A. Report on the Audit of the Financial Statements 2016 included in the annualreport
Our opinionWe have audited the accompanying financial statements 2016 of Ovostar Union N.V. (thecompany), based in Amsterdam. The financial statements include the consolidatedfinancial statements and the company financial statements.In our opinion:• the consolidated financial statements give a true and fair view of the financial
position of Ovostar Union N.V. as at December 31, 2016 and of its results and itscash flows in 2016 in accordance with International Financial Reporting Standards asadopted by the European Union (EU-IFRS) and with Part 9 of Book 2 of the DutchCivil Code;
• the company financial statements give a true and fair view of the financial position ofOvostar Union N.V. as at December 31, 2016 and of its results for 2016 inaccordancejwith Part 9 of Book 2 of the Dutch Civil Code.
The consolidated financial statements comprise:1. the consolidated statement of financial position as at December 31, 2016;2. the following statements for 2016:
the consolidated income statement, the consolidated statements of comprehensiveincome, changes in equity and cash flows; and
3. the notes comprising a summary of the significant accounting policies and otherexplanatory information.
The company financial statements comprise:1. the company balance sheet as at December 31, 2016;2. the company profit and loss account for 2016; and3. notes comprising a summary of the accounting policies and other explanatory
information.
An independentmemberof BakerTilly International
Baker Tilly Berk N.V. is a limited liability company andis the exclusive contracting party in respect of allcommissioned work. The company's general terms andconditions, filed with the registry of the Dutch chamberof commerce under no. 24425560, which include alimitation of liability, are applicable to all workperformed and all legal relationships with third parties.

Auditors ~AKER TILLYBERK
Basis for Our OpinionWe conducted our audit in accordance with Dutch law, including the Dutch Standards onAuditing. Our responsibilities under those standards are further described in the "Ourresponsibilities for the audit of the financial statements" section of our report.We are independent of Ovostar Union N.V. in accordance with the Verordening inzake deonafhankelijkheid van accountants bij assurance-opdrachten (ViO, Code of Ethics forProfessional Accountants, a regulation with respect to independence) and other relevantindependence regulations in the Netherlands. Furthermore we have complied with theVerordening gedrags- en beroepsregels accountants (VGBA, Dutch code of Ethics).
We believe the audit evidence we have obtained is sufficient and appropriate to providea basis for our opinion.
MaterialityMisstatements can arise from fraud or error and will be considered material if,individually or in the aggregate, they could reasonably be expected to influence theeconomic decisions of users taken on the basis of these financial statements. Themateriality affects the nature, timing and extent of our audit procedures and theevaluation of the effect of identified misstatements on our opinion.Based on our professional judgement we determined the materiality for the financialstatements as a whole at USD 1 million. The materiality is based on 1.5% of turnover.We have also taken into account misstatements and/or possible misstatements that inour opinion are material for the users of the financial statements for qualitative reasons.We agreed with the Board of Directors that misstatements in excess of USD 0.050million which are identified during the audit, would be reported to them, as well assmaller misstatements that in our view must be reported on qualitative grounds.
Scope of the Group AuditOvostar Union N.V. is at the head of a group of entities. The financial information of thisgroup is included in the consolidated financial statements of Ovostar Union N.V.Because we are ultimately responsible for the opinion, we are also responsible fordirecting, supervising and performing the group audit. In this respect we havedetermined the nature and extent of the audit procedures to be carried out for groupentities. Decisive were, the size and/or risk profile of the group entities or operations. Onthis basis, we selected group entities for which an audit or review had to be carried outon the complete set of financial statements or specific items.
The group audit mainly focused on covering group's activities in Ukraine (LLC "OvostarUnion" and its subsidiaries) and also included audit procedures at Dutch holding level(Ovostar Union N.V.)
We have performed audit procedures ourselves at Dutch holding level. When auditingLLC"Ovostar Union" and its subsidiaries, we have used the work of other auditors. Asrequired by our professional rules and standards we have issued audit instructions andreviewed the work performed by the local auditors.
An independent member of Baker Tilly International 2/6
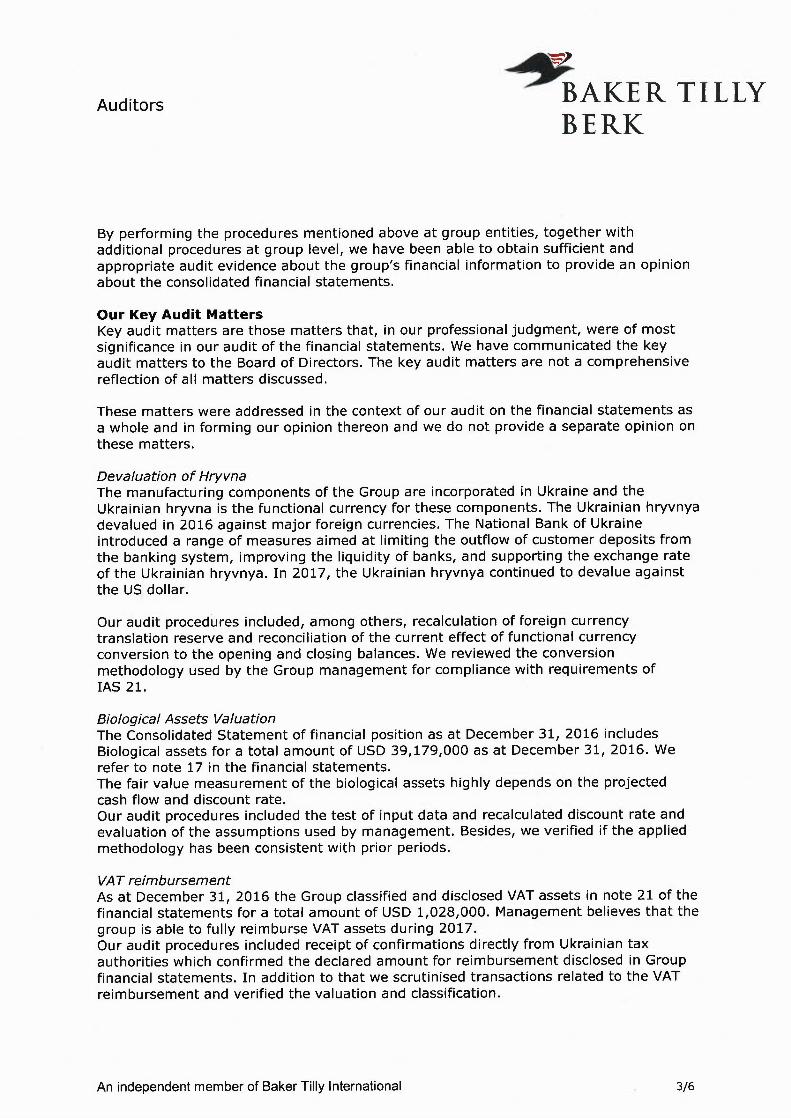
Auditors ~AKER TILLYBERK
By performing the procedures mentioned above at group entities, together withadditional procedures at group level, we have been able to obtain sufficient andappropriate audit evidence about the group's financial information to provide an opinionabout the consolidated financial statements.
Our Key Audit MattersKey audit matters are those matters that, in our professional judgment, were of mostsignificance in our audit of the financial statements. We have communicated the keyaudit matters to the Board of Directors. The key audit matters are not a comprehensivereflection of all matters discussed.
These matters were addressed in the context of our audit on the financial statements asa whole and in forming our opinion thereon and we do not provide a separate opinion onthese matters.
Devaluation of HryvnaThe manufacturing components of the Group are incorporated in Ukraine and theUkrainian hryvna is the functional currency for these components. The Ukrainian hryvnyadevalued in 2016 against major foreign currencies. The National Bank of Ukraineintroduced a range of measures aimed at limiting the outflow of customer deposits fromthe banking system, improving the liquidity of banks, and supporting the exchange rateof the Ukrainian hryvnya. In 2017, the Ukrainian hryvnya continued to devalue againstthe U~ dollar.
Our audit procedures included, among others, recalculation of foreign currencytranslation reserve and reconciliation of the current effect of functional currencyconversion to the opening and closing balances. We reviewed the conversionmethodology used by the Group management for compliance with requirements oflAS 21.
Biological Assets ValuationThe Consolidated Statement of financial position as at December 31, 2016 includesBiological assets for a total amount of USD 39,179,000 as at December 31, 2016. Werefer to note 17 in the financial statements.The fair value measurement of the biological assets highly depends on the projectedcash flow and discount rate.Our audit procedures included the test of input data and recalculated discount rate andevaluation of the assumptions used by management. Besides, we verified if the appliedmethodology has been consistent with prior periods.
VAT reimbursementAs at December 31, 2016 the Group classified and disclosed VAT assets in note 21 of thefinancial statements for a total amount of USD 1,028,000. Management believes that thegroup is able to fully reimburse VAT assets during 2017.Our audit procedures included receipt of confirmations directly from Ukrainian taxauthorities which confirmed the declared amount for reimbursement disclosed in Groupfinancial statements. In addition to that we scrutinised transactions related to the VATreimbursement and verified the valuation and classification.
An independent member of Baker Tilly International 3/6

Auditors ~AKER TILLYBERK
Emphasis of Matter regarding the political and economic crisis in UkraineWe draw your attention to Note 27 "Commitments and contingencies" to theconsolidated financial statements, which describes the current political crisis in Ukraine.The impact of the continuing economic crisis and political turmoil in Ukraine and theirfinal resolution are unpredictable and may adversely affect the Ukrainian economy andthe operations of the Group. Our opinion is not qualified in respect of this matter.
Report on the other information included in the annual reportIn addition to the financial statements and our auditor's report, the annual reportcontains other information that consists of:• Report of the Management Board• Governance Report• Other Information pursuant to Part 9 of Book 2 of the Dutch Civil Code.
Based on the following procedures performed, we conclude that the other information:• is consistent with the financial statements and does not contain material
misstatements and• contains the information as required by Part 9 of Book 2 of the Dutch Civil Code.
We have read the other information. Based on our knowledge and understandingobtained through our audit of the financial statements or otherwise, we have consideredwhether the other information contains material misstatements.By performing these procedures, we comply with the requirements of Part 9 of Book 2 ofthe Dutch Civil Code and the Dutch Standard 720. The scope of the proceduresperformed is less than the scope of those performed in our audit of the financialstatements.
Management is responsible for the preparation of other information, including the Reportof the Executive Board in accordance with Part 9 of Book 2 of the Dutch Civil Code andother information pursuant to Part 9 of Book 2 of the Dutch Civil Code.
B. Report on other legal and regulatory requirements
We were engaged by the Board of Directors as auditor of Ovostar Union N.V. onOctober 4, 2011, as of the audit for the year 2011 and have operated as statutoryauditor ever since that date.
c. Description of responsibilities regarding the financial statements
Responsibilities of Management and the Board of Directors for the FinancialStatementsManagement is responsible for the preparation and fair presentation of the financialstatements in accordance with EU-IFRS and Part 9 of Book 2 of the Dutch Civil Code, andfor the preparation of the management board report in accordance with Part 9 of Book 2of the Dutch Civil Code. Furthermore, management is responsible for such internalcontrol as management determines is necessary to enable the preparation of thefinancial statements that are free from material misstatement, whether due to fraud orerror.
An independentmemberof BakerTilly International 4/6
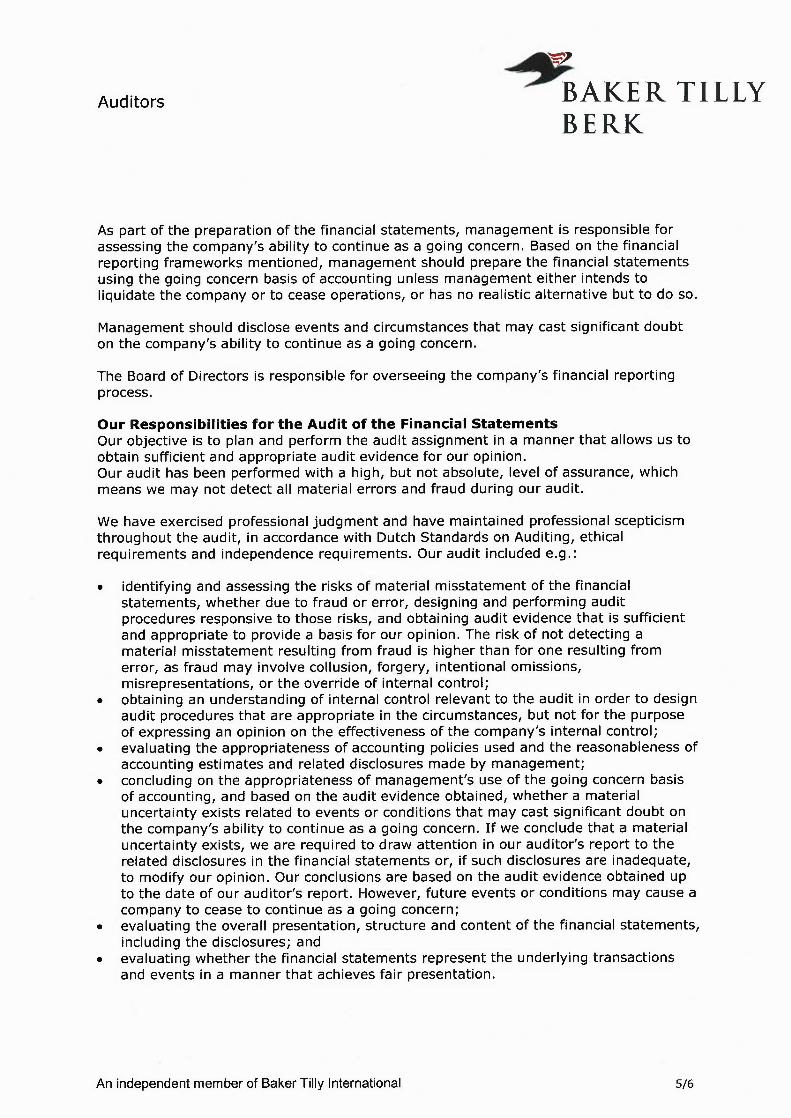
Auditors ~AKER TILLYBERK
As part of the preparation of the financial statements, management is responsible forassessing the company's ability to continue as a going concern. Based on the financialreporting frameworks mentioned, management should prepare the financial statementsusing the going concern basis of accounting unless management either intends toliquidate the company or to cease operations, or has no realistic alternative but to do so.
Management should disclose events and circumstances that may cast significant doubton the company's ability to continue as a going concern.
The Board of Directors is responsible for overseeing the company's financial reportingprocess.
Our Responsibilities for the Audit of the Financial StatementsOur objective is to plan and perform the audit assignment in a manner that allows us toobtain sufficient and appropriate audit evidence for our opinion.Our audit has been performed with a high, but not absolute, level of assurance, whichmeans we may not detect all material errors and fraud during our audit.
We have exercised professional judgment and have maintained professional scepticismthroughout the audit, in accordance with Dutch Standards on Auditing, ethicalrequirements and independence requirements. Our audit included e.g.:
• identifying and assessing the risks of material misstatement of the financialstatements, whether due to fraud or error, designing and performing auditprocedures responsive to those risks, and obtaining audit evidence that is sufficientand appropriate to provide a basis for our opinion. The risk of not detecting amaterial misstatement resulting from fraud is higher than for one resulting fromerror, as fraud may involve collusion, forgery, intentional omissions,misrepresentations, or the override of internal control;
• obtaining an understanding of internal control relevant to the audit in order to designaudit procedures that are appropriate in the circumstances, but not for the purposeof expressing an opinion on the effectiveness of the company's internal control;
• evaluating the appropriateness of accounting policies used and the reasonableness ofaccounting estimates and related disclosures made by management;
• concluding on the appropriateness of management's use of the going concern basisof accounting, and based on the audit evidence obtained, whether a materialuncertainty exists related to events or conditions that may cast significant doubt onthe company's ability to continue as a going concern. If we conclude that a materialuncertainty exists, we are required to draw attention in our auditor's report to therelated disclosures in the financial statements or, if such disclosures are inadequate,to modify our opinion. Our conclusions are based on the audit evidence obtained upto the date of our auditor's report. However, future events or conditions may cause acompany to cease to continue as a going concern;
• evaluating the overall presentation, structure and content of the financial statements,including the disclosures; and
• evaluating whether the financial statements represent the underlying transactionsand events in a manner that achieves fair presentation.
An independent member of Baker Tilly International 5/6

Auditors ~AKER TILLYBERK
We communicate with the Board of Directors regarding, among other matters, theplanned scope and timing of the audit and significant audit findings, including anysignificant findings in internal control that we identify during our audit.
We provide the Board of Directors with a statement that we have complied with relevantethical requirements regarding independence, and to communicate with them allrelationships and other matters that may reasonably be thought to bear on ourindependence, and where applicable, related safeguards.
From the matters communicated with the Board of Directors, we determine the key auditmatters: those matters that were of most significance in the audit of the financialstatements. We describe these matters in our auditor's report unless law or regulationprecludes public disclosure about the matter or when, in extremely rare circumstances,not communicating the matter is in the public interest.
Amsterdam, April 12, 2017
Baker Tilly Berk N.V.
signed by
J.H.J. Spiekker RAAudit Partner
An independent member of Baker Tilly International 6/6

Ovostar Union N.V. Annual Report 2016 | 106
Management Report
Governance Report
Financial Statements
Other information
Ovostar Union Group
Correspondence address:
34 Petropavlivska street, 04086 Kyiv, Ukraine
Legal address:
Ovostar Union N.V.
8 Jan van Goyenkade, 1075 HP Amsterdam, the Netherlands
Number in Trade Register: 52331008
For investor relations inquiries please contact:
Viktoriia Grygorenko
Investor Relations Department
Cell: +38 050 439 05 05
Landline: +38 044 354 29 60
Forward-looking statements notice
All forward-looking statements contained in this annual report with respect to our future financial and opera-
tional performance and position are, unless otherwise stated, based on the beliefs, expectations, projections
and the estimates of our management representing their judgment as at the dates on which the statements
have been made. Forward-looking statements are generally identifiable by the use of the words “may”, “will”,
“should”, “plan”, “forecast”, “expect”, “anticipate”, “estimate”, “believe”, “intend”, “project”, “goal” or “target”
or the negative of these words or other variations on these words or comparable terminology. Our actual opera-
tional and financial results or the same of our industry involve a number of known and unknown risks, uncertain-
ties and other factors and they are not guaranteed to be similar to the forward-looking statements, although our
management makes all effort to make forward-looking statements as accurate as possible. We do not undertake
publicly to update or revise any forward-looking statement that may be made herein, whether as a result of new
information, future events or otherwise.
Contact information and list of addresses