Embed Size (px)
Citation preview
Overview & Outlook for the P/C Insurance Industry:
Trends, Challenges, and Trumponomics
Robert P. Hartwig, Ph.D., CPCUClinical Associate Professor of Finance, Risk Management & Insurance
Darla Moore School of Business ♦ University of South [email protected] ♦ 803.777.6782
Risk Managers Information MeetingEnergy Insurance Mutual
Orlando, FLFebruary 26, 2018
2
P/C Insurance Industry Highlights P/C Insurers: Financially Strong Despite Record CATs Pricing and capacity trends (primary and reinsurance) CAT update
Financial Market Pressures: Rising interest ratesRising volatility
Strengthening Growth Opportunities in 2018 Drivers of Commercial Lines Growth: Price, Exposure
The Economy and “Trumponomics” as a Growth Driver
Impacts of Recent Tax Reform Legislation on Insurers and Utility Sector
Electricity: Peek Into Markets (& Insurance) at Mid-Century
3
P/C Insurance Industry Financial Overview
CATS, Non-CAT Underwriting Losses Impacted Insurer Balance Sheets
Industry Remains Strong
3
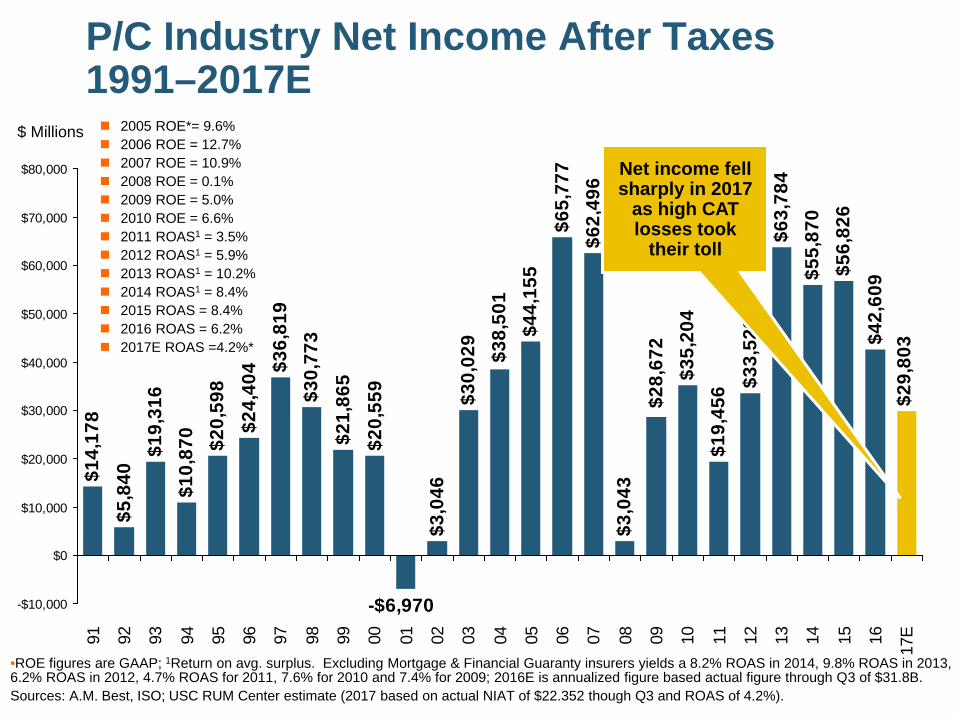
P/C Industry Net Income After Taxes1991–2017E 2005 ROE*= 9.6% 2006 ROE = 12.7% 2007 ROE = 10.9% 2008 ROE = 0.1% 2009 ROE = 5.0% 2010 ROE = 6.6% 2011 ROAS1 = 3.5% 2012 ROAS1 = 5.9% 2013 ROAS1 = 10.2% 2014 ROAS1 = 8.4% 2015 ROAS = 8.4% 2016 ROAS = 6.2% 2017E ROAS =4.2%*
•ROE figures are GAAP; 1Return on avg. surplus. Excluding Mortgage & Financial Guaranty insurers yields a 8.2% ROAS in 2014, 9.8% ROAS in 2013, 6.2% ROAS in 2012, 4.7% ROAS for 2011, 7.6% for 2010 and 7.4% for 2009; 2016E is annualized figure based actual figure through Q3 of $31.8B.Sources: A.M. Best, ISO; USC RUM Center estimate (2017 based on actual NIAT of $22.352 though Q3 and ROAS of 4.2%).
$14,
178
$5,8
40$1
9,31
6$1
0,87
0 $20,
598
$24,
404 $3
6,81
9$3
0,77
3$2
1,86
5
$3,0
46$3
0,02
9
$62,
496
$3,0
43
$35,
204
$19,
456 $3
3,52
2$6
3,78
4$5
5,87
0$5
6,82
6$4
2,60
9$2
9,80
3
$38,
501
$20,
559
$44,
155
$65,
777
-$6,970
$28,
672
-$10,000
$0
$10,000
$20,000
$30,000
$40,000
$50,000
$60,000
$70,000
$80,000
91 92 93 94 95 96 97 98 99 00 01 02 03 04 05 06 07 08 09 10 11 12 13 14 15 16 17E
Net income fell sharply in 2017
as high CAT losses took
their toll
$ Millions
-5%
0%
5%
10%
15%
20%
25%
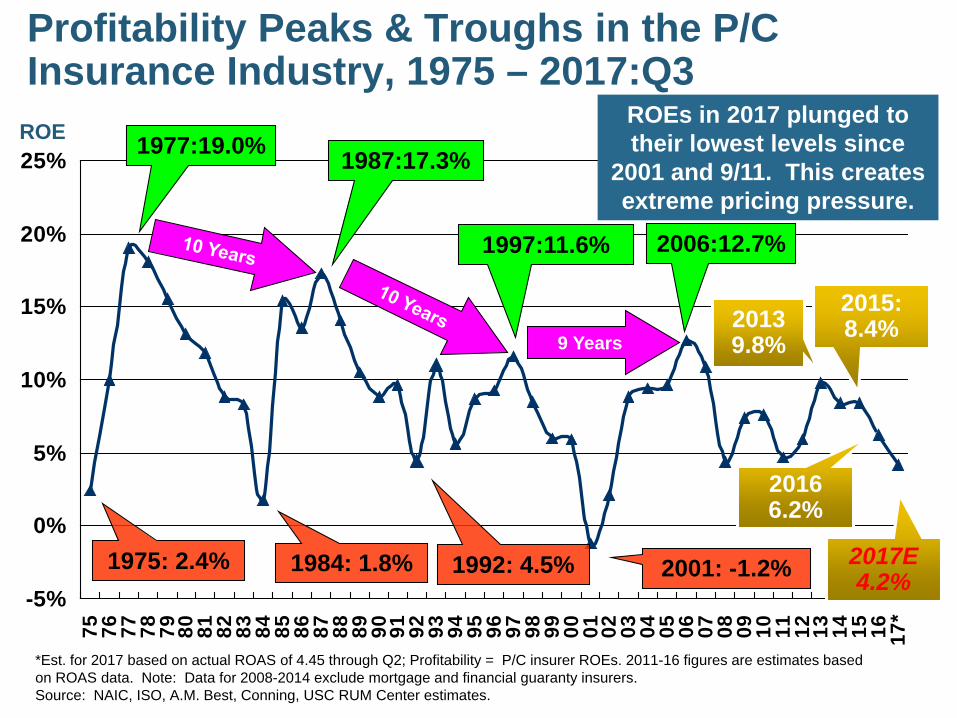
75 76 77 78 79 80 81 82 83 84 85 86 87 88 89 90 91 92 93 94 95 96 97 98 99 00 01 02 03 04 05 06 07 08 09 10 11 12 13 14 15 16 17*
Profitability Peaks & Troughs in the P/C Insurance Industry, 1975 – 2017:Q3
*Est. for 2017 based on actual ROAS of 4.45 through Q2; Profitability = P/C insurer ROEs. 2011-16 figures are estimates based on ROAS data. Note: Data for 2008-2014 exclude mortgage and financial guaranty insurers.Source: NAIC, ISO, A.M. Best, Conning, USC RUM Center estimates.
1977:19.0% 1987:17.3%
1997:11.6% 2006:12.7%
1984: 1.8% 1992: 4.5% 2001: -1.2%
9 Years
ROEs in 2017 plunged to their lowest levels since
2001 and 9/11. This creates extreme pricing pressure.
ROE
1975: 2.4%
2013 9.8%
2016 6.2%
2015: 8.4%
2017E 4.2%
6
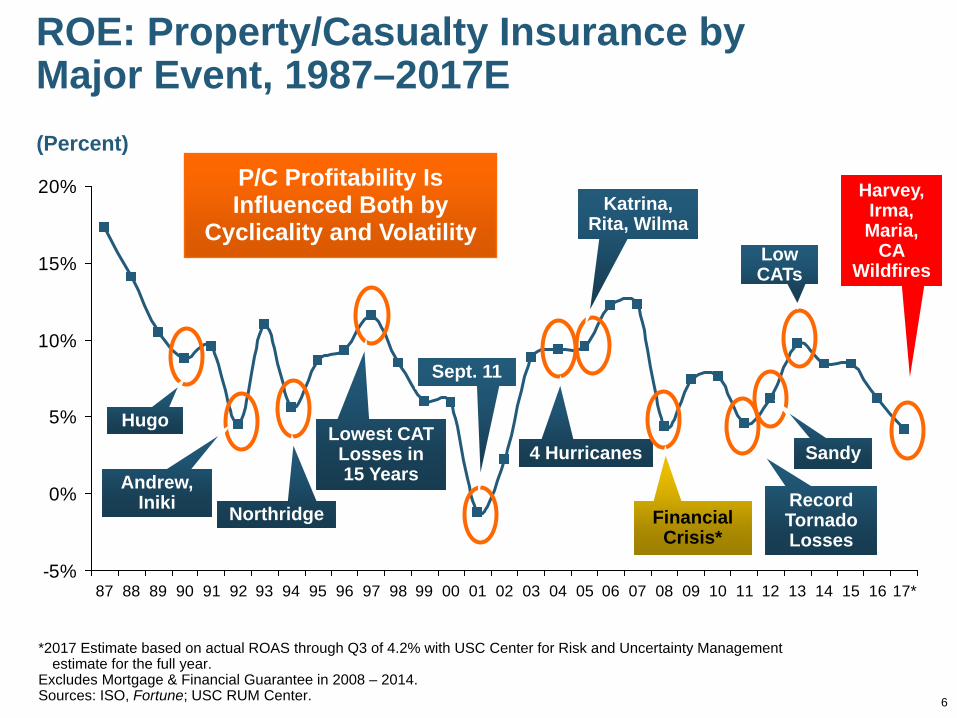
ROE: Property/Casualty Insurance by Major Event, 1987–2017E
*2017 Estimate based on actual ROAS through Q3 of 4.2% with USC Center for Risk and Uncertainty Management estimate for the full year.
Excludes Mortgage & Financial Guarantee in 2008 – 2014. Sources: ISO, Fortune; USC RUM Center.
-5%
0%
5%
10%
15%
20%
87 88 89 90 91 92 93 94 95 96 97 98 99 00 01 02 03 04 05 06 07 08 09 10 11 12 13 14 15 16 17*
P/C Profitability Is Influenced Both by
Cyclicality and Volatility
Hugo
Andrew, Iniki Northridge
Lowest CAT Losses in 15 Years
Sept. 11
Katrina, Rita, Wilma
4 Hurricanes
Financial Crisis*
(Percent)
Record Tornado Losses
Sandy
Low CATs
Harvey, Irma, Maria,
CA Wildfires
7
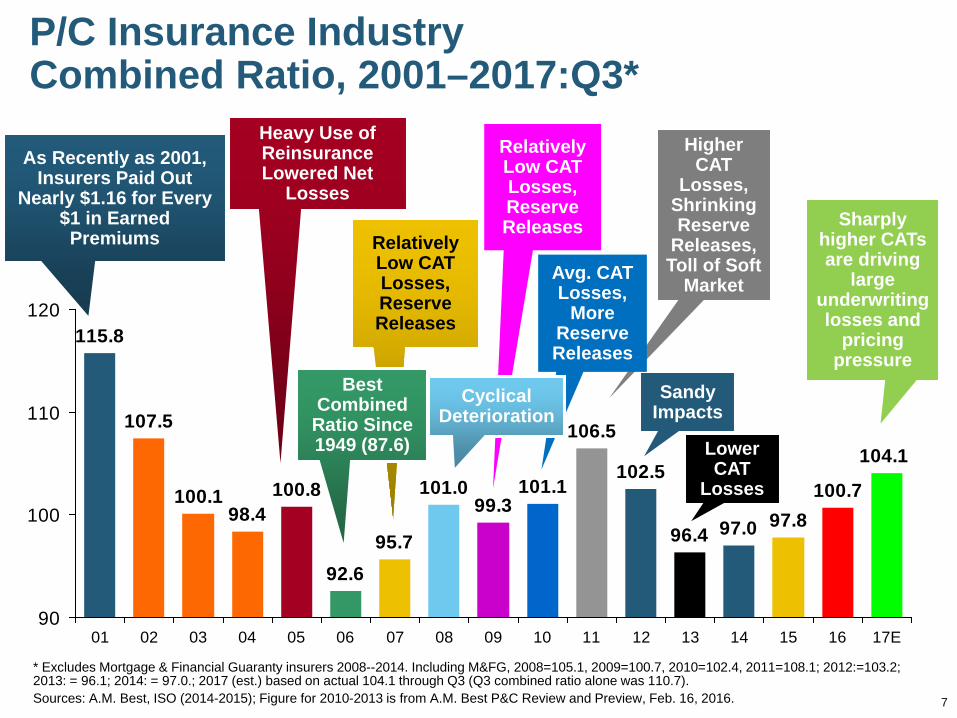
P/C Insurance Industry Combined Ratio, 2001–2017:Q3*
* Excludes Mortgage & Financial Guaranty insurers 2008--2014. Including M&FG, 2008=105.1, 2009=100.7, 2010=102.4, 2011=108.1; 2012:=103.2; 2013: = 96.1; 2014: = 97.0.; 2017 (est.) based on actual 104.1 through Q3 (Q3 combined ratio alone was 110.7). Sources: A.M. Best, ISO (2014-2015); Figure for 2010-2013 is from A.M. Best P&C Review and Preview, Feb. 16, 2016.
95.7
99.3101.1
106.5
102.5
96.4 97.0 97.8100.7
104.1101.0
92.6
100.898.4
100.1
107.5
115.8
90
100
110
120
01 02 03 04 05 06 07 08 09 10 11 12 13 14 15 16 17E
As Recently as 2001, Insurers Paid Out
Nearly $1.16 for Every $1 in Earned Premiums Relatively
Low CAT Losses, Reserve Releases
Heavy Use of Reinsurance Lowered Net
Losses
Relatively Low CAT Losses, Reserve Releases
Higher CAT
Losses, Shrinking Reserve
Releases, Toll of Soft
Market
Sandy Impacts
Lower CAT
Losses
Best Combined
Ratio Since 1949 (87.6)
Avg. CAT Losses,
More Reserve Releases
Cyclical Deterioration
Sharply higher CATs are driving
large underwriting losses and
pricing pressure
109.
411
0.2
118.
810
9.5 11
2.5
110.
210
7.6
104.
110
9.7
110.
2
102.
5 105.
491
.194
.510
4.4
100.
7 103.
8 107.
310
5.4
96.3
96.0
95.1
99.1
106.
2
102.
0
111.
1
112.
3
122.
3
90
95
100
105
110
115
120
125
90 91 92 93 94 95 96 97 98 99 00 01 02 03 04 05 06 07 08 09 10 11 12 13 14 15 16
17E
Com
mer
cial
Lin
es C
ombi
ned
Rat
io
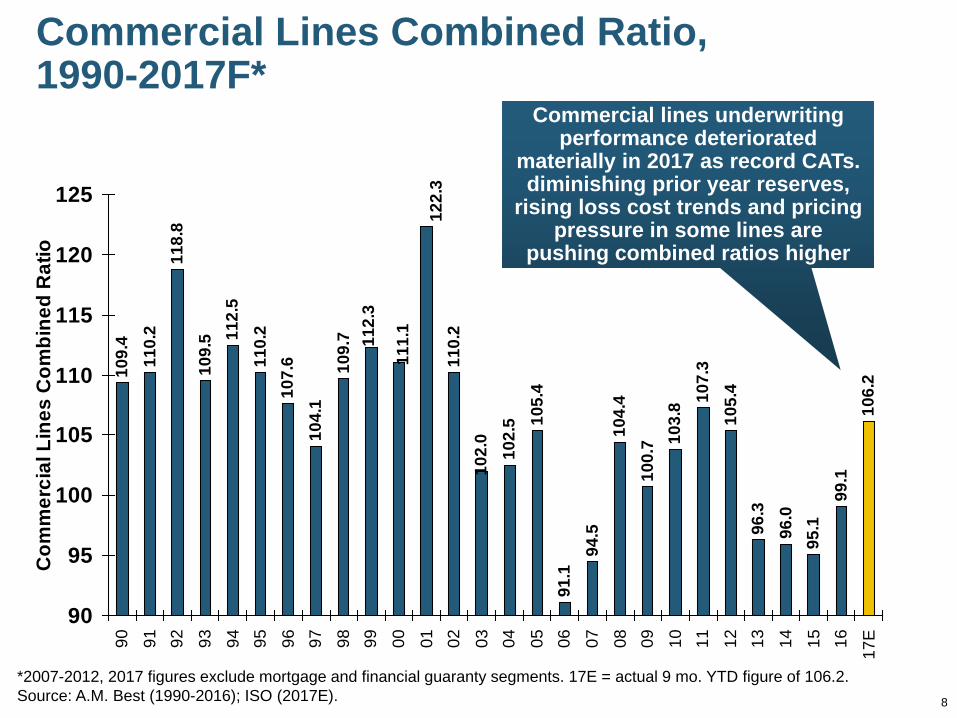
*2007-2012, 2017 figures exclude mortgage and financial guaranty segments. 17E = actual 9 mo. YTD figure of 106.2.Source: A.M. Best (1990-2016); ISO (2017E).
Commercial Lines Combined Ratio, 1990-2017F*
Commercial lines underwriting performance deteriorated
materially in 2017 as record CATs. diminishing prior year reserves,
rising loss cost trends and pricing pressure in some lines are
pushing combined ratios higher
8

9
Policyholder Surplus, 2006:Q4–2017:Q3
Sources: ISO, A.M .Best; 2018 estimate from the Center for Risk and Uncertainty Management, University of South Carolina.
($ Billions)$4
87.1
$496
.6
$512
.8
$521
.8
$478
.5
$455
.6
$437
.1 $463
.0 $490
.8 $511
.5 $540
.7
$530
.5
$544
.8
$559
.2
$559
.1
$538
.6
$550
.3
$567
.8
$583
.5
$586
.9 $607
.7
$614
.0
$624
.4 $653
.4
$671
.6
$673
.9
$675
.2
$674
.2
$673
.7
$676
.3 $700
.9
$717
.0
$719
.4
$662
.0
$570
.7
$566
.5
$505
.0
$515
.6
$517
.9
$400
$450
$500
$550
$600
$650
$700
06:Q
4
07:Q
1
07:Q
2
07:Q
3
07:Q
4
08:Q
1
08:Q
2
08:Q
3
08:Q
4
09:Q
1
09:Q
2
09:Q
3
09:Q
4
10:Q
1
10:Q
2
10:Q
3
10:Q
4
11:Q
1
11:Q
2
11:Q
3
11:Q
4
12:Q
1
12:Q
2
12:Q
3
12:Q
4
13:Q
1
13:Q
2
13:Q
3
13:Q
4
14:Q
1
14:Q
2
14:Q
3
14:Q
4
15:Q
2
15:Q
4
16:Q
1
16:Q
4
17:Q
2
17:Q
4
Financial Crisis
Surplus (Capacity) as of 9/30/17 reached a new record
of $719.4B despite record CAT losses
2010:Q1 data includes $22.5B of paid-in capital from a holding company parent for one insurer’s investment in a non-insurance business .
Drop due to near-record 2011 CAT losses
Capacity/Capital “shocks” typically do not on their own drive a sustained firming of
the pricing environment

INVESTMENTS: THE NEW REALITY
10
Investment Performance is a Key Driver of Insurer Profitability
The “Trump Bump” Has Lifted Stock Markets and Interest Rates
Will the Gains Help Insurers?10

-50%
-40%
-30%
-20%
-10%
0%
10%
20%
30%
40%
50%
60%
50 52 54 56 58 60 62 64 66 68 70 72 74 76 78 80 82 84 86 88 90 92 94 96 98 00 02 04 06 08 10 12 14 16 18*
*Through Feb. 23, 2018.Source: NYU Stern School of Business: http://pages.stern.nyu.edu/~adamodar/New_Home_Page/datafile/histretSP.html Ins. Info. Inst.
Tech Bubble Implosion
Financial Crisis
Annual Return
Energy Crisis
2016: +9.5%2017: 19.4%
2018 YTD: 2.8%
S&P 500 Index Returns, 1950 – 2018*
Fed Raises Rate
Stock markets rose sharply following the 2016 election and continued to rise throughout 2017 and into 2018
Trump Bump: Sharp surge in stock post-election
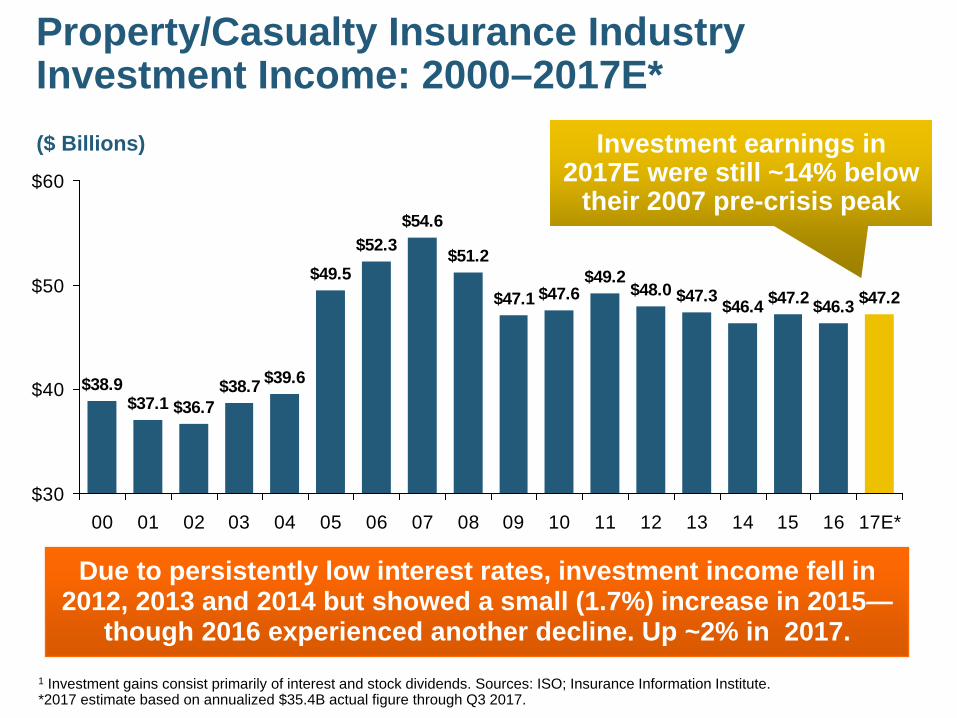
Property/Casualty Insurance Industry Investment Income: 2000–2017E*
$38.9$37.1 $36.7
$38.7
$54.6
$51.2
$47.1 $47.6$49.2
$48.0 $47.3 $46.4 $47.2 $46.3 $47.2
$39.6
$49.5$52.3
$30
$40
$50
$60
00 01 02 03 04 05 06 07 08 09 10 11 12 13 14 15 16 17E*
Due to persistently low interest rates, investment income fell in 2012, 2013 and 2014 but showed a small (1.7%) increase in 2015—
though 2016 experienced another decline. Up ~2% in 2017.1 Investment gains consist primarily of interest and stock dividends. Sources: ISO; Insurance Information Institute.*2017 estimate based on annualized $35.4B actual figure through Q3 2017.
($ Billions) Investment earnings in 2017E were still ~14% below
their 2007 pre-crisis peak
13
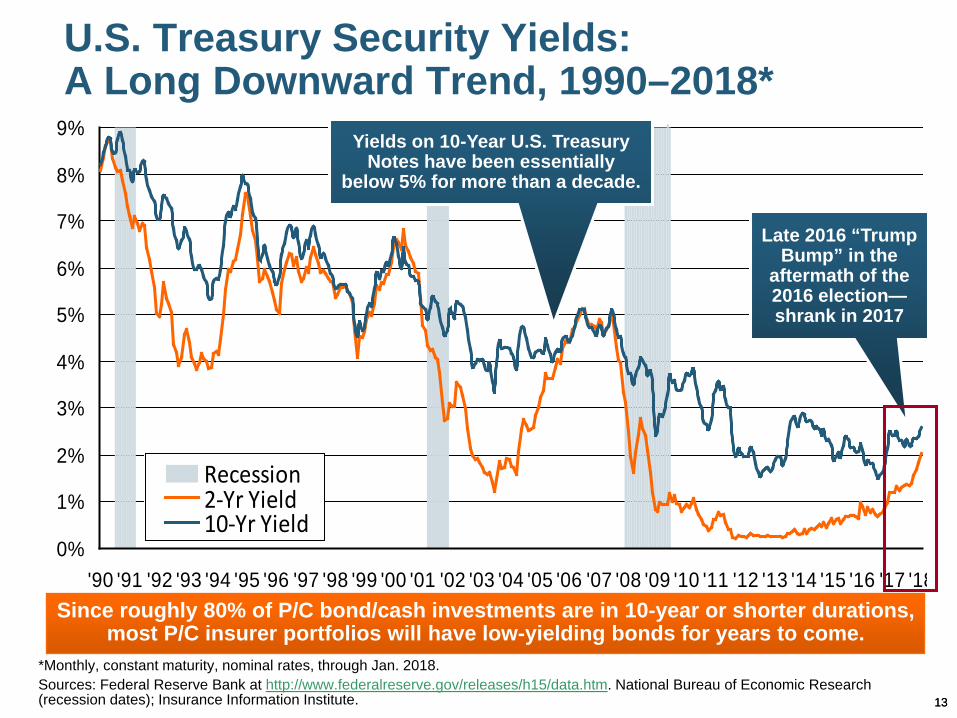
U.S. Treasury Security Yields:A Long Downward Trend, 1990–2018*
*Monthly, constant maturity, nominal rates, through Jan. 2018.Sources: Federal Reserve Bank at http://www.federalreserve.gov/releases/h15/data.htm. National Bureau of Economic Research (recession dates); Insurance Information Institute.
0%
1%
2%
3%
4%
5%
6%
7%
8%
9%
'90 '91 '92 '93 '94 '95 '96 '97 '98 '99 '00 '01 '02 '03 '04 '05 '06 '07 '08 '09 '10 '11 '12 '13 '14 '15 '16 '17 '18
Recession2-Yr Yield10-Yr Yield
Yields on 10-Year U.S. Treasury Notes have been essentially
below 5% for more than a decade.
Since roughly 80% of P/C bond/cash investments are in 10-year or shorter durations, most P/C insurer portfolios will have low-yielding bonds for years to come.
Late 2016 “Trump Bump” in the
aftermath of the 2016 election—shrank in 2017
13
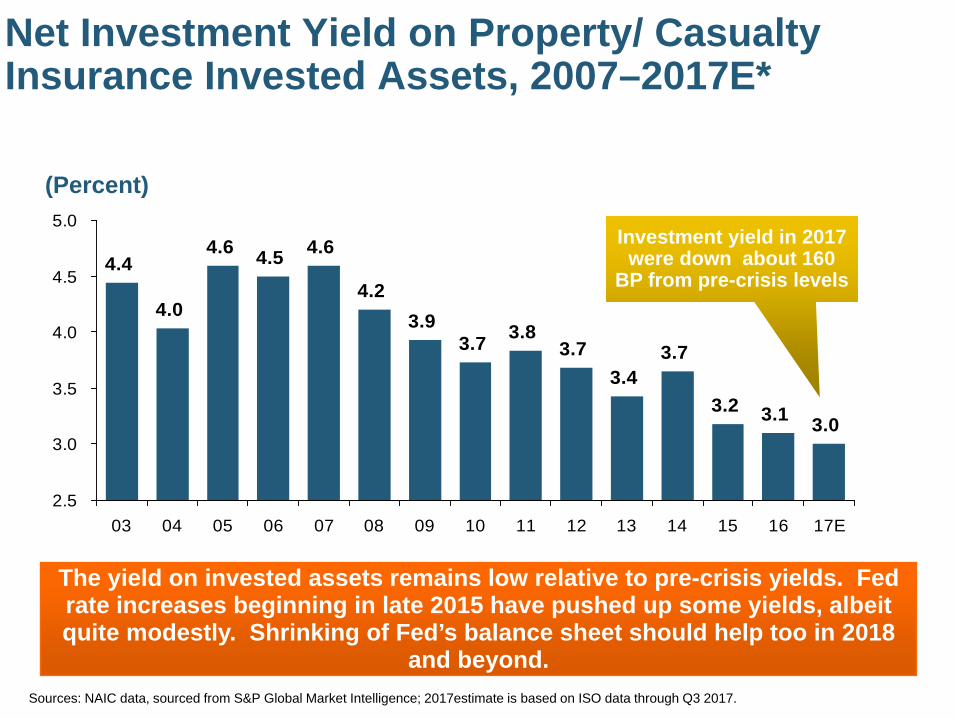
Net Investment Yield on Property/ Casualty Insurance Invested Assets, 2007–2017E*
4.4
4.0
4.6 4.5
3.7 3.83.7
3.43.7
3.2 3.1 3.0
4.6
4.23.9
2.5
3.0
3.5
4.0
4.5
5.0
03 04 05 06 07 08 09 10 11 12 13 14 15 16 17E
The yield on invested assets remains low relative to pre-crisis yields. Fed rate increases beginning in late 2015 have pushed up some yields, albeit quite modestly. Shrinking of Fed’s balance sheet should help too in 2018
and beyond.Sources: NAIC data, sourced from S&P Global Market Intelligence; 2017estimate is based on ISO data through Q3 2017.
(Percent)
Investment yield in 2017 were down about 160
BP from pre-crisis levels
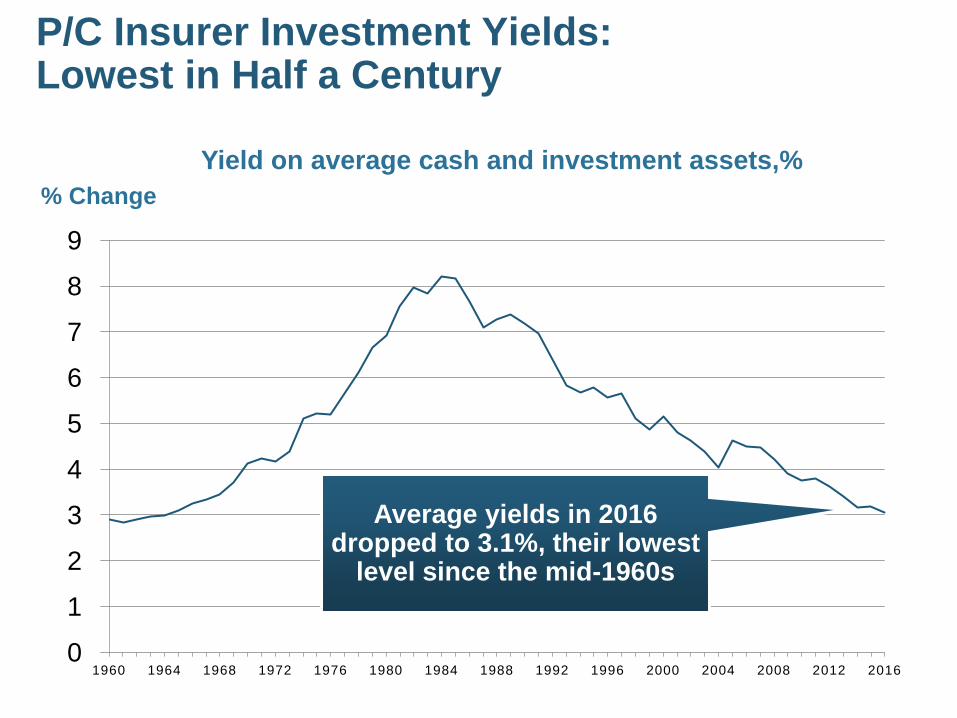
P/C Insurer Investment Yields:Lowest in Half a Century
0
1
2
3
4
5
6
7
8
9
1960 1964 1968 1972 1976 1980 1984 1988 1992 1996 2000 2004 2008 2012 2016
Yield on average cash and investment assets,%
Average yields in 2016 dropped to 3.1%, their lowest
level since the mid-1960s
% Change

16
P/C Insurance Growth Overview and Outlook
Drivers of Growth in 2018
Economic Growth Fuels Exposure & Record CAT Losses Are Pressuring Rates
Price Competition Remains Rational
16

17
-5%
0%
5%
10%
15%
20%
25%
71 72 73 74 75 76 77 78 79 80 81 82 83 84 85 86 87 88 89 90 91 92 93 94 95 96 97 98 99 00 01 02 03 04 05 06 07 08 09 10 11 12 13 14 15 1617
E18
F
Net Premium Growth (All P/C Lines): Annual Change, 1971—2018F(Percent)
1975-78 1984-87 2000-03
*Q3:2017 over Q3:2016. Shaded areas denote “hard market” periodsSources: A.M. Best (1971-2013), ISO (2014-16).
Net Written Premiums Fell 0.7% in 2007 (First Decline
Since 1943) by 2.0% in 2008, and 4.2% in 2009, the First 3-Year Decline Since 1930-33.
2018F: 4.5%2017:Q3: 4.1%
2016: 2.7%2015: 3.5%2014: 4.2
2013: 4.4%2012: +4.2%
Outlook2017E: 4.1%2018F: 4.5%
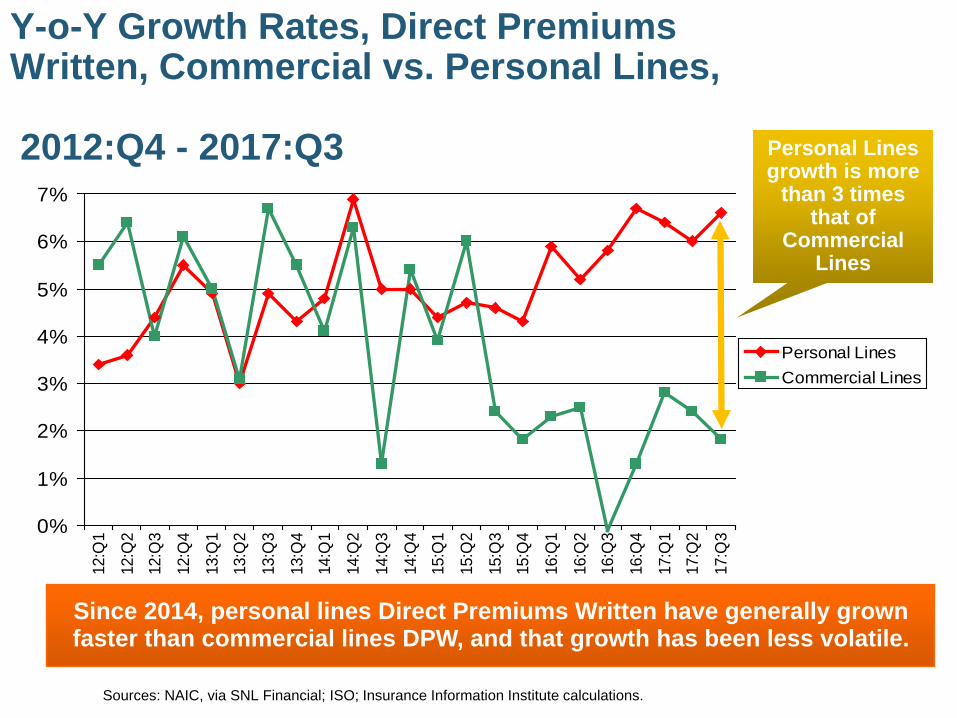
Y-o-Y Growth Rates, Direct Premiums Written, Commercial vs. Personal Lines,
2012:Q4 - 2017:Q3
0%
1%
2%
3%
4%
5%
6%
7%
12:Q
1
12:Q
2
12:Q
3
12:Q
4
13:Q
1
13:Q
2
13:Q
3
13:Q
4
14:Q
1
14:Q
2
14:Q
3
14:Q
4
15:Q
1
15:Q
2
15:Q
3
15:Q
4
16:Q
1
16:Q
2
16:Q
3
16:Q
4
17:Q
1
17:Q
2
17:Q
3
Personal LinesCommercial Lines
Sources: NAIC, via SNL Financial; ISO; Insurance Information Institute calculations.
Since 2014, personal lines Direct Premiums Written have generally grown faster than commercial lines DPW, and that growth has been less volatile.
Personal Lines growth is more
than 3 times that of
Commercial Lines
19
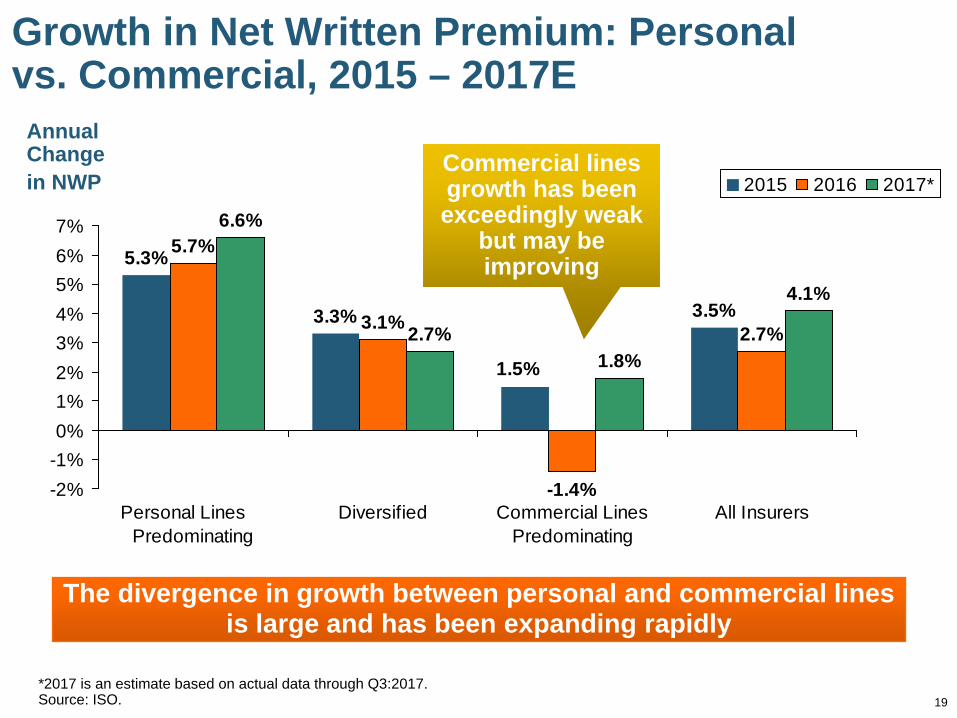
Growth in Net Written Premium: Personal vs. Commercial, 2015 – 2017E
5.7%
3.1%
-1.4%
2.7%
6.6%
2.7%1.8%
4.1%
5.3%
3.3%
1.5%
3.5%
-2%-1%0%1%2%3%4%5%6%7%
Personal Lines Predominating
Diversified Commercial LinesPredominating
All Insurers
2015 2016 2017*
Annual Change in NWP
The divergence in growth between personal and commercial lines is large and has been expanding rapidly
*2017 is an estimate based on actual data through Q3:2017.Source: ISO.
Commercial lines growth has been exceedingly weak
but may be improving
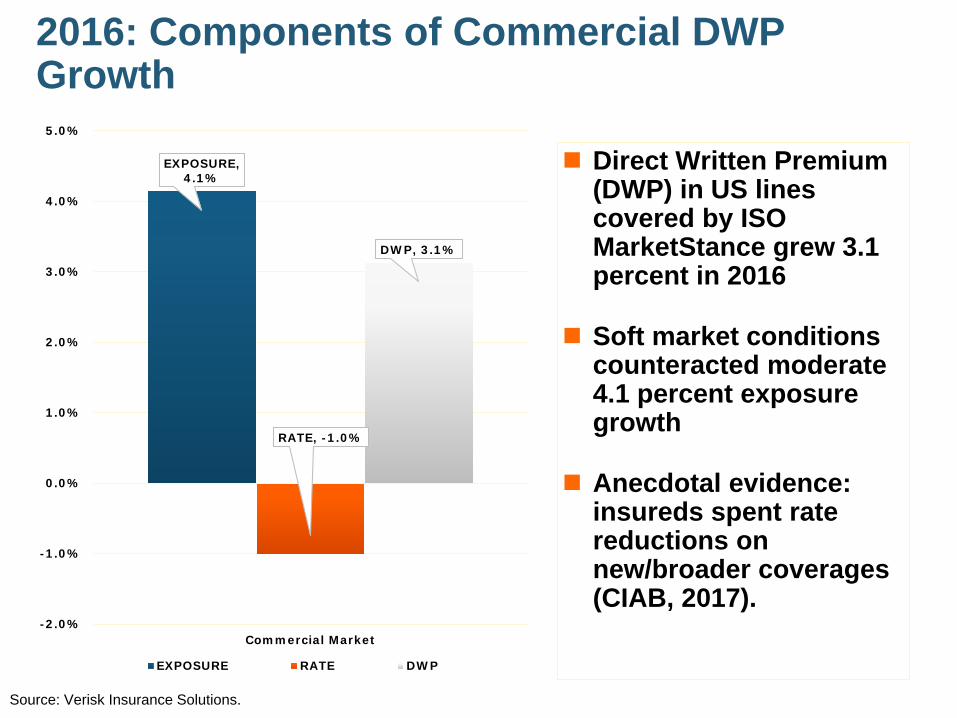
2016: Components of Commercial DWP Growth
EXPOSURE, 4.1%
RATE, -1.0%
DWP, 3.1%
-2.0%
-1.0%
0.0%
1.0%
2.0%
3.0%
4.0%
5.0%
Commercial Market
EXPOSURE RATE DWP
Direct Written Premium (DWP) in US lines covered by ISO MarketStance grew 3.1 percent in 2016
Soft market conditions counteracted moderate 4.1 percent exposure growth
Anecdotal evidence: insureds spent rate reductions on new/broader coverages (CIAB, 2017).
Source: Verisk Insurance Solutions.

21
M&A Trends
Consolidation Among P&C (Re)Insurers and Within
Distribution Channels Will Likely Continue at a Modest Pace
22
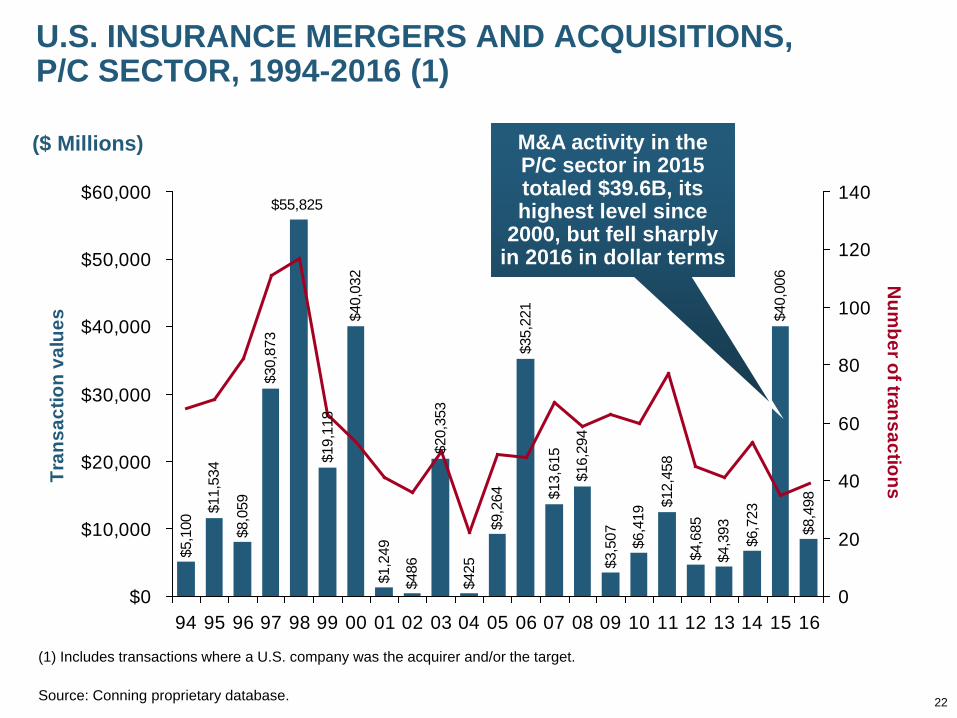
U.S. INSURANCE MERGERS AND ACQUISITIONS,P/C SECTOR, 1994-2016 (1)
$5,1
00
$11,
534
$8,0
59
$30,
873
$19,
118
$40,
032
$1,2
49
$486
$20,
353
$425
$9,2
64
$35,
221
$13,
615
$16,
294
$3,5
07 $6,4
19
$12,
458
$4,6
85
$4,3
93
$6,7
23
$40,
006
$8,4
98
$55,825
$0
$10,000
$20,000
$30,000
$40,000
$50,000
$60,000
94 95 96 97 98 99 00 01 02 03 04 05 06 07 08 09 10 11 12 13 14 15 16
Tran
sact
ion
valu
es
0
20
40
60
80
100
120
140
Num
ber of transactions
($ Millions)
(1) Includes transactions where a U.S. company was the acquirer and/or the target.
Source: Conning proprietary database.
M&A activity in the P/C sector in 2015 totaled $39.6B, its highest level since
2000, but fell sharply in 2016 in dollar terms
23
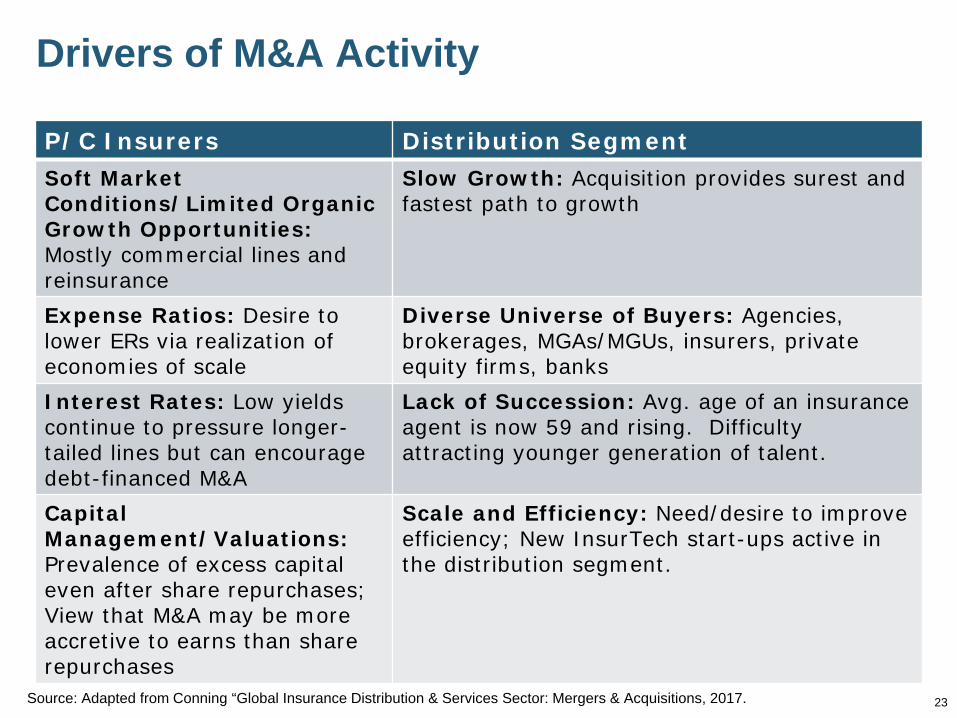
Drivers of M&A Activity
P/C Insurers Distribution SegmentSoft Market Conditions/Limited Organic Growth Opportunities:Mostly commercial lines and reinsurance
Slow Growth: Acquisition provides surest and fastest path to growth
Expense Ratios: Desire to lower ERs via realization of economies of scale
Diverse Universe of Buyers: Agencies, brokerages, MGAs/MGUs, insurers, private equity firms, banks
Interest Rates: Low yields continue to pressure longer-tailed lines but can encourage debt-financed M&A
Lack of Succession: Avg. age of an insuranceagent is now 59 and rising. Difficulty attracting younger generation of talent.
Capital Management/Valuations: Prevalence of excess capital even after share repurchases; View that M&A may be more accretive to earns than share repurchases
Scale and Efficiency: Need/desire to improve efficiency; New InsurTech start-ups active in the distribution segment.
Source: Adapted from Conning “Global Insurance Distribution & Services Sector: Mergers & Acquisitions, 2017.
24
Commercial Lines Growth, Underwriting Performance
& Pricing Cyclicality
Cyclicality in Growth, Price Are the NormRising Rates Are a Normal Part of
Adjustment Process
24
-15%
-10%
-5%
0%
5%
10%
15%
20%
25%
30%
35%
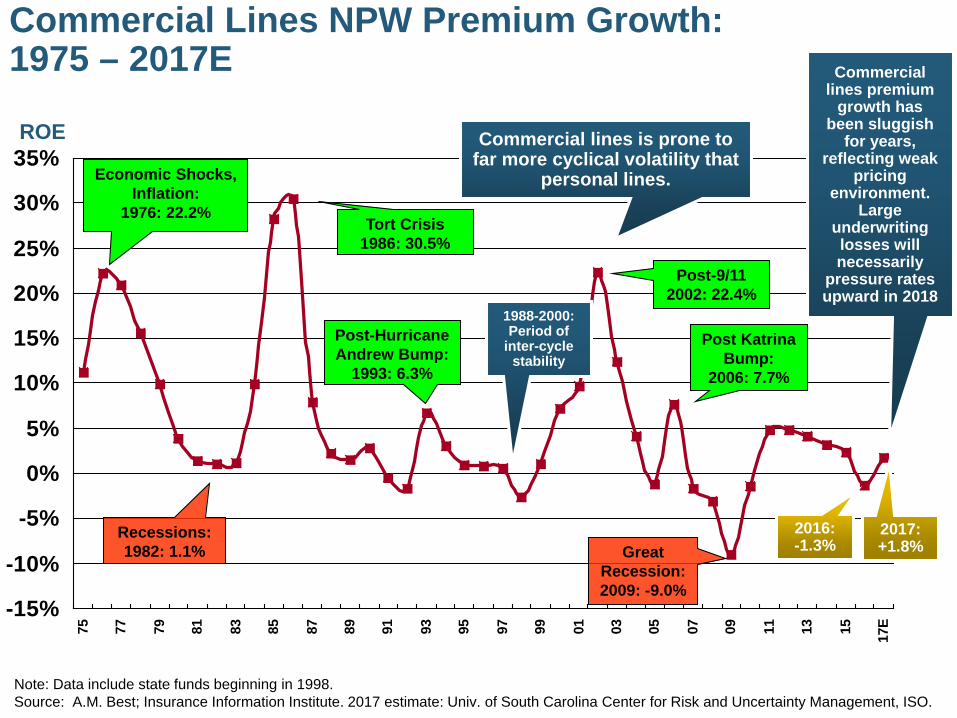
75 77 79 81 83 85 87 89 91 93 95 97 99 01 03 05 07 09 11 13 15 17E
Economic Shocks, Inflation:
1976: 22.2%Tort Crisis
1986: 30.5%
Post-9/112002: 22.4%
Great Recession:2009: -9.0%
ROE
2017: +1.8%
Commercial Lines NPW Premium Growth:1975 – 2017E
Recessions:1982: 1.1%
Commercial lines is prone to far more cyclical volatility that
personal lines.
1988-2000: Period of
inter-cycle stability
Commercial lines premium
growth has been sluggish
for years, reflecting weak
pricing environment.
Large underwriting losses will necessarily
pressure rates upward in 2018
Note: Data include state funds beginning in 1998. Source: A.M. Best; Insurance Information Institute. 2017 estimate: Univ. of South Carolina Center for Risk and Uncertainty Management, ISO.
Post-Hurricane Andrew Bump:
1993: 6.3%
Post Katrina Bump:
2006: 7.7%
2016: -1.3%
26
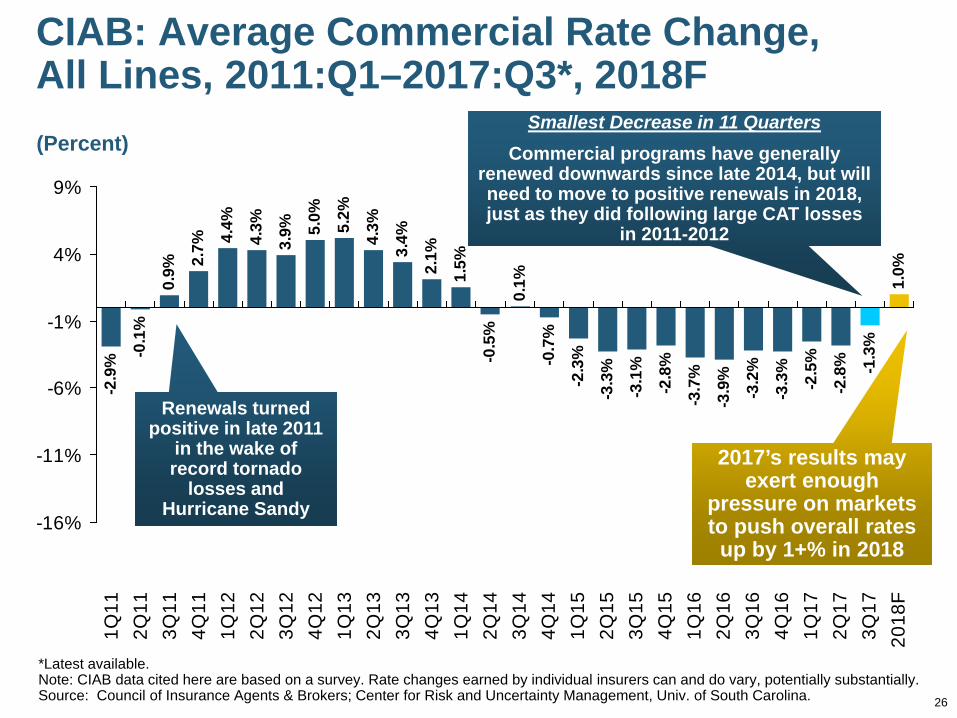
CIAB: Average Commercial Rate Change, All Lines, 2011:Q1–2017:Q3*, 2018F
-0.1
%
0.9% 2.
7% 4.4%
4.3%
3.9% 5.
0% 5.2%
4.3%
3.4%
2.1%
1.5%
-0.5
%
0.1%
-0.7
%
-2.3
%
-3.3
%
-3.1
%
-2.8
%
-3.7
%
-3.9
%
-3.2
%
-3.3
%
-2.5
%
-2.8
% -1.3
%
1.0%
-2.9
%
-16%
-11%
-6%
-1%
4%
9%
1Q11
2Q11
3Q11
4Q11
1Q12
2Q12
3Q12
4Q12
1Q13
2Q13
3Q13
4Q13
1Q14
2Q14
3Q14
4Q14
1Q15
2Q15
3Q15
4Q15
1Q16
2Q16
3Q16
4Q16
1Q17
2Q17
3Q17
2018
F
*Latest available.Note: CIAB data cited here are based on a survey. Rate changes earned by individual insurers can and do vary, potentially substantially.Source: Council of Insurance Agents & Brokers; Center for Risk and Uncertainty Management, Univ. of South Carolina.
Smallest Decrease in 11 QuartersCommercial programs have generally
renewed downwards since late 2014, but will need to move to positive renewals in 2018, just as they did following large CAT losses
in 2011-2012
(Percent)
Renewals turned positive in late 2011
in the wake of record tornado
losses and Hurricane Sandy
2017’s results may exert enough
pressure on markets to push overall rates
up by 1+% in 2018

27
Change in Commercial Rate Renewals, by Line: 2017:Q3
Source: Council of Insurance Agents and Brokers; USC Center for Risk and Uncertainty Management.
Percentage Change (%)
0.4% 0.4% 0.7% 0.9%
7.3%
-2.3%-0.8% -0.7% -0.4%
0.1% 0.1%
-4.0%
-2.0%
0.0%
2.0%
4.0%
6.0%
8.0%
Wor
kers
Com
p
Gen
eral
Liab
ility
Cyb
er
Um
brel
la
Sur
ety
Bus
ines
sIn
terru
ptio
n
Con
stru
ctio
n
D&
O
EP
L
Com
mer
cial
Pro
perty
Com
mer
cial
Aut
o
Commercial Property, Business Interruption
will need to reflect record CAT losses and
pressure from reinsurance markets
Note: CIAB data cited here are based on a survey. Rate changes earned by individual insurers can and do vary, potentially substantially.
Commercial Auto was only major line with materially positive renewals in 2017
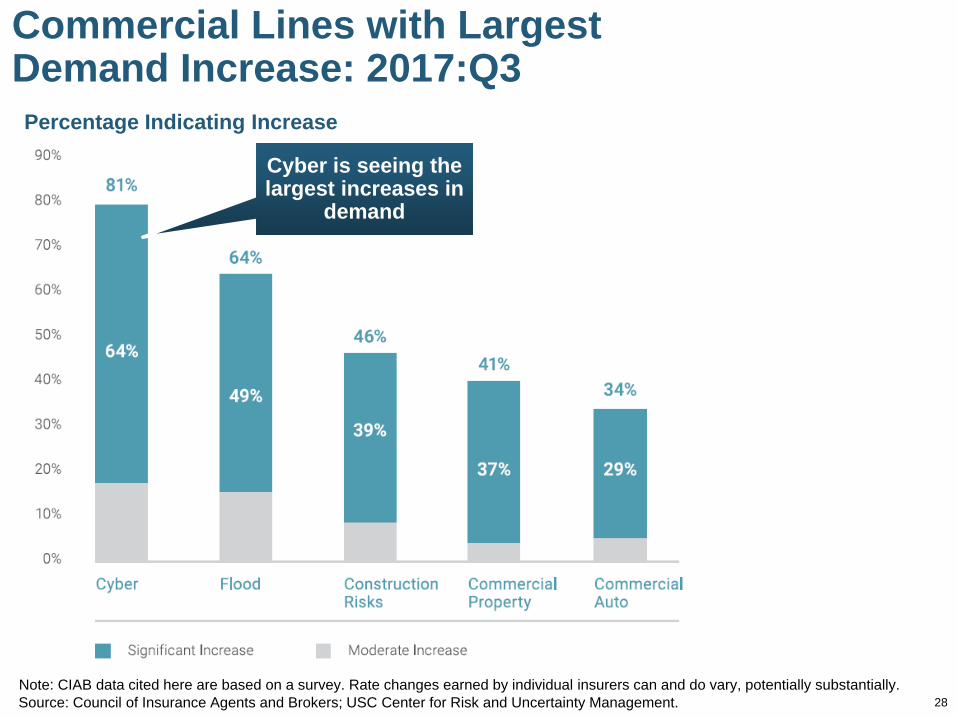
28
Commercial Lines with Largest Demand Increase: 2017:Q3
Source: Council of Insurance Agents and Brokers; USC Center for Risk and Uncertainty Management.Note: CIAB data cited here are based on a survey. Rate changes earned by individual insurers can and do vary, potentially substantially.
Percentage Indicating Increase
Peak = 2001:Q4 +28.5%
Cyber is seeing the largest increases in
demand
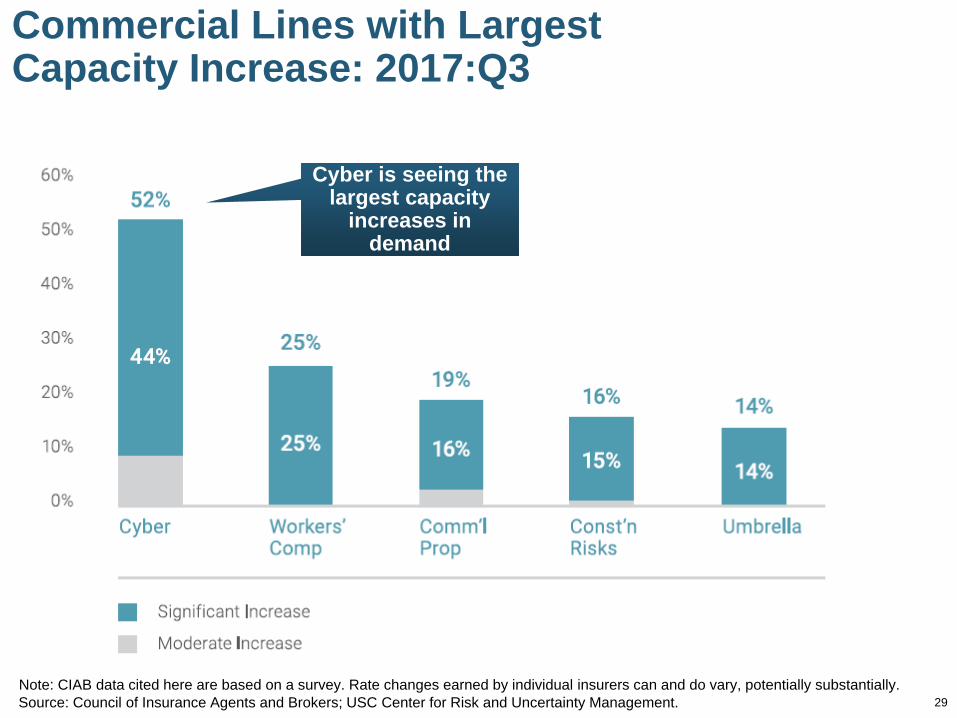
29
Commercial Lines with LargestCapacity Increase: 2017:Q3
Source: Council of Insurance Agents and Brokers; USC Center for Risk and Uncertainty Management.Note: CIAB data cited here are based on a survey. Rate changes earned by individual insurers can and do vary, potentially substantially.
Cyber is seeing the largest capacity
increases in demand
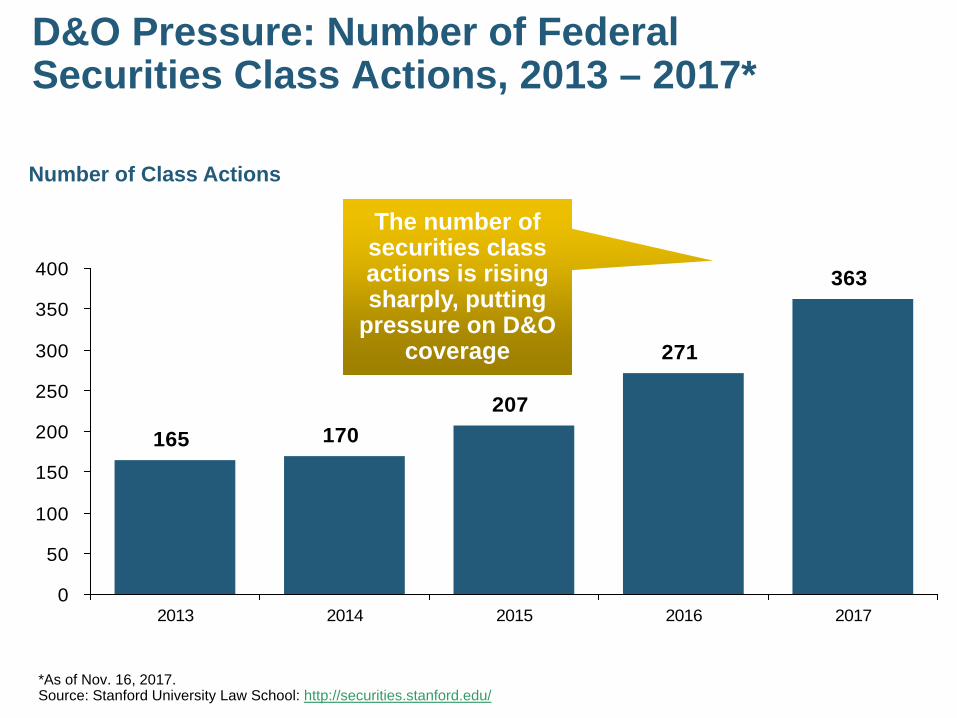
D&O Pressure: Number of Federal Securities Class Actions, 2013 – 2017*
Number of Class Actions
*As of Nov. 16, 2017.Source: Stanford University Law School: http://securities.stanford.edu/
165 170207
271
363
0
50
100
150
200
250
300
350
400
2013 2014 2015 2016 2017
The number of securities class actions is rising sharply, putting
pressure on D&O coverage

31
Workers Comp Spotlight
Underwriting Results Remain Strong
Exposure Outlook Is Outstanding as Job Growth Continues and
Wage Gains Accelerate
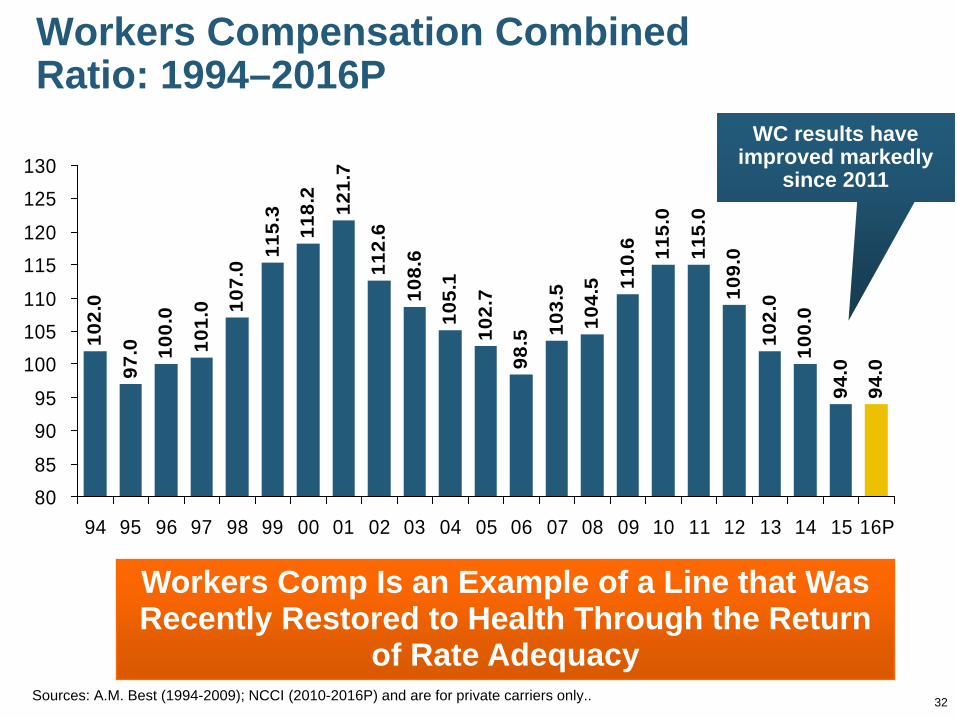
Workers Compensation Combined Ratio: 1994–2016P
102.
0
97.0 10
0.0
101.
0
112.
6
108.
6
105.
1
102.
7
98.5 10
3.5
104.
5 110.
6 115.
0
115.
0
109.
0
102.
0
100.
0
94.0
94.0
121.
7
107.
0
115.
3
118.
2
8085
9095
100105110
115120
125130
94 95 96 97 98 99 00 01 02 03 04 05 06 07 08 09 10 11 12 13 14 15 16P
Workers Comp Is an Example of a Line that Was Recently Restored to Health Through the Return
of Rate AdequacySources: A.M. Best (1994-2009); NCCI (2010-2016P) and are for private carriers only.. 32
WC results have improved markedly
since 2011
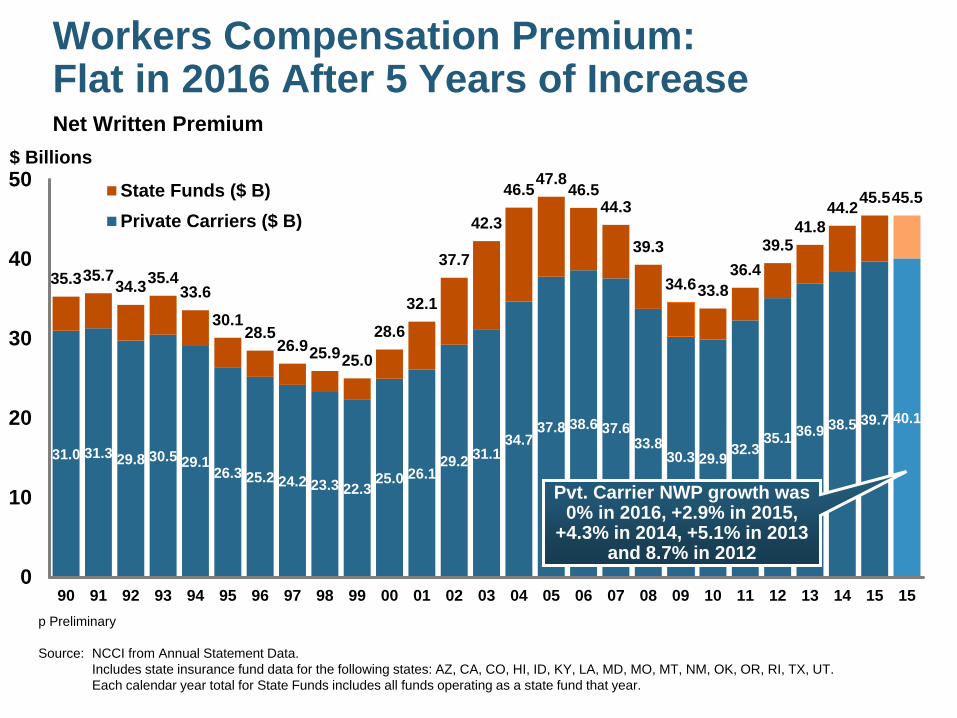
Workers Compensation Premium: Flat in 2016 After 5 Years of IncreaseNet Written Premium
31.0 31.3 29.8 30.5 29.126.3 25.2 24.2 23.3 22.3
25.0 26.129.2 31.1
34.737.8 38.6 37.6
33.830.3 29.9 32.3
35.1 36.9 38.5 39.7 40.1
35.335.734.335.4
33.6
30.128.5
26.925.925.0
28.6
32.1
37.7
42.3
46.547.846.544.3
39.3
34.633.836.4
39.541.8
44.245.545.5
0
10
20
30
40
50
90 91 92 93 94 95 96 97 98 99 00 01 02 03 04 05 06 07 08 09 10 11 12 13 14 15 15
State Funds ($ B)Private Carriers ($ B)
Pvt. Carrier NWP growth was 0% in 2016, +2.9% in 2015,
+4.3% in 2014, +5.1% in 2013 and 8.7% in 2012
$ Billions
Calendar Yearp Preliminary
Source: NCCI from Annual Statement Data.Includes state insurance fund data for the following states: AZ, CA, CO, HI, ID, KY, LA, MD, MO, MT, NM, OK, OR, RI, TX, UT.Each calendar year total for State Funds includes all funds operating as a state fund that year.

THE ECONOMY
34
The Strength of the Economy Will Greatly Influence Growth in Insurers’ Exposure
Base Across Most Lines
How Is “Trumponomics” Impactingthe Industry?
34
Awakening America’s“Animal Spirits”
3535
Economic Policy and the Insurance Industry
Consumer and Business Confidence Are Key

36
Animal Spirits: Unleashed from the Oval Office?
Source: https://twitter.com/realDonaldTrump

37
Animal Spirits: Unleashed from the Oval Office?
Source: https://twitter.com/realDonaldTrump
38
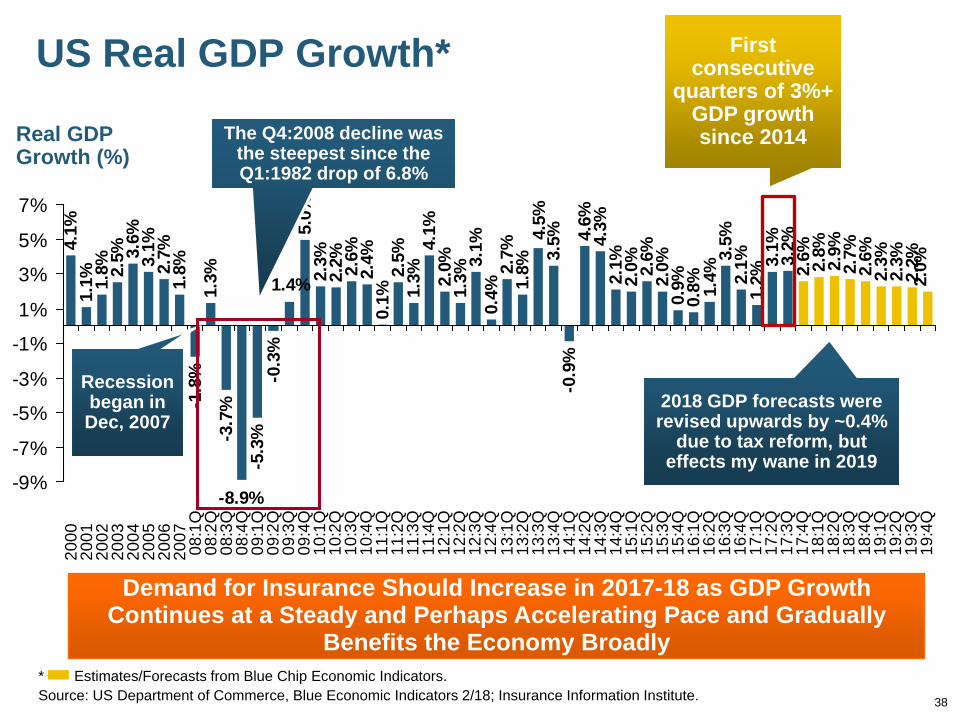
US Real GDP Growth*
* Estimates/Forecasts from Blue Chip Economic Indicators.Source: US Department of Commerce, Blue Economic Indicators 2/18; Insurance Information Institute.
2.7%
1.8%
-1.8
%1.
3%-3
.7%
-5.3
%-0
.3%
5.0%
2.3%
2.2% 2.6%
2.4%
0.1%
2.5%
1.3%
4.1%
2.0%
1.3%
3.1%
0.4%
2.7%
1.8%
3.5%
-0.9
%4.
6%4.
3%2.
1%2.
0% 2.6%
2.0%
0.9%
0.8% 1.
4%3.
5%2.
1%1.
2%3.
1%3.
2%2.
6% 2.8%
2.9%
2.7%
2.6%
2.3%
2.3%
2.2%
2.0%
-8.9%
4.5%
1.4%
4.1%
1.1% 1.
8% 2.5% 3.
6%3.
1%
-9%
-7%
-5%
-3%
-1%
1%
3%
5%
7%
20
00
20
01
20
02
20
03
20
04
20
05
20
06
20
07
08:1
Q08
:2Q
08:3
Q08
:4Q
09:1
Q09
:2Q
09:3
Q09
:4Q
10:1
Q10
:2Q
10:3
Q10
:4Q
11:1
Q11
:2Q
11:3
Q11
:4Q
12:1
Q12
:2Q
12:3
Q12
:4Q
13:1
Q13
:2Q
13:3
Q13
:4Q
14:1
Q14
:2Q
14:3
Q14
:4Q
15:1
Q15
:2Q
15:3
Q15
:4Q
16:1
Q16
:2Q
16:3
Q16
:4Q
17:1
Q17
:2Q
17:3
Q17
:4Q
18:1
Q18
:2Q
18:3
Q18
:4Q
19:1
Q19
:2Q
19:3
Q19
:4Q
Demand for Insurance Should Increase in 2017-18 as GDP Growth Continues at a Steady and Perhaps Accelerating Pace and Gradually
Benefits the Economy Broadly
Real GDP Growth (%)
Recession began in Dec, 2007
The Q4:2008 decline was the steepest since the Q1:1982 drop of 6.8%
2018 GDP forecasts were revised upwards by ~0.4%
due to tax reform, but effects my wane in 2019
First consecutive
quarters of 3%+ GDP growth since 2014

The Economy Drives P/C InsuranceIndustry Premiums: 2006:Q1 – 2017:Q2Direct Premium Growth (All P/C Lines) vs. Nominal GDP: Quarterly Y-o-Y Pct. Change
Sources: SNL Financial; U.S. Commerce Dept., Bureau of Economic Analysis; I.I.I.
-6%
-3%
0%
3%
6%
9%
12%
2006:Q1
2006:Q3
2007:Q1
2007:Q3
2008:Q1
2008:Q3
2009:Q1
2009:Q3
2010:Q1
2010:Q3
2011:Q1
2011:Q3
2012:Q1
2012:Q3
2013:Q1
2013:Q3
2014:Q1
2014:Q3
2015:Q1
2015:Q3
2016:Q1
2016:Q3
2017:Q1
DWP y-o-y change y-o-y nominal GDP growth
Direct Written Premiums track Nominal GDP—not quarter by quarter but overall fairly well.
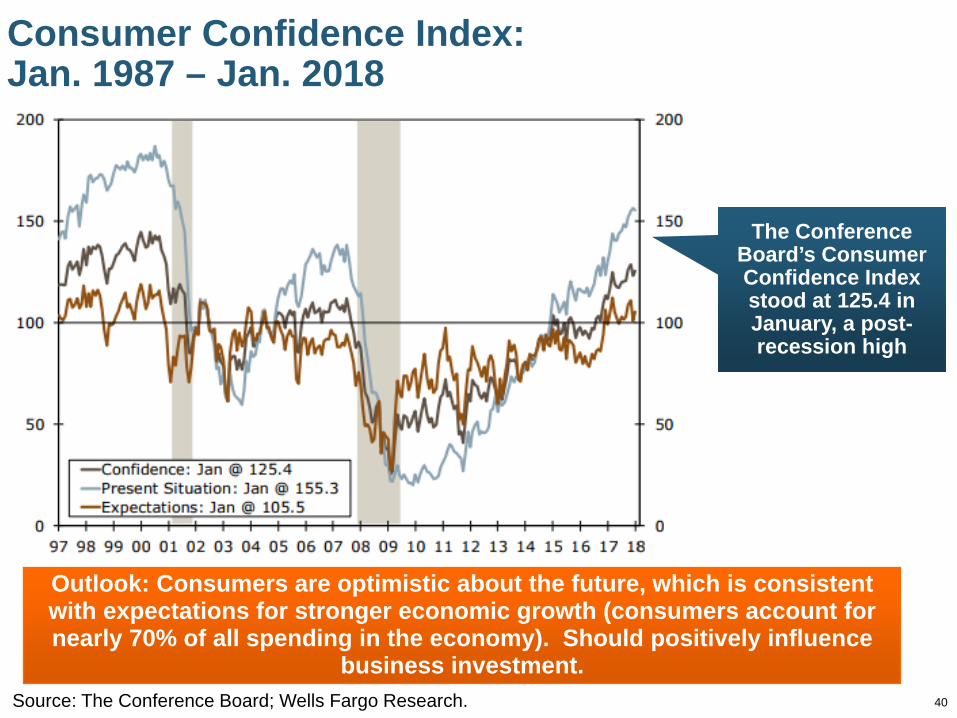
40
Consumer Confidence Index:Jan. 1987 – Jan. 2018
Source: The Conference Board; Wells Fargo Research.
Outlook: Consumers are optimistic about the future, which is consistent with expectations for stronger economic growth (consumers account for nearly 70% of all spending in the economy). Should positively influence
business investment.
The Conference Board’s Consumer Confidence Index stood at 125.4 in January, a post-recession high
41
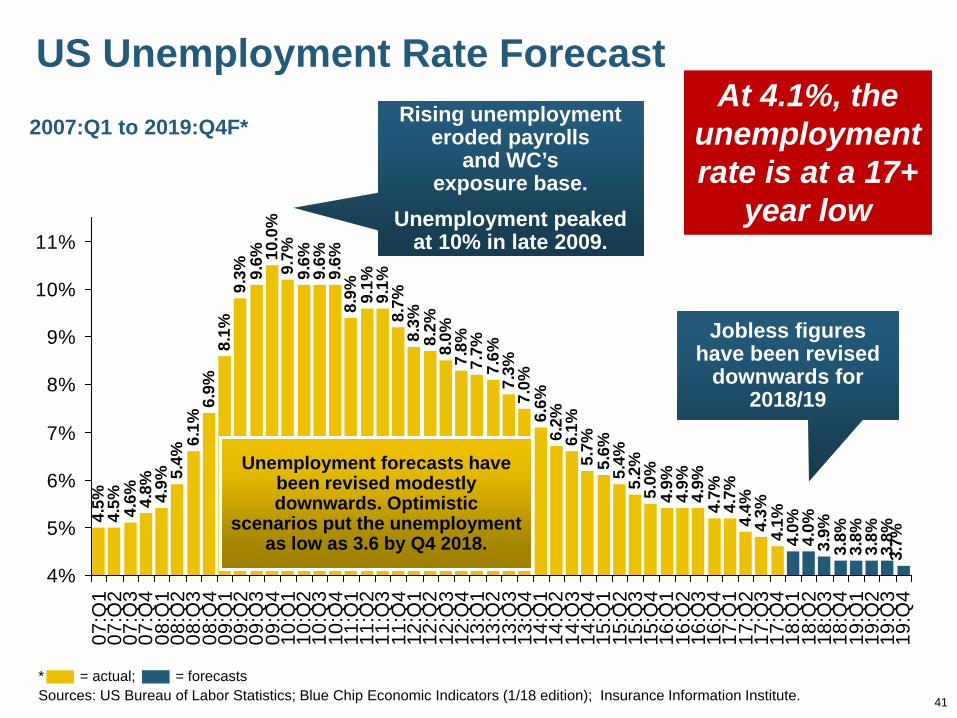
US Unemployment Rate Forecast4.
5%4.
5% 4.6% 4.
8% 4.9% 5.
4%6.
1%6.
9%8.
1%9.
3% 9.6% 10
.0%
9.7%
9.6%
9.6%
8.9% 9.
1%9.
1%8.
7%8.
3%8.
2%8.
0%7.
8%7.
7%7.
6%7.
3%7.
0%6.
6%6.
2%6.
1%5.
7%5.
6%5.
4%5.
2%5.
0%4.
9%4.
9%4.
9%4.
7%4.
7%4.
4%4.
3%4.
1%4.
0%4.
0%3.
9%3.
8%3.
8%3.
8%3.
8%3.
7%
9.6%
4%
5%
6%
7%
8%
9%
10%
11%
07:Q
107
:Q2
07:Q
307
:Q4
08:Q
108
:Q2
08:Q
308
:Q4
09:Q
109
:Q2
09:Q
309
:Q4
10:Q
110
:Q2
10:Q
310
:Q4
11:Q
111
:Q2
11:Q
311
:Q4
12:Q
112
:Q2
12:Q
312
:Q4
13:Q
113
:Q2
13:Q
313
:Q4
14:Q
114
:Q2
14:Q
314
:Q4
15:Q
115
:Q2
15:Q
315
:Q4
16:Q
116
:Q2
16:Q
316
:Q4
17:Q
117
:Q2
17:Q
317
:Q4
18:Q
118
:Q2
18:Q
318
:Q4
19:Q
119
:Q2
19:Q
319
:Q4
Rising unemployment eroded payrolls
and WC’s exposure base.
Unemployment peaked at 10% in late 2009.
* = actual; = forecastsSources: US Bureau of Labor Statistics; Blue Chip Economic Indicators (1/18 edition); Insurance Information Institute.
2007:Q1 to 2019:Q4F*
Unemployment forecasts have been revised modestly downwards. Optimistic
scenarios put the unemployment as low as 3.6 by Q4 2018.
Jobless figures have been revised
downwards for 2018/19
At 4.1%, the unemployment rate is at a 17+
year low
42
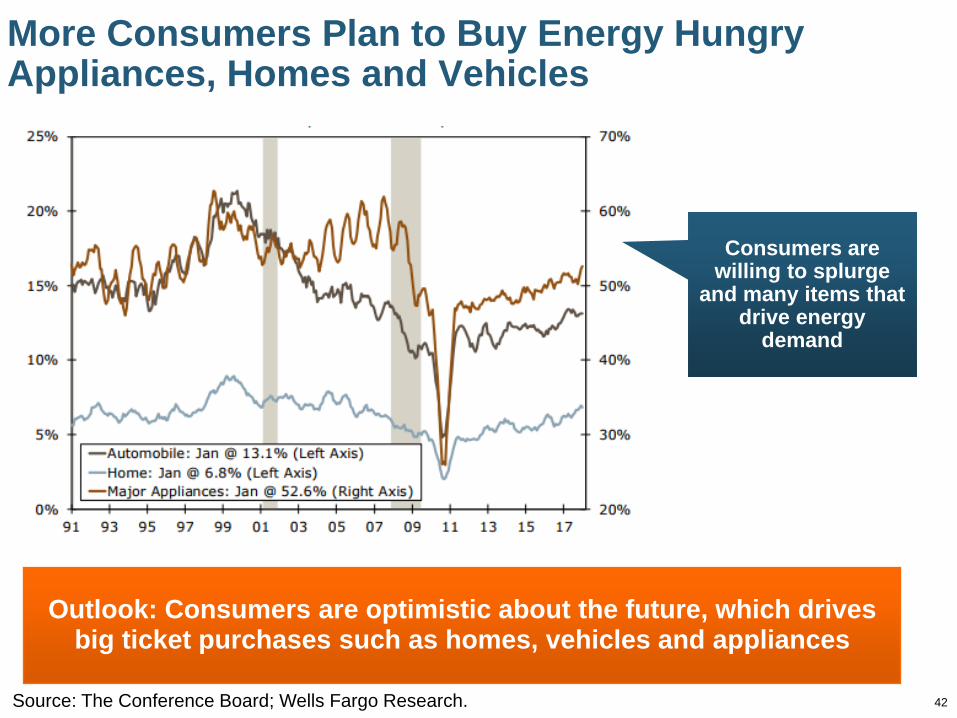
More Consumers Plan to Buy Energy Hungry Appliances, Homes and Vehicles
Source: The Conference Board; Wells Fargo Research.
Outlook: Consumers are optimistic about the future, which drives big ticket purchases such as homes, vehicles and appliances
Consumers are willing to splurge
and many items that drive energy
demand
43
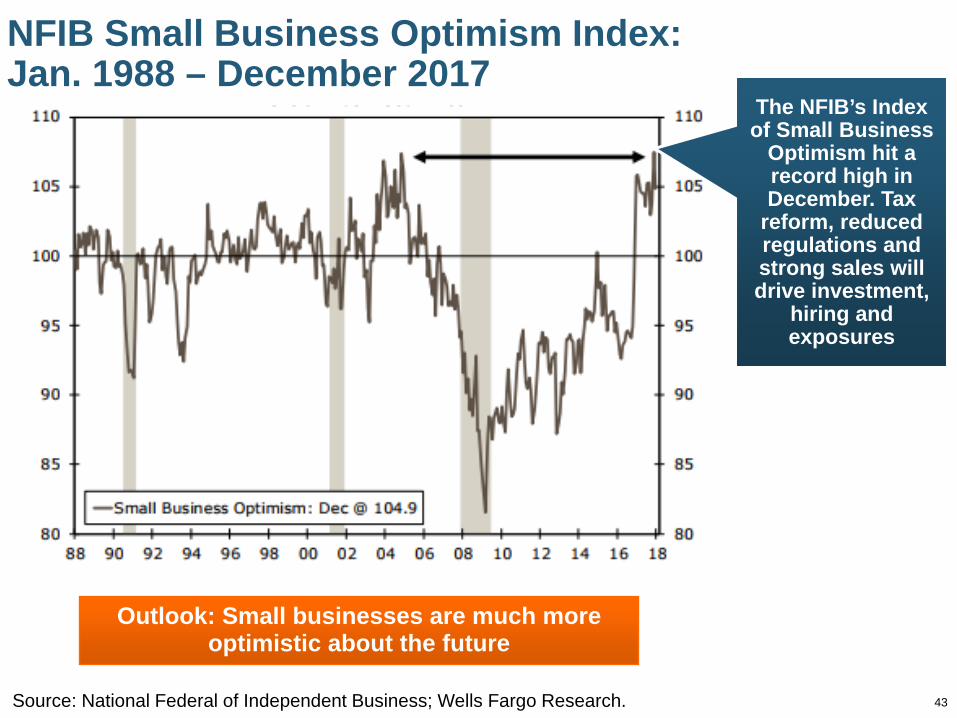
NFIB Small Business Optimism Index:Jan. 1988 – December 2017
Source: National Federal of Independent Business; Wells Fargo Research.
Outlook: Small businesses are much more optimistic about the future
The NFIB’s Index of Small Business
Optimism hit a record high in December. Tax
reform, reduced regulations and strong sales will drive investment,
hiring and exposures
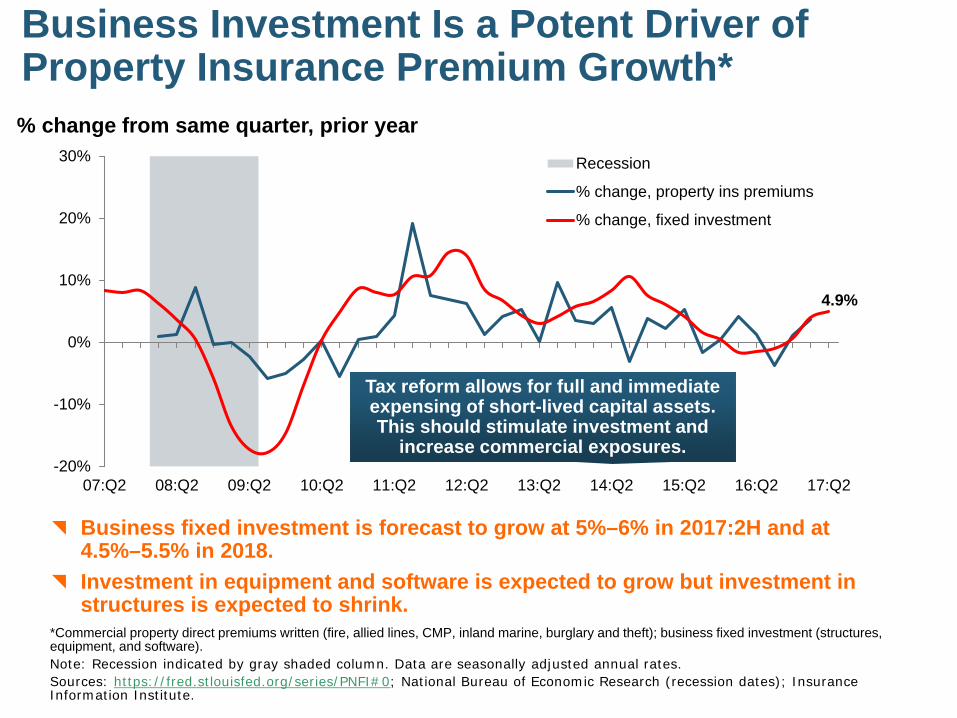
Business Investment Is a Potent Driver of Property Insurance Premium Growth*
*Commercial property direct premiums written (fire, allied lines, CMP, inland marine, burglary and theft); business fixed investment (structures, equipment, and software).Note: Recession indicated by gray shaded column. Data are seasonally adjusted annual rates.Sources: https://fred.stlouisfed.org/series/PNFI#0; National Bureau of Economic Research (recession dates); Insurance Information Institute.
-20%
-10%
0%
10%
20%
30%
07:Q2 08:Q2 09:Q2 10:Q2 11:Q2 12:Q2 13:Q2 14:Q2 15:Q2 16:Q2 17:Q2
Recession
% change, property ins premiums
% change, fixed investment
4.9%
Tax reform allows for full and immediate expensing of short-lived capital assets. This should stimulate investment and
increase commercial exposures.
% change from same quarter, prior year
Business fixed investment is forecast to grow at 5%–6% in 2017:2H and at 4.5%–5.5% in 2018.
Investment in equipment and software is expected to grow but investment in structures is expected to shrink.
46
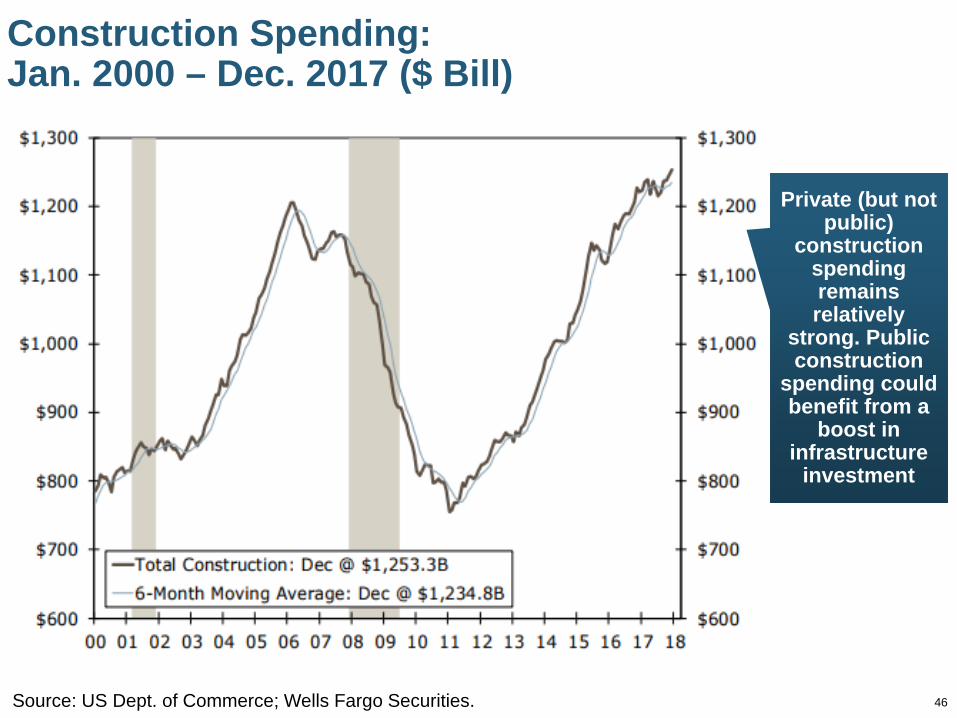
Construction Spending:Jan. 2000 – Dec. 2017 ($ Bill)
Source: US Dept. of Commerce; Wells Fargo Securities.
Private (but not public)
construction spending remains relatively
strong. Public construction
spending could benefit from a
boost in infrastructure
investment
47
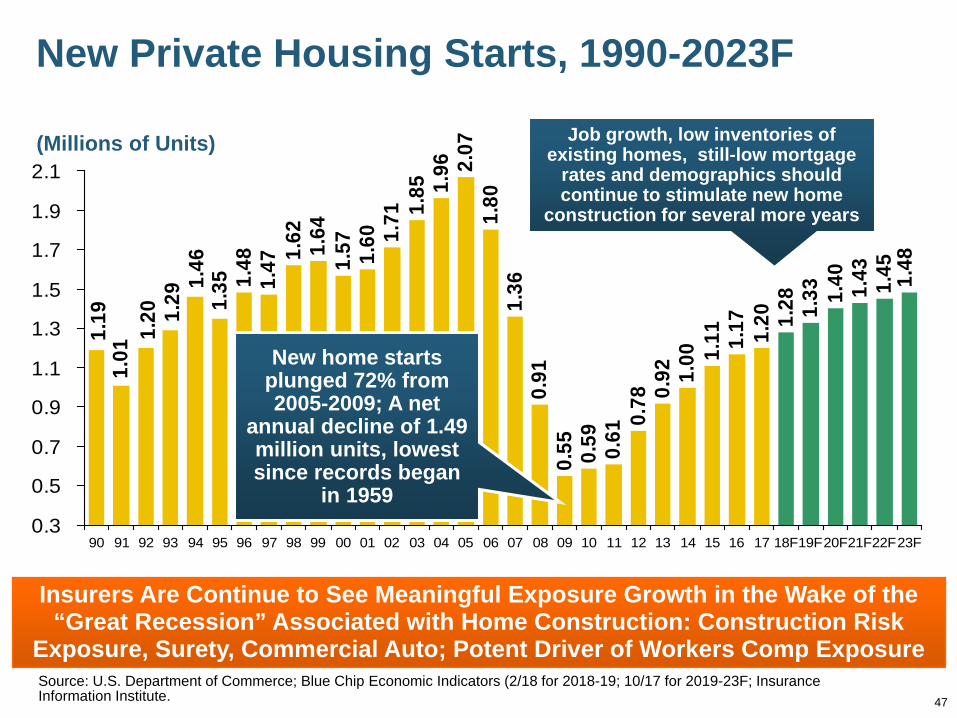
(Millions of Units)
New Private Housing Starts, 1990-2023F
1.48
1.47 1.
62 1.64
1.57 1.60 1.
71 1.85 1.
96 2.07
1.80
1.36
0.91
0.55 0.59 0.61
0.78 0.
92 1.00 1.
11 1.17 1.20 1.
28 1.33 1.
40 1.43 1.45 1.48
1.351.
461.
291.
201.
011.
19
0.3
0.5
0.7
0.9
1.1
1.3
1.5
1.7
1.9
2.1
90 91 92 93 94 95 96 97 98 99 00 01 02 03 04 05 06 07 08 09 10 11 12 13 14 15 16 17 18F19F20F21F22F23F
Source: U.S. Department of Commerce; Blue Chip Economic Indicators (2/18 for 2018-19; 10/17 for 2019-23F; Insurance Information Institute.
Insurers Are Continue to See Meaningful Exposure Growth in the Wake of the “Great Recession” Associated with Home Construction: Construction Risk
Exposure, Surety, Commercial Auto; Potent Driver of Workers Comp Exposure
New home starts plunged 72% from 2005-2009; A net
annual decline of 1.49 million units, lowest since records began
in 1959
Job growth, low inventories of existing homes, still-low mortgage
rates and demographics should continue to stimulate new home
construction for several more years
48
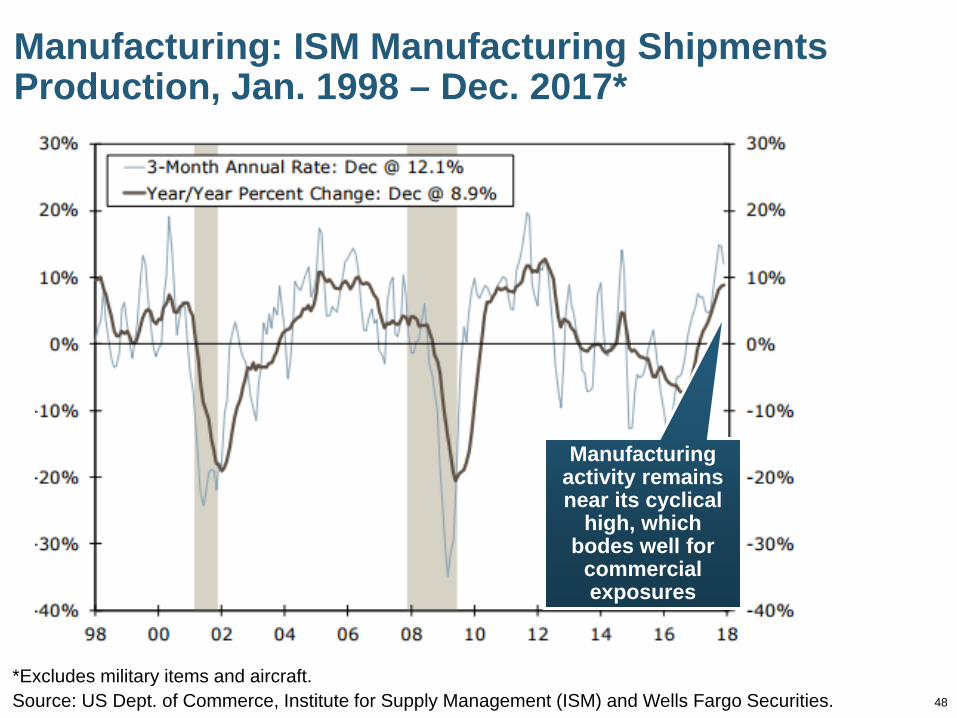
Manufacturing: ISM Manufacturing Shipments Production, Jan. 1998 – Dec. 2017*
*Excludes military items and aircraft.Source: US Dept. of Commerce, Institute for Supply Management (ISM) and Wells Fargo Securities.
Manufacturing activity remains near its cyclical
high, which bodes well for
commercial exposures

49
16.9
16.5
16.1
13.2
10.4
11.6 12
.714
.4 15.5 16
.4 17.4
17.5
17.2
17.0
16.7
16.7
16.7
16.7
16.9
16.9
16.617
.117.5
17.8
17.4
910111213141516171819
99 00 01 02 03 04 05 06 07 08 09 10 11 12 13 14 15 16 17 18F 19F 20F21F 22F 22F
(Millions of Units)
Auto/Light Truck Sales, 1999-2023F
New auto/light truck sales fell to the lowest level since the
late 1960s. Forecast for 2014-15 is still below 1999-2007 average of 17 million units,
but a robust recovery is well underway.
Job growth and improved credit market conditions
boosted auto sales to near record levels in
recent years
Truck, SUV purchases remain strong but have slumped a bit
Yearly car/light truck sales are slowing slightly, as demand tapers following the recovery from the recession. PP Auto premium might
grow by 3.5% - 5%.
Sales have returned to pre-
crisis levels
Source: U.S. Department of Commerce; Blue Chip Economic Indicators (2/18 for 2018-19; 10/17 for 2019-23F; Insurance Information Institute.
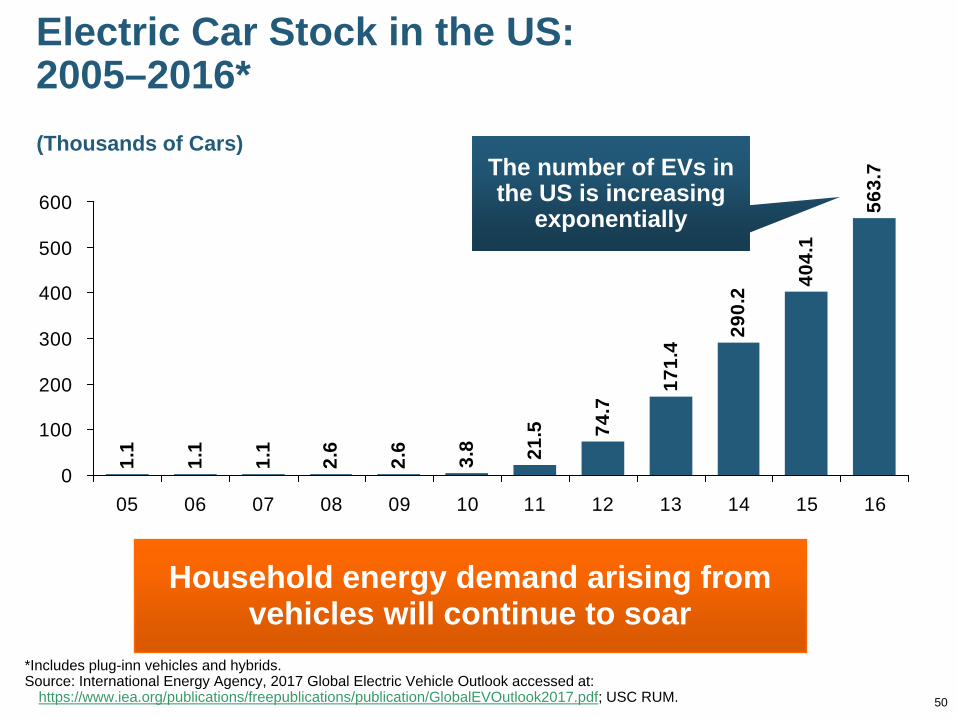
Electric Car Stock in the US: 2005–2016*
1.1
1.1
1.1
2.6
74.7
171.
4
290.
2 404.
1
563.
7
2.6
3.8 21
.5
0
100
200
300
400
500
600
05 06 07 08 09 10 11 12 13 14 15 16
Household energy demand arising from vehicles will continue to soar
*Includes plug-inn vehicles and hybrids.Source: International Energy Agency, 2017 Global Electric Vehicle Outlook accessed at:
https://www.iea.org/publications/freepublications/publication/GlobalEVOutlook2017.pdf; USC RUM. 50
(Thousands of Cars)The number of EVs in the US is increasing
exponentially
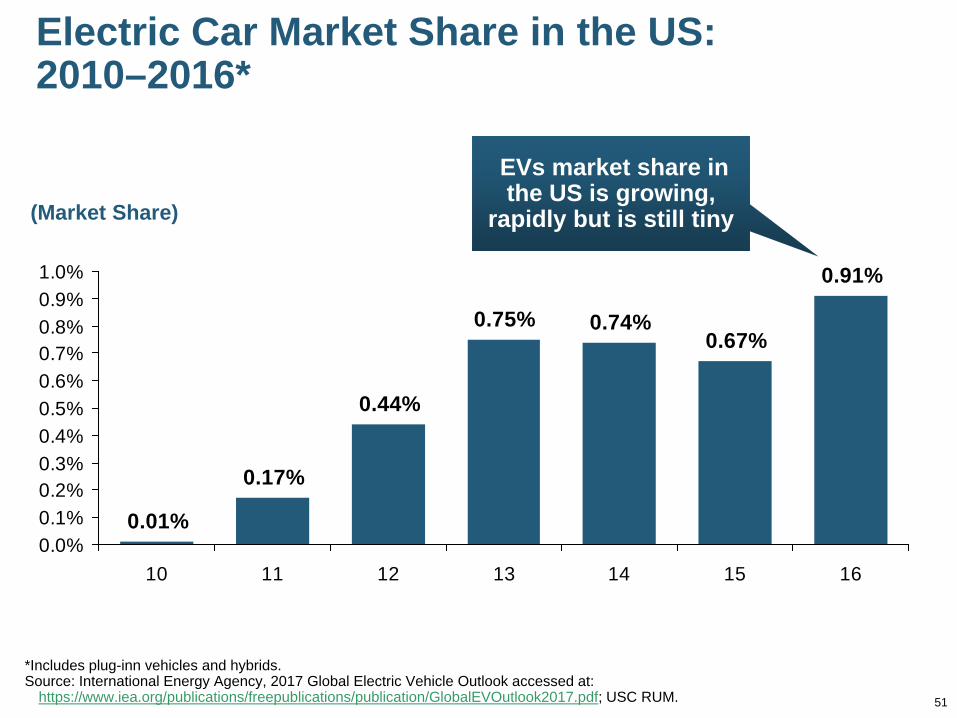
Electric Car Market Share in the US: 2010–2016*
0.01%
0.17%
0.44%
0.75% 0.74%0.67%
0.91%
0.0%0.1%0.2%0.3%0.4%0.5%0.6%0.7%0.8%0.9%1.0%
10 11 12 13 14 15 16
*Includes plug-inn vehicles and hybrids.Source: International Energy Agency, 2017 Global Electric Vehicle Outlook accessed at:
https://www.iea.org/publications/freepublications/publication/GlobalEVOutlook2017.pdf; USC RUM. 51
(Market Share)
EVs market share in the US is growing,
rapidly but is still tiny
52
Electric Vehicles and Electric Utilities
EV vehicle sales are growing exponentially in the US
Unambiguous demand driver for electricity—Or is it?
EVs still account for only a sliver of the US personal auto market share (0.91% in 2016 but up from .01% in 2010)
Market share should grow but is partially subsidy and mandate dependent, and impacted by gasoline prices
But electricity demand from EVs in the long-term will be determined largely by how consumer transportation preferences change as autonomous vehicle technologies evolve
Consumers, vehicle manufacturers and TNCs may eventually find economics of “on demand” vehicles compelling, resulting in far fewer registered vehicles
53
Catastrophe Loss Update: Major Driver of Rate Pressure
2017 Was One of the Costliest Years Ever for US Insurers
Hurricanes Harvey, Irma and Maria, California Wildfires Exact a Huge Toll
53
54
$21 $3
5
$60
$30
$55
$137
$76
$46
$37
$38
$135
$55
$18
$52
$23 $28
$63
$136
$0
$20
$40
$60
$80
$100
$120
$140
$160
00 01 02 03 04 05 06 07 08 09 10 11 12 13 14 15 16 17*
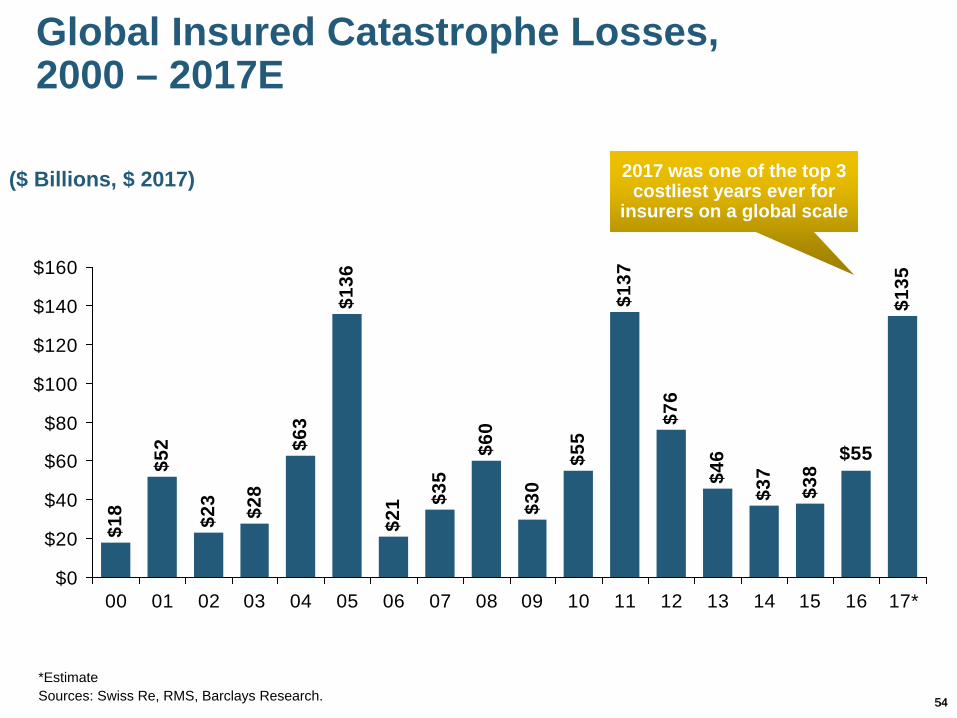
Global Insured Catastrophe Losses, 2000 – 2017E
*EstimateSources: Swiss Re, RMS, Barclays Research.
2017 was one of the top 3 costliest years ever for
insurers on a global scale($ Billions, $ 2017)
54
55
$13.
0$1
1.3
$3.9
$14.
8$1
1.9
$6.3
$35.
8$7
.8 $16.
8$3
4.7
$10.
9$7
.7$3
0.1
$11.
8$1
4.9
$34.
6$3
6.1
$13.
1$1
5.5
$15.
2 $21.
6$7
1.8$75.7
$14.
4$5
.0 $8.2
$38.
9$9
.1$2
7.2
$0
$10
$20
$30
$40
$50
$60
$70
$80
89 90 91 92 93 94 95 96 97 98 99 00 01 02 03 04 05 06 07 08 09 10 11 12 13 14 15 16 17*
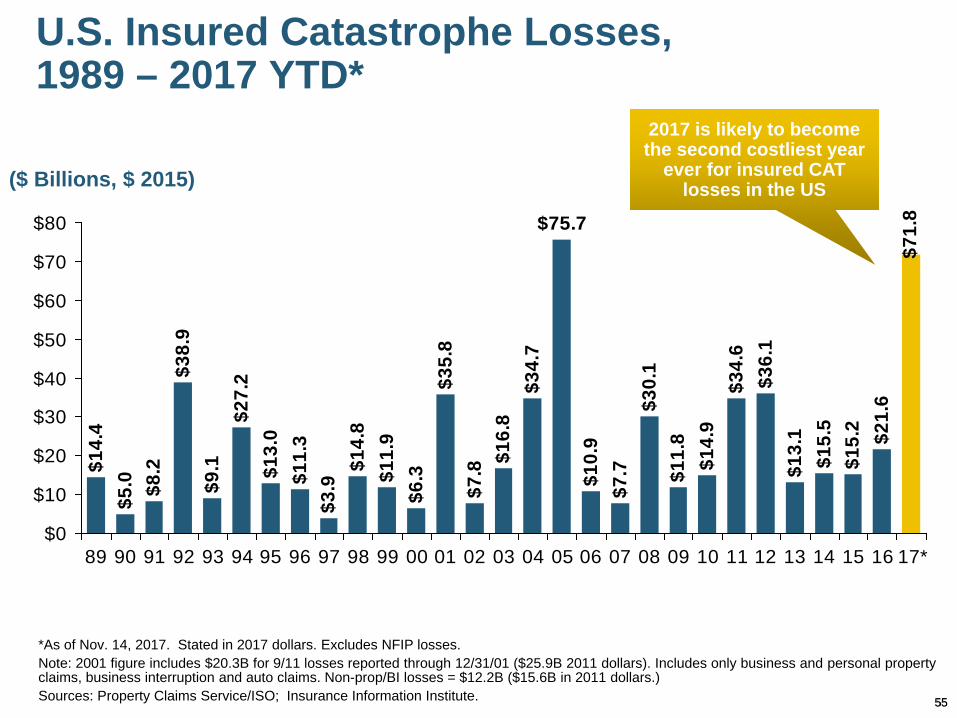
U.S. Insured Catastrophe Losses, 1989 – 2017 YTD*
*As of Nov. 14, 2017. Stated in 2017 dollars. Excludes NFIP losses.Note: 2001 figure includes $20.3B for 9/11 losses reported through 12/31/01 ($25.9B 2011 dollars). Includes only business and personal property claims, business interruption and auto claims. Non-prop/BI losses = $12.2B ($15.6B in 2011 dollars.) Sources: Property Claims Service/ISO; Insurance Information Institute.
2017 is likely to become the second costliest year
ever for insured CAT losses in the US($ Billions, $ 2015)
55
56
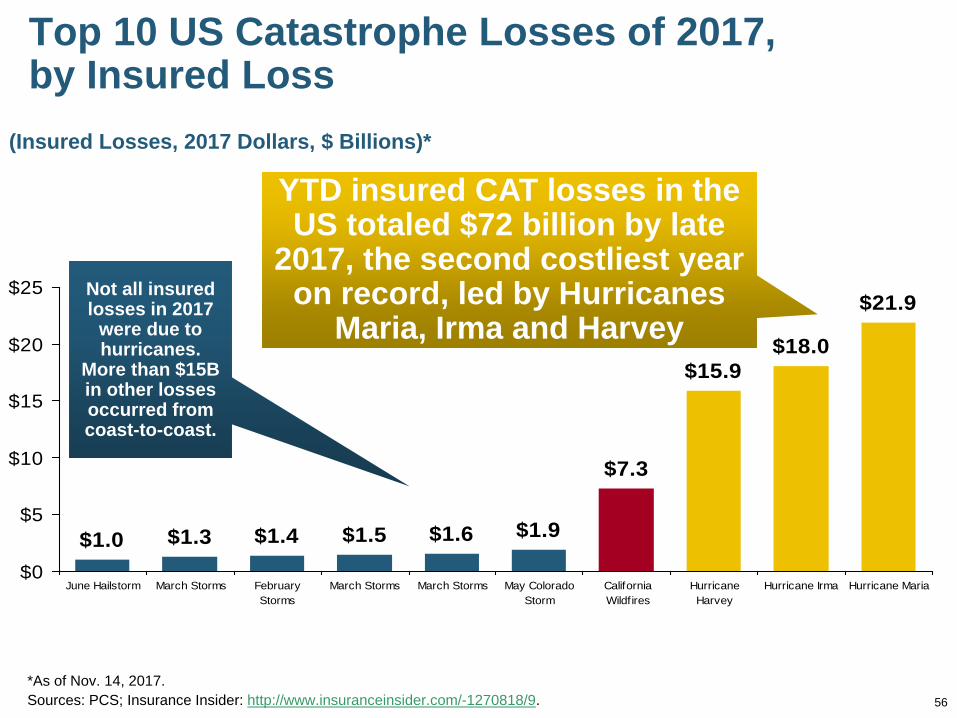
Top 10 US Catastrophe Losses of 2017,by Insured Loss
(Insured Losses, 2017 Dollars, $ Billions)*
$7.3
$15.9$18.0
$21.9
$1.9$1.6$1.5$1.4$1.3$1.0$0
$5
$10
$15
$20
$25
June Hailstorm March Storms FebruaryStorms
March Storms March Storms May ColoradoStorm
CaliforniaWildfires
HurricaneHarvey
Hurricane Irma Hurricane Maria
YTD insured CAT losses in the US totaled $72 billion by late
2017, the second costliest year on record, led by Hurricanes
Maria, Irma and HarveyNot all insured losses in 2017
were due to hurricanes.
More than $15B in other losses occurred from coast-to-coast.
*As of Nov. 14, 2017.Sources: PCS; Insurance Insider: http://www.insuranceinsider.com/-1270818/9.
57
CA Wildfires, Utilities and Insurance
Utilities in California have been at risk for increased litigation arising from wildfires attributed to utility equipment
Environment today is such that utilities are effectively put in the position of insuring the state of CA against open-ended fire risk—a risk that is unacceptable to utility investors
Increasing number of CA homeowners in high risk area have experienced non-renewals or sharp premium increases.
Idea is to legislatively authorize a “pool” of funds collected as a bill charge which can be used costs incurred by affected homeowners
Could alleviate pressure on utilities and their insurers
58
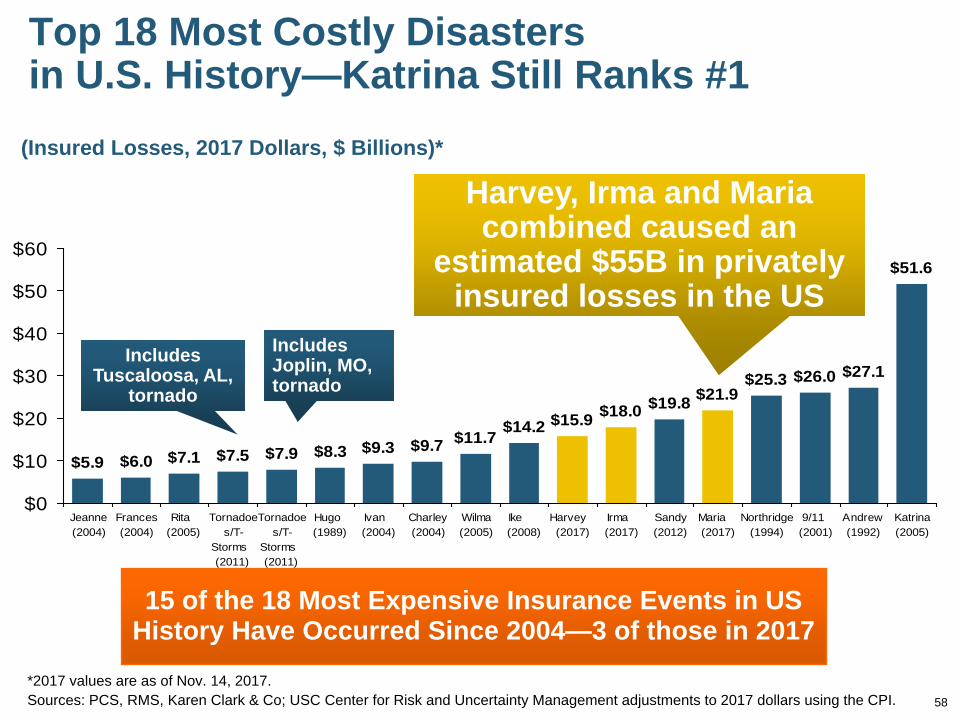
Top 18 Most Costly Disastersin U.S. History—Katrina Still Ranks #1
(Insured Losses, 2017 Dollars, $ Billions)*
$9.3 $9.7 $11.7 $14.2 $15.9 $18.0 $19.8 $21.9$25.3 $26.0 $27.1
$51.6
$8.3$7.9$7.5$7.1$6.0$5.9
$0
$10
$20
$30
$40
$50
$60
Jeanne(2004)
Frances(2004)
Rita (2005)
Tornadoes/T-
Storms (2011)
Tornadoes/T-
Storms (2011)
Hugo (1989)
Ivan (2004)
Charley(2004)
Wilma(2005)
Ike (2008)
Harvey (2017)
Irma (2017)
Sandy(2012)
Maria (2017)
Northridge(1994)
9/11 (2001)
Andrew(1992)
Katrina(2005)
Harvey, Irma and Maria combined caused an
estimated $55B in privately insured losses in the US
Includes Tuscaloosa, AL,
tornado
Includes Joplin, MO, tornado
15 of the 18 Most Expensive Insurance Events in US History Have Occurred Since 2004—3 of those in 2017
*2017 values are as of Nov. 14, 2017.Sources: PCS, RMS, Karen Clark & Co; USC Center for Risk and Uncertainty Management adjustments to 2017 dollars using the CPI.
59
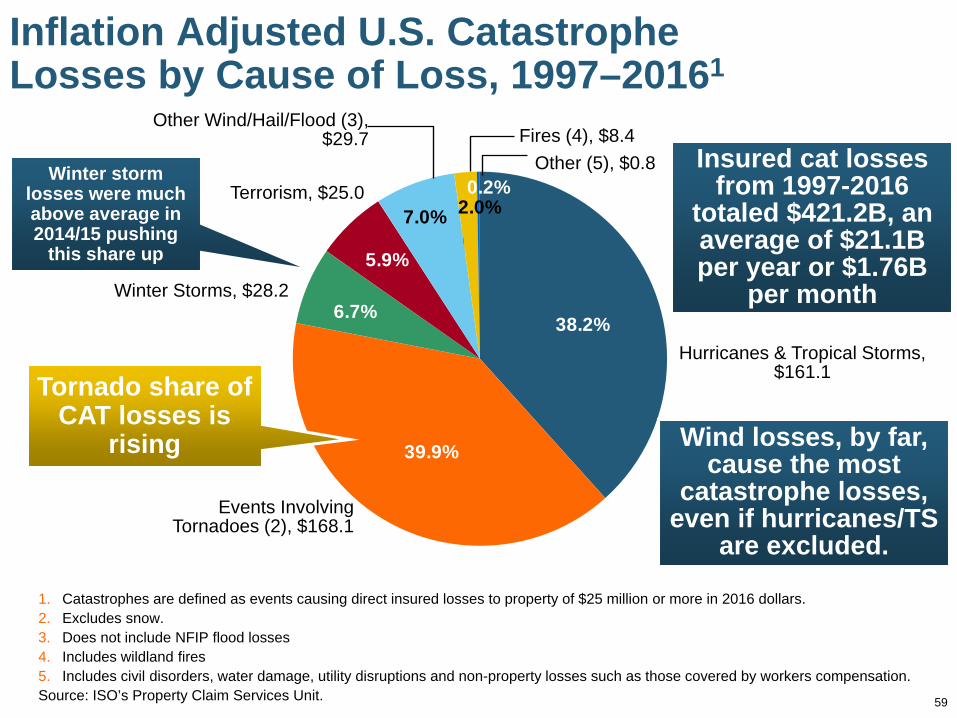
Inflation Adjusted U.S. Catastrophe Losses by Cause of Loss, 1997–20161
0.2%2.0%7.0%
5.9%
6.7%
39.9%
38.2%
1. Catastrophes are defined as events causing direct insured losses to property of $25 million or more in 2016 dollars.2. Excludes snow.3. Does not include NFIP flood losses4. Includes wildland fires5. Includes civil disorders, water damage, utility disruptions and non-property losses such as those covered by workers compensation.Source: ISO’s Property Claim Services Unit.
Hurricanes & Tropical Storms, $161.1
Fires (4), $8.4
Events Involving Tornadoes (2), $168.1
Winter Storms, $28.2
Terrorism, $25.0
Other Wind/Hail/Flood (3), $29.7
Other (5), $0.8
Wind losses, by far, cause the most
catastrophe losses, even if hurricanes/TS
are excluded.
Tornado share of CAT losses is
rising
Insured cat losses from 1997-2016
totaled $421.2B, an average of $21.1B per year or $1.76B
per month
Winter storm losses were much above average in 2014/15 pushing
this share up
60
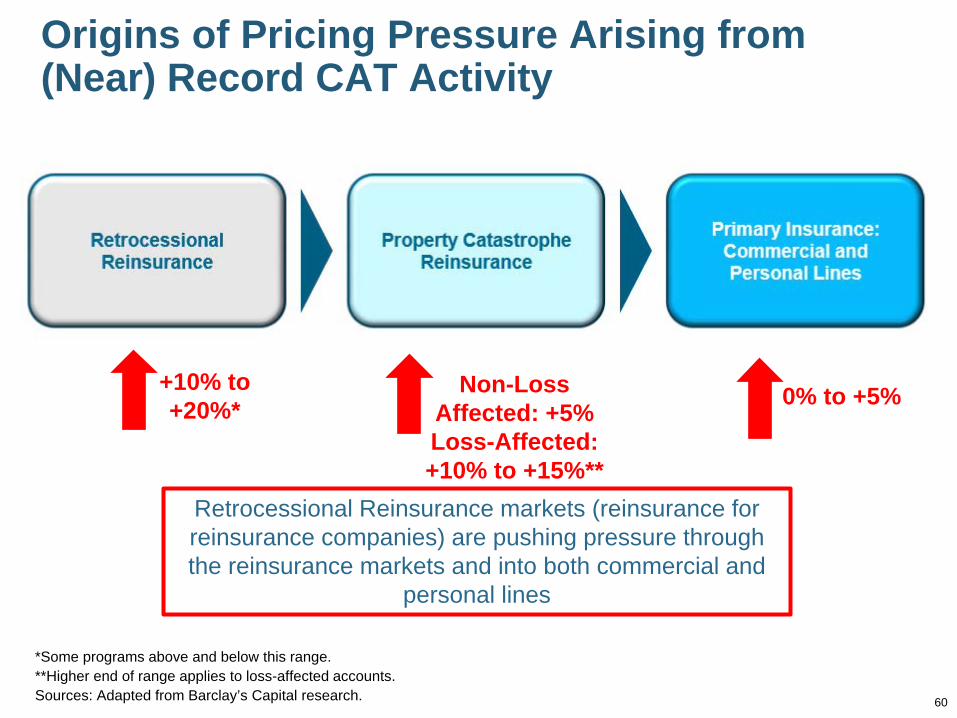
Origins of Pricing Pressure Arising from (Near) Record CAT Activity
*Some programs above and below this range.**Higher end of range applies to loss-affected accounts.Sources: Adapted from Barclay’s Capital research.
+10% to +20%*
Non-Loss Affected: +5% Loss-Affected: +10% to +15%**
0% to +5%
Retrocessional Reinsurance markets (reinsurance for reinsurance companies) are pushing pressure through the reinsurance markets and into both commercial and
personal lines

61
0
50
100
150
200
250
300
90 91 92 93 94 95 96 97 98 99 00 01 02 03 04 05 06 07 08 09 10 11 12 13 14 15 16 17 18*
(Percent)
US Reinsurance Pricing Is Sensitive to CAT Activity and Ultimately Impacts Primary Insurance Pricing, Terms and Conditions
Post-Andrew surge
US Property Catastrophe Rate-on-Line Index: 1990 – 2018*
*As of January 1 each year. 2018 is a full-year estimate (Barclay’s Capital).Source: Guy Carpenter; Artimes.bm accessed at: http://www.artemis.bm/indices/regional-property-cat-rate-on-line-index.html
Post-9/11 Adjustment
Post Katrina, Rita, Wilma
period
Post-Ike adjustment
Adjustment following
record tornado losses in 2011 and Sandy in
2012
Near-Record CATs in 2017 will likely lead US reinsurance prices in
2018 to increase
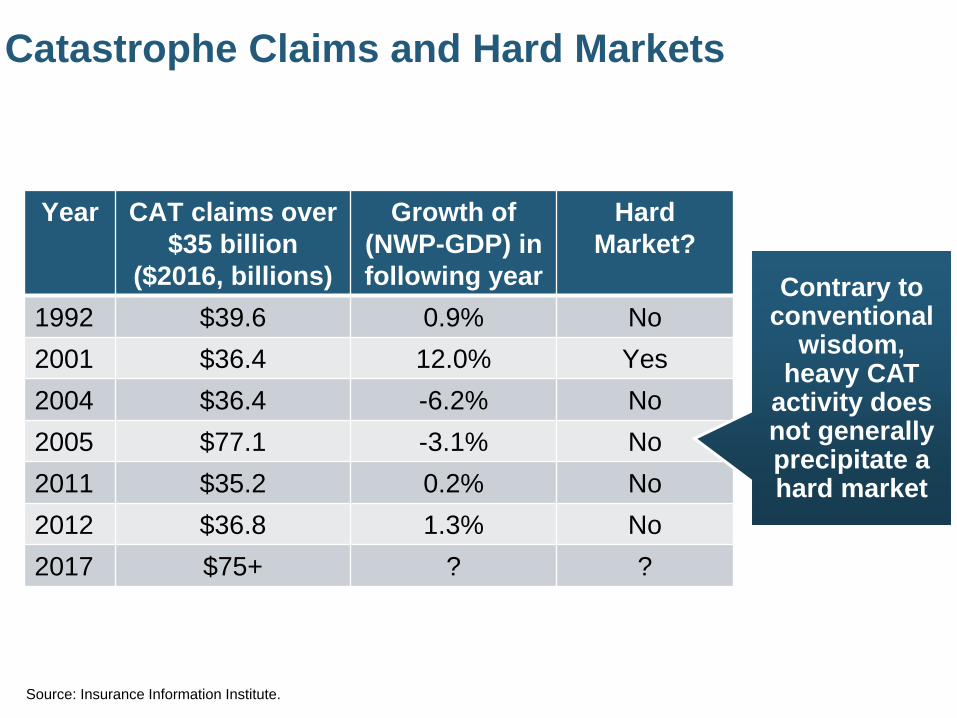
Catastrophe Claims and Hard Markets
Year CAT claims over $35 billion
($2016, billions)
Growth of (NWP-GDP) in following year
Hard Market?
1992 $39.6 0.9% No2001 $36.4 12.0% Yes2004 $36.4 -6.2% No2005 $77.1 -3.1% No2011 $35.2 0.2% No2012 $36.8 1.3% No2017 $75+ ? ?
Contrary to conventional
wisdom, heavy CAT
activity does not generally precipitate a hard market
Source: Insurance Information Institute.
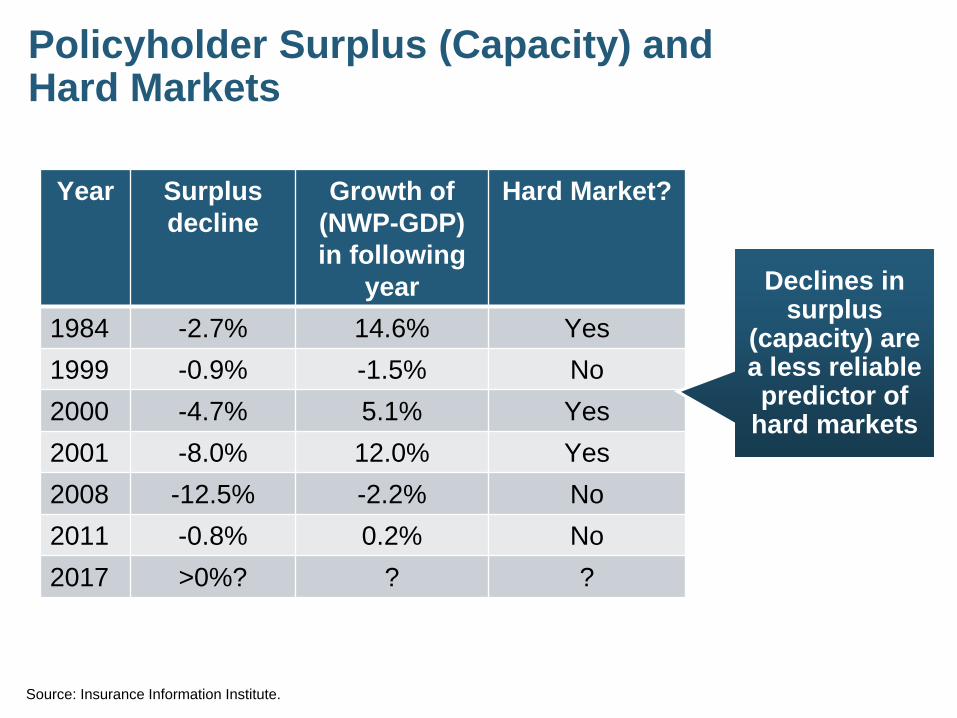
Policyholder Surplus (Capacity) andHard Markets
Year Surplus decline
Growth of (NWP-GDP)in following
year
Hard Market?
1984 -2.7% 14.6% Yes1999 -0.9% -1.5% No2000 -4.7% 5.1% Yes2001 -8.0% 12.0% Yes2008 -12.5% -2.2% No2011 -0.8% 0.2% No2017 >0%? ? ?
Declines in surplus
(capacity) are a less reliable predictor of
hard markets
Source: Insurance Information Institute.

P/C Insurance Industry ROE and Hard Markets
Year P/C Industry ROE less than 4%
Growth of (NWP-GDP)in following
year
Hard Market?
1975 2.4% 10.7% Yes1984 1.8% 14.6% Yes2001 -1.2% 12.0% Yes2002 2.1% 5.1% Yes2017 ~4% ? ?
Source: Insurance Information Institute.
Depressed ROEs are a historically
reliable predictor of
hard markets

Hard Markets: Conclusion & Implications for 2018 Low ROE is the best predictor of a hard market (likely
around 4% in 2017), but does this mean a hard market is a sure thing? No…but some “correction” is possible
Surplus in 2017 was nearly flat to slightly up Capacity remains generally abundant and seems likely to
grow–not drop–due to asset value growth, implying that a true hard market is unlikely to develop as a result of depleted capacity
CAT Losses: 2017 was one of the worst years on record for cat losses–implying a hard market–but this predictor does not appear to be an accurate one, at least in isolation Greatest impacts are driven through property cat reinsurance
and retro markets on loss impacted areas and accounts

Trumponomics, Insurance and Politics
6666
How Might the Trump Presidency Impact the Insurance Industry?
67
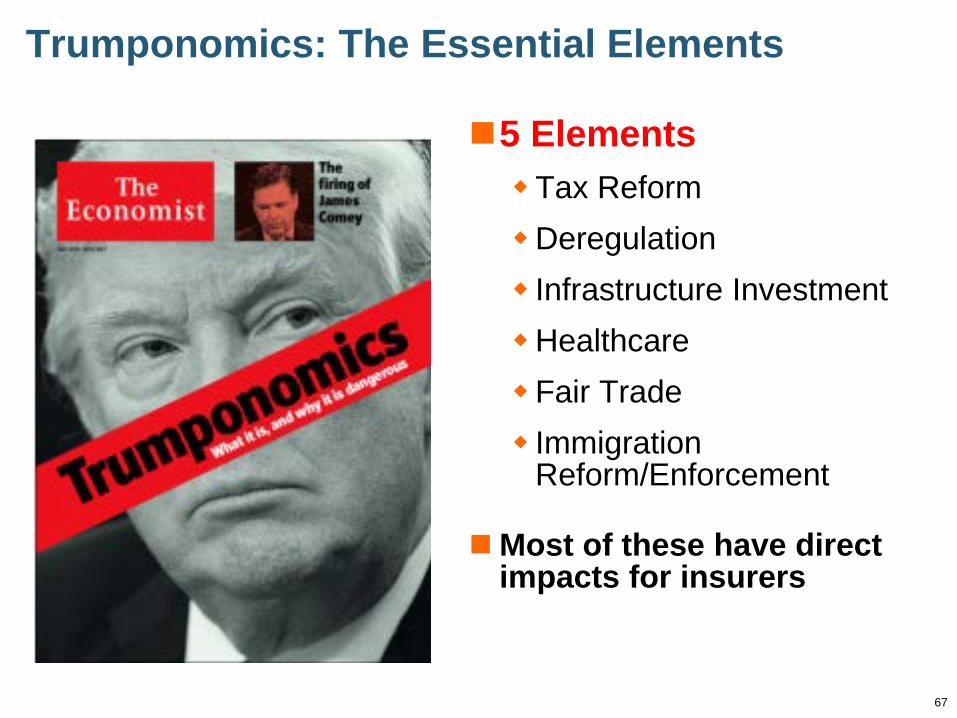
Trumponomics: The Essential Elements
5 Elements Tax ReformDeregulation Infrastructure InvestmentHealthcare Fair Trade Immigration
Reform/Enforcement
Most of these have direct impacts for insurers
Tax Reform…and More
6868
Tax Reform Could Favorably Impact the Insurance Industry
69
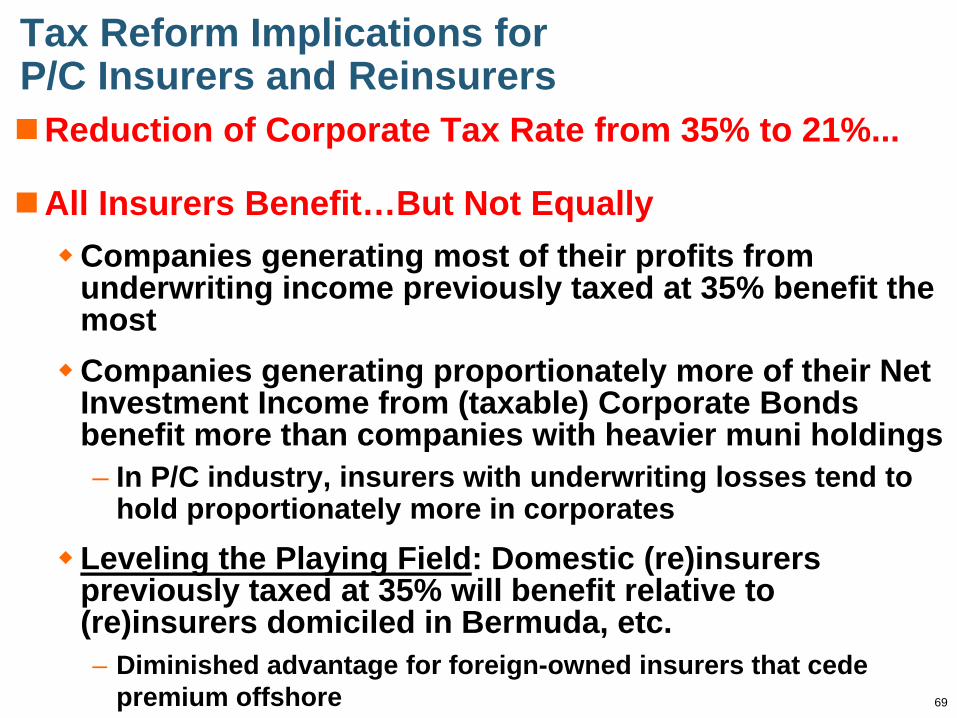
Tax Reform Implications for P/C Insurers and ReinsurersReduction of Corporate Tax Rate from 35% to 21%...
All Insurers Benefit…But Not EquallyCompanies generating most of their profits from
underwriting income previously taxed at 35% benefit the mostCompanies generating proportionately more of their Net
Investment Income from (taxable) Corporate Bonds benefit more than companies with heavier muni holdings– In P/C industry, insurers with underwriting losses tend to
hold proportionately more in corporatesLeveling the Playing Field: Domestic (re)insurers
previously taxed at 35% will benefit relative to (re)insurers domiciled in Bermuda, etc.– Diminished advantage for foreign-owned insurers that cede
premium offshore
70
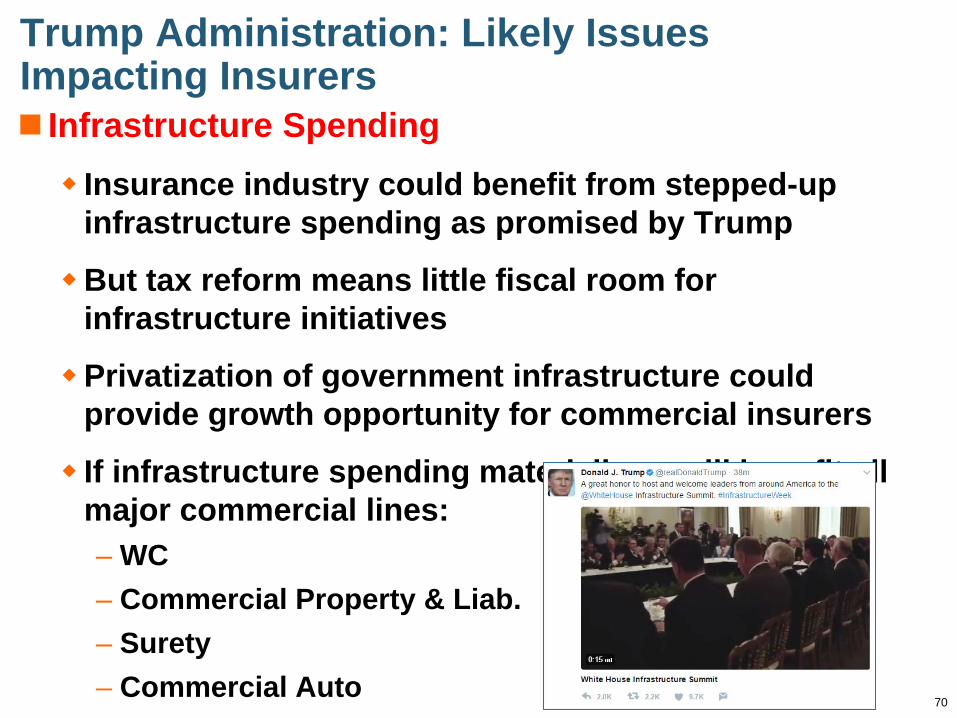
Trump Administration: Likely Issues Impacting Insurers Infrastructure Spending Insurance industry could benefit from stepped-up
infrastructure spending as promised by Trump
But tax reform means little fiscal room for infrastructure initiatives
Privatization of government infrastructure could provide growth opportunity for commercial insurers
If infrastructure spending materializes, will benefit all major commercial lines:– WC– Commercial Property & Liab.– Surety– Commercial Auto
Tax Reform: Utility Sector Highlights
7171
Beyond the Headline Tax Cut, New Law Has Mixed Impacts
on Utilities
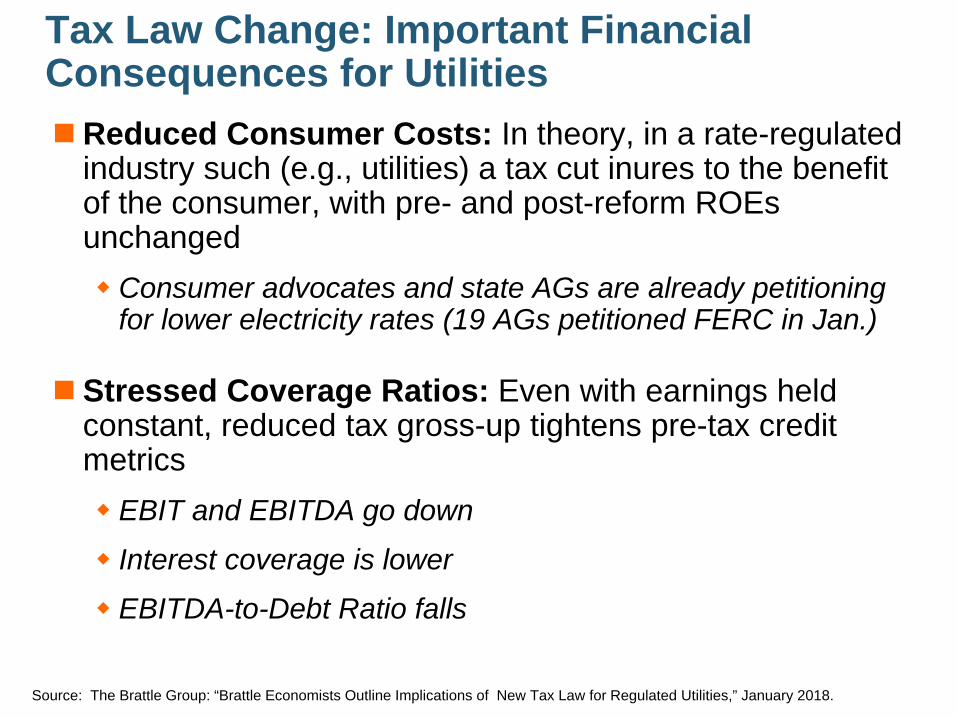
Tax Law Change: Important Financial Consequences for UtilitiesReduced Consumer Costs: In theory, in a rate-regulated
industry such (e.g., utilities) a tax cut inures to the benefit of the consumer, with pre- and post-reform ROEs unchanged Consumer advocates and state AGs are already petitioning
for lower electricity rates (19 AGs petitioned FERC in Jan.)
Stressed Coverage Ratios: Even with earnings held constant, reduced tax gross-up tightens pre-tax credit metrics EBIT and EBITDA go down
Interest coverage is lower
EBITDA-to-Debt Ratio falls
Source: The Brattle Group: “Brattle Economists Outline Implications of New Tax Law for Regulated Utilities,” January 2018.
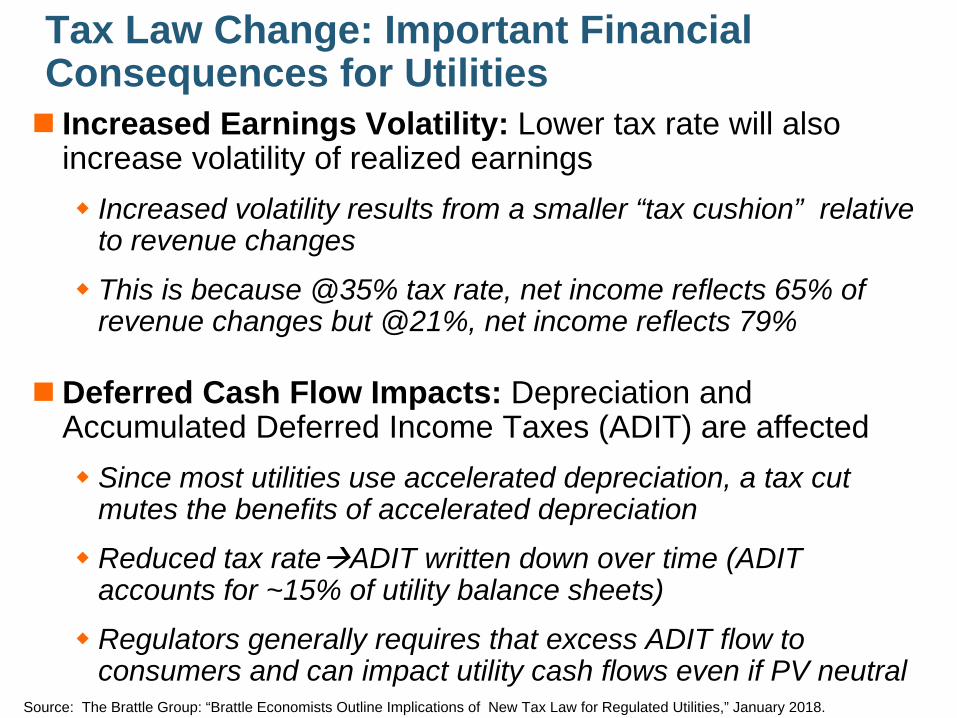
Tax Law Change: Important Financial Consequences for Utilities Increased Earnings Volatility: Lower tax rate will also
increase volatility of realized earnings Increased volatility results from a smaller “tax cushion” relative
to revenue changes
This is because @35% tax rate, net income reflects 65% of revenue changes but @21%, net income reflects 79%
Deferred Cash Flow Impacts: Depreciation and Accumulated Deferred Income Taxes (ADIT) are affected Since most utilities use accelerated depreciation, a tax cut
mutes the benefits of accelerated depreciation
Reduced tax rateADIT written down over time (ADIT accounts for ~15% of utility balance sheets)
Regulators generally requires that excess ADIT flow to consumers and can impact utility cash flows even if PV neutral
Source: The Brattle Group: “Brattle Economists Outline Implications of New Tax Law for Regulated Utilities,” January 2018.

Tax Law Change: Important Financial Consequences for Utilities Stressed Credit Assessments: Moody’s in January 2018
lowered the outlook on 24 regulated utilitiesMoody cited “incremental cash flow shortfall caused by tax
reform on projected financial metrics…”
Excess deferred tax liabilities become a liability on the balance sheet, likely resulting consumer refunds
Possibly Weakened Rationales to Build: Tax law appears to tip buy/build assessment toward buy, especially for tax-advantaged assets like renewables But there can be offsetting factors
Source: The Brattle Group: “Brattle Economists Outline Implications of New Tax Law for Regulated Utilities,” January 2018.
75
Energy Market Overview, the Economy and Insurance
Energy Markets Are Undergoing a Long-Run Transformation in Terms of Fuels, Sources, Generation and Transmission
Overall Demand Remains Robust75
76
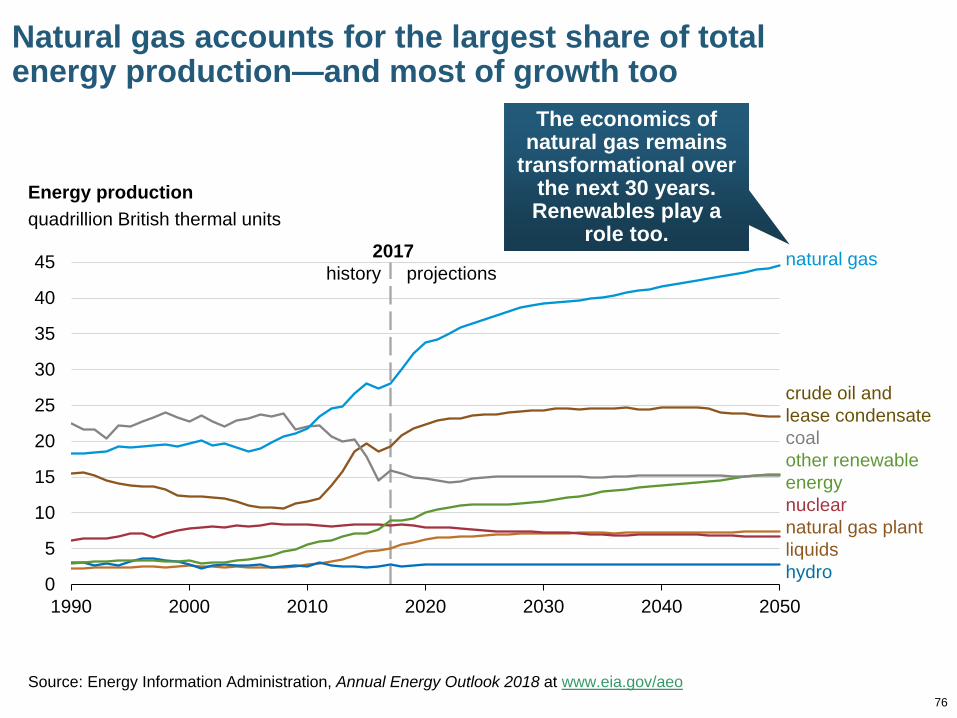
Energy production quadrillion British thermal units
Source: Energy Information Administration, Annual Energy Outlook 2018 at www.eia.gov/aeo
Natural gas accounts for the largest share of totalenergy production—and most of growth too
0
5
10
15
20
25
30
35
40
45
1990 2000 2010 2020 2030 2040 2050
natural gas
crude oil and lease condensatecoalother renewable energynuclearnatural gas plant liquidshydro
2017history projections
The economics of natural gas remains
transformational over the next 30 years. Renewables play a
role too.
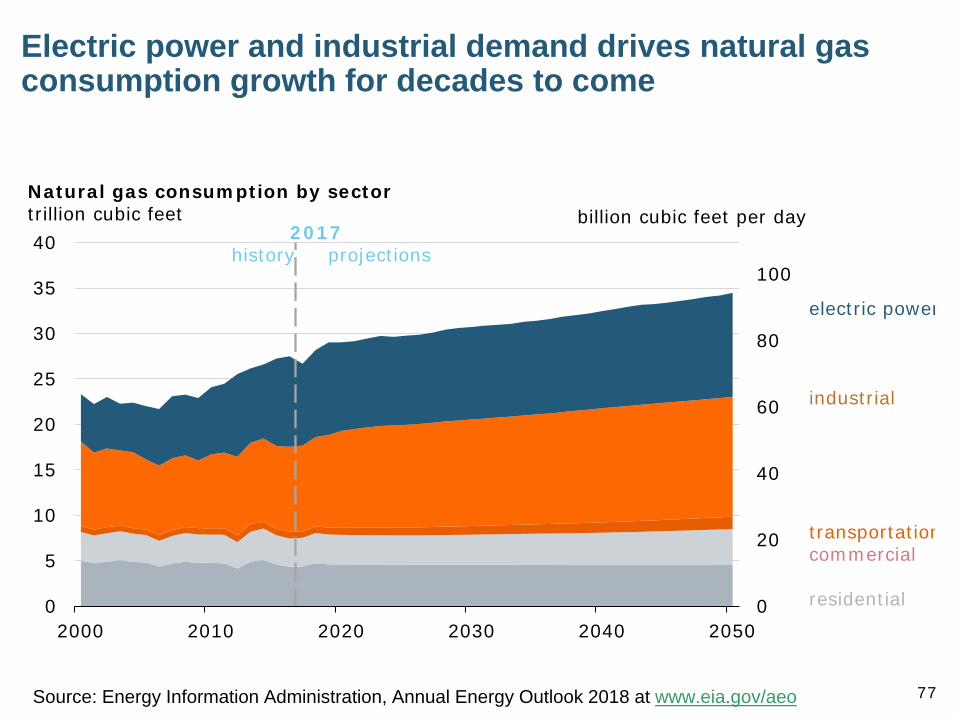
77
Electric power and industrial demand drives natural gas consumption growth for decades to come
0
20
40
60
80
100
0
5
10
15
20
25
30
35
40
2000 2010 2020 2030 2040 2050
Natural gas consumption by sector trillion cubic feet
electric power
industrial
transportationcommercial
residential
billion cubic feet per day2017
history projections
Source: Energy Information Administration, Annual Energy Outlook 2018 at www.eia.gov/aeo

78
Electricity: The Transformation Continues
Economics, Technology, Politics and Regulation Will Reshape Electricity
Generation and Transmission for Decades to Come
A Peek into the Industry at Mid-Century78
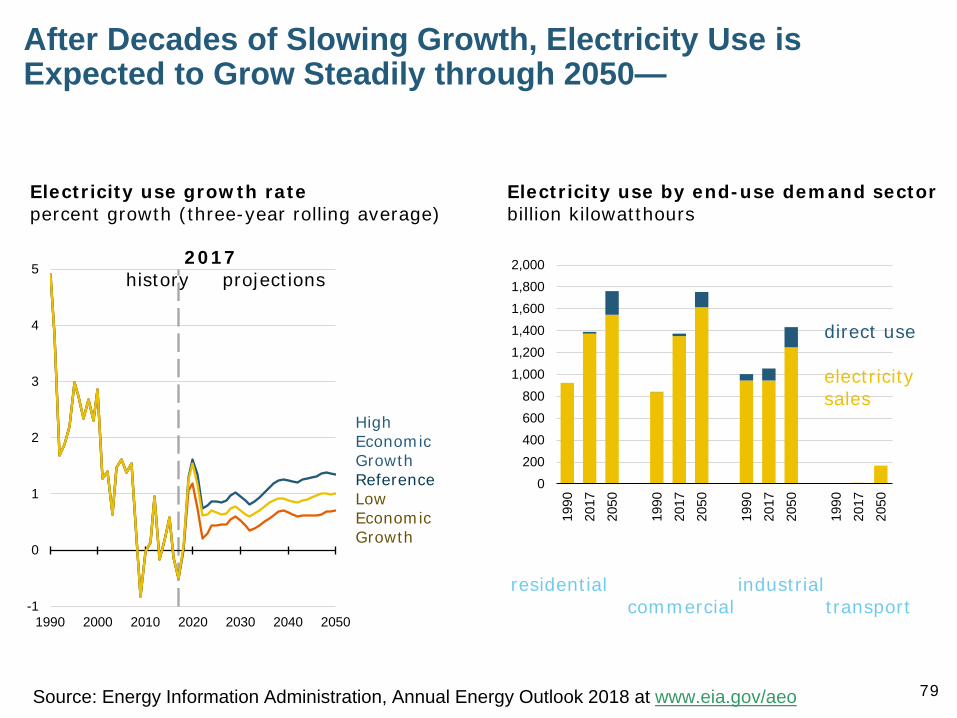
79
After Decades of Slowing Growth, Electricity Use is Expected to Grow Steadily through 2050—
0200400600800
1,0001,2001,4001,6001,8002,000
1990
2017
2050
1990
2017
2050
1990
2017
2050
1990
2017
2050
Electricity use by end-use demand sector billion kilowatthours
direct use
electricity sales
residential industrialcommercial transport-1
0
1
2
3
4
5
1990 2000 2010 2020 2030 2040 2050
Electricity use growth rate percent growth (three-year rolling average)
2017history projections
High Economic GrowthReference Low Economic Growth
Source: Energy Information Administration, Annual Energy Outlook 2018 at www.eia.gov/aeo
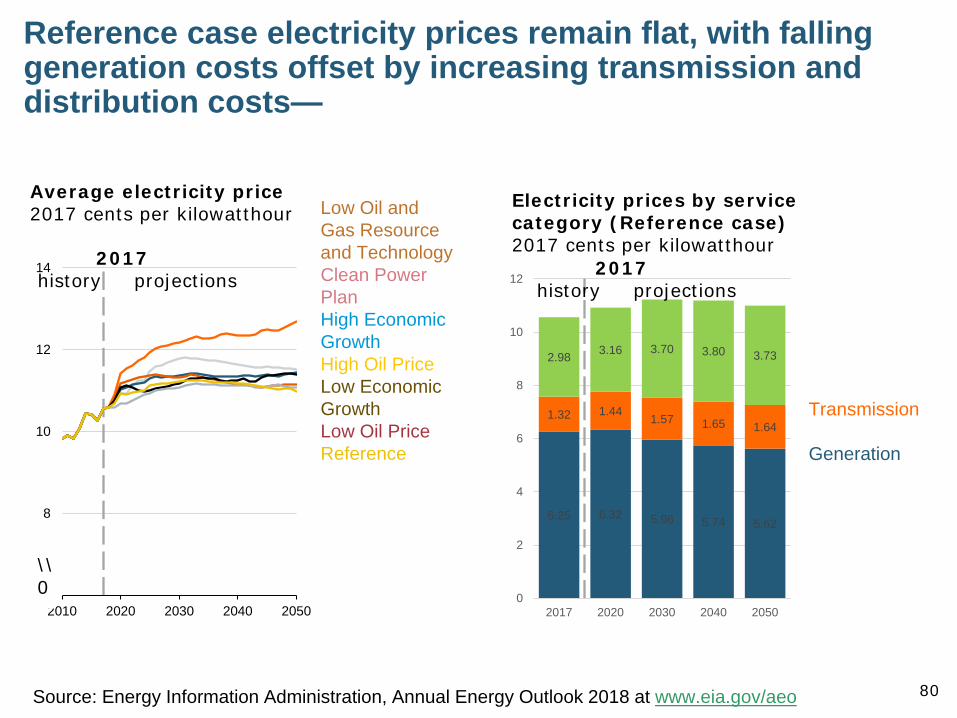
80
Reference case electricity prices remain flat, with falling generation costs offset by increasing transmission and distribution costs—
6
8
10
12
14
2010 2020 2030 2040 2050
Average electricity price2017 cents per kilowatthour
2017history projections
Low Oil and Gas Resource and TechnologyClean Power PlanHigh Economic GrowthHigh Oil PriceLow Economic GrowthLow Oil PriceReferenceHigh Oil and Gas Resource and Technology
\\0
6.25 6.32 5.96 5.74 5.62
1.32 1.441.57 1.65 1.64
2.98 3.16 3.70 3.80 3.73
0
2
4
6
8
10
12
2017 2020 2030 2040 2050
Electricity prices by service category (Reference case)2017 cents per kilowatthour
Distribution
Transmission
Generation
2017history projections
Source: Energy Information Administration, Annual Energy Outlook 2018 at www.eia.gov/aeo

81
Projected mix of electricity generation technologies shows natural gas and renewables gaining share through 2050
0
500
1,000
1,500
2,000
2,500
3,000
1990 2000 2010 2020 2030 2040 2050
2017history projections
Reference case
Electricity generation from selected fuelsbillion kilowatthours
natural gas
coal
nuclear
renewables renewables
Electricity generation market share moves
strongly toward natural gas and
renewables and away from coal and nuclear
Source: Energy Information Administration, Annual Energy Outlook 2018 at www.eia.gov/aeo

82
Coal-fired electric generating capacity decreases through 2030, even without the Clean Power Plan or lower natural gas prices—
0
50
100
150
200
250
300
350
2010 2020 2030 2040 2050
Coal generation capacitygigawatts
2017history projections
Low Oil and Gas Resource and TechnologyReference High Oil and Gas Resource and Technology
without Clean Power Plan with Clean Power Plan
Source: Energy Information Administration, Annual Energy Outlook 2018 at www.eia.gov/aeo
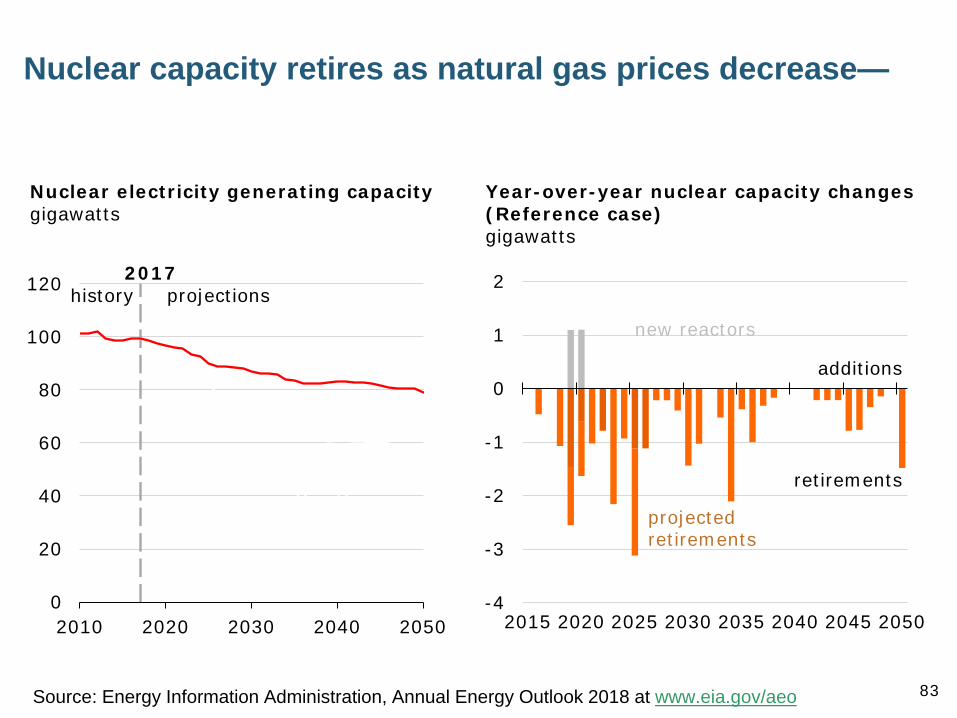
83
Nuclear capacity retires as natural gas prices decrease—
0
20
40
60
80
100
120
2010 2020 2030 2040 2050
Nuclear electricity generating capacitygigawatts
2017history projections
High Oil and Gas Resource and Technology
-4
-3
-2
-1
0
1
2
2015 2020 2025 2030 2035 2040 2045 2050
Year-over-year nuclear capacity changes (Reference case)gigawatts
additions
retirements
assumed upratesnew reactors
projectedretirements
Source: Energy Information Administration, Annual Energy Outlook 2018 at www.eia.gov/aeo
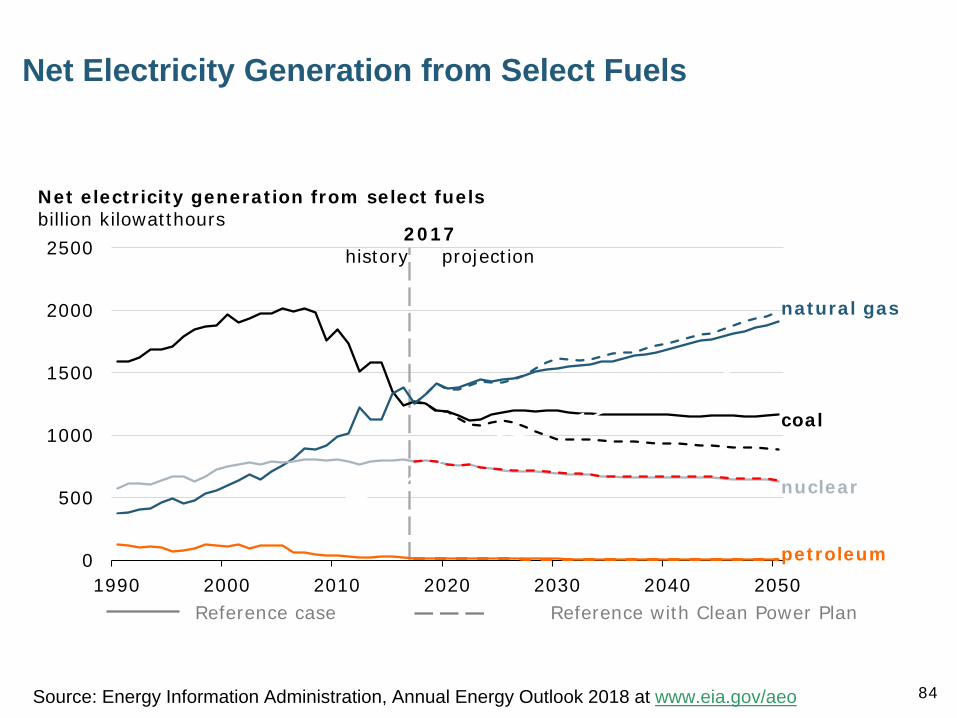
84
Net Electricity Generation from Select Fuels
0
500
1000
1500
2000
2500
1990 2000 2010 2020 2030 2040 2050
Net electricity generation from select fuelsbillion kilowatthours
2017history projection
Reference case Reference with Clean Power Plan
natural gas
renewables
coal
nuclear
petroleum
Source: Energy Information Administration, Annual Energy Outlook 2018 at www.eia.gov/aeo

85
Generation from renewable sources grows across all cases, led by growth in wind and solar photovoltaic generation—
0
200
400
600
800
1,000
1,200
1,400
1,600
1,800
2010 2020 2030 2040 2050
Total renewables generation, including end-use generationbillion kilowatthours
2017history projections
0
200
400
600
800
1,000
1,200
1,400
1,600
1,800
2010 2020 2030 2040 2050
Renewable electricity generation, including end-use generation (Referenc billion kilowatthours
2017history projections
solar PV
wind
geothermalhydroelectric
other
Source: Energy Information Administration, Annual Energy Outlook 2018 at www.eia.gov/aeo
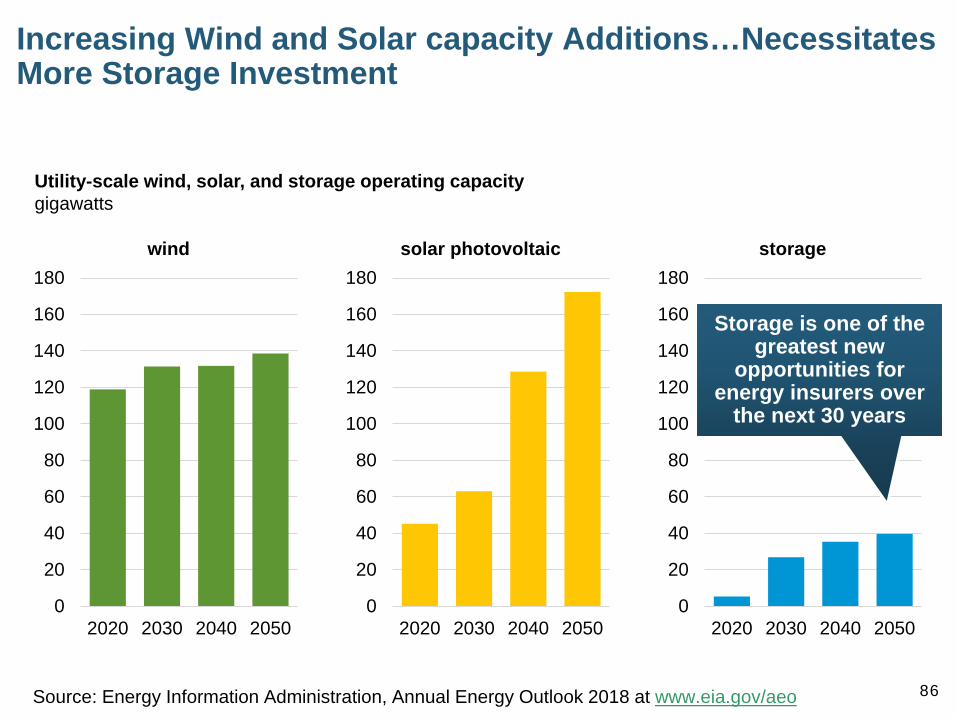
86
Increasing Wind and Solar capacity Additions…Necessitates More Storage Investment
0
20
40
60
80
100
120
140
160
180
2020 2030 2040 2050
wind
0
20
40
60
80
100
120
140
160
180
2020 2030 2040 2050
storage
0
20
40
60
80
100
120
140
160
180
2020 2030 2040 2050
solar photovoltaic
Utility-scale wind, solar, and storage operating capacitygigawatts
Storage is one of the greatest new
opportunities for energy insurers over
the next 30 years
Source: Energy Information Administration, Annual Energy Outlook 2018 at www.eia.gov/aeo
87
From 2020 to 2050, utility-scale wind capacity is projected to grow by 20 GW (~17%), and utility-scale solar photovoltaic capacity is projected to grow by 127 GW (>300%) Over this same period, utility-scale storage capacity is projected to grow by 34 GW (~400%).
Battery-based storage costs are expected to continue to decline as utility-scale energy storage markets grow.
Policies such as storage mandates in California and market participation rules in the PJM electricity market support near-term growth in storage systems to stabilize grid operations, improve utilization of existing generators, and integrate intermittent technologies such as wind and solar into the grid.
In the longer term, wind and solar growth are projected to support economic opportunities for storage systems that can provide several hours of storage and enable renewables generation produced during the hours with high wind or solar output to supply electricity at times of peak electricity demand.
The Business Case for Storage
Source: Energy Information Administration, Annual Energy Outlook 2018 at www.eia.gov/aeo
88
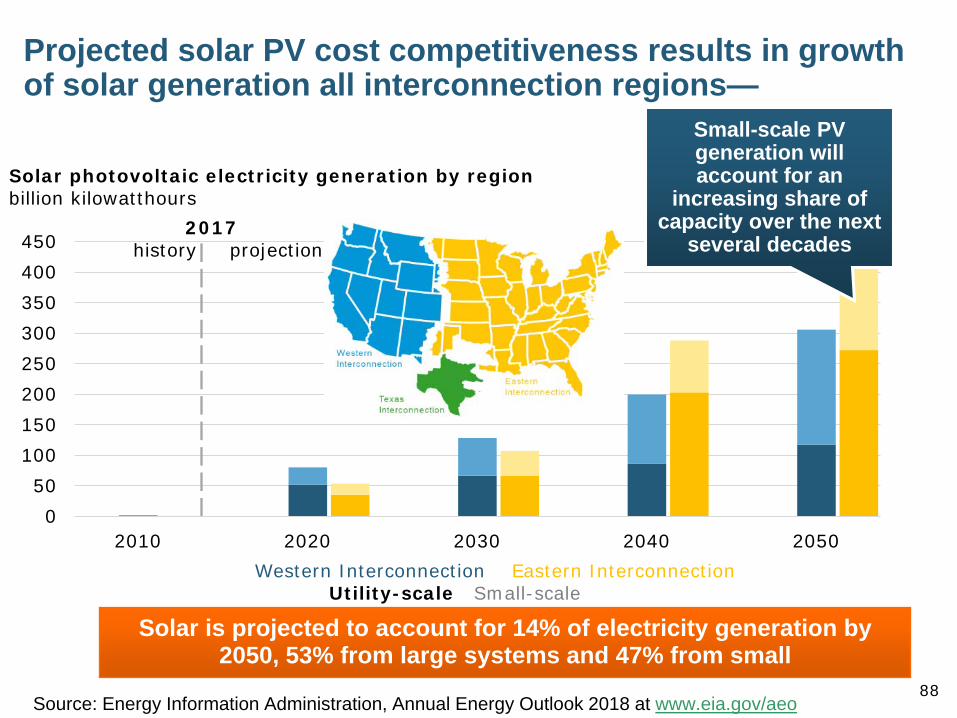
Projected solar PV cost competitiveness results in growth of solar generation all interconnection regions—
050
100150200250300350400450
2010 2020 2030 2040 2050Texas Western Interconnection Eastern Interconnection
Utility-scale Small-scale
Solar photovoltaic electricity generation by regionbillion kilowatthours
2017history projections
Small-scale PV generation will account for an
increasing share of capacity over the next
several decades
Solar is projected to account for 14% of electricity generation by 2050, 53% from large systems and 47% from small
Source: Energy Information Administration, Annual Energy Outlook 2018 at www.eia.gov/aeo
89
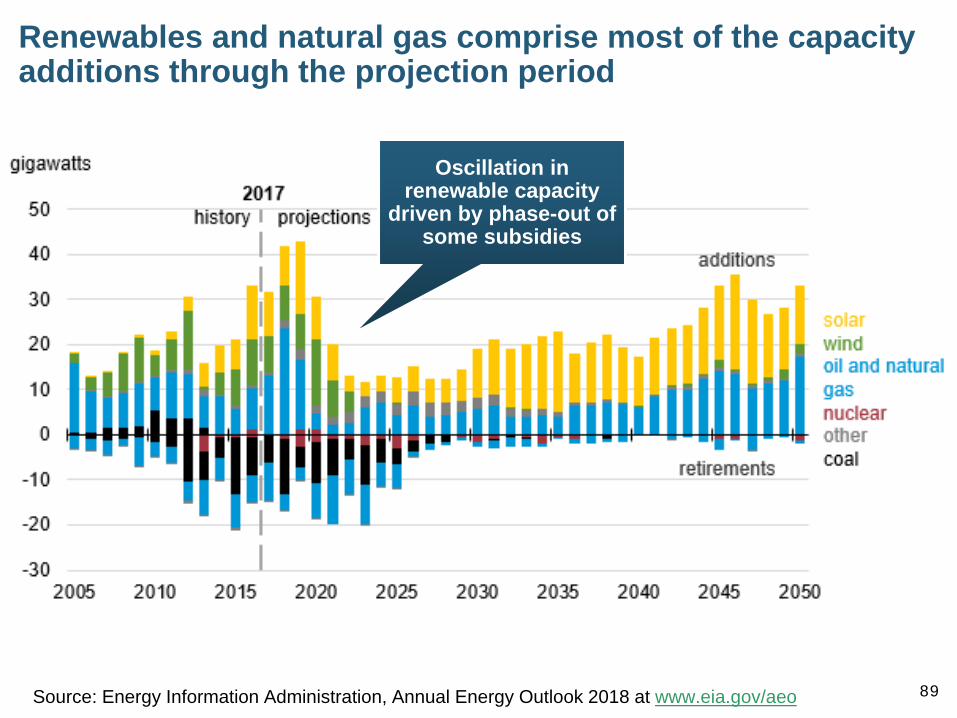
Renewables and natural gas comprise most of the capacity additions through the projection period
Source: Energy Information Administration, Annual Energy Outlook 2018 at www.eia.gov/aeo
Oscillation in renewable capacity
driven by phase-out of some subsidies

90
Summary P/C Insurers and Reinsurance Remain Financially Strong
Despite Record CATs
Financial Market Pressures Remain and Volatility Returns
Robust Insurer Growth Opportunities in 2018-2019
Near-Term Economic Picture Remains Bright
“Trumponomics” is a Near-Term Growth Driver
Energy Sector Is in the Midst of a Multi-Decade Transformation Driven by Economics, Technology and Geo-Politics
Electricity: Growth & Transformation through Mid-Century

Thank you for your timeand your attention!
Twitter: twitter.com/bob_hartwigFor a copy of this presentation, email me at [email protected]
91