Embed Size (px)
Citation preview

Overview of Well Injection TestsBy: Saad Ibrahim, P. Eng.
For information:www.petromgt.com2016

Petro Management Group Quality Petroleum Engineering Consultants
Services:
<Reservoir Studies (Conventional/Simulation)<Well Test Planning and Analysis<Waterflood Design & Performance Monitoring<Production Optimization<Performance Evaluation of MFHW’s (PTA, RTA, Numerical)<Reserves and Economic Evaluations<Complete frac design/optimization (Gohfer/KAPPA software)<Government Submissions<Customized course contents<Expert Witness

Petro Management Group - FracKnowledge
WellFracability
Geological<Mineral contents<Natural fractures<Core/Sweet spots
Geo-mechanical<Poisson’s ratio<Young’s modulus<Brittleness Index
Reservoir Eng.<DFIT and PTA<RTA<Reservoir parameters
Full Well Frac Design and Optimization Services:
KAPPAsoftware
GeologicalData
Optimum FracDesign
Goffersoftware

Industry and In-house Training Courses
<Fundamentals of Reservoir Engineering<Well Test Analysis Workshop<Performance Evaluation of Horizontal Wells<Waterflood Management<Enhanced Oil Recovery<Petroleum Engineering for Non-Engineers
Benefits of in-house training:
<Up to 60% discount off the industry standard fees
<Customization
<Confidentiality

Our Business is Hanging on Rumours!
RussiaOPEC
Jan. 28, 2016

Overview of Well Injection Tests
<Applications of injectivity tests<Types of injectivity tests<Operational aspects/problems of conducting injectivity tests< Injection fall-off and step rate tests
• Conventional testing• Unconventional
<Hall plot <Application of Diagnostic Fracture injection Test (DFIT) or mini Frac<Case study (Duvernay Shale Gas)<Control of Well Flow-back, after frac treatment
Agenda:

Applications of Injectivity Tests
<Optimize fluid injectivity for EOR and water disposal projects,by determining wellbore skin factor and permeability
<Monitor performance of injection/disposal wells <Obtain information vital to frac treatment design, such as:
• Closure pressure• Reservoir parameters (permeability and pressure) • Leak-off types
<Determine ceiling injection pressure for steam injection andEOR schemes
<Evaluate the draw-down limit during well flow-back periodfollowing frac treatments
Tips to Maintain Well Injectivity
Injection of fluids into the reservoir can causeformation damage, which could be difficult to remove
<Rock-fluid damage (clay swelling/migration)<Fluid-fluid damage (fluids incompatibility)<Completion technique (clean up)<Water quality<Filter size

Preparations of Water Injectivity TestingSome of the precautions that need to be considered prior toconducting an injectivity test are:
1. Perform laboratory tests to ensure injected and formation waters are compatible
2. Perform laboratory tests to ensure injected water iscompatible with formation rock. The presence of swellingclays (smectite) could result in permanent formationdamage. The addition of suitable chemicals (KCl) toreduce potential problems is highly recommended.
Tubing Scale

Completion of Injection Wells3. Ensure clean wellbore condition prior to water injection by simply
swabbing the well prior to water injection. The illustrated exampleof an injectivity test shows an increase in water injectivity over500% at a WHIP of 8 000 kPa after swabbing.

Water Quality
Water quality should be maintained to avoid severe formationdamage over a long period of injection, that could be irreversible
Problem:
Solution:
Perform regular water sampling and water chemical analysis tomaintain water quality, including:
<Oil contamination<Oxygen content<Fine size and amounts<Bacterial content

K 100
K 10
Water filter Size
Rockgrain
Rockgrain
Fine bridging(damage)
Pore throat size = = = 10 microns Filter size = 10/3 = 3 microns
Pore throat size = = . 3 microns Filter size = 3/3 = 1 microns
10 micron
5 micron
1 micron
Pore
throat
K: permeability

Water Filter
Water filter Cartridges
Water filter Unit

Injectivity/fall-off and Step Rate Tests

Injectivity/fall-off and Step Rate Tests
These tests are commonly conducted on disposaland injector wells.
< Injectivity/fall-off test is conducted to evaluatewell injectivity by determining:• Formation permeability• Wellbore skin factor• Reservoir pressure
<Step Rate test to conducted to determine theformation breakdown pressure
Step-rate Test
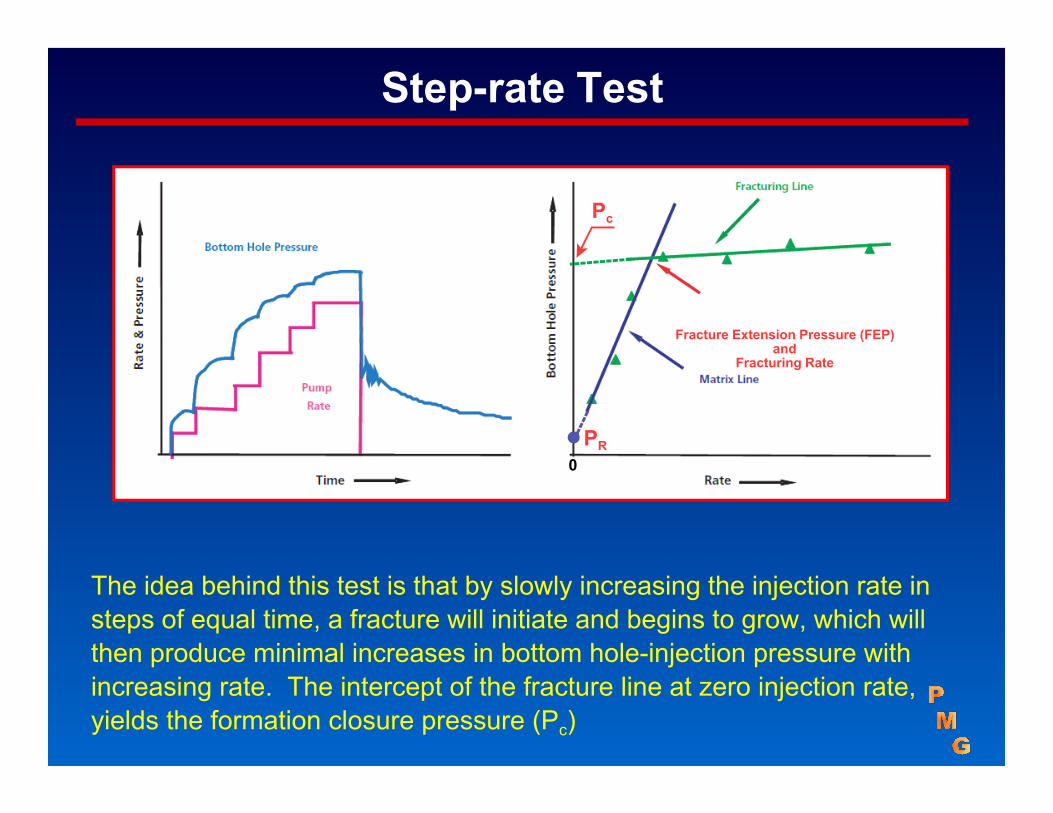
The idea behind this test is that by slowly increasing the injection rate insteps of equal time, a fracture will initiate and begins to grow, which willthen produce minimal increases in bottom hole-injection pressure withincreasing rate. The intercept of the fracture line at zero injection rate,yields the formation closure pressure (Pc)
Fracture Extension Pressure (FEP)and
Fracturing Rate
PR
Pc
0

q 7.08 x 10 k h (P P )
B (ln rr
34
S) w
3R wf
we
w
w
i x . k h P ww
9 3 10 4. . .
i x . k h P
ww
2 3 10 4.. .
Design of Step-rate Test<Estimate of the formation water injectivity capacity,
using the generalized Darcy equation:
BWPD
Approximation of water injectivity:
into aquifer
into oil zone
Bwpd
Bwpd

Design of Step-rate Test, cont.
<Estimate the formation breakdown (fracture) pressure fromthe Eaton’s formula or from offset wells.
<Select the water step injection rates to ensure that aminimum of 3 steps are below the fracture pressure and 3step rates above the frac pressure (see table below).
< It is always recommended to use non-damaging injectionfluids, by adding 2% to 3% KCL
Below FracPressure
Above FracPressure
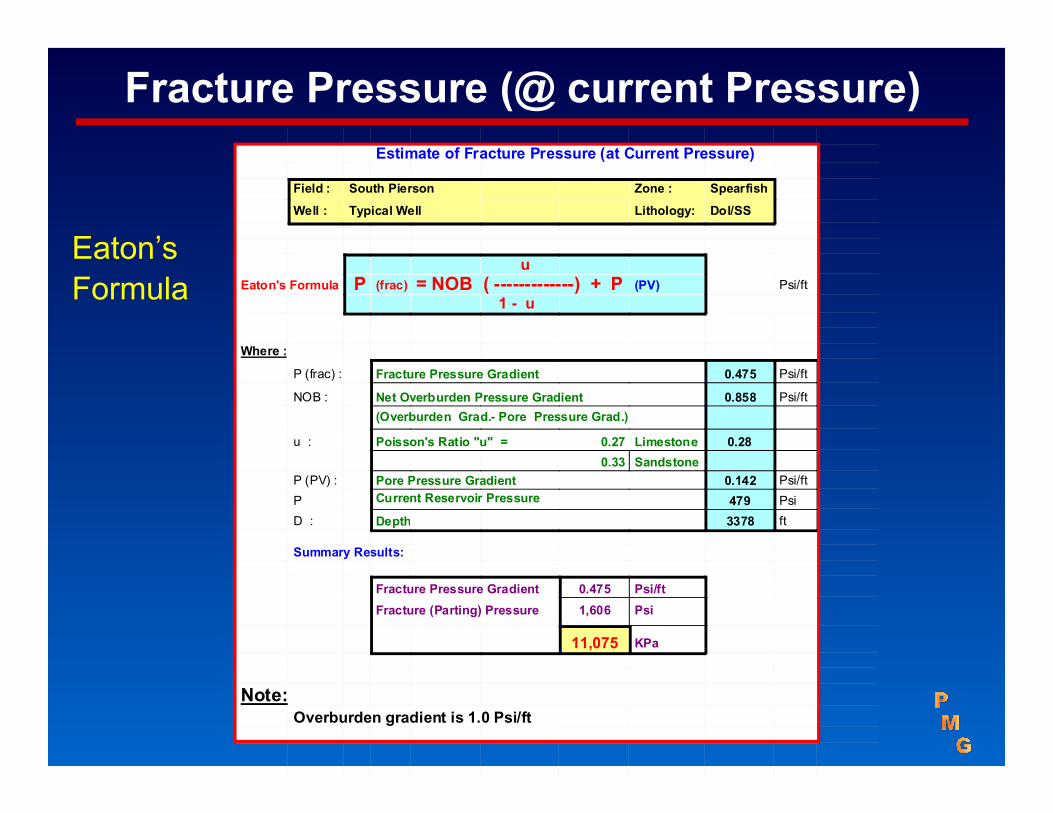
Estimate of Fracture Pressure (at Current Pressure)
SpearfishZone :South PiersonField :
Dol/SSLithology:Typical WellWell :
uPsi/ft(PV)= NOB ( -------------) + P(frac)PEaton's Formula
1 - u
Where :
Psi/ft0.475Fracture Pressure GradientP (frac) :
Psi/ft0.858Net Overburden Pressure GradientNOB :(Overburden Grad.- Pore Pressure Grad.)
0.28Limestone0.27Poisson's Ratio "u" = u :Sandstone0.33
Psi/ft0.142Pore Pressure GradientP (PV) :Psi479Current Reservoir PressurePft3378DepthD :
Summary Results:
Psi/ft0.475Fracture Pressure GradientPsi1,606Fracture (Parting) Pressure
KPa11,075
Note:Overburden gradient is 1.0 Psi/ft
Fracture Pressure (@ current Pressure)
Eaton’sFormula

Interpretations of Step-rate Test
Several operational factors and reservoir parameters caninfluence the interpretation of Step-rate test results, such as:
<The presence of earlier frac <The induced frac propagated into adjacent zones<The change in the injected water quality<Water temperature<Skin factor
Effect of Water Quality
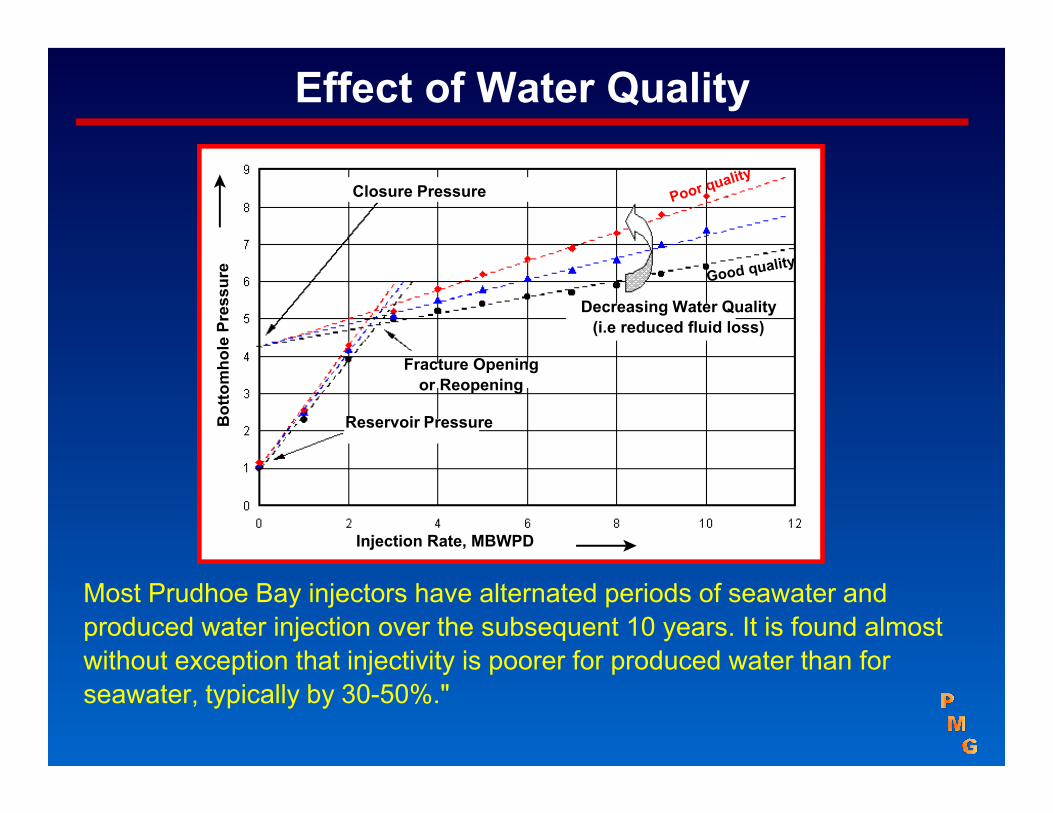
Fracture Openingor Reopening
Reservoir Pressure
Closure Pressure
Decreasing Water Quality(i.e reduced fluid loss)
Injection Rate, MBWPD
Most Prudhoe Bay injectors have alternated periods of seawater andproduced water injection over the subsequent 10 years. It is found almostwithout exception that injectivity is poorer for produced water than forseawater, typically by 30-50%."
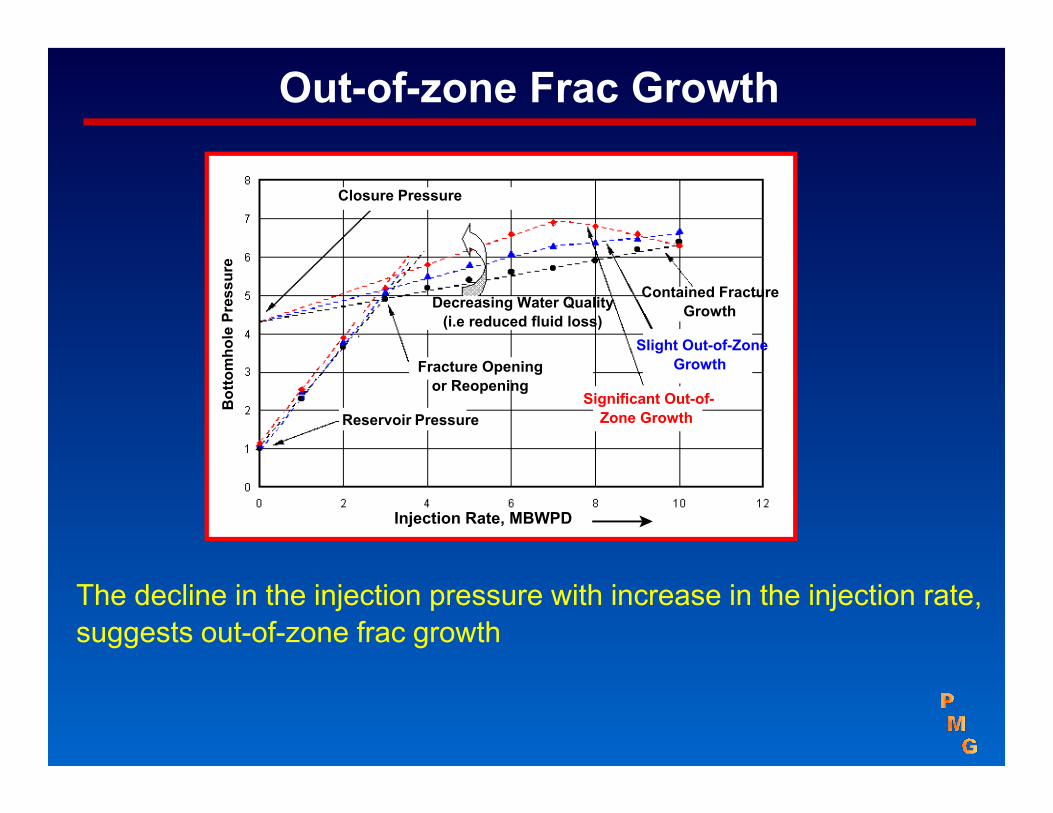
Out-of-zone Frac Growth
Contained FractureGrowth
Slight Out-of-ZoneGrowth
Significant Out-of-Zone Growth Reservoir Pressure
Closure Pressure
Fracture Openingor Reopening
Decreasing Water Quality(i.e reduced fluid loss)
Injection Rate, MBWPD
The decline in the injection pressure with increase in the injection rate,suggests out-of-zone frac growth

Pre-existing Hydraulic Fracture
An idealization of a closed (but still conductive) pre-existing hydraulic fracture.The extrapolation of the matrix injection data yields a straight line interceptvalue much higher the reservoir pressure
Rate
Reservoir Pressure
Fracture open/reopen
Conductivity associated with a pre-existing , normally closed fracture
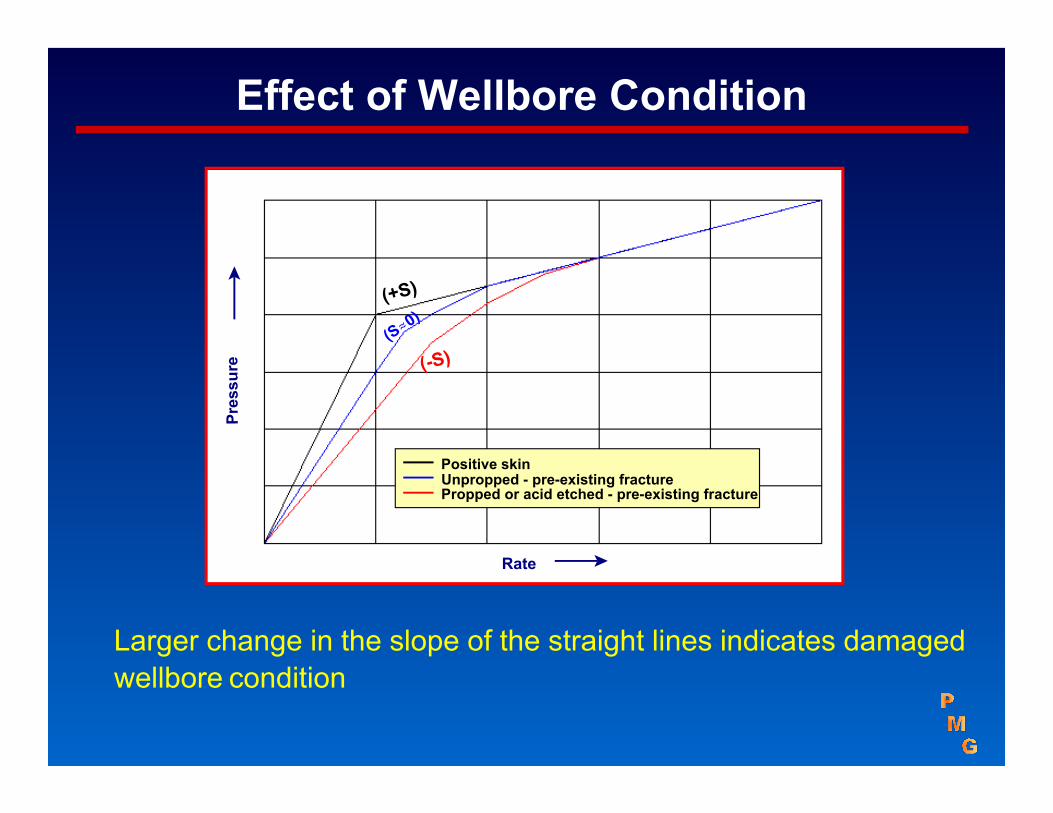
Effect of Wellbore Condition
Rate
Positive skinUnpropped - pre-existing fracturePropped or acid etched - pre-existing fracture
Larger change in the slope of the straight lines indicates damagedwellbore condition

Effect of Other Factors
Multiple straight lines are evident for the following cases:
Rate (m3/d)
< More than one frac opening, or< Variation in step injection time, or< Variation in friction pressure loss

Step-down Test
This test is used to quantify perforation and near-wellbore pressure losses(caused by tortuosity) of frac'd wells, and as a result, provides informationpertinent to the design and execution of the main frac treatments. Step-down tests can be performed during the shut-down sequence of a fracturecalibration test.
Why step-down test?A low injection rate (point #5), willreduce wellbore storage effectsduring the fall-off period, improvingthe analysis results.
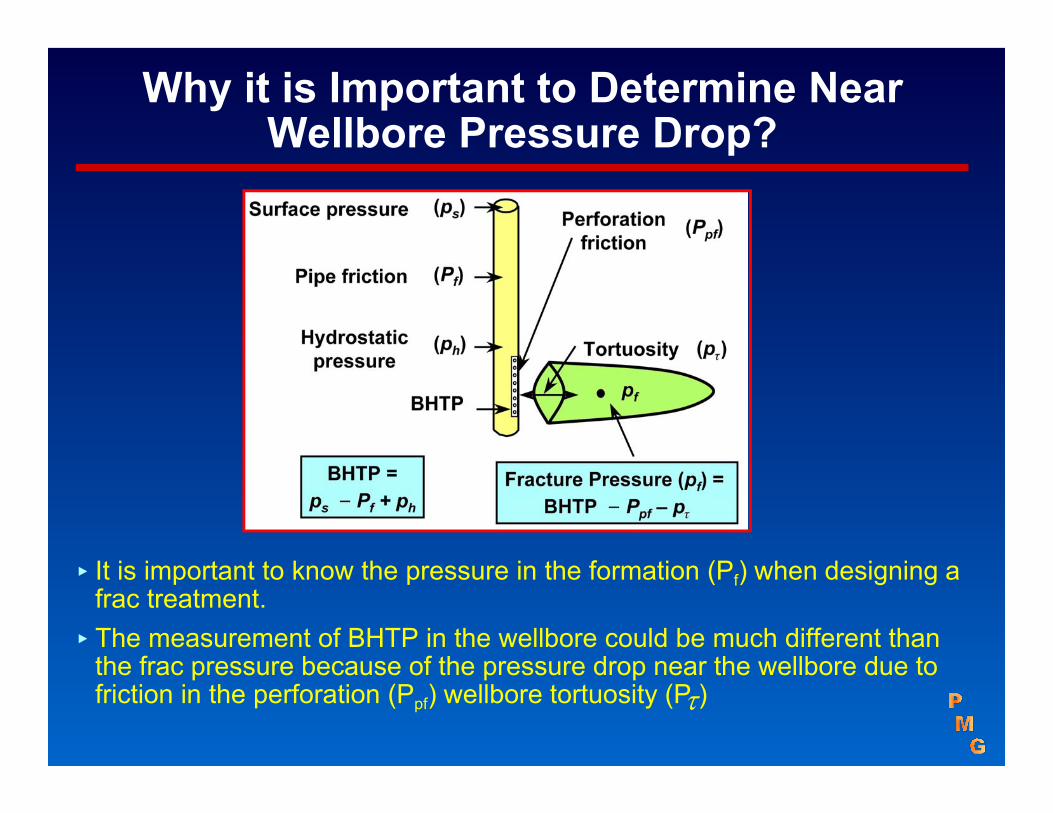
Why it is Important to Determine NearWellbore Pressure Drop?
< It is important to know the pressure in the formation (Pf) when designing afrac treatment.
< The measurement of BHTP in the wellbore could be much different thanthe frac pressure because of the pressure drop near the wellbore due tofriction in the perforation (Ppf) wellbore tortuosity (P )

Design of Step-down Test
Pore pressure
ρmin
Net pressure
PP
Direction of Fracture Growth
Fracturepressure (Pf)
Near-wellbore pressure drop
Fracturetip
< If the net pressure in the fracture is relatively stable, then the change in bottomholeinjection pressure as the injection rate is reduced will be a function of the near-wellbore pressure drop.
< The injection rate is then "reduced in steps" to a rate close to zero< The injection rate at each step should be held constant for approximately 1 minute
so the stabilized injection pressure can be measured
< To measure the near-wellborepressure drop, the net pressure in thefracture needs to be relatively constantduring the step-down portion of thetest.
< To do this, the step-down test isstarted by injecting into the well for 10to 15 minutes. Experience hasshown that, in most cases, the netpressure is relatively stable afterapproximately 10 to 15 minutes ofinjection
BHTP

P K .qperf perf2 K
1.975C .n .dperf
inj
d2
perf2
perf4
C DDD
vena
perf
Perforation Pressure Drop
Where:
- ∆Pperf Perforation pressure drop, psi- q Flow rate, Stb/d- Kperf Perforation pressure drop coefficient, psi/(std/d)2
- γinj Specific gravity of injected fluid- Cd Discharge coefficient, usually 0.95- nperf Number of perforations- dperf Diameter of perforation, in
Flow
DperfDvena

Pressure Drop Due to Wellbore Tortuosity
Wellbore tortuosity can cause a pressure drop of the fracturing fluidsas it passes through a region of restricted flow or complex flow pathbetween the perforations and the main fracture
Maximumhorizontalstress (SH)
Perforations
Minimum horizontalstress (Sh)
Borehole
CementCasing
Charges at 900 phasing
Preferred fracture plane (PFP)
Pinch points
Sh
SH
PFP900
Perforations
Minimum horizontalstress (Sh)
CementCasing
Charges at1800 phasing
Sh
BoreholePreferred fracture
plane (PFP)
External pack
180o
Maximumhorizontalstress (SH)
SH
TSO fracture wing
Perforating in the direction of maximum hz. Stressreduces or eliminates tortuosity, which increasesfracture initiation and treating pressures
Perforating in the other direction thanmaximum hz. stress will increase wellboretortuosity and high wellbore pressure drop
Source: Schlumberger

P K .qtort tort
Tortuosity Pressure Drop
Where:
- ∆Ptort Tortuosity pressure drop, psi- q Flow rate, Stb/d- Ktort Tortuosity pressure drop coefficient, psi/(Stb/d)2
- α Tortuosity pressure drop exponent, usually 0.5
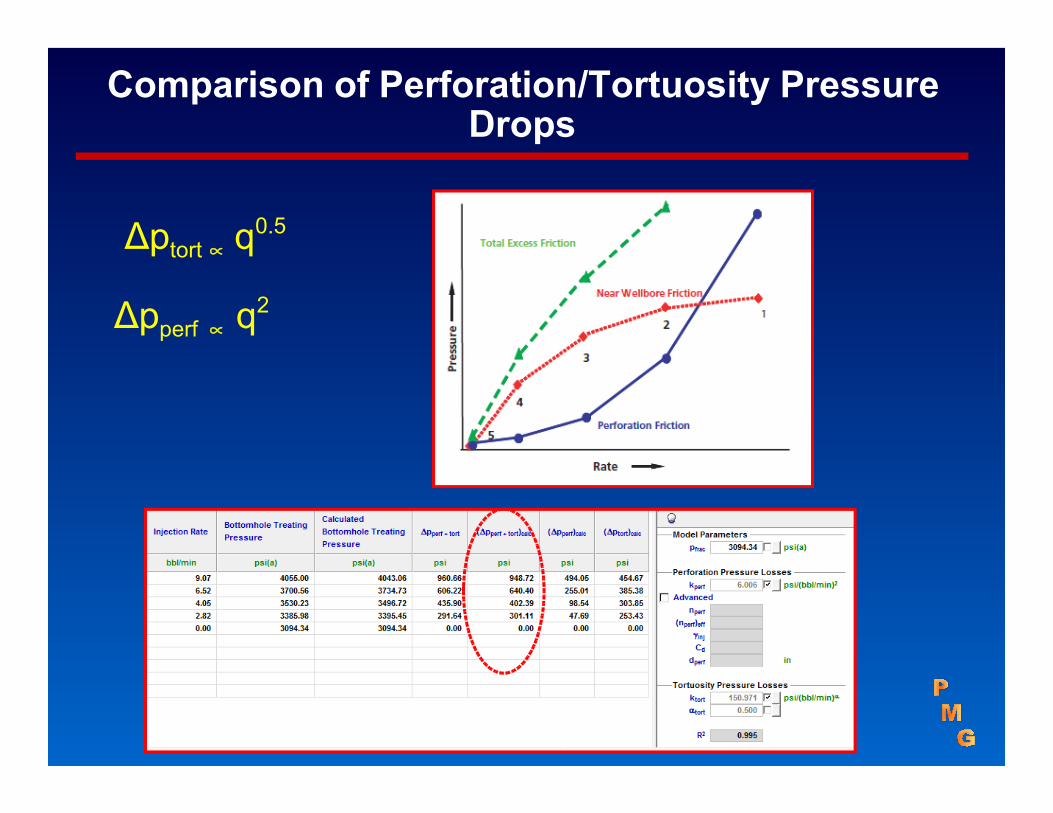
Comparison of Perforation/Tortuosity PressureDrops
∆ptort % q0.5
∆pperf % q2

Injectivity Fall-off Test

Injection/Pressure Profiles
10.0
10.0
tp
∆t
qInjection period
Fall-off
0
Time, hrs
0
Pwf (∆t = 0)
Time, hrs
∆ttp
10.0
0.001 0.01 0.1 1.00.00010
1000
1500
Horner Plot of Fall-off Test
(tp + ∆t)/∆t , hrs
P*
Slope = -m500

Case StudySouth Pierson Unit - Manitoba/Canada

Injectivity Problems

Reasons of Injectivity Problems
<Reservoir pressure declined from 10.6 to 3.3 mPa (V.R.R = 29%)<Formation: Spearfish permeability 1 to 10 mD<Underlaying thief zone: Alida (k up to 100 mD) is taking 75% of
injected water
<Vertical Spearfish injectors averaging only 3 m3/d
<Large Spearfish frac. treatment resulted in communication with theAlida
< Injectivity/fall-off tests indicates that injection has been conductedmuch higher than the formation breakdown pressure
<Large filter size (10 microns) was used allowing deep formationdamage

Typical Injectivity/fall-off Pressure Profile

Diagnostic/Derivative Plot
All flow regimes are well defined, suggesting the well is fraced!, fromthe presence of Linear and Bilinear flow regimes.
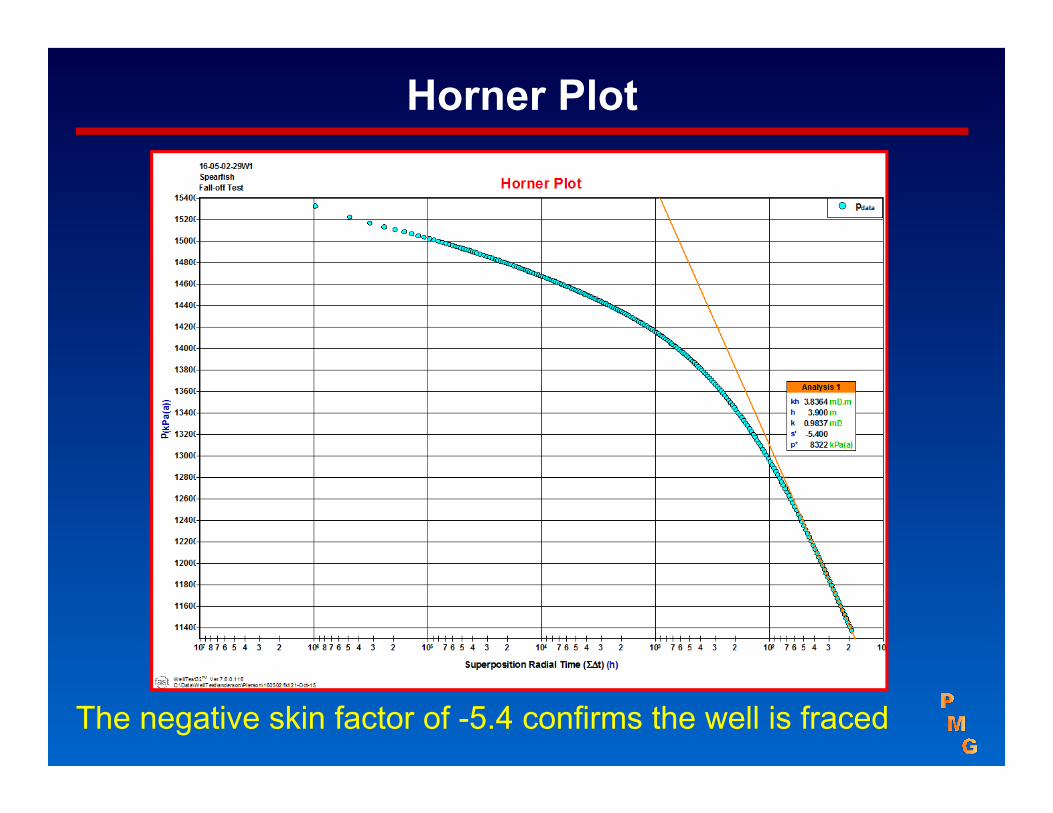
Horner Plot
The negative skin factor of -5.4 confirms the well is fraced
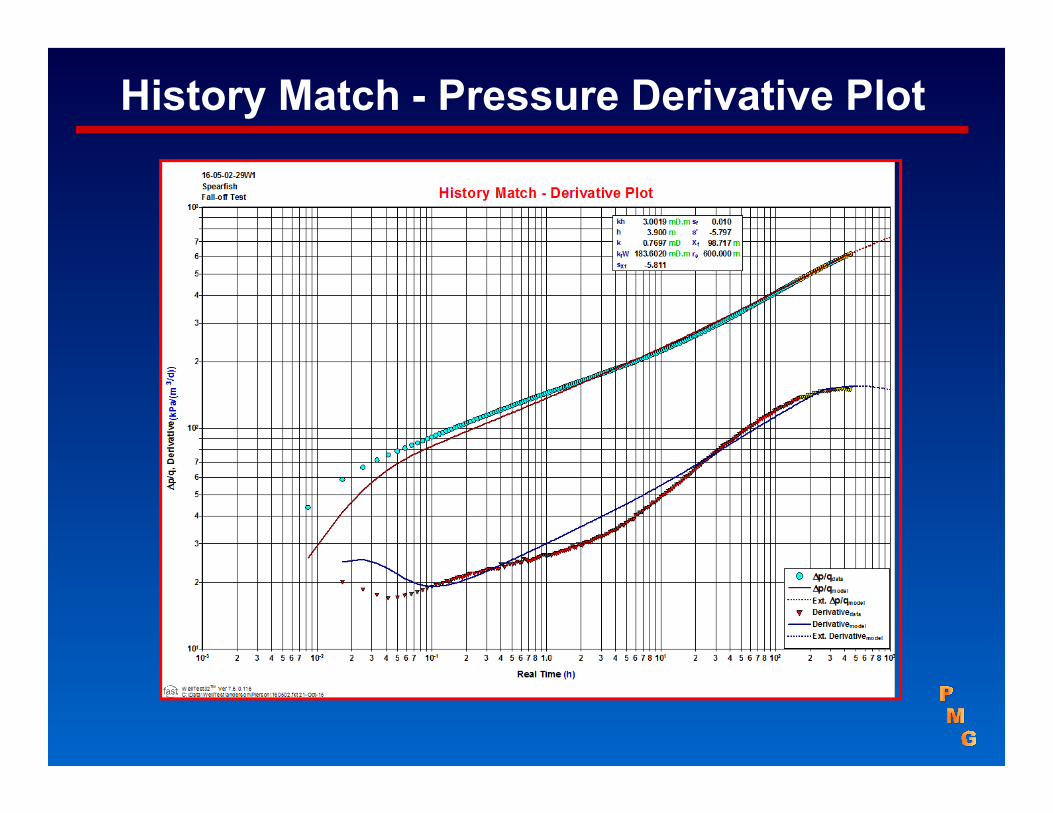
History Match - Pressure Derivative Plot

Major Pressure Anomaly (Fall-off Data)
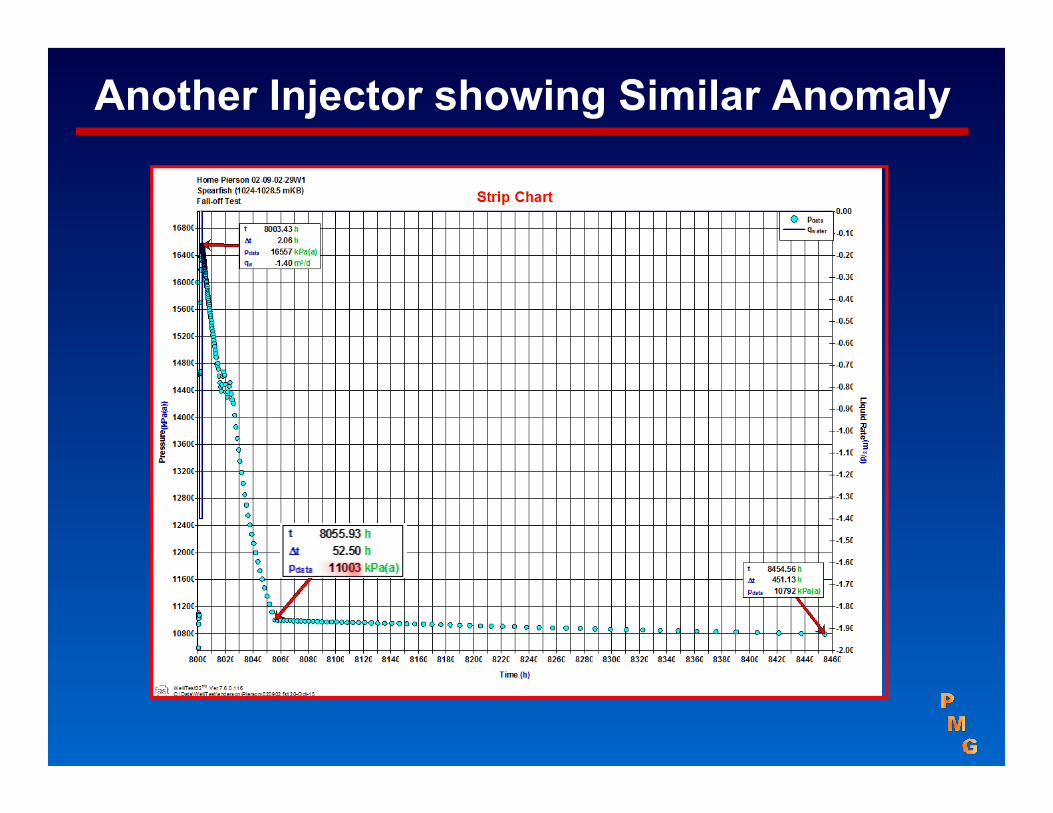
Another Injector showing Similar Anomaly
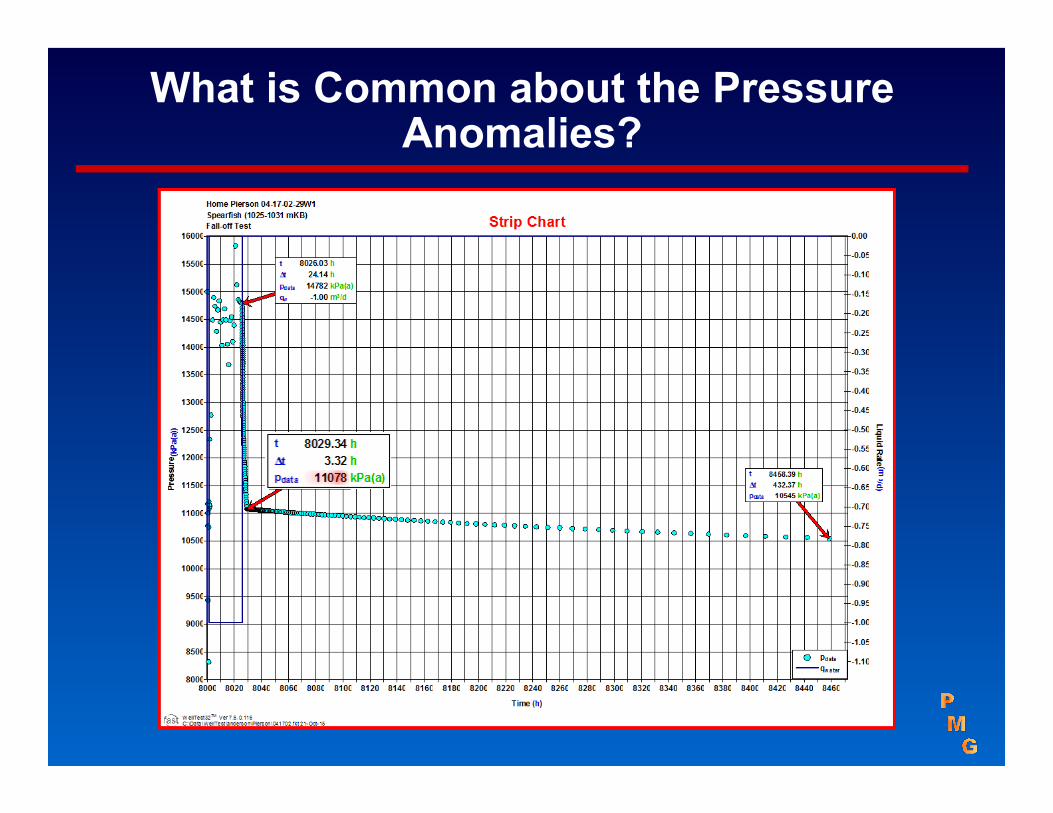
What is Common about the PressureAnomalies?

Estimate of Fracture Pressure (at Current Pressure)
SpearfishZone :South PiersonField :
Dol/SSLithology:Typical WellWell :
uPsi/ft(PV)= NOB ( -------------) + P(frac)PEaton's Formula
1 - u
Where :
Psi/ft0.475Fracture Pressure GradientP (frac) :
Psi/ft0.858Net Overburden Pressure GradientNOB :(Overburden Grad.- Pore Pressure Grad.)
0.28Limestone0.27Poisson's Ratio "u" = u :Sandstone0.33
Psi/ft0.142Pore Pressure GradientP (PV) :Psi479Current Reservoir PressurePft3378DepthD :
Summary Results:
Psi/ft0.475Fracture Pressure GradientPsi1,606Fracture (Parting) Pressure
KPa11,075
Note:Overburden gradient is 1.0 Psi/ft
Fracture Pressure (@ current Pressure)
Eaton’sFormula

Estimate of Fracture Pressure (at Initial Pressure)
SpearfishZone :South PiersonField :Dol/SSLithology:Typical WellWell :
uPsi/ft(PV)= NOB ( ---------------) + P(frac)PEaton's Formula
1 - u
Where :Psi/ft0.667Fracture Pressure GradientP (frac) :Psi/ft0.545Net Overburden Pressure GradientNOB :
(Overburden Grad.- Pore Pressure Grad.)
0.28Limestone0.27Poisson's Ratio "u" = u :Sandstone0.33
Psi/ft0.455Pore Pressure GradientP (PV) :Psi1537Initial Reservoir PressurePft3378DepthD :
Summary Results:
Psi/ft0.667Fracture Pressure GradientPsi2,253Fracture (Parting) Pressure
KPa15,537
Note:Overburden gradient is 1.0 Psi/ft
Fracture Pressure (@ Initial Pressure)
Eaton’sFormula
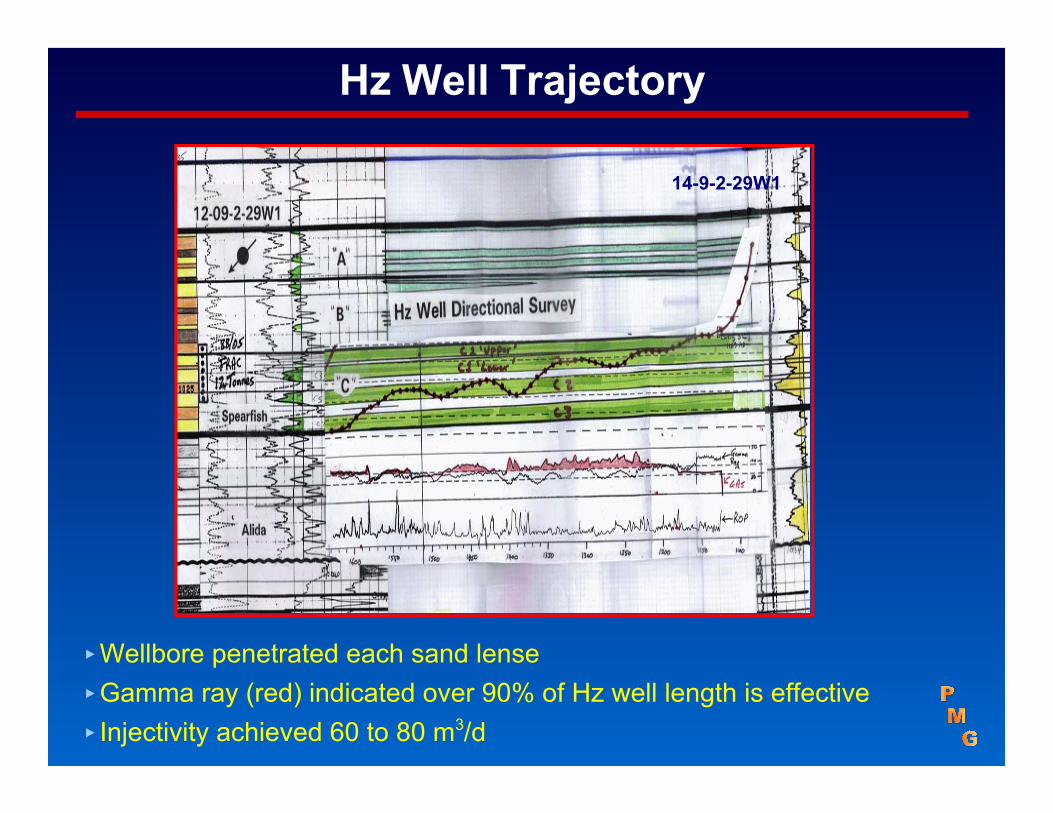
Hz Well Trajectory
14-9-2-29W1
<Wellbore penetrated each sand lense<Gamma ray (red) indicated over 90% of Hz well length is effective < Injectivity achieved 60 to 80 m3/d

Temp Modelling Injectors Reduced - Shortcut.lnk (Command Line)
Monitoring of Injection Conformance
Problems:< Injection profile in multi-layered or several perforating intervals<Presence of thief zones<Fracing into adjacent zones<Behind casing channelling
Diagnoses:
<Production logging tool (PLT)<Temperature survey<Spectral Noise Logs (SNL)
TGT

Injection Testing for Shale Formations
<Traditional well testing techniques are unrealistic for unconventionalreservoirs (it requires very long tests)
<Diagnostic Fracture Injection tests (DFIT)<Nitrogen injection/fall-off tests

N2 Injectivity Fall-off Tests
Lewis ShaleSan Juan Basin
Layer #6 withnatural fracs
Layer #5 withnatural fracs
Why N2 injectivity Test?
< Water injectivity is very poor< Flow/build-up requires long tests< Expensive to test many intervals
for CBM/shale
Ref: SPE: 63091

Hall Plot
The Hall plot was introduced to the industry in 1963, to evaluatewell injectivity problems, as a result of near wellbore conditionchanges which could happen due to:
<Wellbore damage or plugging
<Well stimulation, such as acidizing or fracing (intentional)
<Formation fracturing (non-intentional !)
<Water leakage; behind the casing
Ref: SPE# 30774, by H.N. Hall (1963)
Hall Plot
Applications of the Hall Plot:
< Identify injectivity problems, using trends of injection historydata (injection volumes and injection wellhead pressure)
< Quantify wellbore skin factor without interrupting injectionoperations or conducting any costly well testing !

Hall Plot
< a - b : Gas fill-up< Curve “A”: Normal operation (no change in injectivity)< Curve “D”: Deterioration in wellbore condition< Curve “B”: Improvement in wellbore condition (stimulated)< Curve “C”: Injection water channelling to a different zone
The slope of thestraight line “m” canbe used to determinethe skin factor
m:Slope

Temporary Plugging
Changes in the slope of the Hall Plot typically occur gradually, so several months (6 ormore) of injection history may be needed to reach reliable conclusions about injectionbehaviour . This the temporary anomaly (deviation from the straight line) is due toplugging that disappeared in short time.
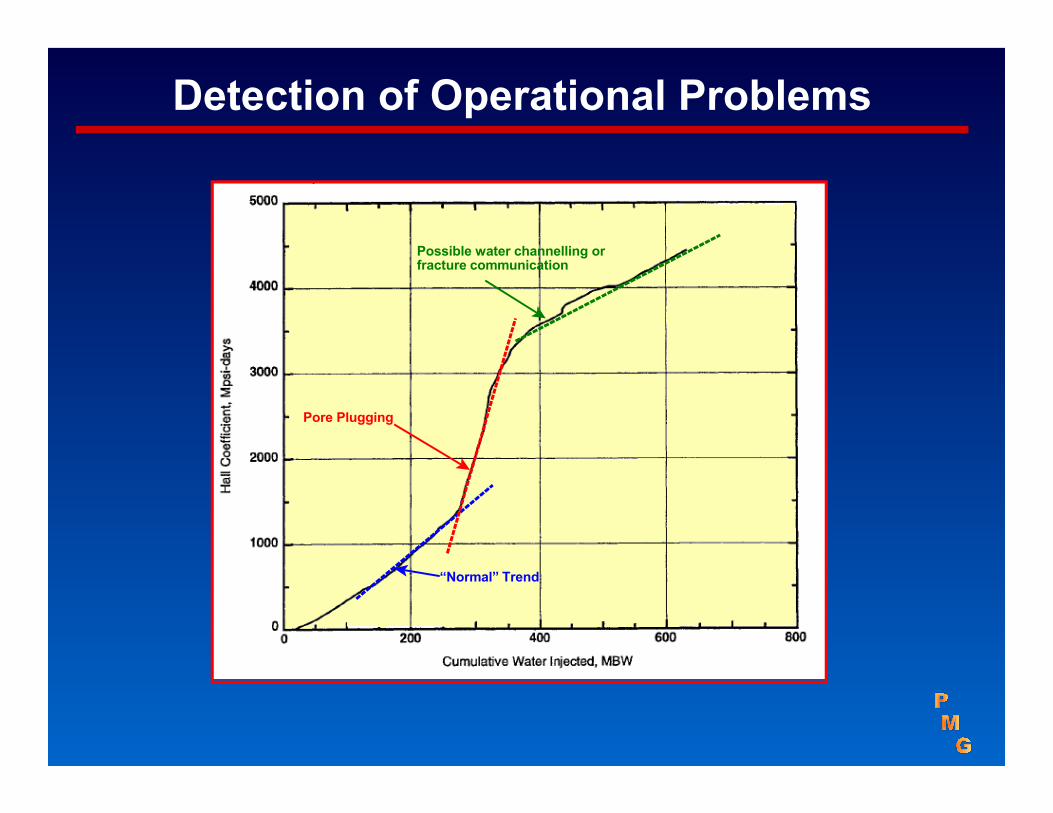
Detection of Operational Problems
“Normal” Trend
Pore Plugging
Possible water channelling orfracture communication

Well Stimulation of Fracturing
“Normal” Trend
Wellbore Stimulation

Increasing Wellbore Damage
“Normal” Trend
WellboreDamage
Wellbore plugging

S S k h
141.2 (m m )2 1 2 1
Hall Plot
The change in the skin factor is estimated from the change inthe slope of the Hall Plot straight line trends
Where:
m2: Slope of the Hall Plot 2nd straight line (most recent data) psi.days/Bbl
m1: Slope of the Hall Plot 1st straight line (initial data) psi.days/Bbl S2: Skin factor at current conditionsS1: Skin factor at initial conditions
Diagnostic Fracture Injection Test (DFIT)(Mini Frac)

Mini Frac Test
<Short injection test (5 to 15 min.), followed by a few hrs of fall-off period<Formation is broken down to allow wellbore/formation communication past
the damaged zone<No proppant is used<Specialized low-rate injection pump, with automated flow rate control by
means of a DCS (Digital Control System)<Provides better results than closed chamber tests
Fracture connects the formation with wellbore;past the damaged zone
Tight formations:Inj rate: 1-7 Bbl/min inj vol: 20-50 Bbl
Cap Rock (Clearwater):
Inj rate: 2 to 150 L/minInj vol. < 7 m3

Information Obtained from DFIT
<Obtain information critical to frac design: • Fracture Propagation Pressure• Instantaneous Shut-in Pressure (ISIP) • Fracture Gradient (ISIP/depth)• Fracture Closure pressure (FCP)• Identify leakoff mechanism - leakoff coefficient
< Identify flow regimes, to confirm reservoir parameters: • Reservoir pore pressure• Formation flow capacity/mobility and Permeability
<Net Fracture Pressure (NFP)• Fracture complexity• Fracture progress/monitoring• Well flowback planning
<Determine completion efficiency• Pressure drop in perforation• Pressure drop as a result of well tortuosity

Fracture Orientation is Controlled by In- Situ Stress Field
σ1 > σ2 > σ3
<σ1 : Overburden stress
<σ2 : Principle (max. stress)
<σ3 : Minimum stress (closure stress)
Where:
7 7 7 6 66Vertical fracture

Why Minimum Stress ( ) is Important to Know?
Proppant collapseDamaged zone
Fluid residue Proppantembedment
Filtercake
<σ1 : Overburden stress<σ2 : Principle (max. stress)<σ3 : Minimum stress (closure stress)
Where:
σ3
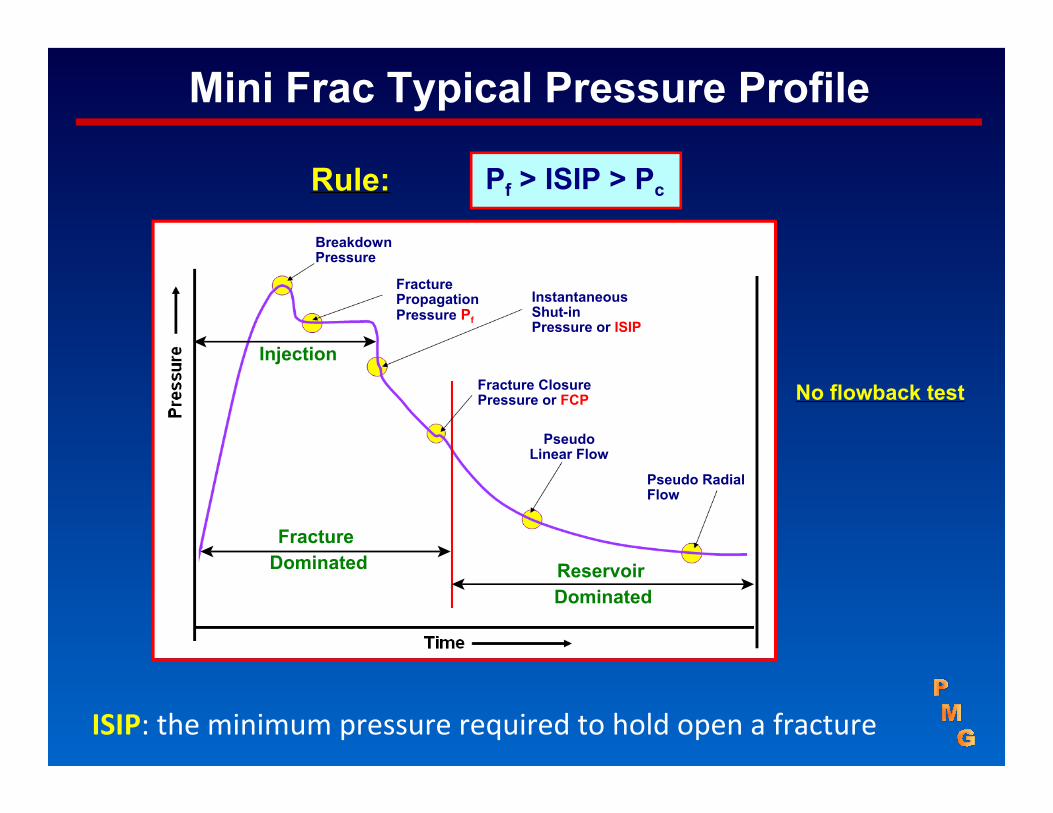
Mini Frac Typical Pressure Profile
Injection
Fracture Dominated Reservoir
Dominated
BreakdownPressure
FracturePropagationPressure Pf
InstantaneousShut-inPressure or ISIP
Fracture ClosurePressure or FCP
PseudoLinear Flow
Pseudo RadialFlow
ISIP: the minimum pressure required to hold open a fracture
Rule:
No flowback test

Fracture Dominated Analysis
Q
ISIP: identified by significant Slope Change

ppD
DDDD
DDD
DD
ttttfor
ttttg
fortttg
gtgtG
5.01sin1
1134
4
5.05.01
5.15.1
0
What is G-Function?
G-function is an analytical technique used to define the closurepressure and the types of leak-off
G-function is a dimensionless function of shut-in time normalized topumping time
By: Kenneth G. Nolte in 1979
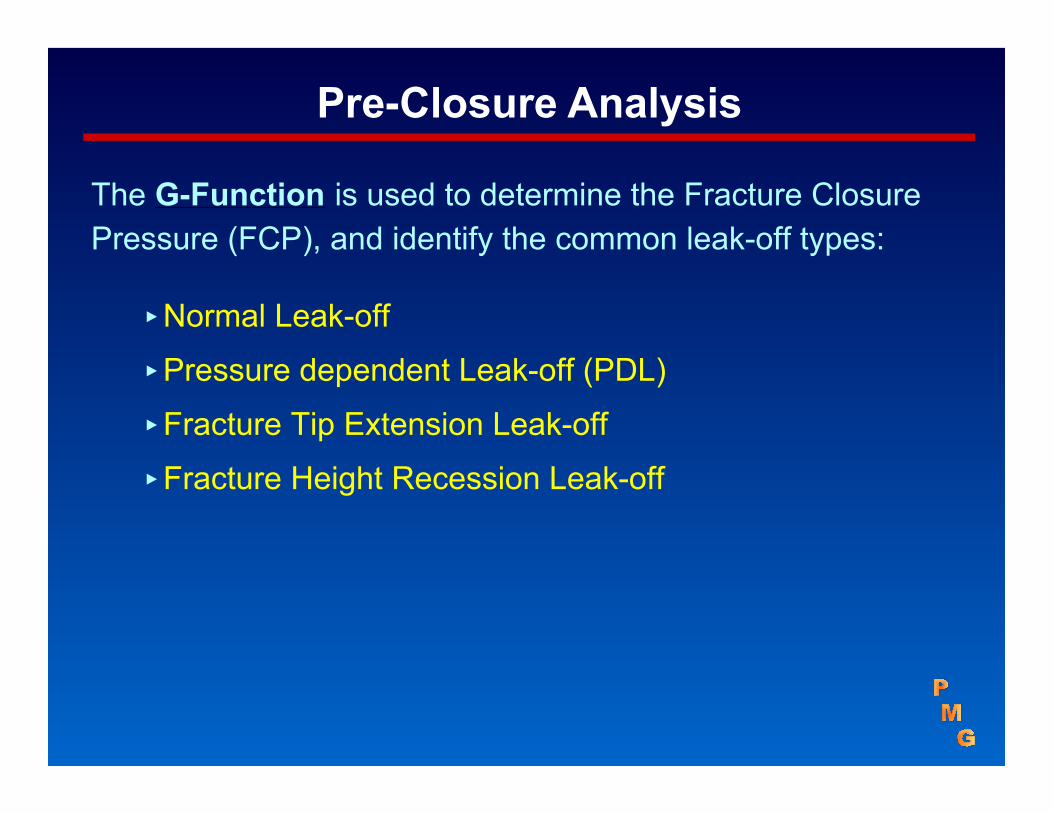
Pre-Closure Analysis
The G-Function is used to determine the Fracture ClosurePressure (FCP), and identify the common leak-off types:
<Normal Leak-off
<Pressure dependent Leak-off (PDL)
<Fracture Tip Extension Leak-off
<Fracture Height Recession Leak-off

Normal Leak-off
Characteristics:
<Pressure derivative (dP/dG) during fracture closure (first derivative)
<The G-Function derivative (G dP/dG) lies on a straight that passes throughthe origin (G-Function derivative) or semi-log derivative
<Deviation of G-Function from the straight line, determines fracture closurepressure (FCP)
Fracture closure
PcOccurs when the fracturearea is constant during shut-in and the leakoff occursthrough a homogeneousrock matrix
When does it occur? PressureFirst derivativeG- derivative
1 80 42 3
Gc
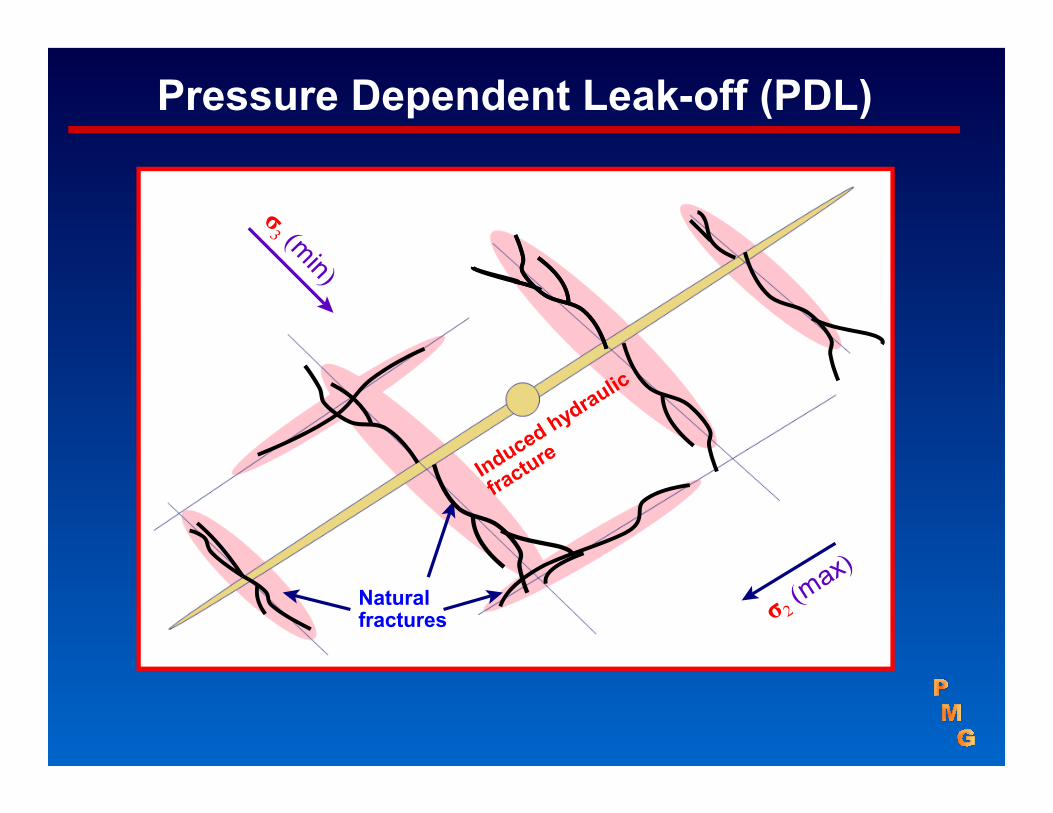
Pressure Dependent Leak-off (PDL)
Naturalfractures

Pressure Dependent Leak-off (PDL)
<G-Function shows a large hump above the straight line<Subsequent to the hump, G-Function shows a normal leak off
(linear trend)<The end of the hump identifies the fissure opening pressure<Deviation of G-Function from the straight line, determines fracture
closure pressure (FCP)
Characteristics:
When secondaryfractures existent in theformation and intersectthe main fracture
When does it occur?
Pc
PressureFirst derivativeG- derivative
Gc
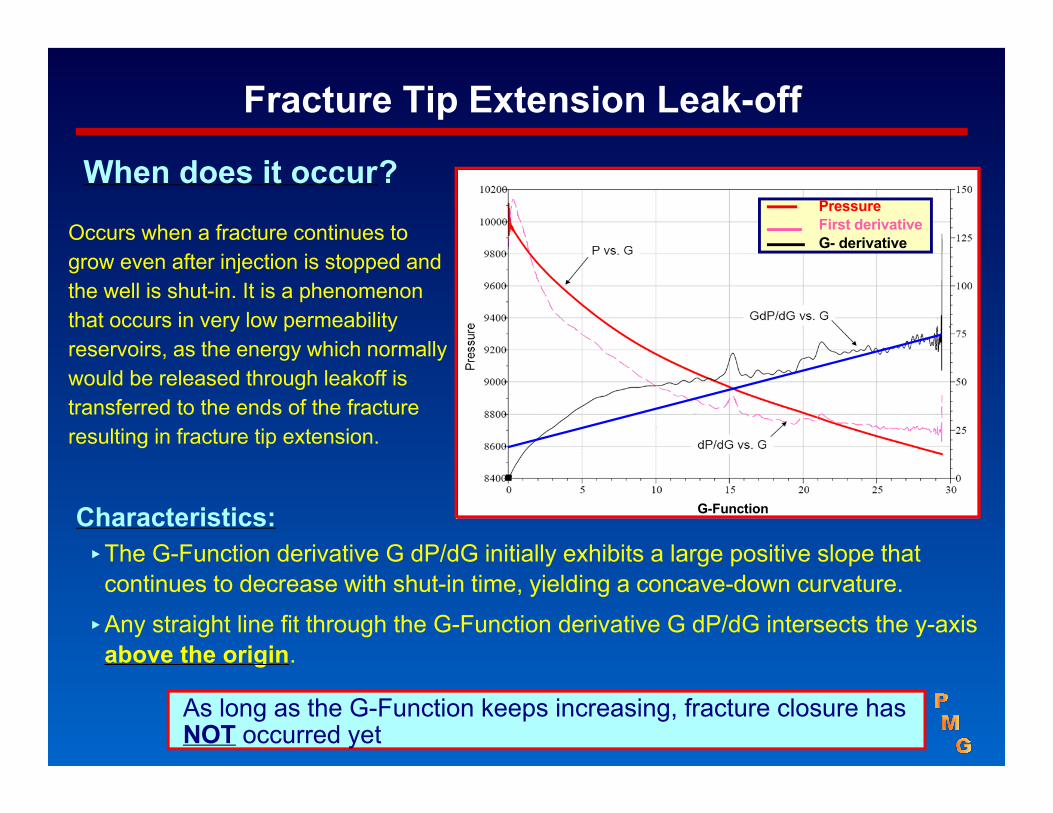
Fracture Tip Extension Leak-off
G-Function
PressureFirst derivativeG- derivative
<The G-Function derivative G dP/dG initially exhibits a large positive slope thatcontinues to decrease with shut-in time, yielding a concave-down curvature.
<Any straight line fit through the G-Function derivative G dP/dG intersects the y-axisabove the origin.
Occurs when a fracture continues togrow even after injection is stopped andthe well is shut-in. It is a phenomenonthat occurs in very low permeabilityreservoirs, as the energy which normallywould be released through leakoff istransferred to the ends of the fractureresulting in fracture tip extension.
When does it occur?
Characteristics:
As long as the G-Function keeps increasing, fracture closure hasNOT occurred yet

Fracture Height Recession Leak-off
Occurs if the fracturepropagates throughadjoining impermeablelayers during injection
When does it occur?
<The G-Function derivative G dP/dG lies below the straight lineextrapolated through the normal leakoff data.
<Both G-Function and the first derivative exhibits a concave up trend
Characteristics:
Pc
PressureFirst derivativeG- derivative
Gc
t
shut - in time
Shut in Time
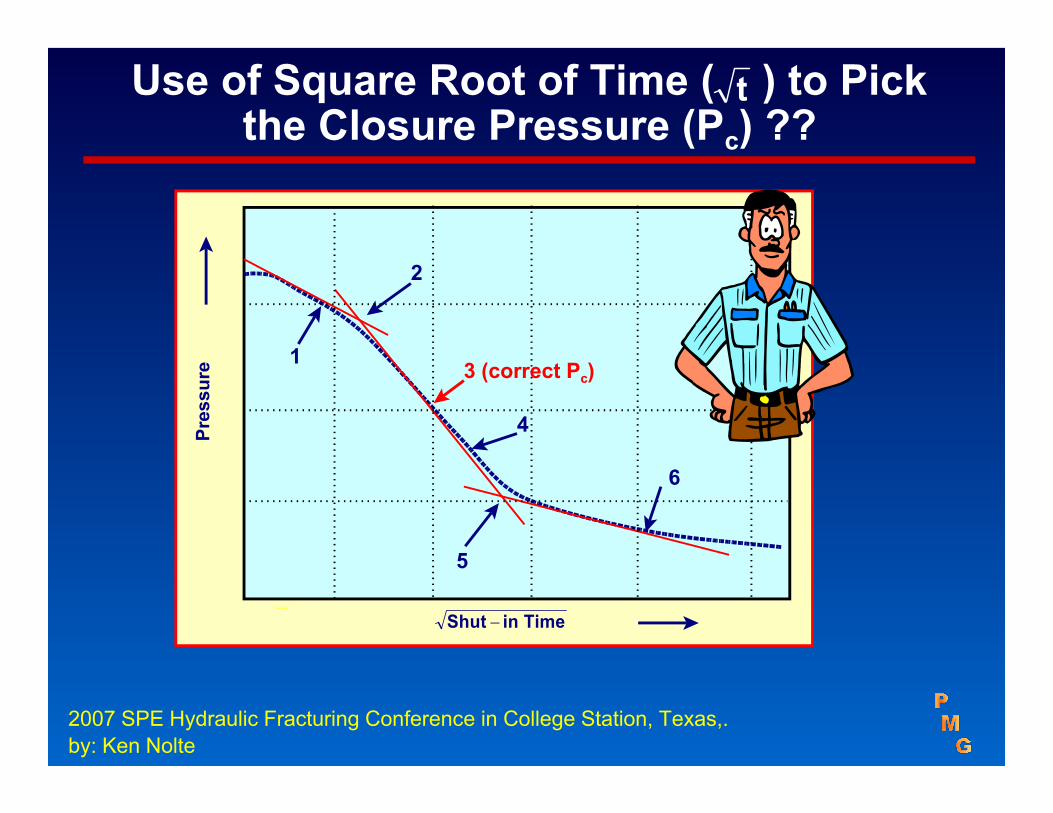
Use of Square Root of Time ( ) to Pickthe Closure Pressure (Pc) ??
1
6
2
5
4
3 (correct Pc)
2007 SPE Hydraulic Fracturing Conference in College Station, Texas,.by: Ken Nolte

t dPd t
dPd t
vs. t
t
dPd t
t dPd t
vs. t
Use of Square-root of Shut-inTime Plot to Confirm Closure Pressure (Pc)
(correct Pc)
G-Function orSemi-log derivative
First derivative
Closure pressure is recognized by a “local” high on the First Derivative plot

After Closure Analysis (ACA)Reservoir Dominated Analysis:
After-Closure Analysis, from Talley et al (SPE 52220)
Fracture ClosurePressure
Pseudo Linear Flow
Pseudo Radial Flow
t d( P)d( t)
.
P
t
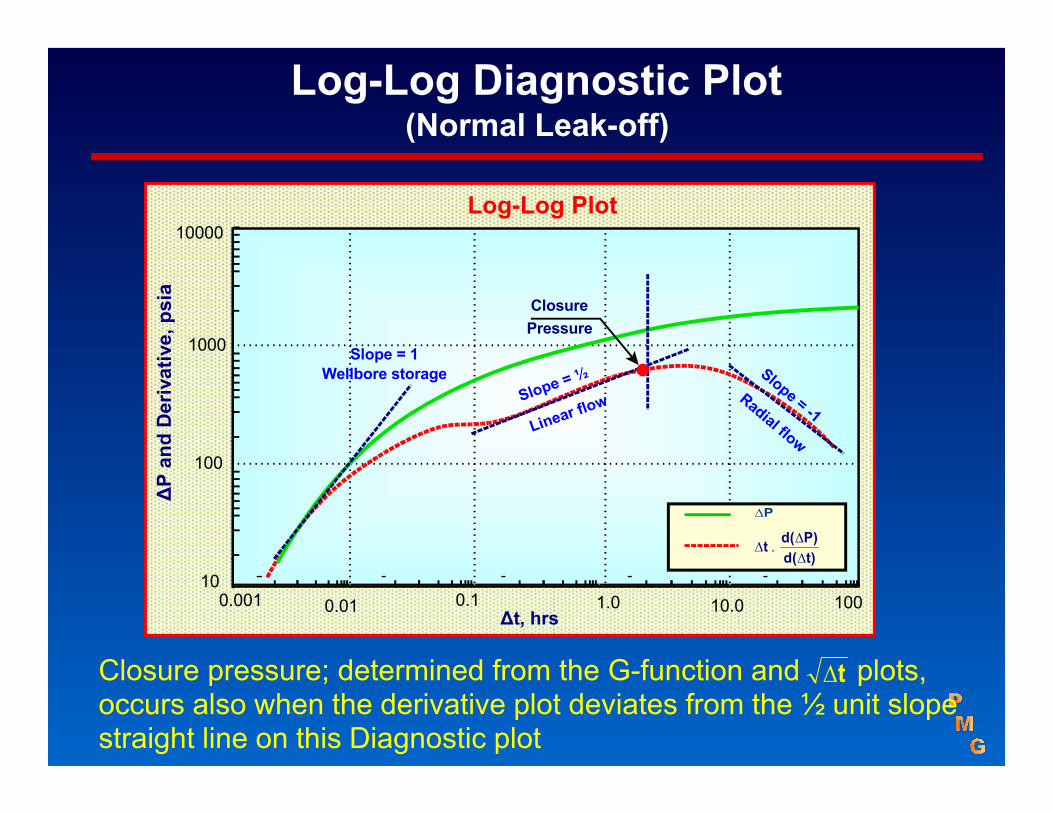
Log-Log Diagnostic Plot(Normal Leak-off)
0.001 0.01 0.1 1.0 10.0∆t, hrs
10
100
1000
10000Log-Log Plot
Slope = 1Wellbore storage
100
Closure pressure; determined from the G-function and plots,occurs also when the derivative plot deviates from the ½ unit slopestraight line on this Diagnostic plot
ClosurePressure
Duverny mini frac - Shortcut.lnk (Command Line)
Case StudyMini Frac
Duvernay Formation
Duvernay Ex

Test Raw Data
Real time pressure measurement was used. Final fall-offperiod extended to 650 hrs (27 days)
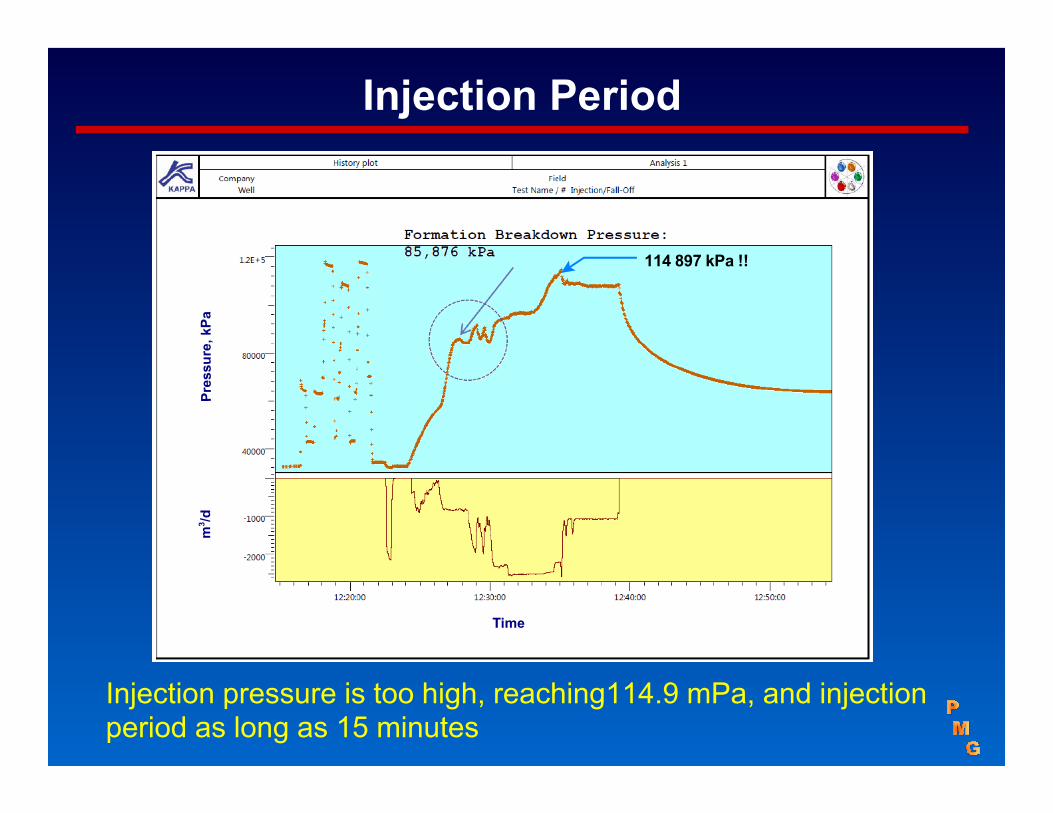
Injection Period
Injection pressure is too high, reaching114.9 mPa, and injectionperiod as long as 15 minutes
114 897 kPa !!

Diagnoses of Flow Regimes
<Pressure derivative plot showed a straight line with a slope of -1 after only 20 hrs ofshutin. Has radial flow really been reached??
<Departure of derivative from ½ slope, confirms closure pressure
∆t, hrs
Log-Log Diagnostic Plot
Start of RadialFlow (slope=-1)
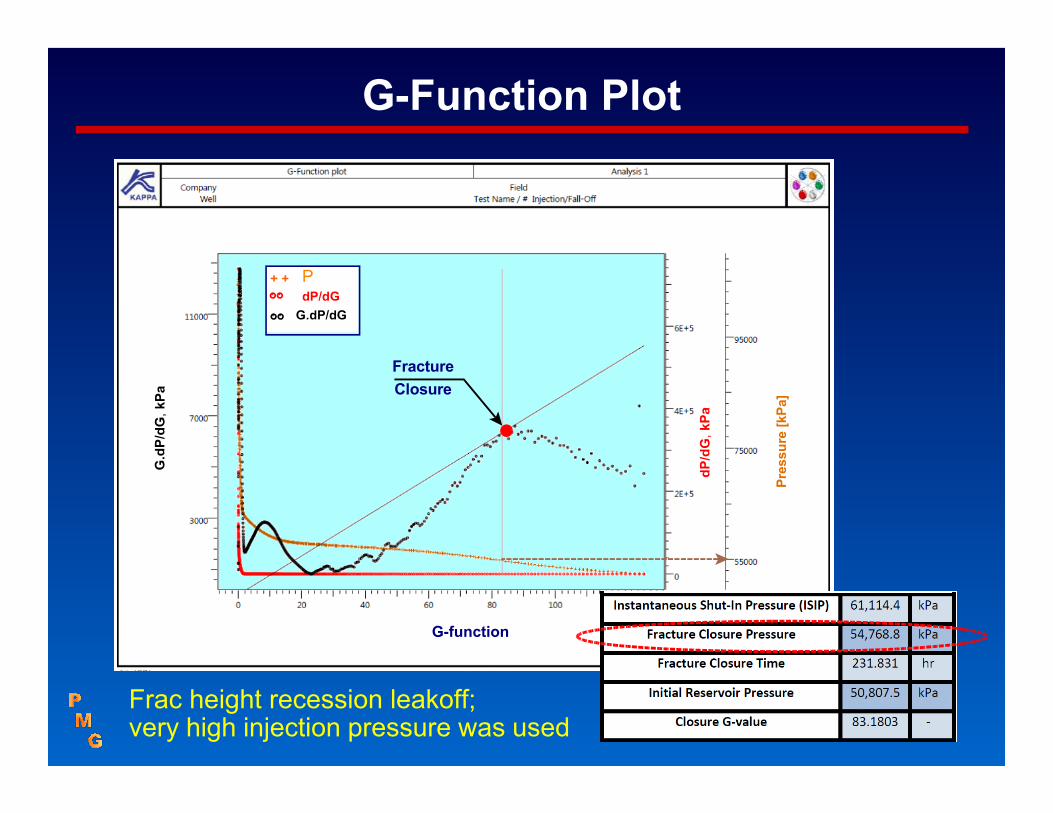
G-Function Plot
G-function
FractureClosure
Frac height recession leakoff; very high injection pressure was used

t dPd t
dPd t
t . dP / d tdP / t
Identification of Closure Pressure (Square Root Plot)
Closure pressure is confirmed by a “local” high of the square root plot
Square root of time
FractureClosure

Radial Flow Analysis (ACA)
Radial Flow (FR)
Mobility (k/u) = 0.00937 K = 0.00937 x 0.033 = 0.0003 md
Start of RadialFlow Regime

Horner Plot
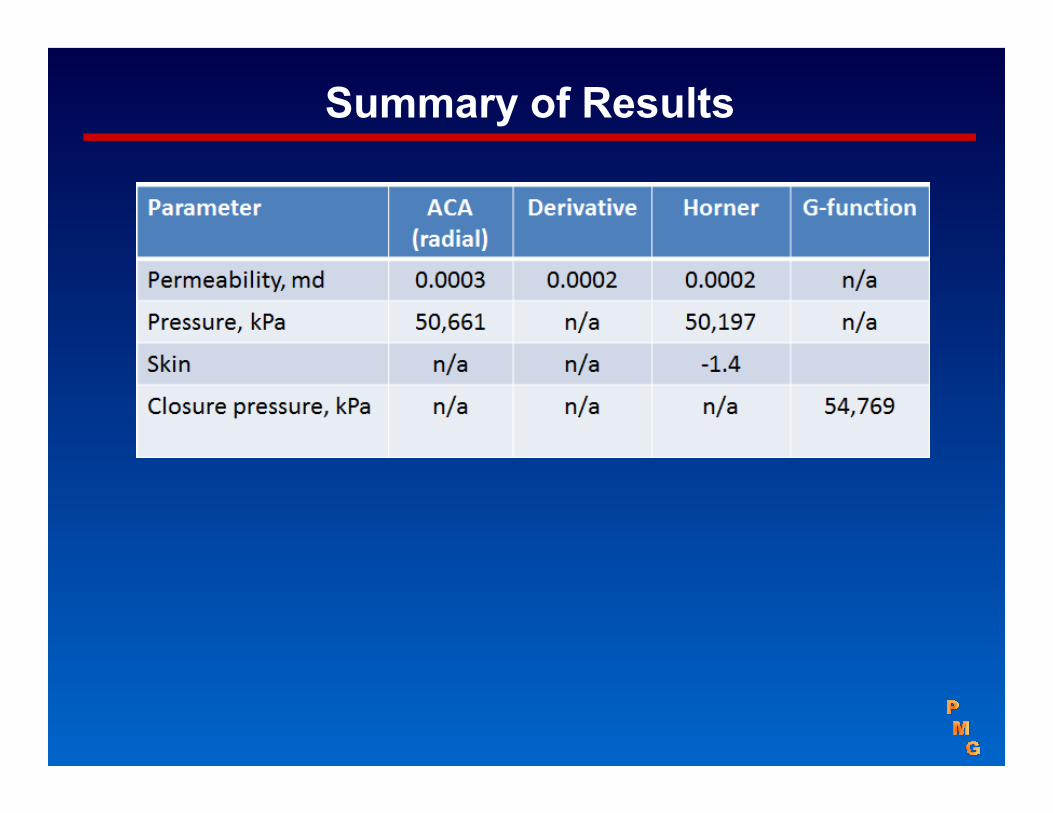
Summary of Results

Control of Well Flow-back
Design criteria:
<Proppant strength (σprop), type, and concentration areselected to ensure it can withstand the local stresses in therock (Pc); otherwise it could get crushed and the fracturebecomes in-effective
< Increased draw-down, during the cleaning period (flow-back),can result in poor frac characteristics
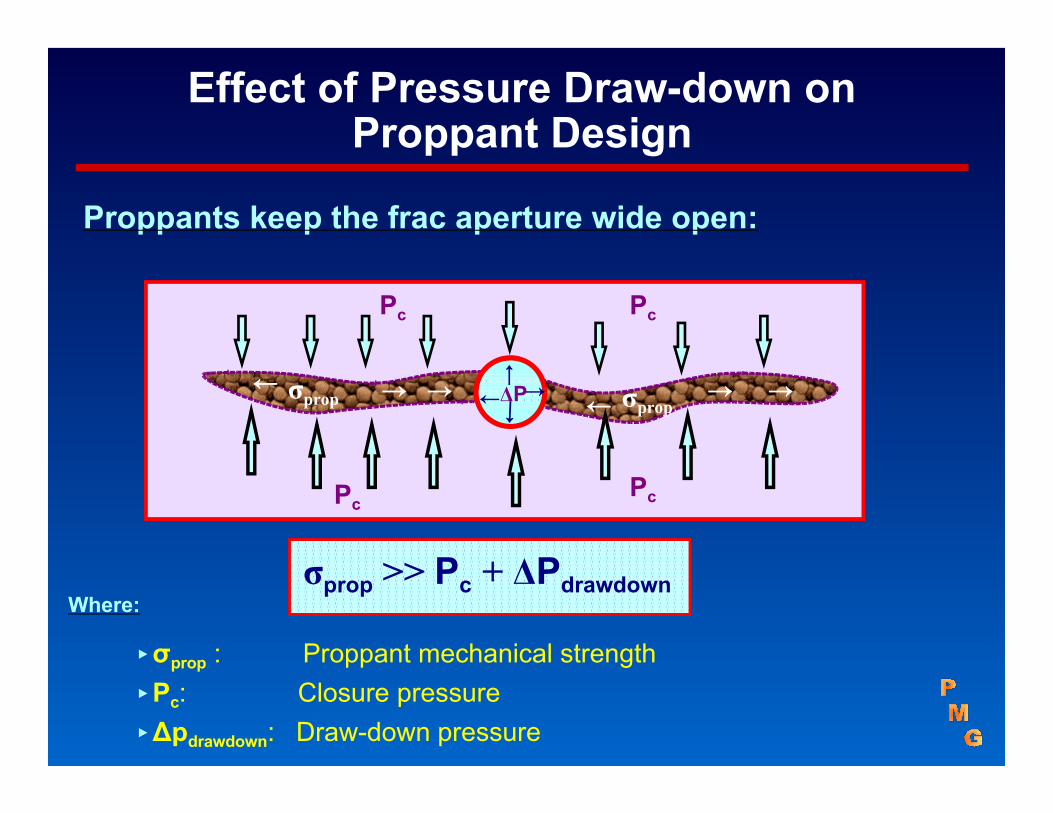
Effect of Pressure Draw-down onProppant Design
σprop >> Pc + ΔPdrawdown
σprop σprop
PcPc
PcPc
ΔP 67 66 7 7 66
Proppants keep the frac aperture wide open:
Where:
<σprop : Proppant mechanical strength<Pc: Closure pressure<∆pdrawdown: Draw-down pressure
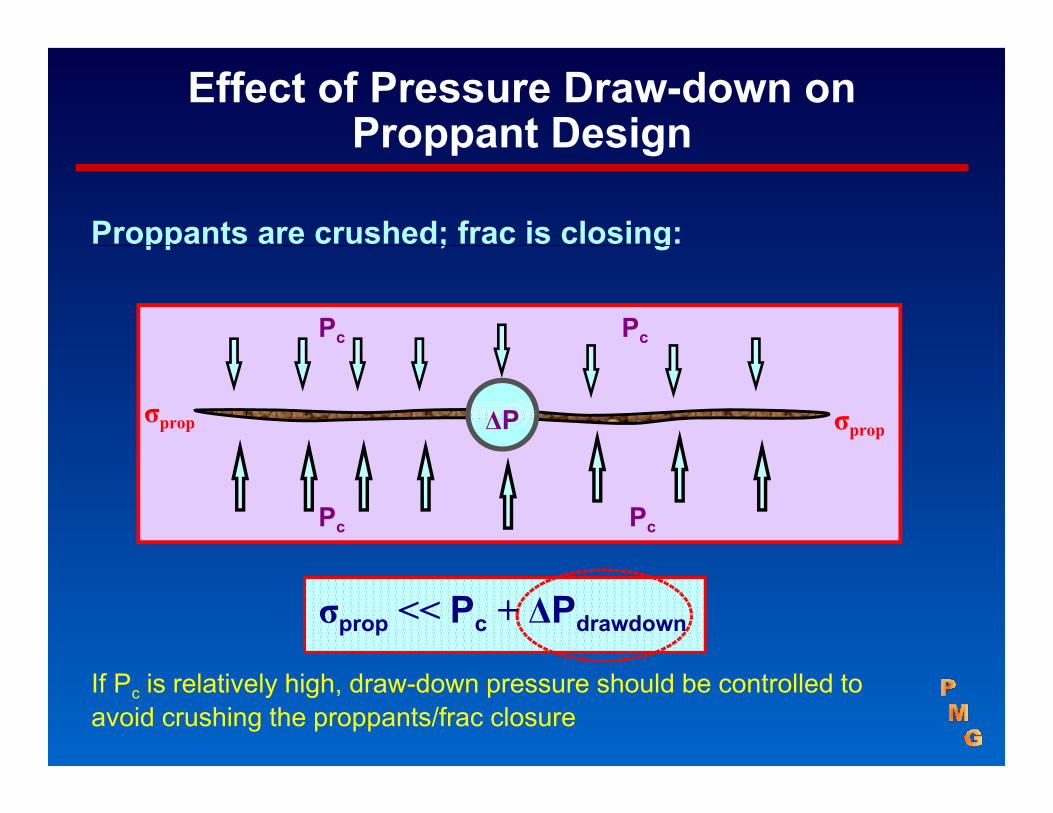
Effect of Pressure Draw-down onProppant Design
σprop σprop
Pc Pc
Pc Pc
ΔP
σprop << Pc + ΔPdrawdown
Proppants are crushed; frac is closing:
If Pc is relatively high, draw-down pressure should be controlled toavoid crushing the proppants/frac closure
Case StudyImpact of Well Flowback on Performance
(Haynesville Shale Gas)
SPE: 144425

Stratigraphy
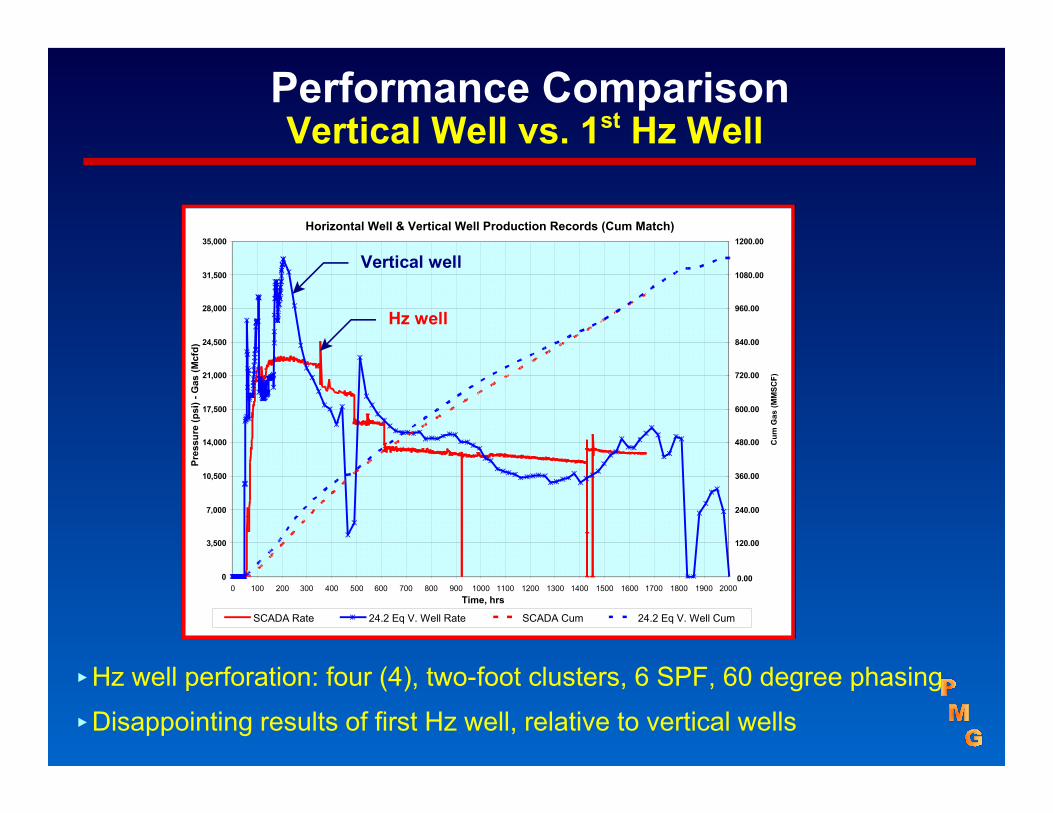
Performance ComparisonVertical Well vs. 1st Hz Well
Horizontal Well & Vertical Well Production Records (Cum Match)
0
3,500
7,000
10,500
14,000
17,500
21,000
24,500
28,000
31,500
35,000
0 100 200 300 400 500 600 700 800 900 1000 1100 1200 1300 1400 1500 1600 1700 1800 1900 2000Time, hrs
0.00
120.00
240.00
360.00
480.00
600.00
720.00
840.00
960.00
1080.00
1200.00
SCADA Rate 24.2 Eq V. Well Rate SCADA Cum 24.2 Eq V. Well Cum
<Hz well perforation: four (4), two-foot clusters, 6 SPF, 60 degree phasing
<Disappointing results of first Hz well, relative to vertical wells

Critical Draw-down Pressure
5 10 15 20 25G(Time)
11200
11300
11400
11500
11600
11700
11800
11900
12000
12100
12200A
0
250
500
750
1000
1250E
(0.002, 0)
(m = 46.06)
(22.14, 1020)
(Y = 0)
Bottom Hole Calc Pressure (psi)Corrected Pressure (psi)G*dP/dG (psi)
AAE
1
1 ClosureTime
17.16BHCP11603
CP11559
DP488.1
FE90.14
DT1225
Critical draw-down pressure = Closure pressure - Reservoir pressure = 11,603 - 11,108 = 488 psi
Highest Pc = 11,603 psi
Fracture could close if, during the flow-back, the wellcritical draw-down is exceeded

Draw-down Exceeded Critical Limit
Horizontal Well Drawdown Estimates
1,000
10,000
100,000
12/03/08 12/13/08 12/23/08 01/02/09 01/12/09 01/22/09 02/01/09 02/11/09 02/21/09
Date
1000
10000
100000
Rate (MSCFD) Actual WHFP (psi) Estimated BHFP (psi) Critical Drawdown (psi) Estimated Drawdown (psi)
100
1000
Critical draw-downpressure . 488 psi
qg . 22 MMscf/d
Initial gas rate of 22 MMscf/d was maintained only for one week

Draw-down Below Critical Limit(one month of flow-back)
100
1000
qg . 22 MMscf/d
Critical draw-downpressure . 488 psi
Gas rate out-performed previous case for over a month
Drawdown

Closing Comments
<To assist in monitoring/improving injectivity for waterflood anddisposal projects
<Set a sealing of steam injection pressure in thermal recoveryprojects
<The closure pressure, from DFIT, is used to estimate thecritical draw-down during a well flowback to avoid poor fracperformance
Benefits of Injectivity tests

Thank You

Petro Management Group Quality Petroleum Engineering Consultants
How to contact us ??
<E-mail: [email protected] <Phone: (403) 216-5101<Cell: (403) 616-8330<Fax: (403) 216-5109<Address: #401, 100 - 4th Ave. S.W. Calgary, Alberta, Canada T2P 3N2