Embed Size (px)
Citation preview

Overview of the papers presented at the IWSM 2014 of interest to
the COSMIC community
Charles Symons
October 2014

10/04/2014 22
Introduction
These slides give a very brief overview of some of the ~60 papers
given at the very good International Workshop on Software
Measurement, that may be of interest to users of the COSMIC FSM
method.
The choice of papers mentioned here is entirely personal. I did not
attend all of the presentations, so please excuse any inaccurate
reporting. Likewise, the few opinions expressed are my personal
comments, not that of the authors.
Note:
When the heading of a slide is underlined, this indicates a new topic.
All text in italics is either the title of a paper or is a quote of text from
the paper.

IWSM 2014 / NESMA 25th Anniversary Conference
10/04/2014 3
• ~ 60 papers, workshops, etc. very good quality
• 135 attendees• NESMA now an
‘international brand’ www.nesma.org
All papers available via: webstore.computer.org
Slides for the presentations available via: slideshare.net/nesma-nl, linked with this icon

Keynote: further progress with using COSMIC at Renault
“Manage the automotive embedded software development cost & productivity with the automation of a Functional Size Measurement Method (COSMIC)” Alexandre Oriou et al
• 50 – 100 Electronic Control Units (ECU’s) per car, getting bigger and bigger
• ECU designs in Simulink, size measured automatically at ‘block’ level
• Example Body Control ECU: size 2000 CFP, 4 days to measure manually
• Entire Simulink model: 4670 blocks, 1 hour to measure automatically
10/04/2014 4

Some results
10/04/2014 5
Body Control ECU. Effort vs CFP
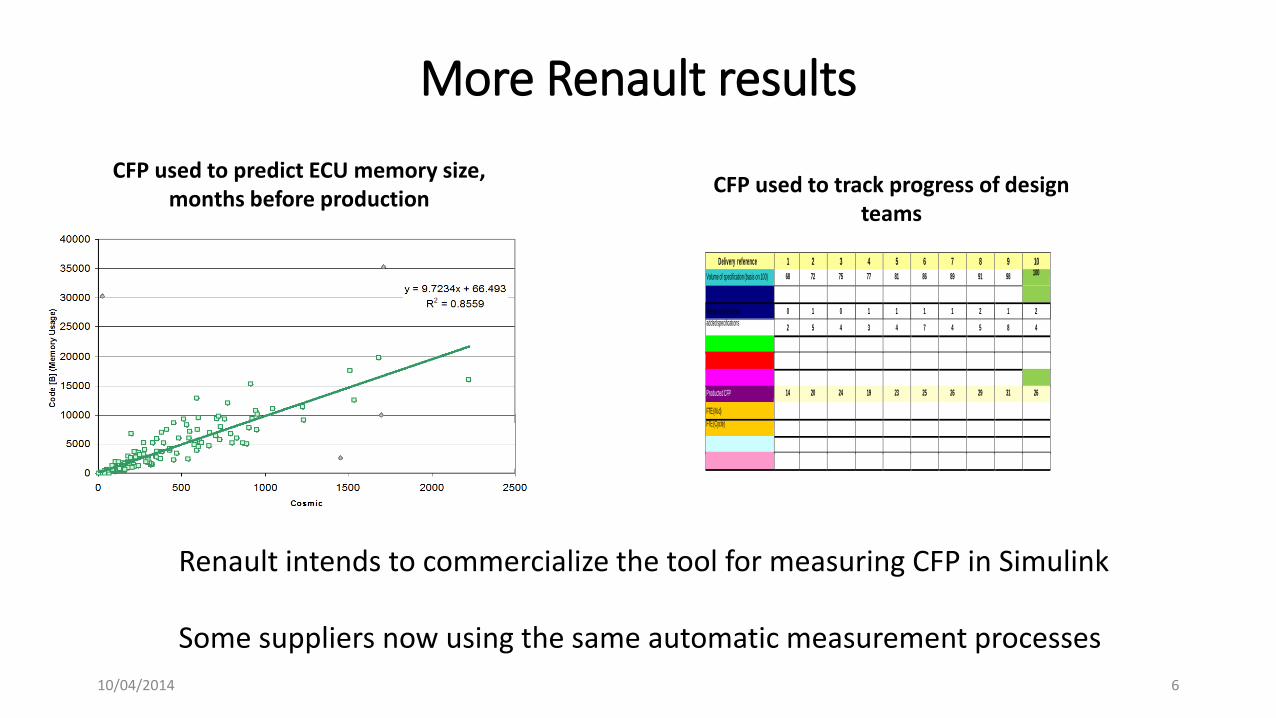
More Renault results
10/04/2014 6
CFP used to predict ECU memory size, months before production
Delivery reference 1 2 3 4 5 6 7 8 9 10
Volume of specification (basis on 100) 68 72 75 77 81 86 89 91 98 100
deleted specifications 0 1 0 1 1 1 1 2 1 2
added specifications 2 5 4 3 4 7 4 5 8 4
Producted CFP 14 20 24 19 23 25 26 29 31 26
FTE (M.d)
FTE (Cycle)
CFP used to track progress of design teams
Renault intends to commercialize the tool for measuring CFP in Simulink
Some suppliers now using the same automatic measurement processes

Functional Size Measurement automation
• (See Renault Keynote) + “Verifying the Accuracy of Automation Tools for the Measurement of Software with COSMIC – ISO 19761 including an AUTOSAR-based Example and a Case Study”, Hassan Soubra, etc, Esteca, France
• “Automatic COSMIC sizing of requirements held in UML”, Jaroslaw Swierczek, 300 D&C, Warsaw, Poland in the ‘COSMIC Masterclass’
• “Measuring COSMIC software size from functional execution traces of Java Business Applications”, Ayca Tarhan et al, Hacettepe University, Ankara, Turkey
• “Automated Functional Size estimation using Business Process Models with UPROM Method”, Banu Aysolmaz, etc. METU, Ankara, Turkey
• CAST automation of FPA from source code, discussed in ‘Lies, damned lies and software metrics”, Charles Symons.
10/04/2014 7

Summary of four approaches to automatic CFP measurement
10/04/2014 8
Source
Renault
300 DC
METU
Tarhan
Input
Simulink blocks
UML MSD’s
Event-driven Process Chain
Executing Java code
Process
Proprietary tool
Creative CommonLicence tool
‘UPROM tool’
Advanced prototype
Output
CFP
CFP
CFP
CFP & UML MSD’s
Status
Production
Just available
?
Demonstrated to work

300 D&C tool: some details
• Pure UML: to work for new developments and enhancement• Assumptions: Use Case ≡ Functional Process; Data Class ≡ Data Group• Tool has been developed for Enterprise Architect from Sparx Company but
standard proposal is not limited to that software
• Tool consists of:
• MDG
• Validation scripts
• Measurement scripts
• Documentation generation scripts
http://300dc.pl/oferta/standardy-modelowania/
10/04/2014 9

CAST Automation of IFPUG measurement
“CAST Automated Function Points (AFP) capability is an automatic function points counting method based on the rules defined by the IFPUG.CAST automates this counting process by using the structural information retrieved by source code analysis, database structure and transactions.”www.castsoftware.com/products/automated-function-points
Note: AFP measurements conform to the OMG Automated Function Point Standard http://www.omg.org/spec/AFP, which does not distinguish EO’s and EQ’s. So technically the CAST claim that it measures ‘based on’ IFPUG rules is true, but easily misunderstood. CAST counters that its AFP tool provides a consistent and rapid functional size measure, which is what interests most CEO’s.
10/04/2014 10

Using COSMIC to measure mobile apps
“Defect Density Measurements Using COSMIC. Experiences with Mobile Apps and Embedded Systems”, Thomas Fehlmann, etc, Europroject Office, Switzerland
Uses UML models; ties defects to individual data movements
10/04/2014 11
“Defect Density Measurements Using COSMIC: Experiences with Mobile Apps and Embedded Systems”, Harold van Heeringen, etc, Sogeti, Netherlands
(This approach assumes all data storage and retrieval takes place in another layer, so unnecessarily replaces Reads and Writes with Exit/Entry pairs. Otherwise, an interesting confirmation of successful use of COSMIC to measure mobile apps.)

(Measurement of) Non-functional Requirements
“The COSMIC approach for dealing with Non-Functional Requirements (NFR)”, Chris Woodward, in the ‘COSMIC Masterclass’
“Estimating the Cost of Heterogeneous Solutions”, Eltjo Poort, Eric van Vliet, CGI
“Sizing the Entire Development Process Functional and Non-Functional Perspectives” (aka ‘SNAP’), Mauricio Aguiar, Luigi Buglione (IFPUG)
“Empirical-based extension of the COSMIC FP method”, Reiner Dumke et al, University of Magdeburg, Germany
10/04/2014 12
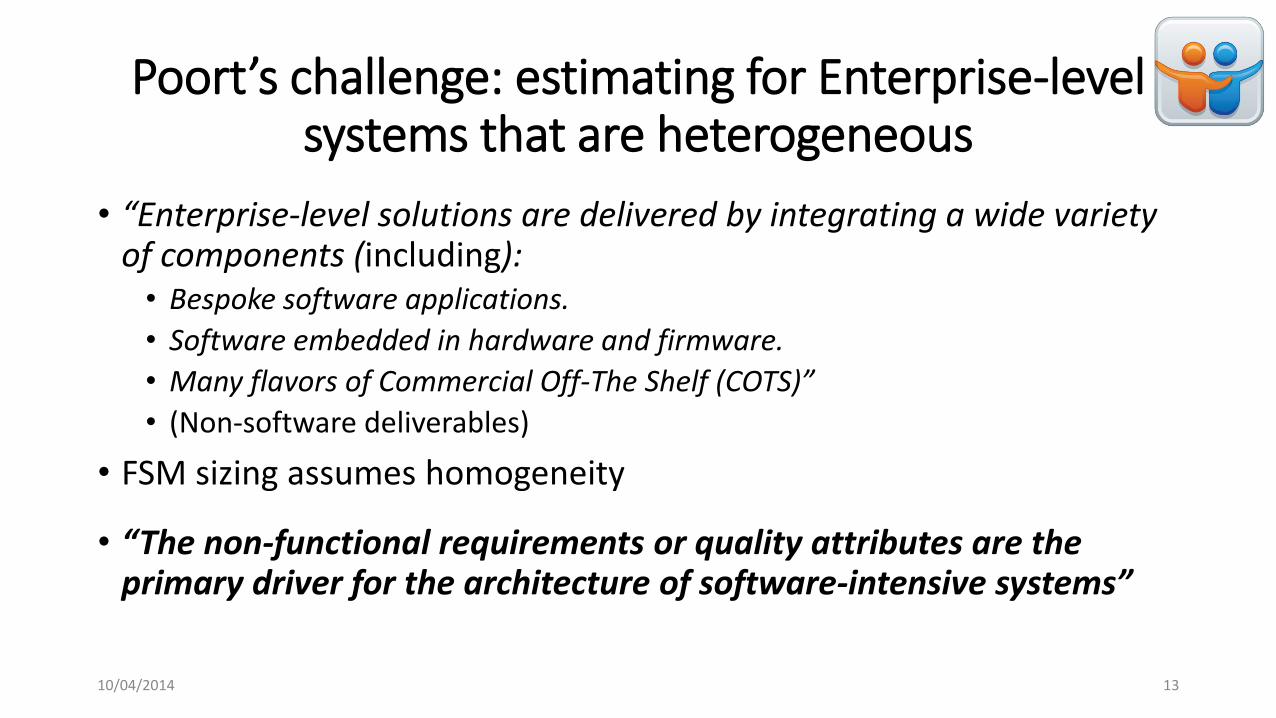
Poort’s challenge: estimating for Enterprise-level systems that are heterogeneous
• “Enterprise-level solutions are delivered by integrating a wide variety of components (including):• Bespoke software applications.
• Software embedded in hardware and firmware.
• Many flavors of Commercial Off-The Shelf (COTS)”
• (Non-software deliverables)
• FSM sizing assumes homogeneity
• “The non-functional requirements or quality attributes are the primary driver for the architecture of software-intensive systems”
10/04/2014 13

The process by which CGI estimates projects
10/04/2014 14
Architecture = integration of stakeholder viewsSBS = Solution based structureWBS = work breakdown structure
“Research shows that applying solution architecture practices is … correlated with higher accuracy of budget prediction and lower expected budget overruns.”

SNAP definition of NFR, and beta test results
10/04/2014 15
“ …. we define these kinds of software requirements as “non-functional” requirements because they are not included in the ISO standard function point methodology in the IFPUG Counting Practices Manual yet require additional work effort to develop.” (‘Crosstalk’ 25th Anniversary edition)
Figure 4:
Graph shows SNAP Beta test results after removing projects with high SNAP points due to Help functionality and increasing the weight of ‘Delivering Value Added to Users through Data Configuration’
Buglione now proposes:Effort = f(FUR, NFR, project activities) ????

Some personal comments on SNAP
• It now seems from the definition that SNAP mainly aims to measure requirements that are ‘not included’ in standard IFPUG FSM. Of the 14 characteristics that SNAP measures, only six at most (concerned with ‘Technical Environment’ and ‘Architecture’) concern non-functional requirements, as commonly understood.
• Given how least-squares curve fitting works, the slope of the fitted line is almost entirely determined by one data point at 4500 SNAP points. All projects of SNAP size <500 points make virtually no contribution to this line-fit. The straight line is therefore statistically meaningless and cannot be used to reliably estimate effort for NFR.
10/04/2014 16

Some results for IFPUG/NESMA Enhancement FPA
• “The added value of enhancement function points: an empirical evaluation”, Frank Vogelezang, etc, NESMA
• Evaluates NESMA EFP against use of standard IFPUG FP for sizing enhancements
• Recorded EFP and FP for 25 releases of enhancements to a system over 4+ years, and effort for build + test
• Conclusion EFP is less accurate than standard FP for predicting this maintenance effort
10/04/2014 17

Simple Function Points
“An Evaluation of Simple Function Point as a Replacement of IFPUG Function Point”, Luigi Lavazza, Roberto Meli, Italy
• SiFP = 4.8 x (no. of EP’s) + 7 x (no. of LF’s)
• For 766 ISBSG projects, SiFP = 0.998 UFP (after eliminating 321 ‘outliers’!) (with R2 = 0.994)
Conclusions:
• SiFP is easier to learn and much faster than FPA
• Neither FPA nor SiFP predict effort very well (with R2 = ~0.55)
• “the whole system of rules aimed at the differentiation between EI, EO, EQ, ILF and EIF and at the determination of the complexity of the single BFC (DET, RET, FTR), (is) useless in business terms”
• SiFP provides a simple way of determining FP sizes from CFP measurement data, if you can match OOI’s to LF’s (my observation)
10/04/2014 18

The project effort vs duration trade-off relationship
“Lies, damned lies and software metrics”, Charles Symons (in a section called ‘Mistakes I have made’)
“Putnam’s Effort-Duration Trade-Off Law: Is the software estimation problem really solved?”, Han Suelmann, CGI, Netherlands
10/04/2014 19
10/04/2014 20
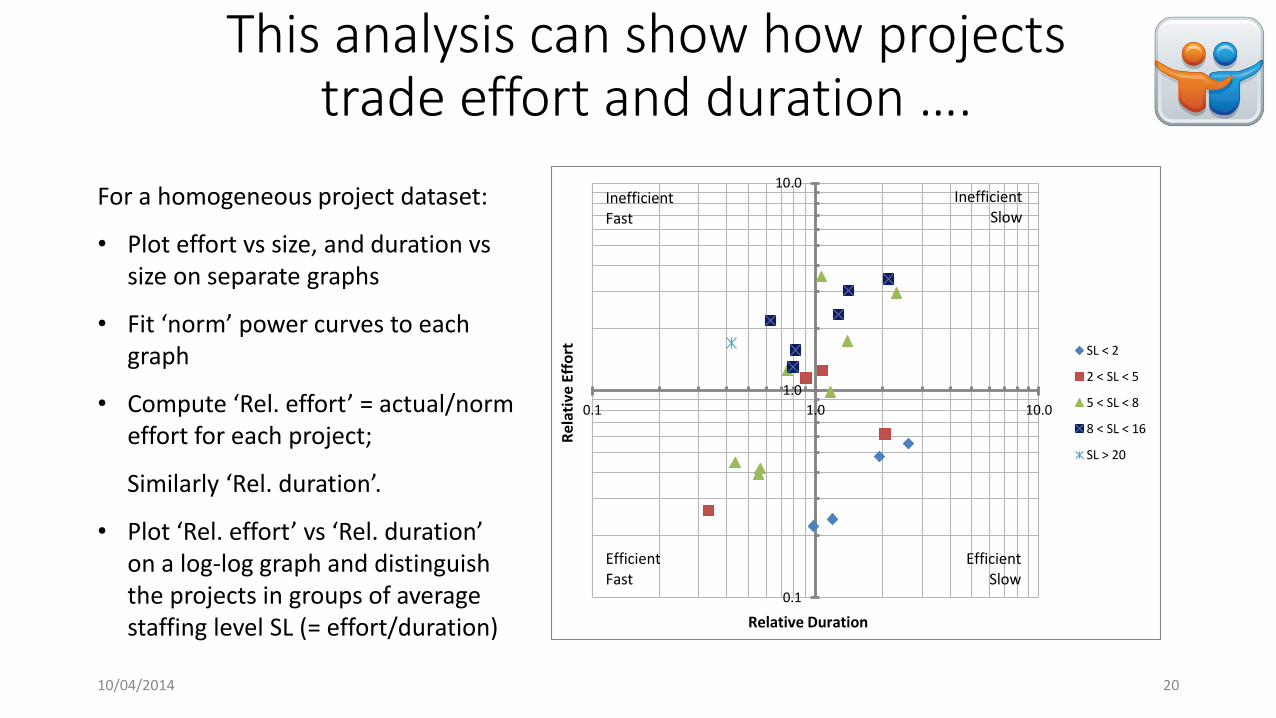
This analysis can show how projects trade effort and duration ….
0.1
1.0
10.0
0.1 1.0 10.0
Re
lati
ve E
ffo
rt
Relative Duration
SL < 2
2 < SL < 5
5 < SL < 8
8 < SL < 16
SL > 20
InefficientFast
InefficientSlow
EfficientFast
EfficientSlow
For a homogeneous project dataset:
• Plot effort vs size, and duration vs size on separate graphs
• Fit ‘norm’ power curves to each graph
• Compute ‘Rel. effort’ = actual/norm effort for each project;
Similarly ‘Rel. duration’.
• Plot ‘Rel. effort’ vs ‘Rel. duration’ on a log-log graph and distinguish the projects in groups of average staffing level SL (= effort/duration)

17/10/2014 21
….but Suelmann showed that my follow-on analysis of the relationship, relying on the Putnam model, was flawed!
21
0.5
1.0
1.5
2.0
2.5
0.8 0.9 1 1.1 1.2
Rela
tive
Effo
rt
Relative Duration
Putnam
0.9
1
1.1
1.2
1.3
1.4
1.5
1.6
0.8 0.9 1.0 1.1 1.2
Rela
tive
Effo
rt
Relative Duration
SEER-SEM
0.8
1
1.2
1.4
1.6
1.8
2
0.5 1.0 1.5 2.0 2.5
Rela
tive
Effo
rt
Relative Duration
True-S
0.9
1
1.1
1.2
1.3
1.4
1.5
0.6 0.8 1 1.2 1.4 1.6
Rela
tive
Effo
rt
Relative Duration
COCOMO II
Four theories of the
effort/duration relationship
for schedule expansion
Unlikely
Much more likely*
* These take account of Parkinson’s Law under conditions of schedule expansion

Suelmann’s analysis destroys Putnam’s theory
• In 1978, Putnam claimed a ‘general empirical solution’ for his ‘fourth power’ effort-duration trade-off law
• His analysis was based a dataset consisting of 13 projects, all stemming from the US Army Computer Systems Command
• The analysis is flawed, confusing cause and effect
• No other study has reproduced Putnam’s results
• Suelmann’s simulations (work in progress) indicate the other three models are more likely
17/10/2014 22
Use of COSMIC in Agile Projects for QC
“Requirements Engineering Quality Revealed Through Functional Size Measurement: An Empirical Study in an Agile Context”, Jean-François Dumas-Monette, etc., Université du Québec à Montréal, Canada
• Study of five projects in a small software house, experienced in using Agile methods
• All requirements stored as User Stories in a web-based tool
• CFP functional sizes measured at US level
• Requirements quality rated according to COSMIC Guideline
• Preliminary results
10/04/2014 23

Measurements support process improvement and estimating
10/04/2014 24
Size measurement effort relates closely to requirements quality.
Analysis of requirements quality found during measurement resulted in proposals to improve RE processes.
Figure 4. Preliminary estimation model.
Project Effort vs CFP relationship looks good

Experience of COSMIC training improvement
“The Effect of Highlighting Error Categories in FSM Training on the Accuracy of Measurement”, Ali Mert Ertugrul et al, METU, Ankara, Turkey.
“In this study, we analyzed the effect of highlighting error categories during training by extracting the errors throughout four years. We showed that, highlighting the frequent error categories during the same training period without a fundamental change in the content would significantly decrease the error rate.”
10/04/2014 25
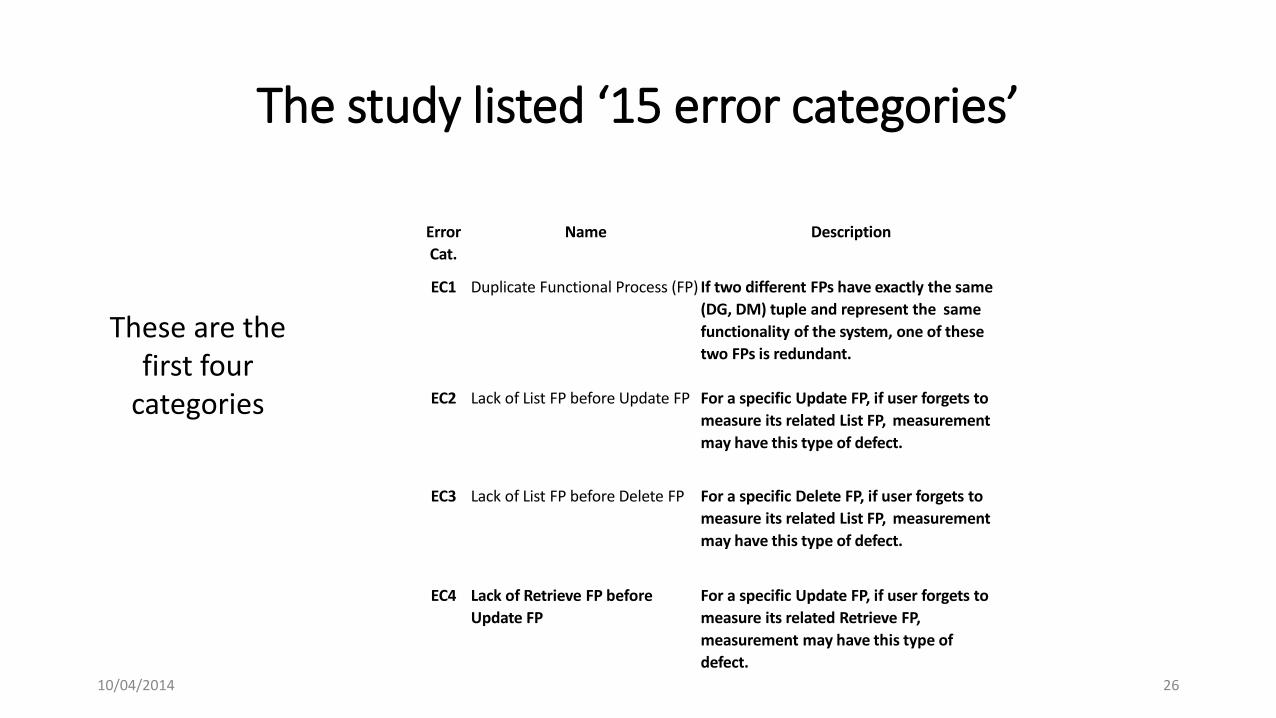
The study listed ‘15 error categories’
10/04/2014 26
Error
Cat.
Name Description
EC1 Duplicate Functional Process (FP) If two different FPs have exactly the same
(DG, DM) tuple and represent the same
functionality of the system, one of these
two FPs is redundant.
EC2 Lack of List FP before Update FP For a specific Update FP, if user forgets to
measure its related List FP, measurement
may have this type of defect.
EC3 Lack of List FP before Delete FP For a specific Delete FP, if user forgets to
measure its related List FP, measurement
may have this type of defect.
EC4 Lack of Retrieve FP before
Update FP
For a specific Update FP, if user forgets to
measure its related Retrieve FP,
measurement may have this type of
defect.
These are the first four
categories

Data shows great reduction in error rates
10/04/2014 27
EC14 - the most common error“User interface
components and system users are
considered as DG’s or as OOI’s”

NESMA plans to publish a guide for outsourced software contracting
“FPA and Quality Metrics in Contracts”, Harold van Heeringen et al, Sogeti
“This publication zooms in on RFP’s in which Function Points and derived metrics like productivity of the development team and quality of the development process are used. NESMA presents this guideline in order to help client organizations to ask the right questions in the bid phase and the contracting phase.
But also for the supplier organizations, it gives directions on which data of completed projects should be collected and analyzed and which metrics should be calculated, stored and benchmarked.”
10/04/2014 28

Estimating
“Project estimating using COSMIC”, Alain Abran, Montréal, Canada, in ‘COSMIC Masterclass’
“Software estimating: turning dust into pots of gold”, Alain Abran
“Why can’t people estimate: estimation bias and strategic estimation”,Dan Galorath, Galorath Inc., USA
10/04/2014 29

Abran and Galorath gave similar messages
Some quotes from Abran’s paper: what has NOT changed much with 40 years of estimating experience?
• “Software managers … are still expected to meet budget targets and deadlines typically based on imprecise requirements.
• Researchers continue to develop increasingly complex estimation models and techniques in pursuit of ‘accurate’ estimates.
• Estimation tools … are still offered for which there is little or no documented evidence on how these tools have performed on projects completed”
He concludes:
• “The role of the software estimator is not to promise miracles, but to provide the best and most complete technical information, context, and insights … i.e. information to support decision making;
• The role of the manager is to look at all this information, select and allocate a project budget, and then … to take risks and manage those risks along the way.”
10/04/2014 30