Embed Size (px)
Citation preview
Overview of
Social Accounting MatricesDavid Roland-Holst
UC Berkeley
Faculty of Economics
Chiang Mai University
July, 2009

Roland-Holst 2Chiang Mai University Faculty of Economics5 July 2009
Social Accounting Matrices
(SAMs)
• Social Accounting Matrices extend I/O tables by “closing” them (i.e., endogenizing income-expenditure relationships) and adding institutional detail that is absent from I/O tables.
• It is the institutional detail that is responsible for the “social” part of the social accounting matrix name. Indeed, a SAM without detailed factor and household accounts has little “social” information in it.
Roland-Holst 3Chiang Mai University Faculty of Economics5 July 2009
I/O to SAM
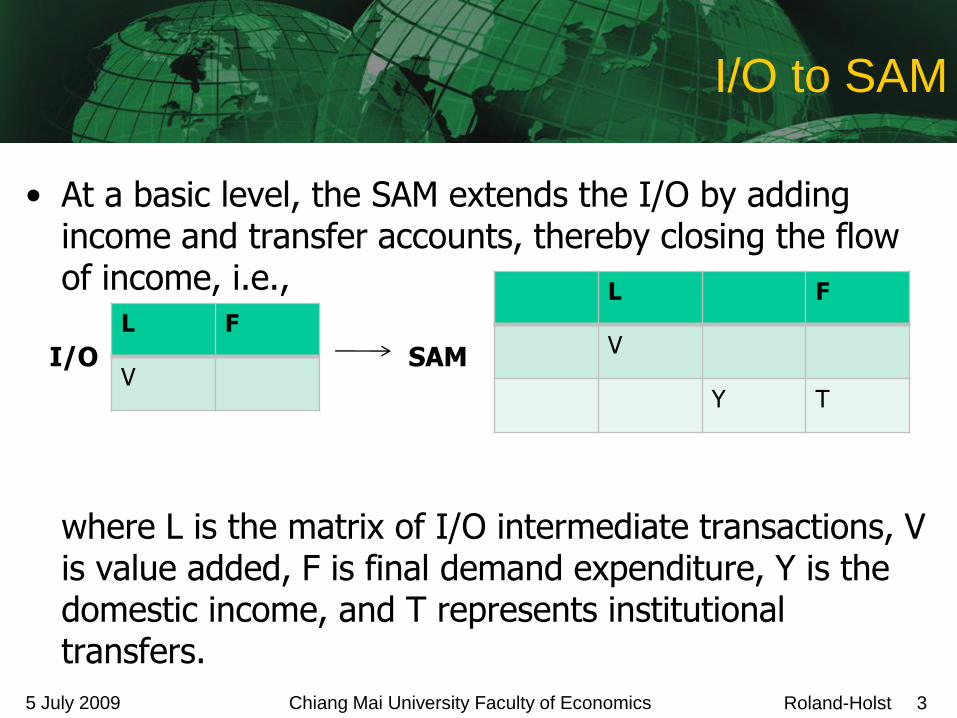
• At a basic level, the SAM extends the I/O by adding income and transfer accounts, thereby closing the flow of income, i.e.,
where L is the matrix of I/O intermediate transactions, V is value added, F is final demand expenditure, Y is the domestic income, and T represents institutional transfers.
L F
V
Y T
L F
VI/O SAM

Roland-Holst 4Chiang Mai University Faculty of Economics5 July 2009
SAM Circular Flow of Income
• A simplified circular flow of income is clearly visible from the SAM
• V maps income to factors, Y maps factors to institutions, F maps institutional income to A, A pays V.

Roland-Holst 5Chiang Mai University Faculty of Economics5 July 2009
SAM Circular Flow of Income
• A more detailed mapping of income flows:
Factor Income
Direct Taxes
Transfers
Final Use
Indirect Taxes and Tariffs
Imp
ort
s
Ex
po
rts
Net Capital Flows
Sales Taxes
Inte
rmed
iate
Co
ns
um
pti
on
Sa
les
Savings

Roland-Holst 6Chiang Mai University Faculty of Economics5 July 2009
SAM Feedbacks
• The circular flow of income is a very important concept in SAMs. Whereas I/O tables capture indirect linkages through inter-industry structure, SAMs also capture feedback effects because they include the induced effects of circular income flows on production.
• Induced effects refer to the new demand for goods and services caused by institutions spending their new income that results from new output induced by an exogenous shock.

Roland-Holst 7Chiang Mai University Faculty of Economics5 July 2009
SAM Interdependency
• By bringing together all economic accounts, SAMs contain the full range of interdependencies in a socioeconomic system:
• The SAM connects:
Production of goods and services
Generation of factor incomes
Levels and distributions of income available to institutions
Transfer payments and savings by institutions
Expenditures on goods and services

Roland-Holst 8Chiang Mai University Faculty of Economics5 July 2009
Main Features of a SAM
There are three main features of a SAM (Round, 2003)
Square. SAM accounts are represented as a square matrix (note that the I/O table is typically not), where inflows-outflows for each account are rows-columns; this structure shows interconnections between agents in an explicit way.
Comprehensive. SAMs portray all economic activities: production, consumption, accumulation, distribution.
Flexible. SAMs are flexible in aggregation and emphasis.
Roland-Holst 9Chiang Mai University Faculty of Economics5 July 2009
SAM Uses
SAMs are useful for:
Data Reconciliation. SAMs provide a coherent and consistent framework for bringing together data from many disparate sources, highlighting potential inconsistencies in data and thus improving data quality.
Structural Insights. SAMs show clearly the structural interdependencies underlying an economy.
Modeling. SAMs provide an accounting and analytical framework for fixed price multiplier (FPM) and CGE models.

Roland-Holst 10Chiang Mai University Faculty of Economics5 July 2009
Data Reconciliation
• A quick note on data reconciliation, which is one of the more unsexy but often very valuable uses of SAMs.
• Economic data is often collected by different government ministries, and often there is little attempt to reconcile it even though the individual data is used without question.
• At two ends of the spectrum, national income accounts data is usually based on production surveys, while household survey data often show results that conflict with national data.

Roland-Holst 11Chiang Mai University Faculty of Economics5 July 2009
SAM Construction
• We will begin with a national macro SAM and work our way down to a regional micro SAM.
• Because many of you are working on building sub-national SAMs, this approach is likely the approach that many of you will use in your projects.
• These macro-micro and micro-macro directions are often complementary: We will use the macro SAM as a means to maintain consistency for the micro SAM, and the micro SAM as a means to check the accuracy of our data in the macro SAM.
Roland-Holst 12Chiang Mai University Faculty of Economics5 July 2009
Macro SAM
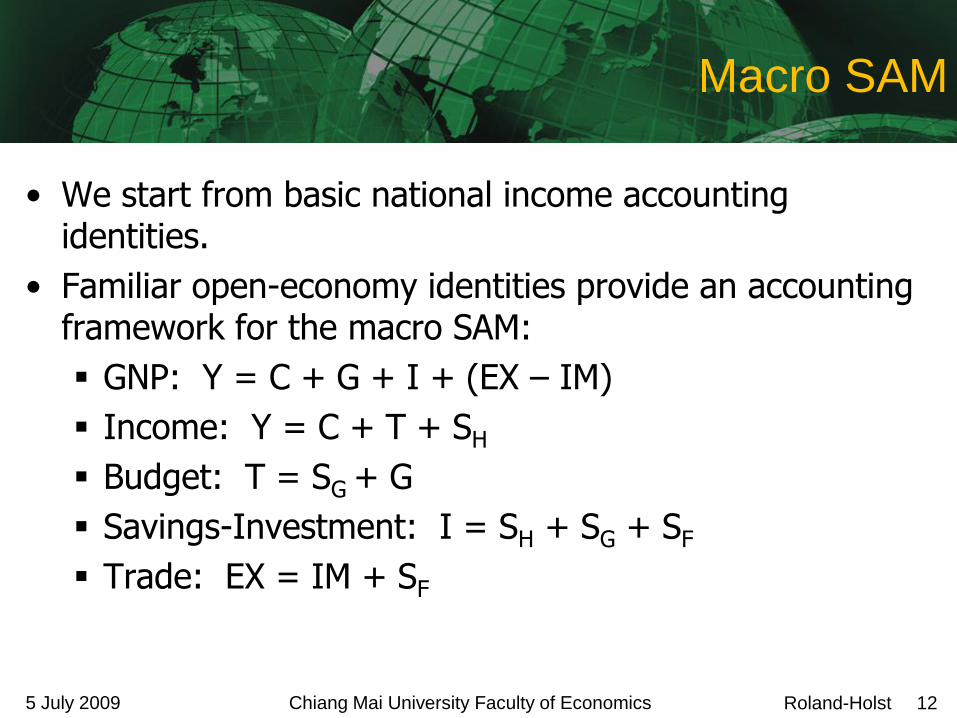
• We start from basic national income accounting identities.
• Familiar open-economy identities provide an accounting framework for the macro SAM:
GNP: Y = C + G + I + (EX – IM)
Income: Y = C + T + SH
Budget: T = SG + G
Savings-Investment: I = SH + SG + SF
Trade: EX = IM + SF

Roland-Holst 13Chiang Mai University Faculty of Economics5 July 2009
Schematic Macro SAM
Expenditures
Receipts 1 2 3 4 5 Total
1. Suppliers C G I EX Demand
2. Households Y Income
3. Government T Income
4. Capital Acct. SH SG SF Savings
5. Rest of World IM ROW
Total Supply Expenditure Expenditure Investment ROW
Note how the above table meets the constraints posed by our national income accounting identities: as in the I/O table columns and rows are equal. Also note that we are missing a few accounts.

Roland-Holst 14Chiang Mai University Faculty of Economics5 July 2009
Schematic Macro SAM
Expenditures
Receipts 1 2 3 4 5 Total
1. Suppliers C G I EX Demand
2. Households Y Income
3. Government T Income
4. Capital Acct. SH SG SF Savings
5. Rest of World IM ROW
Total Supply Expenditure Expenditure Investment ROW
Note how the above table meets the constraints posed by our national income accounting identities: as in the I/O table columns and rows are equal. Also note that we are missing a few accounts.

Roland-Holst 15Chiang Mai University Faculty of Economics5 July 2009
Economywide Macro SAM
Expenditures
Receipts 1 2 3 4 5 Total
1. Suppliers L C G I EX Demand
2. Households Y Income
3. Government T Income
4. Capital Acct. SH SG SF Savings
5. Rest of World IM ROW
Total Supply Expenditure Expenditure Investment ROW
Note how the above table meets the constraints posed by our national income accounting identities: as in the I/O table columns and rows are equal. Also note that we are missing a few accounts.

Roland-Holst 16Chiang Mai University Faculty of Economics5 July 2009
Multipliers with Macro SAMs
From the previous two examples, we see that actual material balances differ from value added, i.e.
X = L+C+I+G+(EX-IM) = L+Y so
Y = X – L = (I-A)x, where A= Lӿ-1=LDiag(X)-1, so
dY = (I-A)dx
Likewise
X = L+C+I+G+(EX-IM) = AX+ΓX + I + G + (EX-IM),
= (I-A-Γ)-1 (I+G+EX-IM) = Mz, and
Y = (I-A)X = (I-A)Mz, and
dY = (I-A)X = (I-A)Mdz

Roland-Holst 17Chiang Mai University Faculty of Economics5 July 2009
Regional SAMs
• These are very similar to national SAMs, but may pose special data challenges
• IO tables may be less reliable/detailed
• NIPA accounts are rarely complete at the regional level
• Capital and transfer accounts are likely to be incomplete (financial flows, remittances)
Roland-Holst 18Chiang Mai University Faculty of Economics5 July 2009
Inter-regional Flow Data
• Very few countries have reliable regional trade data
• This may be imputed from data on administrative taxes, transport, or other proxies
• The results are usually balanced against aggregate control totals, and very approximate

Roland-Holst 19Chiang Mai University Faculty of Economics5 July 2009
Direct SAM Analytical
Methods
• In addition to its role as a static database for national accounting and model calibration, the SAM can be used for direct estimation with a variety of multiplier methods.
• We describe one example here.

Roland-Holst 20Chiang Mai University Faculty of Economics5 July 2009
Regional Multiplier
Decomposition
• While trade flow data are revealing, they only capture direct bilateral effects.
• In the real economy, a myriad of interactions delineate the path from initial expenditure to ultimate incomes.
• This is particularly the case with trade in an era of globalization, where international supply chains are ever more elaborate and indirect linkages can represent the majority of value creation.
• To assess these effects empirically, we use the international SAM for multiplier analysis.
Roland-Holst 21Chiang Mai University Faculty of Economics5 July 2009
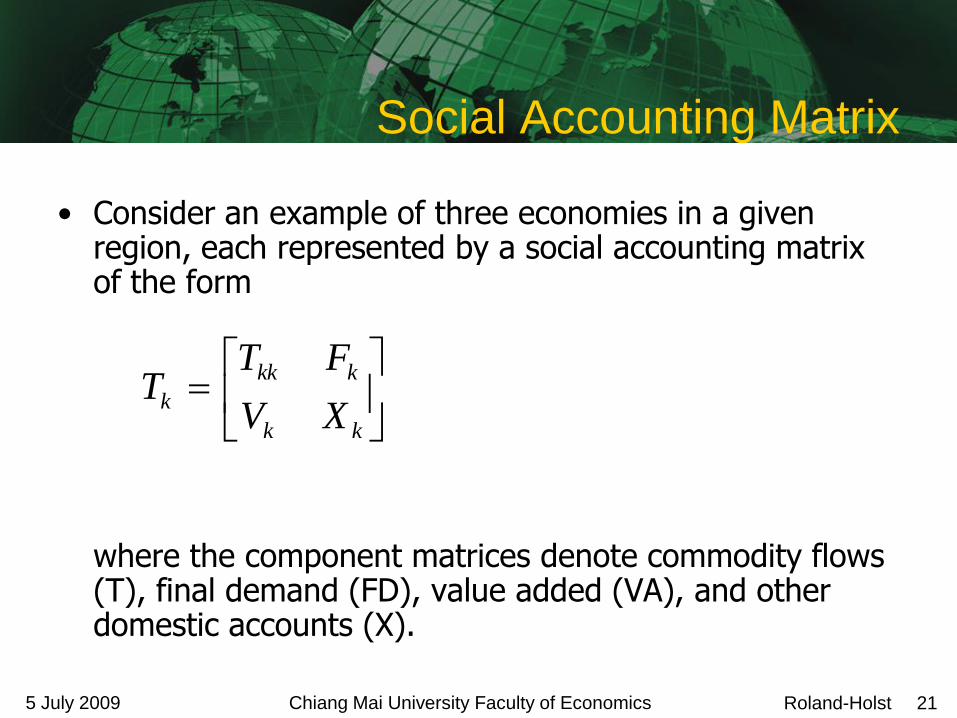
Social Accounting Matrix
• Consider an example of three economies in a given region, each represented by a social accounting matrix of the form
where the component matrices denote commodity flows (T), final demand (FD), value added (VA), and other domestic accounts (X).
kk
kkk
kXV
FTT

Roland-Holst 22Chiang Mai University Faculty of Economics5 July 2009
Multilateral Social Accounting Matrix
• Consider SAMs for three economies in a region, compiled into a multi-regional transactions table
where the off-diagonal T matrices (underlined) are bilateral trade flows.
T11 T12 T13 F1
T21 T22 T23 F2
T31 T32 T33 F3
V1 V2 V3 X
Roland-Holst 23Chiang Mai University Faculty of Economics5 July 2009
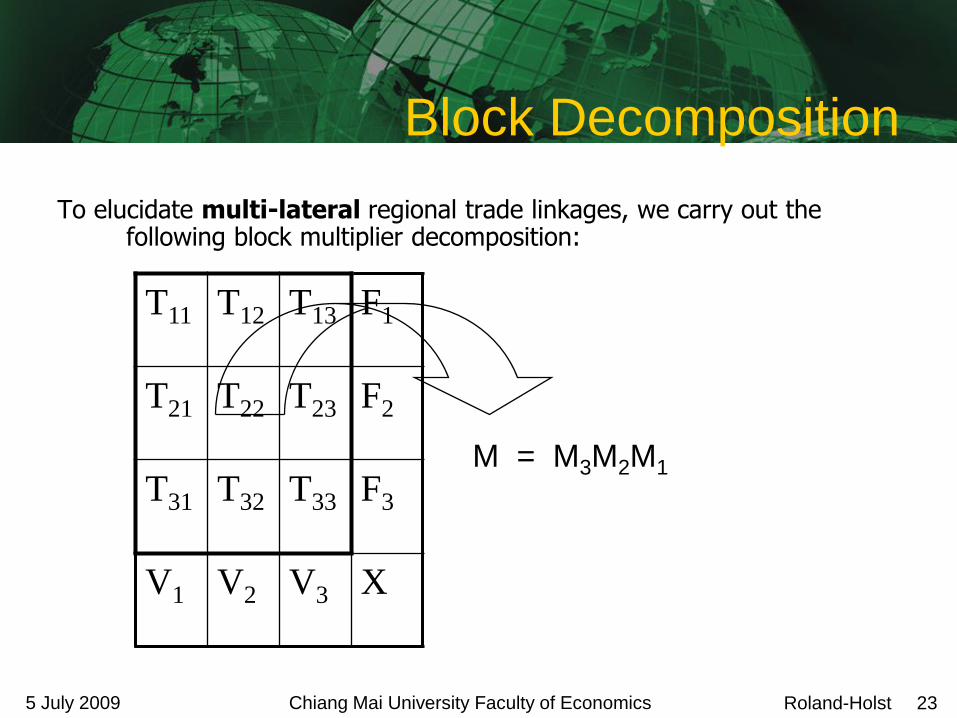
Block Decomposition
To elucidate multi-lateral regional trade linkages, we carry out the following block multiplier decomposition:
T11 T12 T13 F1
T21 T22 T23 F2
T31 T32 T33 F3
V1 V2 V3 X
M = M3M2M1

Roland-Holst 24Chiang Mai University Faculty of Economics5 July 2009
Block Decomposition (cont.)
M1 =
M2 =
M3 =
(I-A11)-
1
0 0
0 (I-A22)-
10
0 0 (I-A33)-
1
I (I-A11)-
1A12
(I-A11)-1A13
(I-A22)-1A21 I (I-A22)-1A32
(I-A33)-1A31 (I-A33)-
1A32
I
Linkages
Intra-region
Inter-region (bilateral)
Equilibrium Indirect
I-D12D21-D13D31 D21D12 D31D13
D12D21 I-D21D12-D23D32 D23D32
D13D31 D23D32 I-D31D13-D23D32
Note: Dij = (I-Aii)-1Aij

Roland-Holst 25Chiang Mai University Faculty of Economics5 July 2009
Conclusions
• SAMs are critically important (consistent) data tools
• While they must be consistent with macro information, their biggest virtue is detail.
In most cases, indirect effects of economic policy outweigh direct ones, but these are often difficult to ascertain.
Data development for SAMs should be correspondingly ambitious.
• Overall goal: Improve visibility for policy makers about the detailed incidence of economic decisions and external events.