Embed Size (px)
Citation preview

OVERVIEW OF PRESENT LAW AND ECONOMIC ANALYSIS RELATING TO MARGINAL TAX RATES AND THE
PRESIDENT’S INDIVIDUAL INCOME TAX RATE PROPOSALS
Scheduled for a Public Hearing
Before the
SENATE COMMITTEE ON FINANCE
on March 7, 2001
Prepared by the Staff
of the
JOINT COMMITTEE ON TAXATION
March 6, 2001
JCX-6-01

2
CONTENTS
Page
INTRODUCTION ................................................................................................................ 3
I. EXECUTIVE SUMMARY .......................................................................................... 4
II. OVERVIEW OF SELECTED FEDERAL TAX PROVISIONS AFFECTING MARGINAL TAX RATES.......................................................................................... 5
A. Individual Income Tax Rates ................................................................................ 5
B. Phaseins and Phaseouts......................................................................................... 9
1. Overview........................................................................................................ 9 2. Overall limitation on itemized deductions (“Pease limitation”) ..................... 13 3. Personal exemption phaseout (“PEP”)............................................................ 15
C. Employment Taxes................................................................................................ 19
D. Earned Income Credit........................................................................................... 23
III. THE PRESIDENT’S INDIVIDUAL INCOME TAX RATE PROPOSALS ............ 32
IV. BACKGROUND ECONOMIC DATA....................................................................... 35
V. GENERAL DISCUSSION OF ISSUES RELATING TO MARGINAL TAX RATES...................................................................................................................... 40

3
INTRODUCTION
The Senate Committee on Finance has scheduled a public hearing on March 7, 2001, relating to marginal tax rates and the President’s individual income tax rate proposals. This document,1 prepared by the staff of the Joint Committee on Taxation, describes certain elements of present law that affect marginal tax rates and also describes the President’s individual income tax rate proposals. It further provides a discussion of issues relating to marginal tax rates.
Part I of this pamphlet is an executive summary. Part II of this pamphlet provides a description of present law and legislative background relating to the following provisions of the Federal tax laws affecting marginal tax rates: individual income tax rates, income phaseins and phaseouts, the employment taxes, and the earned income credit. Part III provides a description of the President’s individual income tax rate proposals. Part IV provides selected background economic data. Part V provides a discussion of issues relating to marginal tax rates.
1 This document may be cited as follows: Joint Committee on Taxation, Overview of
Present Law and Economic Analysis Relating to Marginal Tax Rates and the President’s Individual Income Tax Rate Proposals (JCX-6-01), March 6, 2001.
4
I. EXECUTIVE SUMMARY
Marginal tax rate defined
The term marginal tax rate refers to the additional, or incremental, increase in tax liability that a taxpayer incurs under the income tax from a $1.00 increase in his or her income. The term statutory marginal tax rate refers to the marginal tax rates for individuals as defined in section 1 of the Code. The basic rate structure of the Federal individual income tax is defined in terms of five marginal tax rates: 15 percent, 28 percent, 31 percent, 36 percent, and 39.6 percent. The statutory marginal tax rates increase as the taxpayer's taxable income increases. In general, if an additional $1.00 of income to the taxpayer resulted in the taxpayer's taxable income increasing by $1.00, then there would be no difference between statutory marginal tax rates and effective marginal tax rates. Because of the design of certain provisions of the Code, an effective marginal tax rate may not always correspond to the statutory marginal tax rate.
The Code includes at least 22 provisions that can result in a taxpayer's effective marginal tax rate deviating from the statutory marginal tax rate. In general, these provisions represent phaseouts, phase-ins, and floors that limit the ability of certain taxpayers to claim certain deductions, credits, or other tax benefits.2 The Joint Committee staff estimates that in 2001, 35.9 million taxpayers, or approximately one quarter of all taxpayers, will have an effective marginal tax rate different from their statutory tax rate. In addition to Federal individual income taxes, taxpayers with wage, salary, or self-employment income pay certain payroll taxes. These taxes increase the marginal tax rate on earned income.
Efficiency
Economists argue that effective marginal tax rates create incentives, or disincentives, for taxpayers to work, save, donate to charity, and the like. These incentives may distort taxpayer choice. Distorted choice may promote an inefficient allocation of society's labor and capital resources. The magnitude of the inefficiencies potentially created by deviations of effective marginal tax rates from statutory marginal tax rates depends upon taxpayer behavioral response to tax changes. There is not consensus on the extent to which taxpayers alter their labor supply or saving in response to tax changes. Additionally, increased effective marginal tax rates may encourage taxpayers to seek compensation in the form of tax-free fringe benefits rather than taxable compensation. Such distortions in consumption represent an efficiency loss to the economy. Increased effective marginal tax rates also may alter taxpayers' decisions regarding when to recognize income or claim expenses. Any such tax-motivated changes in the timing of income or expense generally require time and expense by the taxpayer. Such time and expense represents an efficiency loss to the economy.
Equity
Higher marginal tax rates also lead to increased aggregate tax liabilities. A second question of tax policy is whether these increased aggregate tax liabilities are equitably distributed
2 Other provisions of the Code that impose differing marginal tax rates, such as the alternative minimum tax and the separate rates imposed on capital gains realizations, are beyond the scope of this pamphlet.

5
across taxpayers. The Federal individual income tax is a progressive tax, and the existence of phaseouts and other provisions that create effective marginal tax rates that differ from statutory marginal tax rates do not make the Federal individual income tax a regressive or proportional tax. The phaseouts and other provisions identified in this pamphlet generally operate to increase the overall progressivity of the income tax. The majority of the provisions deny tax benefits to higher-income taxpayers, while preserving tax benefits to low-income and middle-income taxpayers. However, because the phaseouts and other provisions often relate to specific defined economic activities, two different taxpayers may have the same income and one can be subject to a phaseout provision while another is not. That is, these provisions may create horizontal inequities in the Code.
Complexity
The creation of phaseouts adds complexity to the Code. On the other hand, by limiting the number of taxpayers eligible to qualify for certain tax benefits, some of the provisions reduce computations, possibility of error, and record keeping. These provisions also may confuse taxpayers regarding what precisely is the tax base and what sort of preferences exist in the Code. Complexity and lack of clarity may promote taxpayer disillusionment and a sense of unfairness regarding the Code, and may reduce compliance.
II. OVERVIEW OF SELECTED FEDERAL TAX PROVISIONS AFFECTING MARGINAL TAX RATES
A. Individual Income Tax Rates
Present law
To determine regular income tax liability, a taxpayer generally must apply the tax rate schedules (or the tax tables) to his or her taxable income. The rate schedules are broken into several ranges of income, known as income brackets, and the marginal tax rate increases as a taxpayer's income increases. The income bracket amounts are indexed for inflation. Separate rate schedules apply based on an individual's filing status. For 2001, the individual regular income tax rate schedules are shown below (bracket breakpoints for married filing separately are exactly half of those for married filing jointly).

6
Federal Individual Income Tax Rates for 2001
If taxable income is: Then income tax equals: Single individuals
$0-27,050............................................. 15 percent of taxable income
$27,050-$65,550................................... $4,057.50, plus 28% of the amount over $27,050
$65,550-$136,750 ................................. $14,837.50 plus 31% of the amount over $65,550
$136,750-$297,350 ............................... $36,909.50 plus 36% of the amount over $136,750
Over $297,350...................................... $94,725.50 plus 39.6% of the amount over $297,350
Heads of households
$0-$36,250 ........................................... 15 percent of taxable income
$36,250-$93,650................................... $5,437.50 plus 28% of the amount over $36,250
$93,650-$151,650 ................................. $21,509.50 plus 31% of the amount over $93,650
$151,650-$297,350 ............................... $39,489.50 plus 36% of the amount over $151,650
Over $297,350...................................... $91,941.50 plus 39.6% of the amount over $297,350
Married individuals filing joint returns
$0-$45,200 ........................................... 15 percent of taxable income
$45,200-$109,250 ................................. $6,780.00 plus 28% of the amount over $45,200
$109,250-$166,500 ............................... $24,714.50 plus 31% of the amount over $109,250
$166,500-$297,350 ............................... $42,461.50 plus 36% of the amount over $166,500
Over $297,350...................................... $89,567.50 plus 39.6% of the amount over $297,350
Legislative Background
The 16th amendment to the Constitution was ratified on February 25, 1913. Under the 16th amendment, Congress has the power to collect taxes “on income from whatever source derived” without apportionment among the States. Several months later the Congress enacted the individual income tax as part of the Revenue Act of 1913. In its initial form, the income tax was designed to affect only a small number of households. For married couples, the tax did not apply to taxable incomes less than $3,000. The top marginal rate was 7 percent, and applied to taxable income over $500,000. Table 1 shows a description of the history of the bottom and top bracket tax rates since Congress enacted the individual income tax in 1913.

7
Table 1- History of Federal Individual Income Bottom and Top Bracket Rates [In dollar amounts unless otherwise specified]
Tax Rates1
Bottom bracket Top Bracket Calendar
Year Rate
(percent) Taxable income
up to Rate
(percent) Taxable
income over 1913-15 1 20,000 7 500,000 1916 2 20,000 15 2,000,000 1917 2 2,000 67 2,000,000 1918 6 4,000 77 1,000,000 1919-20 4 4,000 73 1,000,000 1921 4 4,000 73 1,000,000 1922 4 4,000 56 200,000 1923 3 4,000 56 200,000 1924 21.5 4,000 46 500,000 1925-28 21? 4,000 25 100,000 1929 24? 4,000 24 100,000 1930-31 21? 4,000 25 100,000 1932-33 4 4,000 63 1,000,000 1934-35 34 4,000 63 1,000,000 1936-39 34 4,000 79 5,000,000 1940 34.4 4,000 81.1 5,000,000 1941 310 2,000 81 5,000,000 1942-433 319 2,000 88 200,000 1944-45 23 2,000 594 200,000 1946-47 19 2,000 586.45 200,000 1948-49 16.6 4,000 582.13 400,000 1950 17.4 4,000 591 400,000 1951 20.4 4,000 591 400,000 1952-53 22.2 4,000 592 400,000 1954-63 20 4,000 591 400,000 1964 16 1,000 77 400,000 1965-67 14 1,000 70 200,000 1968 14 1,000 675.25 200,000 1969 14 1,000 677 200,000 1970 14 1,000 671.75 200,000 1971 14 1,000 770 200,000 1972-78 814 1,000 770 200,000 1979-80 814 2,100 770 212,000 1981 8 913.825 2,100 7 969.125 212,000 1982 812 2,100 50 106,000 1983 811 2,100 50 106,000 1984 811 2,100 50 159,000 1985 811 2,180 50 165,480 1986 811 2,270 50 171,580 1987 811 3,000 38.5 90,000

8
Tax Rates1 Bottom bracket Top Bracket
Calendar Year
Rate (percent)
Taxable income up to
Rate (percent)
Taxable income over
1988 815 29,750 1028 29,750 1989 815 30,950 1028 30,950 1990 815 32,450 1028 32,450 1991 815 34,000 31 82,150 1992 815 35,800 31 86,500 1993 815 36,900 39.6 250,000 1994 815 38,000 39.6 250,000 1995 815 39,000 39.6 256,500 1996 815 40,100 39.6 263,750 1997 815 41,200 39.6 271,050 1998 815 42,350 39.6 278,450 1999 815 43,050 39.6 283,150 2000 815 43,850 39.6 288,350 1 Taxable income excludes zero bracket amount from 1977 through 1986. Rates shown apply only to married persons filing joint returns beginning in 1948. Does not include either the add on minimum tax on preference items (1970-1982) or the alternative minimum tax (1979-present). Also, does not include the effects of the various tax benefit phase-outs (e.g. the personal exemption phase-out). From 1922 through 1986 and from 1991 forward, lower rates applied to long-term capital gains.
2 After earned-income deduction equal to 25 percent of earned income.
3 After earned-income deduction equal to 10 percent of earned income.
4 Exclusive of Victory Tax.
5 Subject to the following maximum effective rate limitations. [year and maximum rate (in percent)] 1994-45 - 90; 1946-47 - 85.5; 1948-49 - 77.0; 1950 - 87.0; 1951 - 87.2; 1952-53 - 88.0; 1954-63 - 87.0. 6 Includes surcharge of 7.5 percent in 1968, 10 percent in 1969, and 2.6 percent in 1970.
7 Earned income was subject to maximum marginal rates of 60 percent in 1971 and 50 percent from 1972 through 1981. 8 Beginning in 1975, a refundable earned-income credit is allowed for low-income individuals.
9 After tax credit is 1.25 percent against regular tax.
10 The benefit of the first rate bracket is eliminated by an increased rate above certain thresholds. The phase-out range of the benefit of the first rate bracket was as follows: Taxable income between $71,900 and $149,250 in 1988; taxable income between $74,850 and $155,320 in 1989; and t axable income between $78,400 and $162,770 in 1990. The phase-out of the benefit the first rate bracket was repealed for taxable years beginning after December 31, 1990. This added 5 percentage points to the marginal rate for those affected by the phaseout, producing a 33 percent effective rate.

9
B. Phaseins and Phaseouts
1. Overview
The Code includes at least 22 provisions that can result in a taxpayer's effective marginal tax rate deviating from the statutory marginal tax rate. In general, these provisions represent phaseouts, phase-ins, and floors that limit the ability of certain taxpayers to claim certain deductions, credits, or other tax benefits.3 The Joint Committee staff estimates that in 2001, 35.9 million taxpayers, or approximately one quarter of all taxpayers, would have an effective marginal tax rate different from their statutory tax rate. These deviations from the statutory marginal tax rate are largely the result of the provisions listed in Table 3 below. The table summarizes the provisions of the Code that give rise to deviations between effective marginal tax rates and statutory marginal tax rates and summarizes the income range over which the deviation will occur. Table 3 also includes a calculation of the effective marginal tax rate that results from the provision.4
The discussion below focuses on three of the provisions listed in the chart: the phaseout of personal exemptions, the overall (“Pease”) limitation on itemized deductions, and the EIC.
3 For a complete discussion of these provisions and their impact on marginal rates, see
Joint Committee on Taxation, Present Law and Analysis Relating to Individual Effective Marginal Tax Rates (JCS-3-98).
4 Certain of the provisions phaseout the underlying benefit through a “step function” rather than smoothly. Table 3 generally calculates the marginal rate as if the phaseout were mathematically smooth, or linear. An example of how the step function phaseouts work can be found in a footnote to the analysis section to the discussion of the personal exemption phaseout, below.

10
Table 3.--Summary of Provisions Creating Effective Marginal Tax Rates Different from Statutory
Marginal Tax Rates (2001)
Provision
Code section
Effective marginal
tax rate
Applicable range
of AGI Phaseout of exclusion of social security benefits
Section 86 1.5 times the statutory rate for first tier 1.85 times the statutory rate for second tier
Single: $25,000-various1
Joint: $32,000-various1
Single: $34,000 various1 Joint: $44,000-various1
"Pease" limitation on itemized deductions
Section 68 1.03 times the statutory rate
$132,950 various
7.5-percent floor on medical deduction
Section 213 1.075 times the statutory rate
Any taxpayer itemizing medical deductions
2-percent floor on miscellaneous deductions
Section 67 1.02 times the statutory rate
Any taxpayer itemizing miscellaneous deductions
10-percent floor on casualty loss
Section 165(h)(2)
1.10 times the statutory Any taxpayer itemizing deductions for casualty loss
Phaseout of personal exemption
Section 151 The statutory rate multiplied by 1.0 plus 0.232 for each exemption, e.g., 1.0232 times the statutory rate for one personal exemption 1.0464 times the statutory rate for two personal exemptions
Single: $132,950 $255,450 H/H: $166,200 $288,700 Joint: $199,450 $321,950
Phase-In of earned income credit
Section 32 No children: statutory rate minus 7.65 percentage One child: statutory rate minus 34 percentage points Two children: statutory rate minus 40 percentage points
$0-$4,760 $0-7,140 $0-$10,020
Phaseout of earned income credit
Section 32 No children: statutory rate plus 7.65 percentage points One child: statutory rate plus 15.98 percentage points Two children: statutory
$5,950-$10,7102,3 $13,090-$28,2812,3 $13,090-$32,1212,3

11
Provision
Code section
Effective marginal
tax rate
Applicable range
of AGI rate plus 21.06 percentage points
Phaseout of child credits
Section 24 Statutory rate plus 5 percentage points
Single: $75,000-various3
Joint: $110,0003 Partial phaseout of dependent care credit
Section 21 Depends on expenses: at maximum expenses: Statutory tax rate plus 2.4 percentage points (generally 17.4 percent)
$10,000-$28,001
Phaseout of eligibility for deductible IRA
Section 219 Between 1.0 and 1.2 times statutory rate4
Single: $33,000-$43,000 Joint: 53,000-$63,000
Phaseout of eligibility for Roth IRA
Section 408A Single: between 1.0 and 1.133 times the statutory rate.4
Joint: between 1.0 and 1.2 times the statutory rate4
Single: $95,000-$110,000 Joint: $150,000-$160,000
Phaseout of eligibility for education IRA
Section 530 Greater than statutory rate by a percentage determined by the 5 percent or 3.3 percent phaseout rate and the interest rate.
Single: $95,000-$110,000 Joint: $150,000-$160,000
Phaseout of HOPE credit
Section 25A Single: statutory rate plus 15 percentage points for each $1,500 in credits. Joint: statutory rate plus 7.5 percentage points for each $1,500 in credits.
Single: $40,000-$50,0003
Joint: $80,000-$100,0003
Phaseout of Lifetime learning credit
Section 25A Single: statutory rate plus 15 percentage points for each $1,500 in credits Joint: statutory rate plus 7.5 percentage points for each $1,500 in credits
Single: $40,000-$50,0003
Joint: $80,000-$100,0003
Phaseout of deductibility of interest on qualified student loans
Section 221 1.167 times statutory rate (for maximum deduction available in 2001)
Single: $40,000-$55,0003
Joint: $60,000-$75,0003
Phaseout of exclusion of interest from education savings bonds
Section 135 Single: (1+ exclusion/ $15,000) x statutory rate Joint: (1 + exclusion/ $30,000) x statutory rate
Single: $55,750-$70,750 H/H: $55,750-$70,750 Joint: $83,650-$113,650

12
Provision
Code section
Effective marginal
tax rate
Applicable range
of AGI
Phaseout of credit for elderly and disabled
Section 22 Statutory rate plus 7.5 percentage points
Single: $7,500-maximum of $17,500 Joint: $10,000-maximum of $25,000
Phaseout of adoption credit and exclusion
Section 23 Credit: statutory rate plus credit amount/$40,000 Exclusion: (1 + exclusion amount/$40,000) x statutory rate
$75,000-$115,0003
Phaseout of first-time homebuyer credit for D.C.
Section 1400C Statutory rate plus 25 percentage points
Single: $70,000-$90,0003 Joint: $110,000-$130,0003
Phaseout of rental real estate losses under passive loss rules
Section 469(i) 1.5 times statutory rate5 $100,000-$150,000
Phaseout of rehab tax credit under passive loss rules
Section 469(i) 1.5 times statutory rate $200,000-$250,000
Income phase-in of recapture of subsidy of qualified mortgage bonds
Section 143 Statutory rate plus percentage points equal to the taxpayer's recapture amount divided by 5,000
Defined relative to area median income
1 Applicable range defined by reference to provisional income and modified AGI is used in lieu of AGI. See Joint Committee on Taxation, JCS-3-98 for further information. 2 Assumes all income is earned income. 3 Income range measured by reference to modified AGI. 4 Phaseout affects future year tax liability. Present value of effective marginal tax rate depends on length of time the account is maintained and the interest rate. 5 Stated effective rate overstates lifetime effect as provision allows suspended losses in future years. Source: Joint Committee on Taxation.

13
2. Overall limitation on itemized deductions ("Pease" limitation) 5
Present Law
Individuals who do not elect the standard deduction may claim itemized deductions (subject to certain limitations) for certain nonbusiness expenses incurred during the taxable year. Among these deductible expenses are unreimbursed medical expenses, casualty and theft losses, charitable contributions, qualified residence interest, State and local income and property taxes, certain moving expenses, unreimbursed employee business expenses, and certain other miscellaneous expenses.
Limitations apply to particular deductions. For example, medical expenses are deductible only to the extent they exceed 7.5 percent of adjusted gross income (“AGI”). In addition, miscellaneous itemized expenses (including unreimbursed employee business expenses) are deductible only to the extent that the total of all such expenses exceeds two percent of AGI.
The total amount of otherwise allowable itemized deductions (other than medical expenses, investment interest, and casualty, theft, or wagering losses) is reduced by 3 percent of the amount of the taxpayer's AGI in excess of $132,950 in 2001 (indexed for inflation).6 Under this provision, otherwise allowable itemized deductions may not be reduced by more than 80 percent.7 In computing the reduction of total itemized deductions, all other limitations applicable to such deductions (such as the separate floors) are first applied and, then, the otherwise allowable total amount of itemized deductions is reduced.
Legislative Background
The overall limitation on total itemized deductions was enacted on a temporary basis as part of the Omnibus Budget Reconciliation Act of 1990 (“OBRA 1990”), effective for taxable years beginning after December 31, 1990, but prior to January 1, 1996. The legislative history to OBRA 1990 states that the objective of the provision was to better reflect taxpayers’ ability to pay taxes. It was believed that the higher an individual’s AGI, the less likely that an otherwise
5 Code section 68. This overall limitation on itemized deductions is commonly referred to as the "Pease" limitation after the Congressman who originally proposed the provision.
6 The threshold of $132,950 is the same for all taxpayers, except that the threshold is $66,475 for married taxpayers filing separately.
7 Thus, for example, if a taxpayer's AGI for 2001 is $232,950 (i.e., the taxpayer has $100,000 of excess AGI above the $132,950 threshold), then total otherwise allowable itemized deductions are reduced by $3,000 (i.e., 3 percent of the $100,000 excess AGI). However, if total otherwise allowable itemized deductions are, for example, $20,000, then, regardless of how much AGI the taxpayer has for the taxable year, itemized deductions are reduced by no more than $16,000 (i.e., 80 percent of $20,000). For some taxpayers, if the value of the standard deduction is greater than 20 percent of the value of the taxpayer's itemized deductions, the value of the standard deduction might create a floor beyond which itemized deductions cannot be reduced as the taxpayer always has the option of electing the standard deduction.

14
deductible expense would significantly affect the ability of the individual to pay taxes. The Omnibus Budget Reconciliation Act of 1993 (“OBRA 1993”) permanently extended this limitation on total itemized deductions. The legislative history states that the permanent extension of the overall limitation on itemized deductions would enhance the progressivity of the Federal individual income tax system.
Analysis
The overall limitation on itemized deductions increases the effective marginal tax rate for affected taxpayers. This limitation reduces (subject to the 80-percent limitation) the amount of certain itemized deductions that may be claimed by an amount equal to 3 percent of each dollar of income in excess of the threshold. Thus if a taxpayer who is above the threshold earns an additional $1000 of income, the taxpayer's taxable income increases by $1030 because the taxpayer's income goes up by $1000 and the itemized deductions must be reduced by $30. The statutory tax rates apply to taxable income. Thus, if the taxpayer is in the 36-percent tax bracket, the increase in tax liability resulting from the $1000 increase in income will be $370.80 (the $1030 in additional taxable income multiplied by 0.36). Generally, the effective marginal tax rate for taxpayers subject to the overall limitation on itemized deductions is 3 percent higher than the statutory tax rate. That is, the taxpayer's effective marginal tax rate equals 103 percent of the statutory marginal tax rate. Once the taxpayer's itemized deductions are reduced by 80 percent, the taxpayer's effective marginal tax rate again equals his or her statutory marginal tax rate.
Some argue that the overall limitation on itemized deductions diminishes a taxpayer's incentive to make charitable contributions. While there may be a psychological effect, there generally is little or no difference in the tax-motivated economic incentive to give to charity for a taxpayer subject to the limitation compared to a taxpayer not subject to the limitation. This is because while the limitation operates effectively to increase the marginal tax rate on the income of affected taxpayers, the value of the tax benefit of deductibility of the charitable deduction is determined by the statutory tax rate. For taxpayers beyond the threshold, a specified dollar amount of itemized deductions are denied. The specified dollar amount is determined by the taxpayer's income, not by the amount of itemized deductions the taxpayer claims. Hence, the value of an additional dollar contributed to charity increases by exactly one dollar times the total amount of itemized deductions that the taxpayer may claim. Because the statutory rates apply to taxable income (income after claiming permitted itemized deductions), the value of the additional contribution to charity is determined by the statutory tax rate. Economists would say that the "tax price" of giving is not altered by the limitation.8
8 This can be seen mathematically as follows. Let Y be the taxpayer's income and X be
the threshold above which the limitation on itemized deductions applies. Let D be itemized deductions and t the taxpayer's marginal tax rate. Then the taxpayer's total tax liability, T, is:
T = [Y - {D -(.03)(Y - X)}]t or T = Y[1 + (.03)]t - Dt -(.03)tX.
What this implies is that as the taxpayer's income, Y, increases by $1.00, his or her tax liability increases by (1.03)t, as noted in the text. However, if the taxpayer increases his or her itemized deductions, D, by $1.00, his or her reduction in tax liability is t dollars. Or, as stated in

15
The Joint Committee staff estimates that in 2001, 6.1 million taxpayers will be subject to the overall limitation on itemized deductions and that this figure will grow to 6.7 million by 2005. Because the limitation begins for taxpayers with AGI greater than $132,950, only rarely might taxpayers in the 15-percent statutory marginal tax rate bracket be subject to the provision. Some taxpayers in the 28-percent statutory marginal tax rate bracket, and taxpayers in 31-, 36-, and 39.6-percent statutory marginal tax rate brackets will be subject to the provision. For those affected taxpayers, their effective marginal tax rates will be 28.84 percent, 31.93 percent, 37.08 percent, and 40.79 percent.
Table 4.--Distribution of Taxpayers by Income of Those Who Itemize and Those Who are Subject to Overall Limitation on Itemized Deductions (2001)
Income category (1)
Taxpayers claiming itemized deductions
(millions)
Taxpayers subject to Pease limitation
(millions) Less than $10,000 .............................. 10,000 to 20,000................................ 20,000 to 30,000................................ 30,000 to 40,000................................ 40,000 to 50,000................................ 50,000 to 75,000................................ 75,000 to 100,000.............................. 100,000 to 200,000............................ 200,000 and over ...............................
0.4 0.9 2.1 3.2 3.8 9.5 8.4
10.6 3.4
0.0 0.0 0.0 0.0 0.0 (2) 0.1 2.6 3.4
Total, all taxpayers .......................... 42.4 6.1
Source: Joint Committee on Taxation Detail may not add to total due to rounding. (1) The income concept used to place tax returns into income categories is adjusted gross income plus [1] tax exempt interest, [2] employer contributions for health plans and life insurance, [3] employer share of FICA tax, [4] workers' compensation, [5] nontaxable social security benefits, [6] insurance value of Medicare benefits, [7] alternative minimum tax preference items, and [8] excluded income of U.S. citizens living abroad. Categories are measured at 2001 levels. (2) Less than 50,000 taxpayers.
3. Personal exemption phaseout ("PEP")
Present Law
In order to determine taxable income, an individual reduces AGI by any personal exemptions and either the applicable standard deduction or itemized deductions. Personal exemptions generally are allowed for the taxpayer, his or her spouse, and any dependents (sec. 151). For 2001, the amount deductible for each personal exemption is $2,900. This amount is indexed annually for inflation. The deduction for personal exemptions is phased out ratably for
the text, the statutory tax rate determines the value of the deduction. This algebra assumes the taxpayer is not subject to the 80-percent limitation.

16
taxpayers with AGI over certain thresholds. These thresholds of the personal exemption phaseout (“PEP”) are indexed annually for inflation. Under PEP, the total amount of exemptions that may be claimed by a taxpayer is reduced by 2 percent for each $2,500 (or portion thereof) by which the taxpayer's AGI exceeds the applicable threshold.9 Thus, the personal exemptions claimed are phased out over a $122,500 range (which is not indexed for inflation), beginning at the applicable threshold. Under PEP, the applicable thresholds for 2001 are $132,950 for single individuals, $199,450 for married individuals filing a joint return, $166,200 for heads of households, and $99,725 for married individuals filing separate returns. For 2001, the point at which a taxpayer's personal exemptions are completely phased out is $255,450 for single individuals, $321,950 for married individuals filing a joint return, $288,700 for heads of households, and $222,225 for married individuals filing separate returns.
Legislative Background
The Tax Reform Act of 1986 phased out the benefit of the 15-percent bracket10 and the personal exemptions for an individual, the individual's spouse, and each dependent. This phaseout was accomplished by the imposition of an additional 5-percent tax for higher-income levels. This created, in effect, a 33-percent marginal tax rate. This 33-percent marginal tax rate terminated and the 28-percent bracket resumed after the benefits of the 15-percent bracket and the personal exemptions claimed by each taxpayer had been phased out.11
The present-law PEP was initially enacted on a temporary basis by the Omnibus Budget Reconciliation Act of 1990 (“OBRA 1990”), which also repealed the additional 5-percent tax and imposed an explicit 31-percent marginal tax rate after the 15- and 28-percent marginal tax rates. Under OBRA 1990, PEP was effective for taxable years beginning after December 31, 1990, and before January 1, 1996.
The Unemployment Compensation Amendments of 1992 extended PEP through 1996. The Omnibus Budget Reconciliation Act of 1993 ("OBRA 1993") made PEP permanent. Legislative history to the PEP provision indicates that, like the overall limitation on itemized deductions, PEP was intended to enhance the progressivity of the Federal individual income tax system.
Analysis
PEP increases effective marginal tax rates for those affected taxpayers. PEP operates by reducing the amount of each personal exemption that the taxpayer may claim by two percent for each $2,500 (or portion thereof) by which the taxpayer's income exceeds the designated threshold for his or her filing status. Thus, for a taxpayer who is subject to the personal exemption phaseout, earning an additional $2,500 will reduce the amount of each personal
9 The phaseout rate is 2 percent for each $1,250 for married taxpayers filing separate returns.
10 Under the Tax Reform Act of 1986, the individual income tax rates were 15 and 28 percent.
11 This provision was commonly referred to as "the bubble".

17
exemption he or she may claim by two percent, or by $58 in 2001 (0.02 times the $2,900 personal exemption).12 The taxpayer's additional taxable income is thus equal to the $2,500 plus the $58 in denied exemption for each personal exemption. For a taxpayer in the 36-percent statutory marginal tax rate bracket, the effective marginal tax rate on the additional $2,500 of income equals the statutory 36 percent plus an additional 0.83 percent ($58 times the statutory rate of 0.36, divided by the $2,500 in incremental income) for each personal exemption. Thus, if this taxpayer claims four personal exemptions, his or her effective marginal tax rate is 39.32 percent (the statutory 36-percent rate plus four times 0.83 percent). More generally, for 2001 the taxpayer's effective marginal tax rate equals the taxpayer's statutory marginal rate multiplied by one plus the product of 2.32 percentage points (the $58 in denied personal exemption divided by the incremental $2,500 in income) multiplied by the number of personal exemptions claimed by the taxpayer.13 Thus, a taxpayer who claims five personal exemptions would have an effective
12 It should be noted that since the personal exemption amount is indexed for inflation,
but the length of the phaseout range is not, the increase in marginal rates implied by PEP increases over time.
13 Mathematically, let Y be income, T tax liability, t the taxpayer's statutory marginal tax rate, E the number of personal exemptions, and I the income threshold. In the absence of the phaseout, the taxpayer's tax liability may be represented as follows.
(1) T = (Y - (2,900E))Ct = Yt - (2,900E)Ct
For a taxpayer with income over the threshold amount, I, the taxpayer's tax liability is
T = (Y - ((2,900E) C (1 - (Y - I)/2,500) C .02))Ct
This simplifies to
(2) T = Y C t C (1 + (.0232)E) - 58Et - (.0232)It
Thus, the effective marginal tax rate for a taxpayer in the phaseout range is one plus 2.32 percentage points multiplied by the number of personal exemptions claimed, all multiplied by the taxpayer's statutory marginal tax rate.
This formula simplifies present law by representing the phaseout as a linear function. The phaseout is actually a step function. That is the first dollar of income in the phaseout range causes the taxpayer to lose two percent of his or her personal exemptions. The second dollar of income in the phaseout range through the 2,500th dollar does not lead to any loss of exemptions. The 2,501st dollar, however, causes the taxpayer to lose an additional two percent of his or her personal exemptions. That is, the 2,501st dollar causes the taxpayer's taxable income to increase by the $1.00 of additional income plus $58 times the number of personal exemptions. The 2,502nd dollar of income in the phaseout range has no further incremental effect. Thus, the effective marginal tax rate on the 2,500th dollar and the 2,502nd dollar is the taxpayer's statutory marginal tax rate and the marginal tax rate on the 2,501st dollar generally is 5,900 percent of the taxpayer's statutory marginal tax rate for a taxpayer claiming one personal exemption, and 11,700 percent of the taxpayer's statutory marginal tax rate for a taxpayer claiming two personal exemptions. In general, the marginal tax rate on the first dollar is a percentage of statutory

18
marginal tax rate approximately 111.6 percent of the statutory marginal tax rate.
The Joint Committee staff estimates that in 2001, 2.1 million taxpayers would be subject to PEP (See Table 5), and that figure will grow to 2.3 million by 2005. Because the phase-out is completed by an AGI of $255,450 for single taxpayers and $321,950 for joint filers, generally no taxpayers in the 39.6-percent statutory bracket would be affected. Because the phaseout-range begins at an AGI of $132,950 for single taxpayers, $166,200 for heads of households, and $199,450 for joint filers, generally few taxpayers in the 15- or 28-percent statutory marginal tax rate bracket would be expected to be subject to the phaseout. For single taxpayers (one personal exemption) the provisions would increase the 31-percent and 36-percent statutory marginal tax rate bracket to effective marginal tax rates of 31.72 percent and 36.84 percent. For heads of households and joint filers (assuming only two personal exemptions) the corresponding effective marginal tax rates would be 32.34 percent and 37.56 percent.
Table 5.--Distribution By Income of Taxpayers Claiming Personal Exemptions and Those Subject to the Personal Exemption Phaseout
[Calendar Year 2001]
Income category (1)
Taxpayers claiming personal exemptions
(millions)
Taxpayers subject to personal exemption
phaseout (millions)
Less than $10,000 .............................. 10,000 to 20,000................................ 20,000 to 30,000................................ 30,000 to 40,000................................ 40,000 to 50,000................................ 50,000 to 75,000................................ 75,000 to 100,000.............................. 100,000 to 200,000............................ 200,000 and over ...............................
19.9 23.3 18.5 15.8 13.1 21.9 12.9 12.8 3.8
0.0 0.0 0.0 0.0 0.0 0.0 0.0 0.4 1.7
Total, all taxpayers .......................... 142.0 2.1
Source: Joint Committee on Taxation Detail may not add to total due to rounding.
(1) The income concept used to place tax returns into income categories is adjusted gross income plus [1] tax exempt, [2] employer contributions for health plans and life insurance, [3] employer share of FICA tax, [4] workers' compensation, [5] nontaxable social security benefits, [6] insurance value of Medicare benefits, [7] alternative minimum tax preference items, and [8] excluded income of U.S. citizens living abroad. Categories are measured at 2001 levels. Includes filers and nonfilers.
marginal tax rate equal to 100 + 580 times the number of personal exemptions claimed by the taxpayer. This same result occurs at each multiple of $2,500.

19
C. Employment Taxes
Present law
FICA taxes
As part of the Federal Insurance Contributions Act (“FICA”) a tax is imposed on employees and employers up to a maximum amount of employee wages. The tax is composed of two parts: old-age, survivor, and disability insurance (“OASDI”) (i.e., Social Security) and Medicare hospital insurance (“HI”).
The OASDI tax rate is 6.2 percent on both the employer and employee (for a total rate of 12.4 percent). The OASDI tax rate applies to wages up to the OASDI wage base, which is $80,400 for 2001. “Wages” generally includes all remuneration for employment, but there are specific exemptions. The wage base cap is indexed for changes in average compensation.
The second part of the FICA tax imposed on employees and employers is for Medicare hospital insurance (“HI”). The HI tax rate is 1.45 percent on both the employee and employer (for a total rate of 2.9 percent). There is no limit on the amount of wages subject to the HI portion of the FICA tax.
Self-employment taxes
Under the Self-Employment Contributions Act (“SECA”), a tax is imposed on an individual’s net earnings from self-employment.14 The SECA tax rate is the same as the total of the combined FICA tax rates for employers and employees and is capped at the same levels. Thus, the OASDI tax rate applies to the first $80,400 (for 2001) of net earnings and the HI tax rate applies to all net earnings from self-employment. A self-employed individual is entitled to deduct one-half of his or her self-employment taxes.
Table 6 shows a history of the wage base and rate of tax for certain Social Security taxes.
Unemployment compensation taxes
The Federal Unemployment Tax Act (FUTA) imposes a minimum, net Federal tax on employers of 0.8 percent on the first $7,000 paid annually to each employee. The current gross FUTA tax rate is 6.2 percent; employers in States meeting certain requirements and having no delinquent Federal loans are eligible for a 5.4 percent credit, making the current minimum, net Federal tax rate 0.8 percent. Because most employees earn more than the $7,000 taxable wage ceiling, the FUTA tax is $56 per employee ($7,000 x 0.8 percent), or 3 cents per hour for a full-time worker.
14 Net earnings for this purpose are earnings multiplied by 92.35 percent. This
adjustment is necessary to tax self-employed individuals on the same basis as wage and salary employees since self-employment earnings include the “employer” share of the tax whereas wage and salary earnings do not.

20
Chart 1 depicts the historical trends in the statutory and effective FUTA tax rates. The effective rate equals the FUTA revenue as a percent of covered wages. Although the statutory tax rate doubled from 0.4 percent in the late 1960s to 0.8 percent in the late 1970s, the effective rate has fluctuated between 0.2 and 0.3 percent in most of those years.

21
Table 6.--History of FICA/SECA Taxes, 1937-2001
Tax rates, employer and
employee, each
OASDI Tax rate,
self-employed
Calendar year
Wage base OASDI HI Total
Maximum employee
tax HI Total
Maximum self-empl.
tax
2001 2000 1999 1998 1997 1996 1995 1994 19933 19923 19913 1990 1989 1988 1987 1986 1985 1984 1983 1982 1981 1980 1979 1978 1977 1976 1975 1974 1973 1972 1971 1970 1969 1968 1967 1966 1963-65 1962 1960-61 1959
$80,400 76,200 72,600 68,400 65,400 62,700 61,200 60,600 57,600 55,500 53,400 51,300 48,000 45,000 43,800 42,000 39,600 37,800 35,700 32,400 29,700 25,900 22,900 17,700 16,500 15,300 14,100 13,200 10,800 9,000 7,800 7,800 7,800 7,800 6,600 6,600 4,800 4,800 4,800 4,800
6.2 6.2 6.2 6.2 6.2 6.2 6.2 6.2 6.2 6.2 6.2 6.2 6.06 6.06 5.70 5.70 5.70 5.70 5.40 5.40 5.35 5.08 5.08 5.05 4.95 4.95 4.95 4.95 4.85 4.6 4.6 4.2 4.2 3.8 3.9 3.85 3.625 3.125 3.0 2.5
1.45 1.45 1.45 1.45 1.45 1.45 1.45 1.45 1.45 1.45 1.45 1.45 1.45 1.45 1.45 1.45 1.35 1.3 1.3 1.3 1.3 1.05 1.05 1.0 .9 .9 .9 .9
1.0 .6 .6 .6 .6 .6 .5 .35
…….. .......... .......... ..........
7.65 7.65 7.65 7.65 7.65 7.65 7.65 7.65 7.65 7.65 7.65 7.65 7.51 7.51 7.15 7.15 7.05 7.00 6.70 6.70 6.65 6.13 6.13 6.05 5.85 5.85 5.85 5.85 5.85 5.2 5.2 4.8 4.8 4.4 4.4 4.2 3.625 3.125 3.0 2.5
(2)
(2)
(2)
(2)
(2)
(2)
(2)
(2) $5,528.70 5,328.90 5,123.30 3,924.45 3,604.80 3,379.50 3,131.70 3,003.00 2,791.80 2,532.60 2,391.90 2,170.80 1,975.05 1,587.67 1,403.77 1,070.85
965.25 895.05 824.85 772.20 631.80 468.00 405.60 374.40 374.40 343.20 290.40 277.20 174.00 150.00 144.00 120.00
12.4 12.4 12.4 12.4 12.4 12.4 12.4 12.4 12.4 12.4 12.4 12.4 12.12 12.12 11.4 11.4 11.4 11.4 8.05 8.05 8.00 7.05 7.05 7.1 7.0 7.0 7.0 7.0 7.0 6.9 6.9 6.3 6.3 5.8 5.9 5.8 5.4 4.7 4.5 3.75
2.9 2.9 2.9 2.9 2.9 2.9 2.9 2.9 2.9 2.9 2.9 2.9 2.9 2.9 2.9 2.9 2.7 2.6 1.3 1.3 1.3 1.05 1.05 1.0 .9 .9 .9 .9
1.0 .8 .6 .6 .6 .6 .5 .35
..........
..........
..........
..........
15.3 15.3 15.3 15.3 15.3 15.3 15.3 15.3 15.3 15.3 15.3 15.3 15.02 15.02 14.30 14.30 14.10 14.0 9.35 9.35 9.3 8.1 8.1 8.1 7.9 7.9 7.9 7.9 8.0 7.5 7.5 6.9 6.9 6.4 6.4 6.15 5.4 4.7 4.5 3.75
(2)
(2)
(2)
(2)
(2)
(2)
(2)
(2) $9,343.50 9,005.84 8,658.38 6,553.83 6,249.60 5,859.00 5,387.40 5,116.00 4,672.80 4,271.40 3,337.95 3,029.40 2,762.10 2,097.90 1,854.90 1,433.70 1,303.50 1,208.70 1,113.90 1,042.00
874.00 675.00 585.00 538.20 538.20 499.20 422.40 405.90 259.20 225.60 216.00 180.00

22
Tax rates, employer and employee, each
OASDI
Tax rate, self-employed
Calendar
year
Wage base OASDI HI Total
Maximum employee
tax HI Total
Maximum self-empl.
tax
1957-58 1955-56 1954 1951-53 1950 1937-49
4,200 4,200 3,600 3,600 3,000 3,000
2.25 2.0 2.0 1.5 1.5 1.0
..........
..........
..........
..........
..........
..........
2.25 2.0 2.0 1.5 1.5 1.0
94.50 84.00 72.00 54.00 45.00 30.00
3.375 3.0 3.0 2.25
..........
..........
..........
..........
..........
..........
..........
..........
3.375 3.0 3.0 2.25
..........
..........
141.75 126.00 108.00 81.00 .......... ..........
1 Sources: Kollman, Geoffrey, CRS Report for Congress, "Summary of Major Changes in the Social Security Cash Benefits Program: 1935-1993, 94-36 EPW"; Joint Committee on Taxation. The dollar amounts for maximum self-employment tax do not equal two times the maximum employee tax because of deductions or credits available to self-employed individuals in some years. 2 After 1993, the cap on wages and self-employment income subject to the HI tax was removed. 3 For 1991, the cap on wages and self-employment income subject to the HI tax was $125,000. For 1992, the cap for HI purposes was $130,200 and for 1993, the cap for HI purposes was $135,000.
Chart 1 - History of Federal Unemployment Tax Rate, 1954-2000
0
0.1
0.2
0.3
0.4
0.5
0.6
0.7
0.8
0.9
1954
1956
1958
1960
1962
1964
1966
1968
1970
1972
1974
1976
1978
1980
1982
1984
1986
1988
1990
1992
1994
1996
1998
2000
Year
Tax
Rat
es in
Per
cen
t
Statutory
Effective
Source: Chart prepared by the Congressional Research Service based on data from the U.S. Department of Labor.

23
Legislative Background
The Social Security Act of 1935 was signed into law on August 14, 1935. In addition to the Federal old-age retirement program (title II), the original Social Security Act also included grants-in-aid to States for: old-age pensions based on need (title I); unemployment compensation systems (title III); aid to dependent children (title IV); maternal and child welfare services, care of crippled children (title V); aid to the blind (title X); and public health work (title VI).
The original act has been amended on numerous occasions since 1935. However, the most significant changes to title II were made by the Social Security Amendments of 1939, 1950, 1954, 1956, 1965, 1972, 1977, and 1983. In addition, the Medicare (title XVIII) program was added to the Social Security Act of 1965.
Today the term “Social Security” is seldom used to refer to all of the programs included in the Social Security Act. The term is most often used to refer to the old-age and survivor insurance program (OASI), the disability insurance program (DI), both under title II, and Medicare part A hospital insurance (HI) under title XVIII. Together these are known as the OASDHI programs.
In 1976, Congress passed a surtax of 0.2 percent of taxable wages to be added to the permanent FUTA tax rate. This surtax has been extended five times, (most recently by the Taxpayer Relief Act of 1997) through December 31, 2007. Thus the current effective 0.8 percent FUTA tax rate has two components: a permanent rate of 0.6 percent; and a surtax rate of 0.2 percent. The wage base was held constant at $3,000 until 1971 and then was increased on a number of occasions.
The wage cap on the HI tax was repealed by the Omnibus Budget Reconciliation Act of 1993. According to the legislative history, the repeal was intended to increase the progressivity of the Federal tax system and provide funding for HI trust fund to enhance its’ long-term solvency.
D. Earned Income Credit
Present Law
In general
Eligible low-income workers are able to claim a refundable earned income credit (“EIC”). The amount of the credit an eligible taxpayer may claim depends upon whether the taxpayer has one, more than one, or no qualifying children. In addition, to claim the credit, the taxpayer must have earned income. Earned income consists of wages, salaries, other employee compensation, and net earnings from self-employment.
The maximum EIC is phased in as an individual’s earned income increases. The credit phases out for individuals with earned income (or if greater, modified AGI) over certain levels.

24
The EIC is not available to married taxpayers filing separate returns.
Qualifying child
In order to claim the EIC, a taxpayer must either (1) have a qualifying child or (2) meet the requirements for childless adults. A qualifying child must meet a relationship test, an age test, and a residence test. First, the qualifying child must be the taxpayer’s child, stepchild, adopted child, grandchild, or foster child. Second, the child must be under age 19, (or under age 24 if a full-time student) or permanently and totally disabled regardless of age. Third, the child must live with the taxpayer in the United States for more than half the year (a full year for foster children). If a child otherwise qualifies with respect to more than one person, the child is treated as a qualifying child only of the person with the higher modified AGI.
A valid social security number must be provided with respect to each qualifying child with respect to which EIC is claimed.
Requirements for adults without a qualifying child
In order to claim the EIC without a qualifying child, the taxpayer must be over age 24 and under age 65. In addition, the taxpayer cannot be the dependent or qualifying child of another taxpayer.
Taxpayers with excessive investment income
A taxpayer with an excessive amount of disqualified income for the tax year cannot claim the EIC. For the taxable year 2001, that amount is $2,450. Disqualified income is the sum of (1) interest and dividends includible in gross income for the taxable year; (2) tax-exempt interest received or accrued in the taxable year; (3) net income from rents and royalties not derived in the ordinary course of business; (4) capital gain net income; and (5) net passive income.
Calculation of the credit
The credit is determined by multiplying the credit rate by the taxpayer's earned income up to an earned income threshold. The maximum amount of the credit is the product of the credit rate and the earned income threshold. The maximum credit amount applies to taxpayers with (1) earnings at or above the creditable limit and (2) modified AGI15 (or earnings, if greater) at or below the phaseout threshold level.
15 “Modified AGI” means AGI determined without regard to certain losses and increased
by certain amounts not includible in gross income. The losses disregarded are: (1) net capital losses (up to $3,000); (2) net losses from estates and trusts; (3) net losses from nonbusiness rents and royalties; (4) 75 percent of the net losses from businesses, computed separately with respect to sole proprietorships (other than farming), farming sole proprietorships and other businesses. For purposes of (4), amounts attributable to a business that consists of the performance of services by the taxpayer as an employee are not taken into account. The amounts added to adjusted gross income to arrive at modified adjusted gross income include: (1) tax-exempt interest; and (2) nontaxable distributions from pensions, annuities, and individual retirement plans (but not nontaxable rollover distributions or trustee-to-trustee transfers). Sec. 32(c)(5).

25
For taxpayers with modified AGI (or earned income, if greater) in excess of the phaseout threshold, the credit amount is reduced by the phaseout rate multiplied by the amount of earned income (or modified AGI, if greater) in excess of the phaseout threshold. In other words, the credit amount is reduced, falling to $0 at the “breakeven” income level, the point where a specified percentage of “excess” income above the phaseout threshold offsets exactly the maximum amount of the credit. The earned income threshold and the phaseout threshold are indexed for inflation. The table below shows the earned income credit parameters for the taxable year 2001.16
Table 7.--Earned Income Credit Parameters for Taxable Years Beginning in 2001
Two or more
qualifying children
One qualifying
child
No qualifying
children
Credit rate (percent).................................... Earned income amount................................ Maximum credit .........................................
40.00% $10,020 $4,008
34.00% $7,130 $2,424
7.65% $4,760
$364 Phase-out begins......................................... Phase-out rate (percent)...............................
$13,090 21.06%
$13,090 15.98%
$5,950 7.65%
Phase-out ends............................................
$32,121
$28,281
$10,710
For the taxable year 2001, it is estimated that 4.8 million returns will be affected by the phasein, and 11.6 million returns will be affected by the phaseout. For the taxable year 2005, these numbers are estimated to slightly decrease, with 4.6 million returns affected by the phasein, and 11.3 million returns affected by the phaseout.
Advance payment option
Eligible taxpayers may elect to receive an advance payment of the EIC from their employer. Employers report the amount of the advance credit that an employee receives during the year on the employee’s Form W-2. The amount of the advance payment of the EIC is limited to 60 percent of the maximum credit available to an individual with one qualifying child. The advance payment option is not available to a taxpayer who does not have a qualifying child.
Taxpayers receiving advance EIC payments must file an income tax return regardless of their income level. The advance EIC payments are reported as “other tax” due on the return and the taxpayer is allowed the appropriate amount of EIC. By treating the advance EIC payments as additional tax, any excess payments over the appropriate amount of EIC are recaptured.
16 The table is based on Rev. Proc. 2001-13.

26
Taxpayers previously denied the EIC
Fraudulent and reckless claims
Any taxpayer who has been denied the EIC based on a final determination that the claim was fraudulent cannot claim the credit for a period of ten taxable years. The ten-year period begins after the most recent taxable year for which there was a final determination of fraud.
Taxpayers for whom there has been a final determination that the taxpayer’s claim was due to intentional or reckless disregard of the rules and regulations (but not fraud) are not allowed to claim the credit for two taxable years. The two-year period begins after the most recent taxable year for which there was a final determination of recklessness or intentional disregard.
Improper claims
Taxpayers who are denied the credit as a result of deficiency procedures are not allowed to claim the credit for any subsequent taxable year unless the taxpayer provides the IRS with proof of eligibility for the credit. The form to demonstrate EIC eligibility for this purpose is Form 8862, “Information to Claim Earned Income Credit After Disallowance.” Failure to provide the information required to prove eligibility is treated as a mathematical or clerical error. The IRS may summarily assess the tax due as a result of the disallowance.17
Tax preparer penalties
The Code requires paid preparers who complete EIC returns to comply with due diligence requirements imposed by Treasury regulations. A penalty of $100 applies to each failure to comply with these requirements. Under the regulations, the preparer must:
(1) complete the Eligibility Checklist (Form 8867, Paid Preparer's Earned Income Credit Checklist, or other permissible form), or otherwise record in its files the information necessary to complete it;
(2) complete the Computation Worksheet (Earned Income Credit Worksheet found in the Form 1040 instructions), or otherwise record in its files the computation and information necessary to complete the worksheet;
(3) have no knowledge, and have no reason to know, that any information it used to determine eligibility for, and the amount of, the EIC is incorrect; and
(4) retain these items for three years after the June 30th following the date the return or claim for refund was presented to the taxpayer for signature. The records may be retained on paper or electronically.18
17 Sec. 6213(g)(2)(K).
18 Treas. Reg. sec. 1.6695-2(b).

27
Legislative Background
The EIC was enacted in 1975 as a means of targeting tax relief to working low-income taxpayers with children. When the EIC was first enacted, its original purposes were to offset the impact of Social Security taxes on the available income of working poor families and to serve as an incentive for low-income persons to work (a “work bonus”).19 As originally enacted, the credit equaled 10 percent of the first $4,000 of earned income (i.e., a maximum credit of $400). The credit began to be phased out for taxpayers with earned income (or AGI, if greater) above $4,000, and was entirely phased out for taxpayers with income of $8,000. The original EIC did not vary by family size.
The Revenue Act of 1978 increased the maximum credit to $500 (10 percent of the first $5,000 of earned income). Also, the income level at which the phaseout began was raised to $6,000, with a complete phaseout not occurring until an income level of $10,000. The Deficit Reduction Act of 1984 increased the maximum credit to $550 (11 percent of the first $5,000 of earned income) and the credit was phased out beginning at $6,500 of income and ending at $11,000.
The Tax Reform Act of 1986 increased the maximum credit to $800 (14 percent of the first $5,714 of earned income), beginning in 1987. The maximum credit was reduced by 10 cents for each dollar of earned income (or AGI, if greater) in excess of $9,000 ($6,500 in 1987). These $5,714 and $9,000 amounts (stated above in 1985 dollars) were indexed for inflation.
In 1990, the Omnibus Budget Reconciliation Act of 1990 (“OBRA 1990”) increased the credit and adjusted the EIC for families with more than one child.
OBRA 1990 also created two additional credits as part of the EIC: the supplemental young child credit and the supplemental health insurance credit. Both of these supplemental credits used the same income base as the basic EIC. The health insurance credit and phaseout rates were set at 6 percent and 4.285 percent, respectively. For the young child credit, eligible families with children under 1 year of age had an extra 5 percentage points added to their credit rate in computing the basic EIC amount. The young child credit was phased out by adding an extra 3.57 percentage points to the family’s phaseout rate.
The Omnibus Budget Reconciliation Act of 1993 (“OBRA 1993”) expanded the EIC in several ways, while repealing the supplemental young child credit and supplemental health insurance credit. For taxpayers with one qualifying child, the EIC was increased to 26.3 percent of the first $7,750 of earned income in 1994. For 1995 and thereafter, the credit rate was increased to 34 percent. In 1995, the maximum amount of earned income on which the credit could be claimed is $6,160 (this is a $6,000 base in 1994, adjusted for inflation). The phaseout rate for 1994 and thereafter is 15.98 percent.
For taxpayers with two or more qualifying children, the EIC was increased to 30 percent of the first $8,425 of earned income in 1994. The maximum credit for 1994 was $2,527 and was reduced by 17.68 percent of earned income (or AGI, if greater) in excess of $11,000. The credit
19 S. Rep. No. 94-36 at 11 (1975).

28
rate increases over time and equals 36 percent for 1995 and 40 percent for 1996 and thereafter. The phaseout rate is 20.22 percent for 1995 and 21.06 percent for 1996 and thereafter.
OBRA 1993 also extended the EIC to taxpayers with no qualifying children. The rationale for this extension was to offset partly the effect of an OBRA 1993 gasoline tax increase on low-income persons, as well as to reduce the impact of income and payroll taxes on those with a lower ability to pay those taxes.20 This credit for taxpayers with no qualifying children is available to taxpayers over age 24 and below age 65.
The implementing legislation for the General Agreements on Tariffs and Trade, enacted in 1994, made a number of modifications to the EIC. First, it denied the EIC to inmates for any amount received for services provided by the inmate in a penal institution. Second, it generally made nonresident aliens ineligible to claim the EIC. Third, it deemed that a member of the Armed Forces stationed outside the United States while serving on extended active duty would satisfy the test that the principal place of abode be within the United States. Fourth, it required that members of the Armed Forces receive annual reports from the Department of Defense of earned income (which includes nontaxable earned income such as amounts received as basic allowances for housing and subsistence). Fifth, it required a TIN for each qualifying child regardless of the dependent's age. Prior to the legislation, taxpayers had to provide a TIN only for qualifying children who attained the age of one before the close of the taxpayer's taxable year.
The Self-Employed Person's Health Care Reduction Extension Act of 1995 introduced the concept of disqualified income, effective for taxable years beginning after December 31, 1995. A taxpayer is not eligible for the EIC if the aggregate amount of disqualified income (i.e., taxable and tax-exempt interest, dividends, and (if greater than zero) net rent and royalty income) of the taxpayer for the taxable year exceeds $2,350 (“the disqualified income test”).
The Personal Responsibility and Work Opportunity Reconciliation Act of 1996 included several changes to the EIC. First, it modified the disqualified income test by adding capital gain net income and net passive income (if greater than zero) that is not self-employment income to the definition of disqualified income, and by reducing the threshold above which an individual is not eligible for the EIC from $2,350 to $2,200 (indexed for inflation). Second, it modified the definition of AGI used for phasing out the earned income credit by disregarding certain losses. The losses disregarded are: (1) net capital losses (up to $3,000); (2) net loses from trusts and estates; (3) net losses from nonbusiness rents and royalties; and (4) 50 percent of the net losses from businesses, computed separately with respect to sole proprietorships (other than in farming), sole proprietorships in farming, and other businesses. Third, it applied mathematical and clerical error treatment to the failure to provide a correct Social Security Number (“SSN”) or to pay the proper amount of self-employment tax on net self-employment earnings on which an EIC is claimed. Finally, it denied the EIC to individuals whose SSNs were issued solely for purposes of the individual applying for or receiving Federally funded benefits.
20 H.R. Rep. No. 103-111 at 4, 609 (1993).

29
The Taxpayer Relief Act of 1997 (“TRA 1997”) included provisions to improve compliance as a result of concern over the error rates associated with EIC claims. The provisions: (1) deny the EIC for 10 years to taxpayers who fraudulently claimed the EIC (2 years for EIC claims which are a result of reckless or intentional disregard of rules or regulations); (2) require EIC recertification for a taxpayer who is denied the EIC; (3) impose due diligence requirements on paid preparers of returns involving the EIC; (4) provide the Treasury Department with access to the Federal Case Registry of Child Support orders; and (5) allow expanded use of Social Security Administration records to enforce the tax laws including the EIC. TRA 1997 also (1) added two items of nontaxable income to the definition of modified AGI (tax-exempt interest and nontaxable distributions from pension, annuities, and IRAs (other than rollover distributions)) and (2) increased the disregarded amount of net business losses from 50 percent to 75 percent.
The Balanced Budget Act of 1997 increased the IRS authorization to improve enforcement of the EIC. Congress authorized the IRS to spend a total of $716 million over a 5-year period for the improved administration of the EIC.
Below are tables showing the historical earned income parameters, the number of recipients, and amount of credit.

30
Table 8.--Earned Income Credit Parameters, 1975-2000
[Dollar amounts unadjusted for inflation]
Phaseout range
Calendar year
Credit rate
(percent)
Income for maximum
credit
Maximum credit
Phaseout rate
(percent) Beginning
income Ending income
1975-78 1979-84 1985-86 1987 1988 1989 1990 1991: One child Two children 1992: One child Two children 1993: One child Two children 1994: No children One child Two children 1995: No children One child Two children 1996: No children One child Two children 1997: No children One child Two children 1998: No children One child Two children 1999: No children One child Two children
10.00 10.00 14.00 14.00 14.00 14.00 14.00
16.70 17.30
17.60 18.40
18.50 19.50
7.65
26.30 30.00
7.65
34.00 36.00
7.65
34.00 40.00
7.65
34.00 40.00
7.65
34.00 40.00
7.65
34.00 40.00
$4,000 5,000 5,000 6,080 6,240 6,500 6,810
7,140 7,140
7,520 7,520
7,750 7,750
4,000 7,750 8,425
4,100 6,160 8,640
4,220 6,330 8,890
4,340 6,500 9,140
4,460 6,680 9,390
4,530 6,800 9,540
$400 500 550 851 874 910 953
1,192 1,235
1,324 1,384
1,434 1,511
306
2,038 2,528
314
2,094 3,110
323
2,152 3,556
332
2,210 3,656
341
2,271 3,756
347
2,312 3,816
10.00 12.50 12.22 10.00 10.00 10.00 10.00
11.93 12.36
12.57 13.14
13.21 13.93
7.65
15.98 17.68
7.65
15.98 20.22
7.65
15.98 21.06
7.65
15.98 21.06
7.65
15.98 21.06
7.65
15.98 21.06
$4,000 6,000 6,500 6,920 9,840
10,240 10,730
11,250 11,250
11,840 11,840
12,200 11,200
5,000
11,000 11,000
5,130
11,290 11,290
5,280
11,610 11,610
5,430
11,930 11,930
5,570
12,260 12,260
5,670
12,460 12,460
$8,000 10,000 11,000 15,432 18,576 19,340 20,264
21,250 21,250
22,370 22,370
23,050 23,050
9,000
23,755 25,296
9,230
24,396 26,673
9,500
25,078 28,495
9,770
25,750 29,290
10,030 26,473 30,095
10,200 26,928 30,580
2000: No children One child Two children
7.65
34.00 40.00
4,610 6,920 9,720
353
2,353 3,888
7.65
15.98 21.06
15,700 12,690 12,690
10,380 27,413 31,152
Source: Joint Committee on Taxation

31
Table 9.--Earned Income Credit: Number of Recipients and Amount of Credit, 1975-2000
Year
Number of recipient families
(thousands)
Total amount
of credit (millions)
Refunded portions of credit (millions)
Average
credit per family
1975................................... 1976................................... 1977................................... 1978................................... 1979................................... 1980................................... 1981................................... 1982................................... 1983................................... 1984................................... 1985................................... 1986................................... 1987................................... 1988................................... 1989................................... 1990................................... 1991................................... 1992................................... 1993................................... 1994................................... 1995................................... 1996................................... 1997................................... 19981.................................. 19992.................................. 20002.................................. 20012.................................. 20022..................................
6,215 6,473 5,627 5,192 7,135 6,954 6,717 6,395 7,368 6,376 7,432 7,156 8,738
11,148 11,696 12,542 13,665 14,097 15,117 19,017 19,334 19,464 19,391 19,766 20,453 19,838 19,492 19,054
$1,250 1,295 1,127 1,048 2,052 1,986 1,912 1,775 1,795 1,638 2,088 2,009 3,391 5,896 6,595 7,542
11,105 13,028 15,537 21,105 25,956 28,825 30,389 31,777 32,269 33,384 33,604 33,973
$900 890 880 801
1,395 1,370 1,278 1,222 1,289 1,162 1,499 1,479 2,930 4,237 4,636 5,266 8,183 9,959
12,028 16,598 20,829 23,157 24,396 27,175 27,602 28,555 26,666 28,881
$201 200 200 202 288 286 285 278 224 257 281 281 450 529 564 601 813 924
1,028 1,110 1,342 1,481 1,567 1,608 1,578 1,682 1,723 1,783
1 Preliminary. 2 Projected. Source: For 1975-98, Internal Revenue Service; for 1999-2002, Joint Committee on Taxation.

32
III. THE PRESIDENT’S INDIVIDUAL INCOME TAX RATE PROPOSALS
In general
The proposal would create a new low-rate regular income tax bracket for a portion of taxable income that is currently taxed at 15 percent. The proposal would reduce other regular income tax rates and consolidate rate brackets. By 2006, the present-law structure of five regular income tax rates (15 percent, 28 percent, 31 percent, 36 percent and 39.6 percent) would be reduced to four rates of 10 percent, 15 percent, 25 percent, and 33 percent. The proposal would repeal the present-law provisions that offset the refundable child credit and the earned income credit by the amount of the alternative minimum tax.
New low-rate bracket
The proposal would establish a new regular income tax rate bracket for a portion of taxable income that is currently taxed at 15 percent, as shown in Table 10, below. The taxable income levels for the new low-rate bracket would be adjusted annually for inflation for taxable years beginning after December 31, 2006.
Table 10.--Proposed New Low-Rate Bracket
Taxable Income Calendar Year
Single Individuals
Heads of Household
Married Filing Joint Returns
Proposed New Rate
2002 0-$6,000 0-$10,000 0-$12,000 14% 2003 0-$6,000 0-$10,000 0-$12,000 13% 2004 0-$6,000 0-$10,000 0-$12,000 12% 2005 0-$6,000 0-$10,000 0-$12,000 11% 2006 0-$6,000 0-$10,000 0-$12,000 10% 2007 and later Adjust annually for inflation 10%
Modification of 15-percent bracket
The 15-percent regular income tax bracket would be modified to begin at the end of the new low-rate regular income tax bracket. The 15-percent regular income tax bracket would end at the same level as under present law.
Reduction of other rates and consolidation of rate brackets
The present-law regular income tax rates of 28 percent and 31 percent would be phased down to 25 percent over five years, effective for taxable years beginning after December 31, 2001. The taxable income level for the new 25-percent rate bracket would begin at the level at which the 28-percent rate bracket begins under present law and end at the level at which the 31-percent rate bracket ends under present law.

33
The present-law regular income tax rates of 36 percent and 39.6 percent would be phased down to 33 percent over five years, effective for taxable years beginning after December 31, 2001. The taxable income level for the new 33 percent-rate bracket would begin at the level at which the 36-percent rate bracket begins under present law.
Table 11, below, shows the schedule of proposed regular income tax rate reductions.
Table 11.--Proposed Regular Income Tax Rate Reductions
Calendar Year
28% rate reduced to:
31% rate reduced to:
36% rate reduced to:
39.6% rate reduced to:
2002 27% 30% 35% 38% 2003 27% 29% 35% 37% 2004 26% 28% 34% 36% 2005 26% 27% 34% 35% 2006 and later 25% 25% 33% 33%
Projected regular income tax rate schedules under the proposal
Table 12, below, shows the projected individual regular income tax rate schedules when the rate reductions are fully phased in (i.e., for 2006). As under present law, the rate brackets for married taxpayers filing separate returns would be one half the rate brackets for married individuals filing joint returns. In addition, appropriate adjustments would be made to the separate, compressed rate schedule for estate and trusts.

34
Table 12.--Individual Regular Income Tax Rates for 2006 (Projected)
If taxable income is: Then regular income tax equals:
Single individuals
$0-6,000............................................... 10 percent of taxable income
$6,000-30,950 ...................................... $600, plus 15 percent of the amount over $6,000
$30,950-$156,300 ................................. $4,342.50, plus 25% of the amount over $30,950
Over $156,300...................................... $35,680, plus 33% of the amount over $156,300
Heads of households
$0-$10,000 ........................................... 10 percent of taxable income
$10,000-$41,450................................... $1,000, plus 15% of the amount over $10,000
$41,450-$173,300 ................................. $5,717.50, plus 25% of the amount over $41,450
Over $173,300...................................... $38,680, plus 33% of the amount over $173,300
Married individuals filing joint returns
$0-$12,000 ........................................... 10 percent of taxable income
$12,000-$51,700................................... $1,200, plus 15% of the amount over $12,000
$51,700-$190,300 ................................. $7155, plus 25% of the amount over $51,700
$190,300 .............................................. $41,805, plus 33% of the amount over $190,300
Effective Date
The proposals generally would apply to taxable years beginning after December 31, 2001.

35
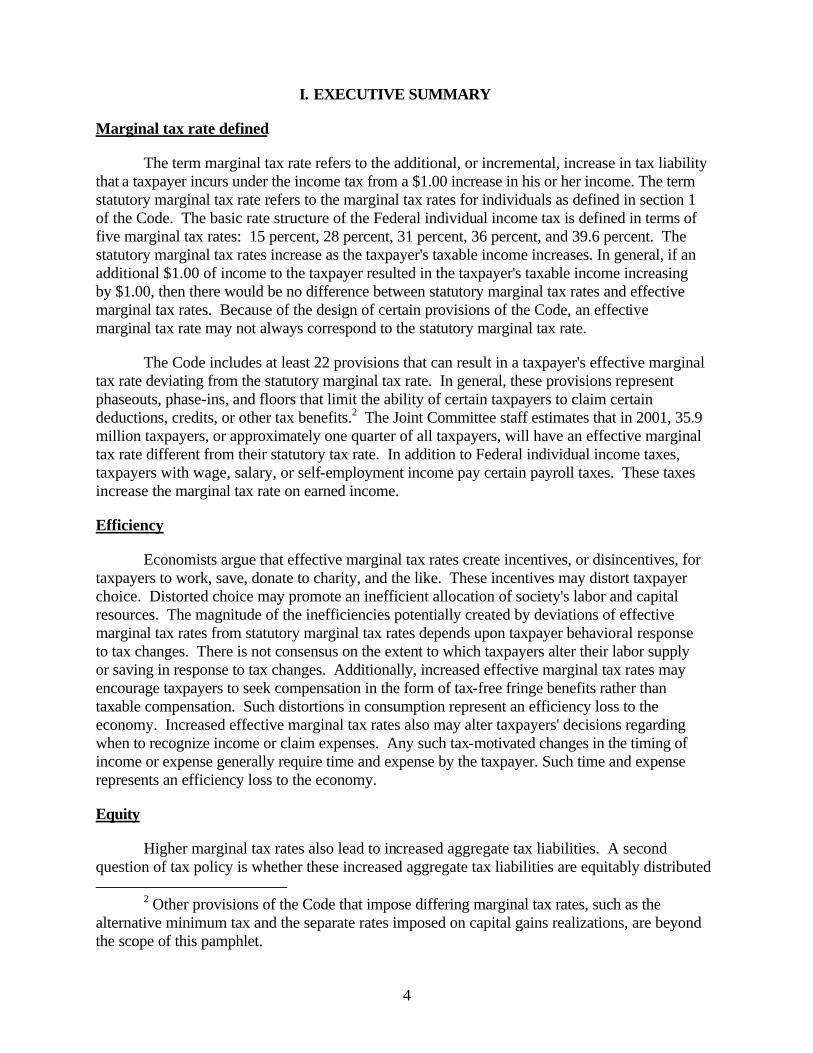
IV. BACKGROUND ECONOMIC DATA
Table 13 shows some background aggregate economic data for recent years that is potentially relevant to a discussion of marginal rate issues. Table 13 shows data since 1990 for nominal Gross Domestic Product (“GDP”) and nominal individual income tax revenues. The table shows that individual income tax revenues have grown faster than GDP and that as a percentage of GDP individual income tax revenues have grown from 8.0 percent to 10.1 percent. Numerous factors play a role in the relationship of GDP growth to individual income tax growth; among them are major tax law changes such as those enacted in 1990, 1993, and 1997, increases in wages above increases in inflation that cause the so-called “real” bracket creep (because features of the tax Code that are indexed are only indexed to capture the effects of inflation rather than real growth), changes in the distribution of economic growth (because of our progressive tax system, tax revenues will rise faster if income growth is skewed towards the top of the income distribution), and capital gains realizations, which influence tax revenues but have no direct relation to GDP.
It would be difficult if not impossible to accurately sort out the influences of these various factors even with an exhaustive study of the issue. With respect to the issue of real bracket creep, Table 14 shows data on nominal average weekly earnings and on the level of the Consumer Price Index (“CPI”). Between 1990 and 2000, nominal average weekly earnings grew 37 percent while the CPI grew 32 percent. This modestly stronger growth in earnings would gradually push taxpayers into higher marginal rate brackets in a tax system that is indexed only for inflation and is not otherwise altered through changes in law. Growth in GDP in excess of the CPI or other price indices is not directly relevant to the issue of bracket creep, as real GDP growth is strongly influenced by population growth, and real growth that merely reflects population growth will not push taxpayers into higher tax brackets. Thus, for example, if GDP doubles but the number of tax filers also doubles, income reported per tax return will not change and thus taxpayers will not experience bracket creep.21
Table 15 below shows Internal Revenue Service data for the number of taxpayers per marginal rate bracket for 1983 (the earliest year data are available), 1990, and 1997 (the latest year of data availability). The table also shows the average marginal tax rate for each year. The average marginal tax rate is equal to the sum of the number of taxpayers per bracket times the marginal rate, divided by the total number of taxpayers. Thus for example if there were 20 taxpayers in the 15-percent bracket and 10 in the 28-percent bracket, the average marginal rate would equal (20x15 +10x28)/(20+10) = 19.33 percent. The Joint Committee on Taxation estimates that in 2001 there will be 62.8 million taxpayers in the 15-percent rate bracket and 38 million in the 28-percent brackets and above. By 2005, 65.1 million taxpayers are estimated to be in 15-percent rate bracket for a 3.7 percent increase, while 42.7 million taxpayers are estimated to be in the 28-percent brackets or higher, for an increase of 12.4 percent.
21 As discussed above, GDP growth does not directly relate to income reported on tax
returns, though the two are highly correlated over long periods of time. The statement assumes a direct relationship for ease of exposition.
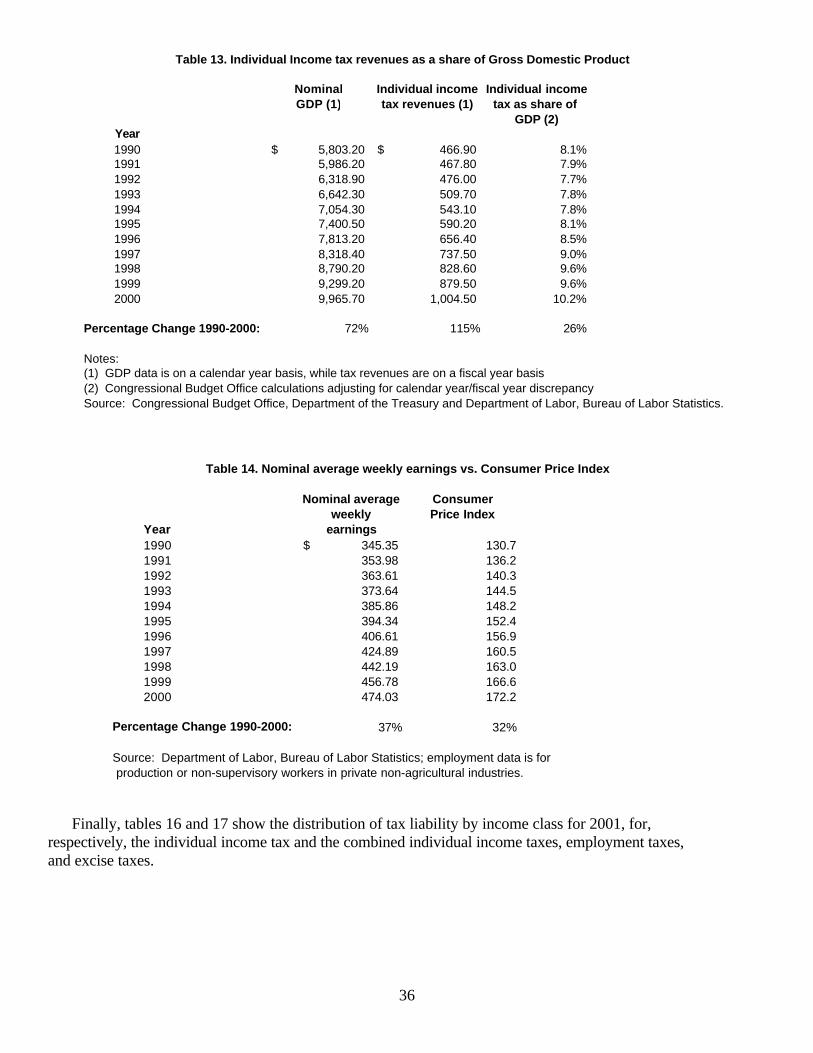
36
Finally, tables 16 and 17 show the distribution of tax liability by income class for 2001, for, respectively, the individual income tax and the combined individual income taxes, employment taxes, and excise taxes.
Table 14. Nominal average weekly earnings vs. Consumer Price Index
Nominal average Consumerweekly Price Index
Year earnings1990 345.35$ 130.71991 353.98 136.21992 363.61 140.31993 373.64 144.51994 385.86 148.21995 394.34 152.41996 406.61 156.91997 424.89 160.51998 442.19 163.01999 456.78 166.62000 474.03 172.2
Percentage Change 1990-2000: 37% 32%
Source: Department of Labor, Bureau of Labor Statistics; employment data is for production or non-supervisory workers in private non-agricultural industries.
Table 13. Individual Income tax revenues as a share of Gross Domestic Product
Nominal Individual income Individual incomeGDP (1) tax revenues (1) tax as share of
GDP (2)Year1990 5,803.20$ 466.90$ 8.1%1991 5,986.20 467.80 7.9%1992 6,318.90 476.00 7.7%1993 6,642.30 509.70 7.8%1994 7,054.30 543.10 7.8%1995 7,400.50 590.20 8.1%1996 7,813.20 656.40 8.5%1997 8,318.40 737.50 9.0%1998 8,790.20 828.60 9.6%1999 9,299.20 879.50 9.6%2000 9,965.70 1,004.50 10.2%
Percentage Change 1990-2000: 72% 115% 26%
Notes:(1) GDP data is on a calendar year basis, while tax revenues are on a fiscal year basis(2) Congressional Budget Office calculations adjusting for calendar year/fiscal year discrepancySource: Congressional Budget Office, Department of the Treasury and Department of Labor, Bureau of Labor Statistics.

37
Marginal Percent Percent Percenttax Number of total Number of total Number of total rate returns returns returns returns returns returns
10 -- -- -- -- 506,115 1%11 6,673,952 8% -- -- -- --13 5,785,666 7% -- -- -- --15 14,132,745 18% 65,767,284 71% 68,703,363 70%17 8,330,386 10% -- -- -- --18 1,187,845 1% -- -- -- --19 9,101,399 11% -- -- -- --20 -- -- -- -- 897,974 1%21 2,882,329 4% -- -- -- --23 5,625,610 7% -- -- -- --24 2,679,437 3% -- -- -- --25 717,738 1% -- -- 37,749 0%26 5,624,855 7% -- -- -- --28 2,862,298 4% 23,877,696 26% 23,821,494 24%29 298,858 0% -- -- -- --30 4,197,801 5% -- -- -- --31 -- -- -- -- 2,868,200 3%32 1,580,014 2% -- -- -- --33 -- -- 3,050,051 3% -- --34 122,785 0% -- -- -- --35 4,049,996 5% -- -- -- --36 672,438 1% -- -- 1,169,742 1%37 80,667 0% -- -- -- --
39.6 -- -- -- -- 691,359 1%40 2,068,920 3% -- -- -- --44 842,641 1% -- -- -- --45 236,934 0% -- -- -- --48 261,970 0% -- -- -- --50 557,809 1% -- -- -- --
Total returns 80,575,093 92,695,031 98,695,996Average marginal tax rate 21.0% 18.9% 19.0%
Notes: Source: Internal Revenue Service, Individual Income tax returns, 1983, 1990,1997.Data not available prior to 1983 or later than 1997.
Table 15. Tax returns by the highest marginal rate at which tax was computed,1983, 1990, 1997
1983 1990 1997

38
Table 16. DISTRIBUTION OF FEDERAL INDIVIDUAL INCOME TAX LIABILITY (1)
Calendar Year 2001
NUMBER OF RETURNSINCOME NUMBER OF INCOME INDIVIDUAL WITH ZERO OR
CATEGORY (2) RETURNS (3) INCOME TAX NEGATIVE LIABILITYMillions Percent Billions Percent Billions Percent Millions Percent
Less than $10,000............. 19.9 14.0% $83 1.0% -$6 -0.6% 18.8 38.7% 10,000 to 20,000...............23.3 16.4% 347 4.2% -10 -1.0% 16.2 33.3% 20,000 to 30,000...............18.5 13.0% 460 5.6% 9 0.9% 8.1 16.6% 30,000 to 40,000...............15.8 11.1% 549 6.7% 28 2.8% 3.2 6.6% 40,000 to 50,000...............13.1 9.2% 589 7.2% 39 3.9% 1.4 3.0% 50,000 to 75,000...............21.9 15.4% 1,337 16.4% 112 11.1% 0.8 1.6% 75,000 to 100,000...............12.9 9.1% 1,121 13.7% 119 11.8% 0.1 0.1%100,000 to 200,000...............12.8 9.0% 1,683 20.6% 237 23.6% (4) 0.1%200,000 and over............... 3.8 2.7% 1,999 24.5% 478 47.5% (4) (5)Total, All Taxpayers..........142.0 100.0% $8,168 100.0% $1,006 100.0% 48.6 100.0% Highest 10%...........................14.2 10.0% 3,431 42.0% 686 68.2% (4) 0.1% Highest 5%.............................7.1 5.0% 2,556 31.3% 570 56.6% (4) (5) Highest 1%.............................1.4 1.0% 1,402 17.2% 361 35.9% (4) (5)Source: Joint Committee on TaxationDetail may not add to total due to rounding.-----------------------------------------------------(1) Includes the outlay portion of the EIC.(2) The income concept used to place tax returns into income categories is adjusted gross income (AGI) plus: [1] tax-exempt interest, [2] employer contributions for health plans and life insurance, [3] employer share of FICA tax, [4] worker's compensation, [5] nontaxable social security benefits, [6] insurance value of Medicare benefits, [7] alternative minimum tax preference items, and [8] excluded income of U.S. citizens living abroad. Categories are measured at 2001 levels. The highest 10% begins at $107,455, the highest 5% at $145,199 and the highest 1% at $340,306.(3) Includes filing and nonfiling units. Individuals who are dependents of other taxpayers and taxpayers with negative income are excluded.(4) Less than 50,000.(5) Less than 0.005%.

39
Table 17. DISTRIBUTION OF FEDERAL TAX LIABILITY (1)
Calendar Year 2001
INCOME NUMBER OF INCOME FEDERALCATEGORY (2) RETURNS (3) TAX LIABILITY
Millions Percent Billions Percent Billions PercentLess than $10,000............. 19.9 14.0% $83 1.0% $7 0.4% 10,000 to 20,000............... 23.3 16.4% 347 4.2% 26 1.5% 20,000 to 30,000............... 18.5 13.0% 460 5.6% 62 3.5% 30,000 to 40,000............... 15.8 11.1% 549 6.7% 89 5.1% 40,000 to 50,000............... 13.1 9.2% 589 7.2% 102 5.9% 50,000 to 75,000............... 21.9 15.4% 1,337 16.4% 256 14.6% 75,000 to 100,000............... 12.9 9.1% 1,121 13.7% 244 13.9%100,000 to 200,000............... 12.8 9.0% 1,683 20.6% 408 23.3%200,000 and over............... 3.8 2.7% 1,999 24.5% 555 31.7%Total, All Taxpayers.......... 142.0 100.0% $8,168 100.0% $1,748 100.0% Highest 10%...........................14.2 10.0% 3,431 42.0% 907 51.9% Highest 5%.............................7.1 5.0% 2,556 31.3% 696 39.8% Highest 1%.............................1.4 1.0% 1,402 17.2% 396 22.6%Source: Joint Committee on TaxationDetail may not add to total due to rounding.-----------------------------------------------------(1) Federal taxes are equal to individual income tax (including the outlay portion of the EIC), employment tax (attributed to employees), and excise taxes (attributed to consumers). Corporate income tax and estate and gift taxes are not included due to uncertainty concerning the incidence of these taxes.(2) The income concept used to place tax returns into income categories is adjusted gross income (AGI) plus: [1] tax-exempt interest, [2] employer contributions for health plans and life insurance, [3] employer share of FICA tax, [4] worker's compensation, [5] nontaxable social security benefits, [6] insurance value of Medicare benefits, [7] alternative minimum tax preference items, and [8] excluded income of U.S. citizens living abroad. Categories are measured at 2001 levels. The highest 10% begins at $107,455, the highest 5% at $145,199 and the highest 1% at $340,306.(3) Includes filing and nonfiling units. Individuals who are dependents of other taxpayers and taxpayers with negative income are excluded.

40
V. GENERAL DISCUSSION OF ISSUES RELATING TO MARGINAL TAX RATES
In general
The issue of the appropriate marginal tax rate structure raises numerous policy issues. First, economists argue that effective marginal tax rates create incentives, or disincentives, for taxpayers to work, save, donate to charity, and engage in other types of activities. These incentives may distort taxpayer choice. Distorted choice may promote an inefficient allocation of society's labor and capital resources.
Higher marginal tax rates typically lead to increased aggregate tax liabilities. A second question of tax policy is whether these increased aggregate tax liabilities are equitably distributed across taxpayers.
A third issue relates to the complexity and lack of clarity created by multiple rates and various phaseout provisions that affect marginal tax rates. The creation of phaseouts adds complexity to the Code. Additional instructions are required and additional computations must be made. These provisions also may confuse taxpayers regarding what precisely is the tax base and what sort of preferences exist in the Code. Complexity and lack of clarity may promote taxpayer disillusionment, a sense of unfairness regarding the Code, and reduce compliance.
The discussion below addresses each of these issues. It also discusses certain issues that further affect effective marginal tax rates: the extent to which taxpayers may be subject to multiple phaseout provisions; the determination of effective marginal tax rates when one considers that many taxpayers also may be subject to the payroll tax; the determination of effective marginal tax rates when one considers interaction between the regular tax and the alternative minimum tax; and the determination of effective marginal tax rates when one considers interaction with State income taxes.
Issues of efficiency and growth
Economists often emphasize the importance of effective marginal tax rates because, they argue, it is effective marginal tax rates that create incentives, or disincentives, for taxpayers to work, to save, or to take advantage of various tax preferences. These incentives may distort taxpayer choice. Distorted choice may promote an inefficient allocation of society's labor and capital resources. A more efficient allocation of labor and capital resources would leave society with the same output of goods and services as it has today, plus additional resources that could be used to increase output. For this reason, economists believe that increasing efficiency in an economy will result in increased growth in the economy. Some analysts have suggested that high effective marginal tax rates may alter taxpayers' decisions to work. For example, assume a married couple with two dependent children currently in the 31-percent tax bracket has an AGI of $199,450. This AGI would place the couple at the bottom of the phaseout range of the personal exemption phaseout for 2001. Further assume that one of the couple has an opportunity to take on an additional project at work that will increase the couple's net income by $2,500. As was established in Part II above, the additional $2,500 in income to this couple will increase the

41
couple's tax liability by $847, leaving the couple an after tax net addition to income of $1,653.22 The taxpayer may feel net remuneration of $1,653 is insufficient to offset the loss of leisure time and the effort that would be expended to complete the project. If the taxpayer chooses not to work, society loses the benefit of his or her labor.
There is disagreement among economists on the extent to which labor supply decisions are affected by the effective marginal tax rate. Empirical evidence indicates that taxpayer response is likely to vary depending upon a number of taxpayer specific factors. In general, findings indicate that the labor supply of so-called "primary earners" tends to be less responsive to changes in effective marginal tax rates than is the labor supply of "secondary earners."23 Some have suggested that the labor supply decision of the lower earner or "secondary earner" in married households may be quite sensitive to the household's effective marginal tax rate.24 Other evidence suggests the decision to work additional hours may be less sensitive to changes in the effective marginal tax rate than the decision to enter the labor force.25 That is, there may be more effect on an individual currently not in the labor force than on an individual already in the labor force.
However, the importance of the personal exemption phaseout to the labor supply decision in the example above is not in the total effective marginal tax rate, but only in the incremental effect of the personal exemption phaseout provision. Because the couple is otherwise in the 31-percent statutory marginal tax bracket, in the absence of the personal exemption phaseout, an additional $2,500 of income would provide a net increase in after-tax income of $1,725 ($2,500 in gross income less $775 in income taxes that would result from the 31-percent statutory
22 As explained in Part II, an additional $2,500 in income of this couple results in an
effective marginal tax rate that is equal to the couple's statutory tax rate (31 percent) multiplied by one plus 0.0232 times the number of personal exemptions the couple many claim (four), or 31 percent multiplied by 1.0928, resulting in an effective marginal tax rate of 33.88 percent.
23 The phrase "primary earner" refers to the individual in the household who is responsible for providing the largest portion of household income. "Secondary earners" are earners other then the primary earner.
24 See, Charles L. Ballard, John B. Shoven, and John Whalley, "General Equilibrium Computations of the Marginal Welfare Costs of Taxes in the United States," American Economic Review, 75, March 1985, for a review of econometric studies on labor supply of so-called primary and secondary earners. United States Congress, Congressional Budget Office, For Better or For Worse: Marriage and the Federal Income Tax, June 1997, pp. 10-12, also reviews this literature.
25 Robert K. Triest, "The Effect of Income Taxation on Labor Supply in the United States," Journal of Human Resources, 25, 1990. More recently, Nada Eissa, "Tax Reforms and Labor Supply," in James M. Poterba, editor, Tax Policy and the Economy, 10, (Cambridge: The MIT press), 1996, reviews this literature with particular emphasis on the labor supply of women. Her evidence suggests that marginal tax rates may be an important determinant of labor force participation.

42
marginal tax rate). The personal exemption phaseout reduces the net after-tax income by an additional $72. One might conclude from this comparison that whatever marginal disincentive effect there might be is largely due to the statutory rate and that the incremental efficiency loss from the provisions by which the effective marginal tax rate deviates from the statutory marginal tax rate may be relatively small. That conclusion may not be correct in all circumstances. The efficiency loss increases as the effective marginal tax rate increases. That is, an increase in an effective marginal tax rate from 30 percent to 31 percent creates a greater efficiency loss per dollar of additional tax revenue than an increase in an effective marginal tax rate from 20 percent to 21 percent.26 Without specific information regarding taxpayer behavioral response, it is not possible to quantify the magnitude of the efficiency loss that might be created.
Economists have undertaken special study of the effect of effective marginal tax rates that are created by the EIC.27 Because, as Table 8 in Part II, above, shows, the EIC creates varying effective marginal tax rates, the aggregate effect on the economy from the EIC's structure is difficult to determine. In theory, for a taxpayer in the phase-in range, the EIC may either increase or decrease his or her labor supply. While the higher net return to additional work made possible by the phase-in makes more work attractive, the taxpayer's greater total income as a result of the subsidy makes leisure time attractive as well. A taxpayer in the flat range has no marginal inducement to increase work and, by having increased the taxpayer's net income, the EIC may make leisure time more appealing. In the phaseout range, the higher effective marginal tax rate combined with the increase in net income provided by the EIC makes additional work less appealing than additional leisure time. With more taxpayers in the phaseout and flat ranges, one might expect the EIC has a negative aggregate effect on labor supply. The aggregate effect depends on the strength of the offsetting incentives. Using empirical data, analysts disagree regarding the aggregate effects.28
26 In fact, the magnitude of the efficiency loss from taxation depends upon a measure of
the taxpayer's behavioral response, or the elasticity, and the square of the total effective marginal tax rate. Hence, a small change in an effective tax rate can create an efficiency loss that is large in relation to the change in revenue. For a detailed discussion of this point, see Joint Committee on Taxation, Methodology and Issues in Measuring Changes in the Distribution of Tax Burdens (JCS-7-93) June 14, 1993, pp. 20-31 and Harvey S. Rosen, Public Finance, second edition, (Homewood, Illinois: Richard D. Irwin), 1988, pp. 291-314.
27 For a review of this literature, see Stacy Dickert, Scott Houser, and John Karl Scholz, "The Earned Income Tax Credit and Transfer Programs: A Study of Labor Market and Program Participation," in James M. Poterba, editor, Tax Policy and the Economy, 9, Cambridge: The MIT Press), 1995. Eissa, "Tax Reforms and Labor Supply," also reviews the effects of the EIC on female labor supply.
28 Dickert, Houser, and Scholz, "The Earned Income Tax Credit and Transfer Programs," estimated that the 1993 expansion of the EIC would have the effect of reducing hours worked by families already in the labor force, but that loss would be more than offset by increased labor force participation by low-income individuals not previously in the labor force.

43
An economy’s total output capacity depends heavily on the amount of labor available to contribute to production. To the extent that portions of the potential labor force are sensitive to the effects of marginal tax rates on their after-tax wages, a reduction in the high rates generated by certain portions of the Code can contribute to increased growth in the economy.
The distorted choices that may result from increased effective marginal tax rates are not limited to decisions to work. By reducing the after-tax return to saving, increased effective marginal tax rates may distort taxpayers' decisions to save. Substantial disagreement exists among economists as to the effect on saving of changes in the net return to saving. Empirical investigation of the responsiveness of personal saving to after-tax returns provides no conclusive results. If saving is reduced, capital available for investment is reduced. Investment in technology, equipment, and structures is the engine for future productivity increases and growth in an economy. Increases in productivity increase wage rates, which provide incentives for increased labor supply. For this reason, tax policy affecting marginal tax rates on asset income can also have a significant effect on the economy’s capacity for future growth.
Additionally, increased effective marginal tax rates may encourage taxpayers to seek compensation in the form of tax-free fringe benefits rather than taxable compensation. Such distortions in consumption represent an efficiency loss to the economy. Increased effective marginal tax rates also may alter taxpayers' decisions regarding when to recognize income or claim expenses. Any such tax-motivated changes in the timing of income or expense generally require time and expense by the taxpayer. Such time and expense represents an efficiency loss to the economy.29 As noted above in the context of labor supply, it is difficult to determine the magnitude of potential efficiency loss that may arise from provisions that create an effective marginal tax rate that deviates from the statutory marginal tax rate without information regarding the taxpayers' responses to changes in tax rates.
With respect to increased marginal tax rates resulting from phaseout provisions, the one-time or temporary nature of a provision may limit taxpayer behavioral response to the deviation in the effective marginal tax rate from the statutory marginal tax rate. If taxpayer behavioral response is limited, efficiency loss is limited. For example, itemized deductions for unusually large medical expenses, itemized deductions for unreimbursed casualty losses, the adoption credit or exclusion, the recapture of interest from a qualified mortgage bond, and the first-time purchase of a home in the District of Columbia tend to be events that happen once or infrequently. If a taxpayer is subject to the effective marginal tax rate created by these provisions for only one year, the taxpayer is less likely to reduce labor supply, change the type of compensation they receive, or reduce saving. On the other hand, if the taxpayer has the opportunity to plan in advance, the one-time nature of these events may induce the taxpayer to shift the timing of income or expense. Similarly, expenditures on college tuition and repayment of student loans are of limited duration. In such circumstances, the increase in effective marginal tax rates above the statutory tax rates may not lead to a reduction in the labor supply of the
29 For a recent review of some of the economic literature relating to taxes and labor
supply, consumption distortions, and the timing of income recognition see, John F. Navratil, Essays on the Impact of Marginal Tax Rate Reductions on the Reporting of Taxable Income on Individual Income Tax Returns, unpublished Harvard University Ph.D. Thesis, 1995.
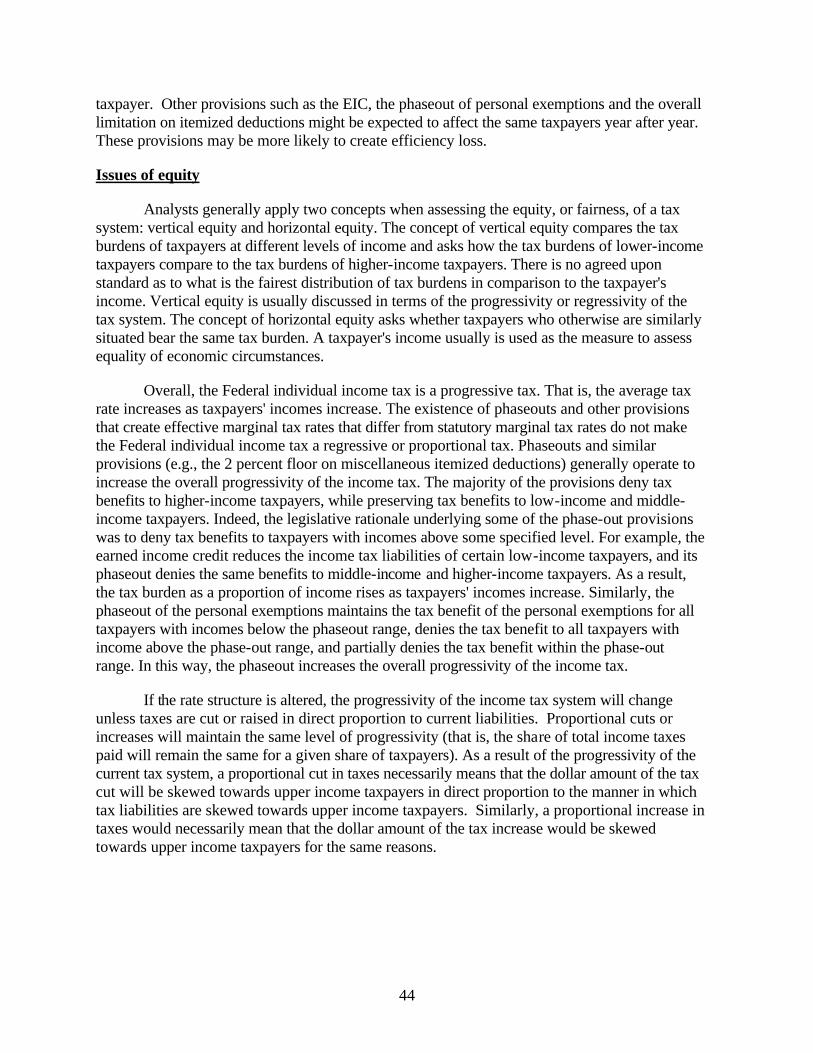
44
taxpayer. Other provisions such as the EIC, the phaseout of personal exemptions and the overall limitation on itemized deductions might be expected to affect the same taxpayers year after year. These provisions may be more likely to create efficiency loss.
Issues of equity
Analysts generally apply two concepts when assessing the equity, or fairness, of a tax system: vertical equity and horizontal equity. The concept of vertical equity compares the tax burdens of taxpayers at different levels of income and asks how the tax burdens of lower-income taxpayers compare to the tax burdens of higher-income taxpayers. There is no agreed upon standard as to what is the fairest distribution of tax burdens in comparison to the taxpayer's income. Vertical equity is usually discussed in terms of the progressivity or regressivity of the tax system. The concept of horizontal equity asks whether taxpayers who otherwise are similarly situated bear the same tax burden. A taxpayer's income usually is used as the measure to assess equality of economic circumstances.
Overall, the Federal individual income tax is a progressive tax. That is, the average tax rate increases as taxpayers' incomes increase. The existence of phaseouts and other provisions that create effective marginal tax rates that differ from statutory marginal tax rates do not make the Federal individual income tax a regressive or proportional tax. Phaseouts and similar provisions (e.g., the 2 percent floor on miscellaneous itemized deductions) generally operate to increase the overall progressivity of the income tax. The majority of the provisions deny tax benefits to higher-income taxpayers, while preserving tax benefits to low-income and middle-income taxpayers. Indeed, the legislative rationale underlying some of the phase-out provisions was to deny tax benefits to taxpayers with incomes above some specified level. For example, the earned income credit reduces the income tax liabilities of certain low-income taxpayers, and its phaseout denies the same benefits to middle-income and higher-income taxpayers. As a result, the tax burden as a proportion of income rises as taxpayers' incomes increase. Similarly, the phaseout of the personal exemptions maintains the tax benefit of the personal exemptions for all taxpayers with incomes below the phaseout range, denies the tax benefit to all taxpayers with income above the phase-out range, and partially denies the tax benefit within the phase-out range. In this way, the phaseout increases the overall progressivity of the income tax.
If the rate structure is altered, the progressivity of the income tax system will change unless taxes are cut or raised in direct proportion to current liabilities. Proportional cuts or increases will maintain the same level of progressivity (that is, the share of total income taxes paid will remain the same for a given share of taxpayers). As a result of the progressivity of the current tax system, a proportional cut in taxes necessarily means that the dollar amount of the tax cut will be skewed towards upper income taxpayers in direct proportion to the manner in which tax liabilities are skewed towards upper income taxpayers. Similarly, a proportional increase in taxes would necessarily mean that the dollar amount of the tax increase would be skewed towards upper income taxpayers for the same reasons.

45
Complexity and clarity
It is not generally believed that the number of marginal rates in the basic statutory rate structure has a significant impact on complexity.30 In terms of calculating tax liabilities, the basic tables provided by the IRS enable the taxpayer to quickly determine liability once taxable income is known, as the tables themselves have factored in the effect of the various rates. Some observers however have argued that multiple rates create complexities in tax planning since the timing of income can become more important in order to minimize tax liability. For example, if the realization of a $10,000 capital gain would push a taxpayer into a higher tax bracket (or push them into the phaseout range of a tax benefit) but a $5,000 realization would not, it would pay for that taxpayer to realize the $10,000 gain in two separate years to minimize liability. With broader tax brackets (and hence fewer rates), such timing issues will be less of a concern because broader rate brackets mean that more income is taxed at a given rate and it is then less likely that variability in income over time would alter a taxpayer’s cumulative tax liability over that time.
Phaseouts increase complexity in several ways. For those taxpayers in the phaseout range, separate worksheet calculations must be made to determine the amount of the tax benefit that is disallowed. In order to determine eligibility, such calculations are also often required of the taxpayer who is ultimately fully eligible, or fully ineligible, for the tax benefit. Phaseouts may also complicate tax planning and create unintended inequities. For example, the head of household taxpayer with a $40,000 income and a child in the first year of college would be eligible for a HOPE credit of up to $1,500. However, if such taxpayer realized a $10,000 capital gain in order to pay tuition, the taxpayer would no longer be eligible for the credit. The well-advised taxpayer who needed the funds to pay tuition would realize such gains in a tax year prior to the expenses that give rise to the credit.
Layering of provisions
It is possible for taxpayers to be subject to more than one of the phase-outs or phase-ins in the Code simultaneously. Certain of the phaseouts are mutually exclusive--for example, one could not simultaneously be subject to the personal exemptions phase-out and the phaseout for the deductibility of interest on qualified student loans, as the income ranges of the separate phaseouts do not overlap. However, other phaseouts can overlap. Taxpayers who are simultaneously subject to multiple phaseouts will face higher effective marginal tax rates than if subject to one or no phaseouts. For example, if a taxpayer with two qualifying children receives
30 The numerous rates on capital gain income that differ from ordinary income tax rates
are a significant source of complexity. Separate, and different, capital gains rates create complexity in several ways. First the lower capital gains rates cause planning complexities because taxpayers have an incentive to convert ordinary income into capital gain income. The separate rates on capital gains also require a separate and complicated 36-line computation on Schedule D of form 1040. For taxable years beginning after 2000, additional lines will be needed to take into account the additional lower rate for gains on certain assets held for five or more years.

46
an EIC on $25,000 in wage income, that taxpayer will be subject to the phase-out of the EIC (phaseout range is $13,090-$32,121 in 2001). If the taxpayer also claims the dependent care credit, he or she will also be in the phase-down range for that credit ($20,000-$30,000). As a result, on an additional $1,000 of income, this taxpayer would lose $210.60 in EIC benefits and $24 in the dependent care credit. Additionally, the taxpayer would owe $150 in Federal income taxes. The additional $1,000 would result in additional tax of $384.60, for a combined effective marginal rate of 38.5 percent.
Another example of overlapping credits could occur at higher income levels. For example, a married couple with an AGI in 2001 of $133,000 and three children would be in the phase-out range of the child credit, which begins at $110,000. They would also be subject to the limitation on itemized deductions, which begins at $132,950. As previously discussed, the limitation on itemized deductions increases the effective marginal rate to 103 percent of the statutory rate, and the child credit adds 5 percentage points to the effective marginal tax rate. Because the couple will likely be in the 28-percent statutory tax rate bracket, their effective marginal tax rate from the itemized deduction limitation will be 28.84 percent (28 percent times 1.03). With the addition of the effect of the child credit phaseout, their true effective marginal tax rate will be 33.84 (28.84 plus 5) percent. However, it should be pointed out that this couple would be completely phased out of their child credits when their AGI exceeded $139,000, and then they would only be affected by the itemized deduction limitation, implying their effective marginal tax rate would fall back to 28.84 percent.
It is possible for the interactions of the phaseouts to create marginal tax rates that many would think of as excessive. For example, consider the following conceivable scenario: A 62-year-old head of household retiree with two children in college who both would qualify for a HOPE credit, $10,000 in Social Security benefits, $10,000 in labor income, and $23,000 in taxable pensions, dividends, etc., could face an effective marginal tax rate as high as 90 percent. If this taxpayer were to earn an additional $100 in wage income, he would owe $7.65 in additional social security taxes.31 Additionally, this taxpayer would have income and social security benefits that would place him in the situation of having an additional 85 cents of social security benefits included in taxable income for each dollar of additional non-social security income. Hence, the taxpayer would see his taxable income rise by $185 as a result of the additional $100 in wage income. This taxpayer would be in the 15 percent statutory bracket assuming they claimed the standard deduction. Hence, the additional income would imply additional federal income taxes of $27.75 (185 percent times 15 percent times $100). If the two children each qualified for the full $1,500 HOPE credit, the taxpayer would have $3,000 in potential credits. However, under the above income circumstances, the taxpayer would be in the phase-out range for the HOPE credit (AGI of $40,000-$50,000 for head of household filers). Because the length of the phase-out range is only $10,000, the $3,000 credit is phased out at a rate of 30 percent for each dollar increase in AGI in the phaseout range. Ordinarily, then, this taxpayer would experience an additional 30 percentage point increase in his statutory marginal tax rate--the additional $100 in wage income would cause a loss of $30 in credits. However, the phaseout of HOPE credit is based on AGI, not the wage income itself, and because of the social security provision that also affects this taxpayer, AGI rises by $185 for each dollar of wage
31 The employer share of social security taxes is ignored for this example.

47
income. Hence, rather than lose $30 in HOPE credits, the taxpayer would lose $55.50 (30 percent of $185) in credits. In the end, this taxpayer would owe $90.90 in additional federal taxes for the additional $100 in wage income. It is possible that State and local income taxes could push this taxpayer into a situation where the taxes owed as a result of the additional income could exceed the full amount of the income.
In general, the phase-out provisions that affect the greatest numbers of taxpayers do not have phaseouts that overlap. For example, a married couple in the phase-out range for the HOPE credit ($80,000-$100,000) could not be eligible for the EIC (phased out by $32,121 in 2001), will have already have had any dependent care credit phased down (phase down is complete by $30,000), and would not yet be in the phase-out range for the child credit (phaseout starts at $110,000), the limitation on itemized deductions (limitation starts at $132,950), or the personal exemption phaseout (phaseout starts at $199,450).
Effective marginal tax rates, the Federal individual income tax and Federal payroll taxes
The majority of taxpayers also are subject to the payroll tax either at a rate of 7.65 percent (OASDI and HI combined), at a rate of 1.45 percent (HI component only), or at a rate of 15.30 percent (self-employment tax32). Indeed, many taxpayers have payroll tax liabilities but have no Federal individual income tax liabilities. The Joint Committee on Taxation estimates that, in 2001, of 110 million taxfiling units with payroll tax liabilities, 27 million faced no individual income tax liability after credits.33 These taxpayers will have a marginal federal income tax rate of zero, but would face the marginal rates of the payroll tax.
An additional $1.00 of wage income generally will increase the taxpayer's income tax liability by the taxpayer's effective marginal income tax rate and, in addition, will increase the taxpayer's combined (income and payroll) tax liability by the sum of the taxpayer's effective marginal income tax rate and the taxpayer's applicable marginal payroll tax rate. For example, for the taxpayer with wage earnings less than $80,400 in 2001, an additional $1.00 of wages will increase his or her combined tax liability by his or her effective marginal income tax rate plus 7.65 percent.34 Moreover, most analysts conclude that both the employee's and employer's share
32 The 15.3-percent self-employment tax rate equals the sum of the employee's and
employer's share of the payroll tax. One-half of a self-employed individual's self-employment tax for the taxable year is allowed as an above-the-line deduction for the individual's Federal individual income tax. A self-employed taxpayer with self-employment income in excess of $80,400 in 2001 would be subject to a 2.9-percent HI tax rate only.
33 The CBO estimates that, for 1999, 45 percent of all individuals and families who pay some payroll taxes have greater payroll tax liability than federal income tax liability. See CBO, Estimates of Federal Tax Liabilities for Individuals and Families by Income Category and Family Type for 1995 and 1999, May 1998. Taxpayers with greater payroll taxes than income taxes do not necessarily face higher marginal rates under the payroll tax than the income tax.
34 For employees with wages above $80,400 in 2001, only the HI component of the payroll tax applies. The HI component is imposed at a rate of 1.45 percent on the employee's wages plus 1.45 percent on the employer. Analysis of effective marginal tax rates comparable to

48
of the payroll tax is borne by the employee and that therefore the marginal payroll tax rate would include both the employee's and employer's share. However, such a computation is subtler than merely adding the employer's share of 7.65 percent to the employee rate of 7.65 percent. If the employer's share is to be added, that amount also should be accounted as wage compensation to the employee, as it represents additional compensation paid that is taxed away at the employer level. Accordingly, an additional $1.00 of wage income paid to the employee actually represents gross compensation of $1.0765 when the employer's payroll tax share is taken into consideration. Thus, the effective marginal payroll tax rate would be 14.21 percent (the sum of the employee's 7.65 cents plus the employer's 7.65 cents divided by the employee's additional total wage compensation of $1.0765).35
The alternative minimum tax and effective marginal tax rates
The AMT presents several issues in trying to determine the marginal effective tax rate applicable to an individual. First, if an individual is subject to the AMT, the statutory tax rates that one should focus on in determining the effective marginal tax rate generally are the AMT rates. However, if a taxpayer who otherwise would be subject to the AMT generates sufficient additional income, the taxpayer may become subject to the regular tax. In such a case, the regular tax rates would determine the taxpayer's effective marginal tax rate. For example, assume that a married couple filing a joint return have a large number of dependents and a large amount of State and local property and income taxes so that their taxable income for regular tax purposes is $42,520 (resulting in a regular tax liability of $6,400), but their AMTI (before their $45,000 exemption amount) is $70,000 (resulting in a tentative minimum tax of $6,500). Their marginal tax rates are 28 percent for regular tax purposes and 26 percent for AMT purposes. In this case, the taxpayers are subject to AMT ($6,500 being greater than $6,400). If the taxpayers generate an additional $6,000 of income, their regular tax liability becomes $8,080 and their tentative minimum tax becomes $8,060, and the taxpayers are no longer subject to the AMT. Their effective marginal tax rate for the additional $6,000 in taxable income is 26.33 percent ($1,580/$6,000), which is a blended rate comprised of both the 28-percent regular tax rate and the 26-percent AMT rate. Any additional marginal income in excess of this $6,000 will be subject to the 28-percent marginal rate.
In addition, to the extent that an individual's AMT liability gives rise to the AMT credit that may be used by the taxpayer in the future to reduce his or her regular tax liability, the effect of marginal income on the present value of such credit also must be taken into account. Finally, because the AMT exemption amount is phased out as the taxpayer's AMTI increases, the marginal effective AMT rate for a taxpayer within the phaseout range is higher than the
that of the subsequent text would apply to those taxpayers for whom additional wages are subject only to the HI component of the payroll tax.
35 In calculating an effective combined marginal tax rate applicable to an additional $1.00 of wage income for a taxpayer subject to the payroll tax, not only should the effective marginal payroll tax rate be adjusted for the additional amount of compensation that is taxed away at the employer level, but the effective marginal income tax rate also should be adjusted for the additional amount of compensation that is taxed away at the employer level.

49
applicable statutory AMT rate. The effective marginal AMT rates are 32.5 percent at the beginning of the phaseout range and 35 percent at the end of the phaseout range.
Effective marginal tax rates and other taxes or programs
In addition to payroll taxes and the AMT, other taxes that the taxpayer may be obligated to pay increase the overall effective marginal tax rate. For some taxpayers an additional consideration might be the Federal estate tax. If the taxpayer were contemplating working in part to leave a bequest, then the individual would consider the estate tax to increase the effective marginal tax rate applicable to additional dollars of income. Likewise, if a taxpayer sought to earn additional income to purchase a good that is taxable under a State sales tax or a Federal excise tax, the taxpayer might have an effective marginal tax rate on the additional earnings greater than that calculated here.
Most State individual income taxes adopt Federal individual income tax definitions of AGI and taxable income. As a result, the provisions analyzed above that change the taxpayer's effective marginal tax rate by increasing the taxpayer's taxable income subject to tax at the Federal statutory marginal tax rates generally will increase the taxpayer's taxable income subject to State statutory marginal income tax rates. This would create an effective State marginal tax rate in excess of State statutory marginal tax rates.36 Considering State income taxes would imply that this pamphlet's analysis of effective marginal income tax rates would understate the magnitude of effective marginal tax rates. However, some of the provisions analyzed above, such as the earned income credit, the dependent care credit, and the child tax credit do not alter the taxpayer's Federal taxable income, only the taxpayer's Federal tax liability. Consideration of State income taxes generally would not alter this pamphlet's analysis of effective marginal income tax rates created by those provisions.
Overall effective marginal tax rates should also consider the effects of certain government programs that also implicitly create effective marginal tax rates that deviate from the statutory marginal tax rates in the Code. For example, beneficiaries of food stamp benefits, Medicaid benefits, low-income housing subsidies, and subsidized student loans generally are subject to income or asset tests. The benefits of these programs generally are phased out as the individual crosses certain income or asset thresholds. These phaseouts create an implicit marginal tax on additional income earned by the individual.37 These implicit taxes are in addition to those imposed by the Code.
36 It is important to recognize that State income taxes are deductible for Federal income
tax purposes for those that itemize their deductions, and thus consideration of the effect on marginal rates of State taxes needs to account for that deductibility.
37 For a brief discussion of the implicit taxes created by the food stamp program and AFDC see, Dickert, Houser, and Scholz, “The Earned Income Tax Credit and Transfer Programs.”