Embed Size (px)
Citation preview
1
December, 2020 Department of Social Services
Overview of HUSKY Health Quality and Cost Trends
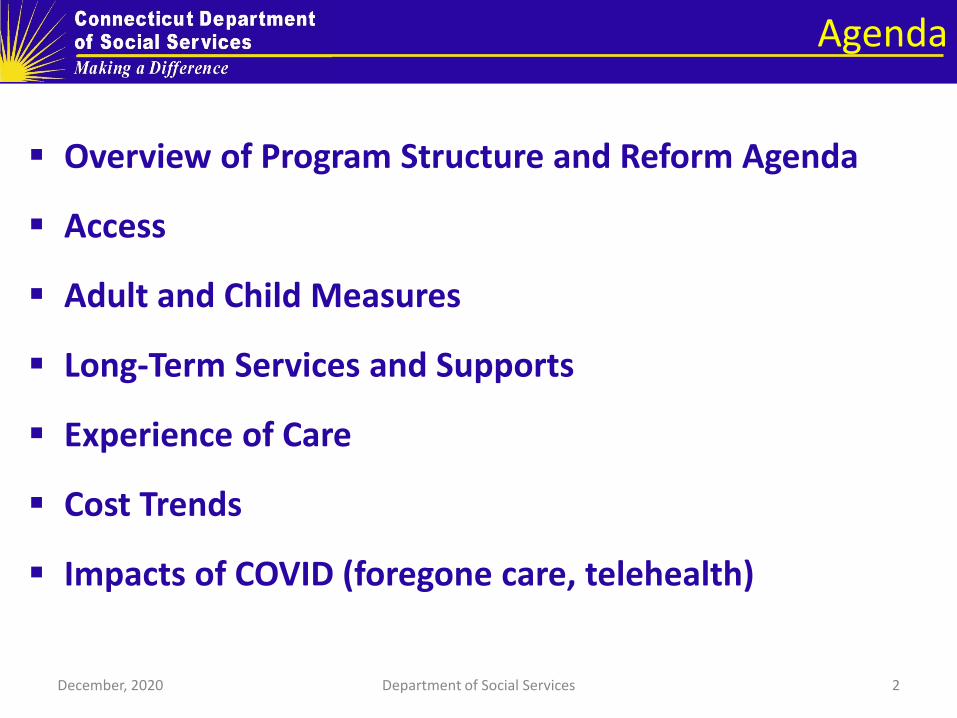
Agenda
Overview of Program Structure and Reform Agenda
Access
Adult and Child Measures
Long-Term Services and Supports
Experience of Care
Cost Trends
Impacts of COVID (foregone care, telehealth)
December, 2020 Department of Social Services 2
Overview of Program Structure and Reform Agenda
3 December, 2020 3 Department of Social Services
Connecticut HUSKY Health (Medicaid and CHIP) serves 995,000 individuals (over 25% of the state population)
Connecticut is a Medicaid expansion state, and optimized use of many other aspects of the Affordable Care Act (preventive services, health homes, Community First Choice, Balancing Incentive Program, State Innovation Model Test Grant)
By contrast to many other Medicaid programs, Connecticut uses a self-insured, managed fee-for-service approach
Connecticut has also implemented complementary initiatives, including justice reform and efforts to eliminate homelessness
December, 2020 Department of Social Services 4
A Snapshot of the Program

December, 2020 Department of Social Services 5
Details on Eligibility Groups
Coverage Group Provides comprehensive
medical, dental, and
behavioral health services
to . . .
Representing . . .
HUSKY A – Medicaid
Adults with incomes of up to 160% of the Federal
Poverty Level (FPL)
Pregnant women with incomes of up to 258% FPL
Children with incomes of up to 201% FPL
Over 509,097 parents and
children
57.2% of members and 29% of
total Medicaid program costs
HUSKY B – Children’s Health Insurance Program
Band 1: Children and caretaker adults with incomes
of up to 254% FPL
Band 2: Children and caretaker adults with incomes
of up to 323% FPL
19,312 children and caregivers 100% of members and total CHIP
costs
HUSKY C – Medicaid
Older adults, individuals with disabilities, and
refugees with incomes up to approximately 52% of
FPL; home and community-based services
programs have higher income limits
Over 84,000 older adults and
people with disabilities
9.5% of members and 46% of
total Medicaid program costs
HUSKY D – Medicaid
Eligible adults age 19-64 with incomes up to 138%
of FPL
Over 295,000 expansion adults 33.3% of members and 25% of
total Medicaid program costs

Our Aims
A stronger and healthier next generation that avoids preventable conditions and is economically secure, stably
housed, food secure, and engaged with community.
Families that are intact, resilient, capable, and nurturing.
Choice, self-direction and integration of all individuals served by Medicaid in their chosen communities.
Empowered, local, multi-disciplinary health neighborhoods.
December, 2020
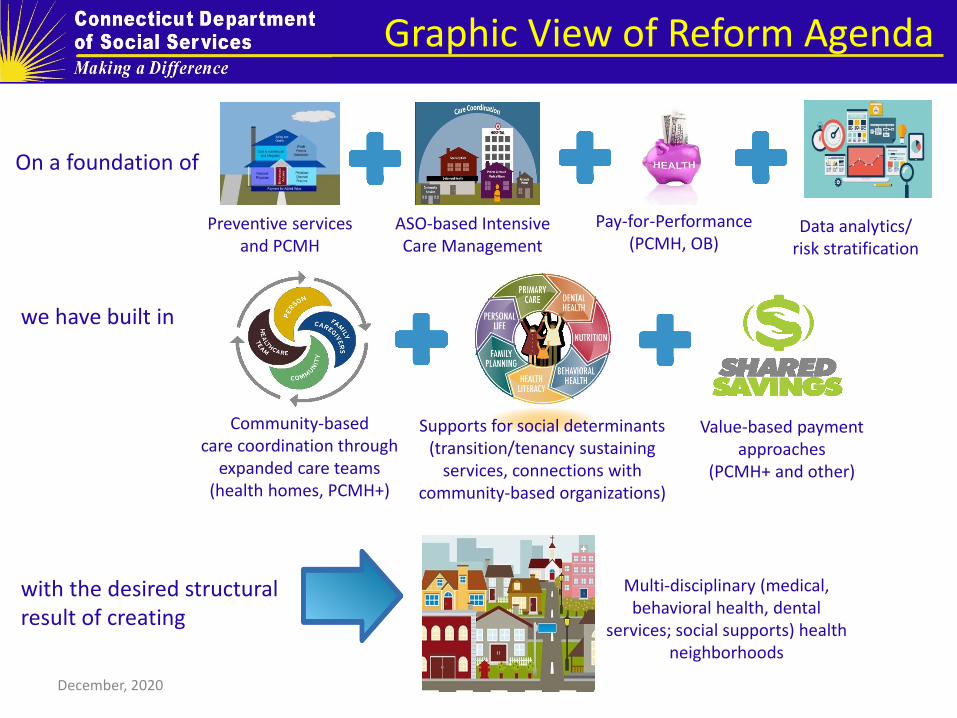
On a foundation of
Preventive services and PCMH
ASO-based Intensive Care Management
Pay-for-Performance (PCMH, OB)
we have built in
with the desired structural result of creating
Multi-disciplinary (medical, behavioral health, dental
services; social supports) health neighborhoods
Supports for social determinants (transition/tenancy sustaining
services, connections with community-based organizations)
Value-based payment approaches
(PCMH+ and other)
Community-based care coordination through
expanded care teams (health homes, PCMH+)
Data analytics/ risk stratification
Graphic View of Reform Agenda
December, 2020
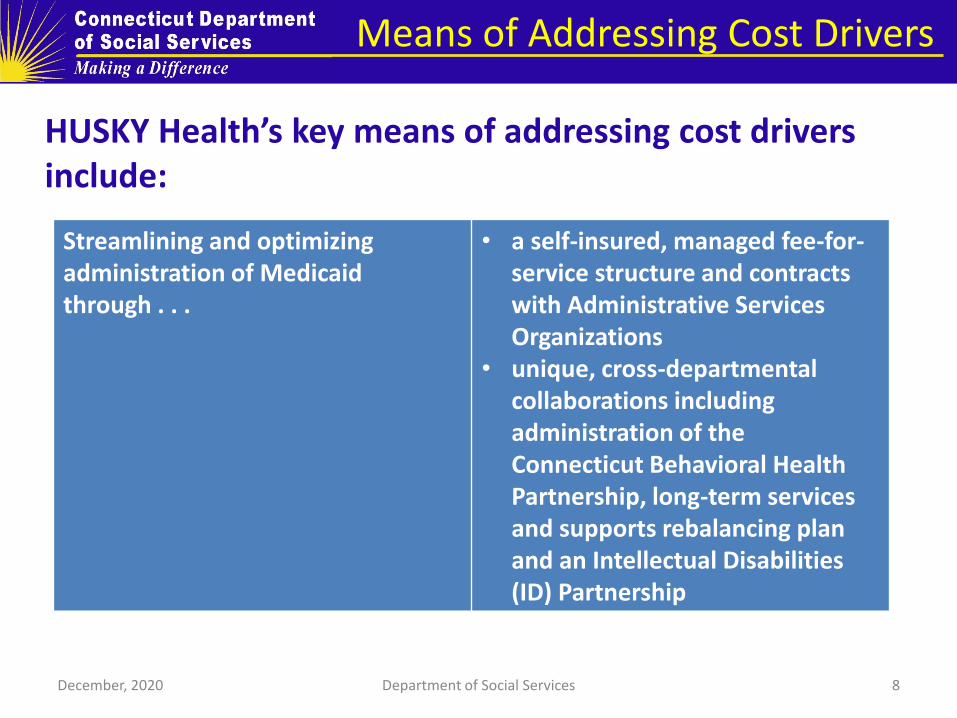
HUSKY Health’s key means of addressing cost drivers include:
December, 2020 Department of Social Services 8
Streamlining and optimizing administration of Medicaid through . . .
• a self-insured, managed fee-for-service structure and contracts with Administrative Services Organizations
• unique, cross-departmental collaborations including administration of the Connecticut Behavioral Health Partnership, long-term services and supports rebalancing plan and an Intellectual Disabilities (ID) Partnership
Means of Addressing Cost Drivers

December, 2020 Department of Social Services 9
Improving access to primary, preventative care through . . .
• extensive new investments in primary care (PCMH payments, primary care rate bump, EHR payments)
• comprehensive coverage of preventative behavioral health and dental benefits
Coordinating and integrating care through . . .
• ASO-based Intensive Care Management (ICM)
• PCMH practice transformation • behavioral health homes • Money Follows the Person “housing
+ supports” approach and coverage of supportive housing services under the Medicaid State Plan
• PCMH+ shared savings initiative
December, 2020 Department of Social Services 10
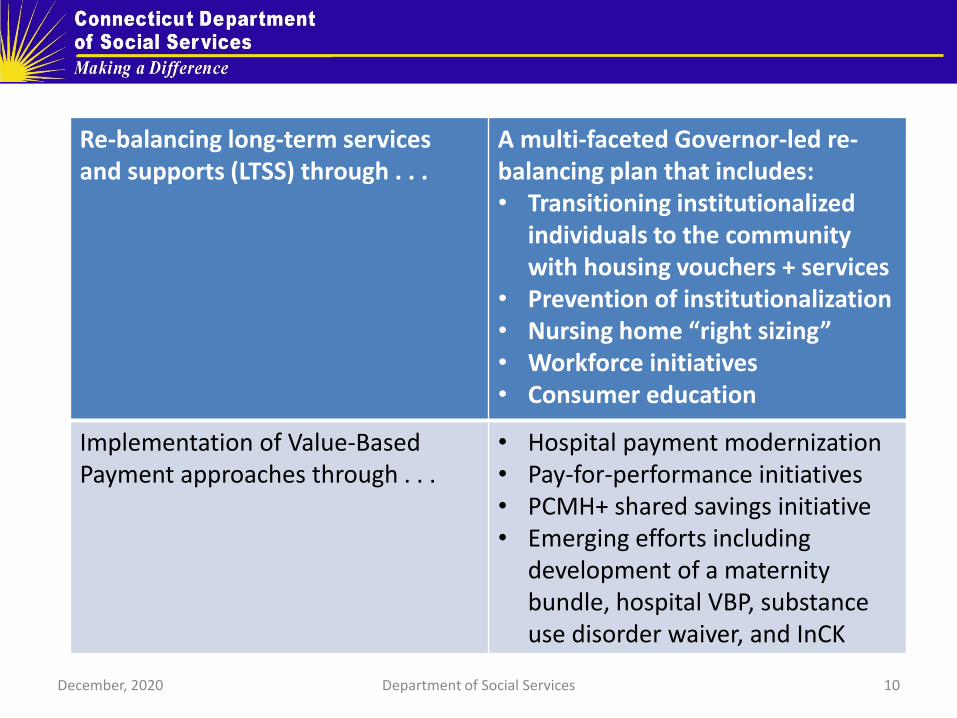
Re-balancing long-term services and supports (LTSS) through . . .
A multi-faceted Governor-led re-balancing plan that includes: • Transitioning institutionalized
individuals to the community with housing vouchers + services
• Prevention of institutionalization • Nursing home “right sizing” • Workforce initiatives • Consumer education
Implementation of Value-Based Payment approaches through . . .
• Hospital payment modernization • Pay-for-performance initiatives • PCMH+ shared savings initiative • Emerging efforts including
development of a maternity bundle, hospital VBP, substance use disorder waiver, and InCK

HUSKY Health is improving outcomes while controlling costs.
Health outcomes and care experience are improving through use of data to identify and support those in greatest need, care delivery
reforms and use of community-based services.
Provider participation has increased as a result of targeted investments in prevention, practice transformation, and timely
payment for services provided.
Enrollment is up, but per member per month costs have been reduced. Connecticut has maximized use of federal funds. The state
share of HUSKY Health costs is stable.
December, 2020 Department of Social Services 11

Summary of Quality Improvement Plan
12 December, 2020 12 Department of Social Services

HUSKY Health analyzes its performance through the following means:
Use of a fully integrated, statewide set of Medicaid claims data to report on a broad array of HEDIS and CMS Core Set measures (Connecticut voluntarily reported on 18 of 21 measures in the CMS Medicaid/CHIP Child Core set and on 15 of 16 measures in the CMS Adult Core set)
Extensive use of CAHPS and mystery shopper surveys
Geo-access analyses of provider participation
Financial trend analyses December, 2020 Department of Social Services 13
Access
14 December, 2020 14 Department of Social Services

Federal Rule
On November 2, 2015, CMS published a final rule entitled, Medicaid Program; Methods for Ensuring Access to Covered Medicaid Services.*
CMS indicated that this rule, “provides for a transparent data-driven process for states to document whether Medicaid payments are sufficient to enlist providers to assure beneficiary access to covered care and services consistent with section 1902(a)(30)(A) of the Social Security Act (the Act)”
* https://www.gpo.gov/fdsys/pkg/FR-2015-11-02/pdf/2015-27697.pdf
December, 2020 Department of Social Services 15
Access Plan
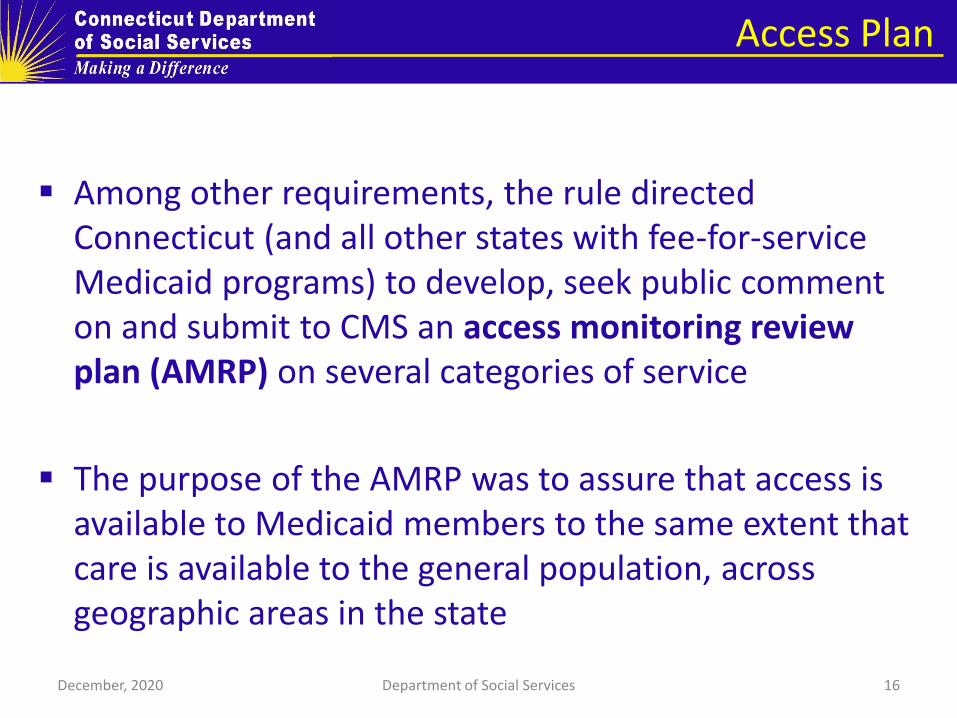
Among other requirements, the rule directed Connecticut (and all other states with fee-for-service Medicaid programs) to develop, seek public comment on and submit to CMS an access monitoring review plan (AMRP) on several categories of service
The purpose of the AMRP was to assure that access is available to Medicaid members to the same extent that care is available to the general population, across geographic areas in the state
December, 2020 Department of Social Services 16
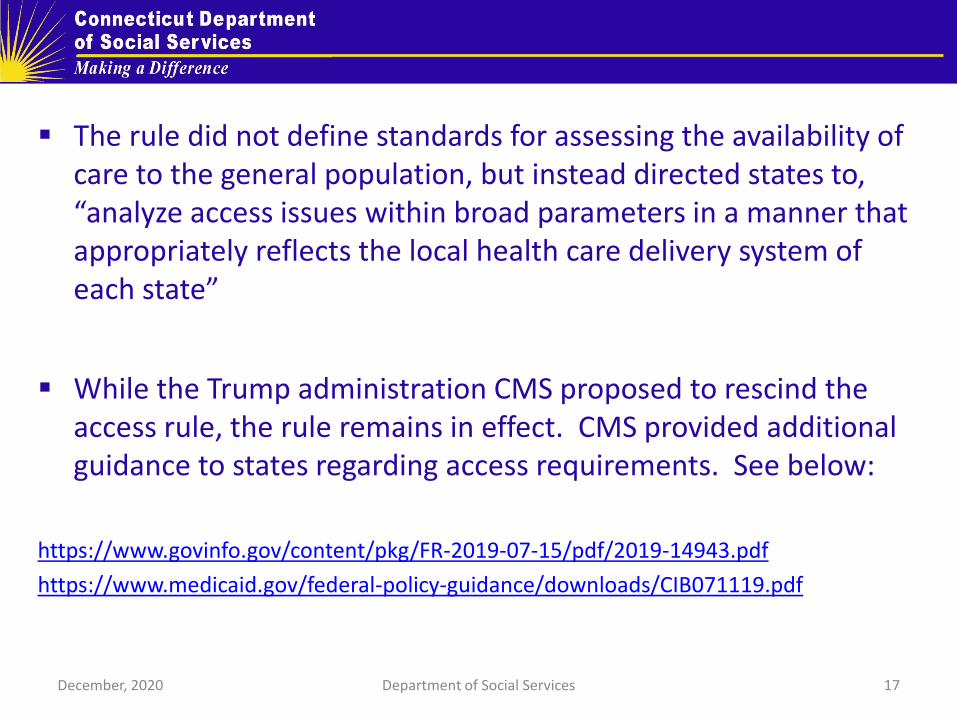
The rule did not define standards for assessing the availability of care to the general population, but instead directed states to, “analyze access issues within broad parameters in a manner that appropriately reflects the local health care delivery system of each state”
While the Trump administration CMS proposed to rescind the access rule, the rule remains in effect. CMS provided additional guidance to states regarding access requirements. See below:
https://www.govinfo.gov/content/pkg/FR-2019-07-15/pdf/2019-14943.pdf
https://www.medicaid.gov/federal-policy-guidance/downloads/CIB071119.pdf
December, 2020 Department of Social Services 17
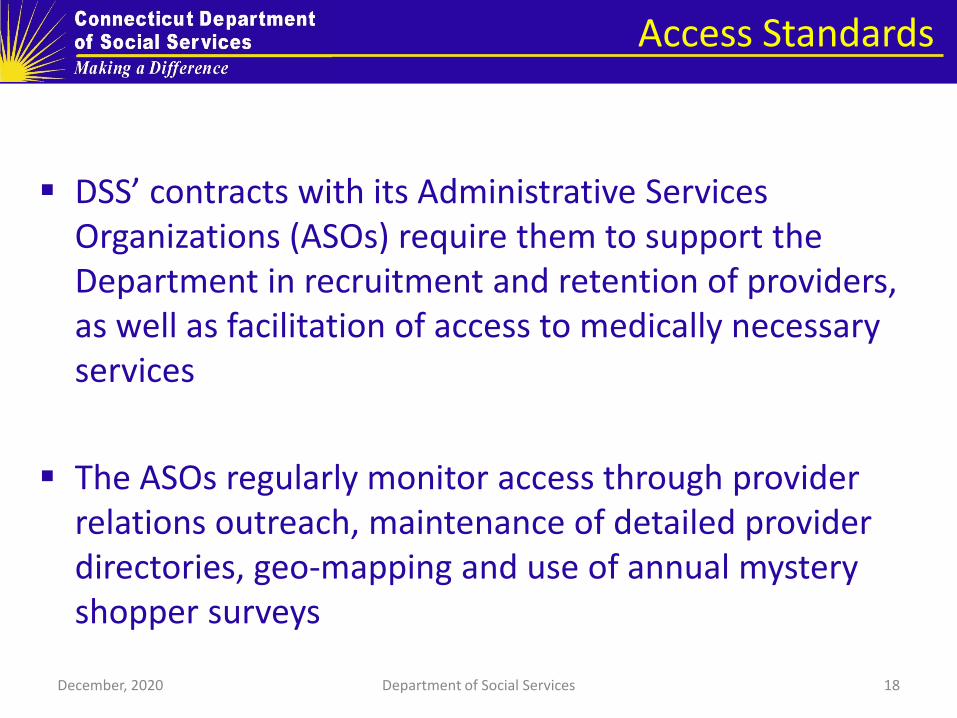
Access Standards
DSS’ contracts with its Administrative Services Organizations (ASOs) require them to support the Department in recruitment and retention of providers, as well as facilitation of access to medically necessary services
The ASOs regularly monitor access through provider relations outreach, maintenance of detailed provider directories, geo-mapping and use of annual mystery shopper surveys
December, 2020 Department of Social Services 18
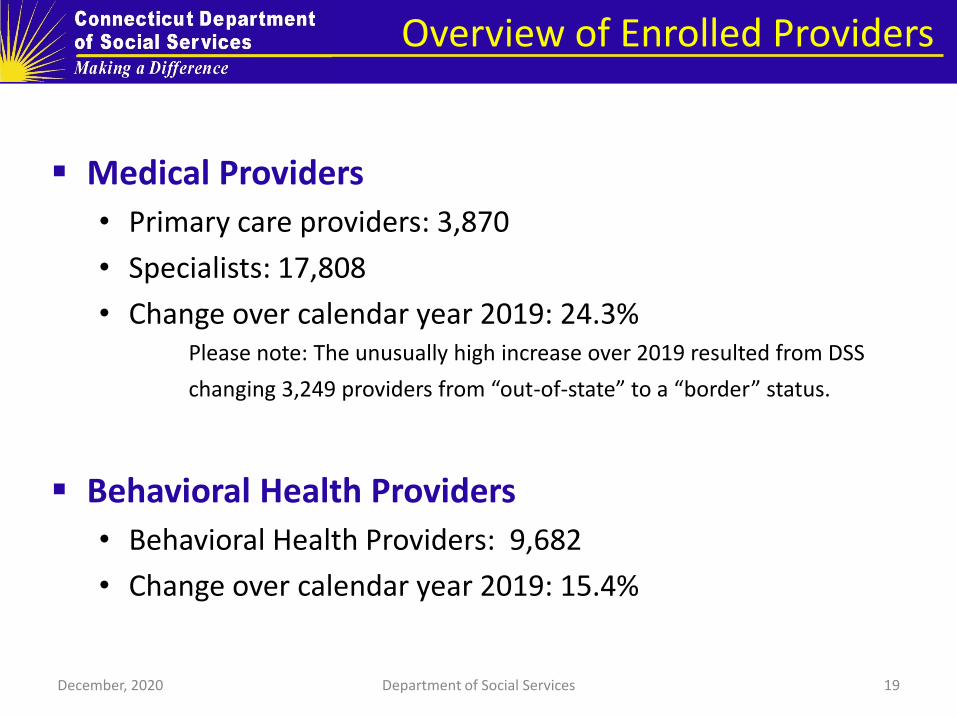
Overview of Enrolled Providers
Medical Providers
• Primary care providers: 3,870
• Specialists: 17,808
• Change over calendar year 2019: 24.3% Please note: The unusually high increase over 2019 resulted from DSS
changing 3,249 providers from “out-of-state” to a “border” status.
Behavioral Health Providers
• Behavioral Health Providers: 9,682
• Change over calendar year 2019: 15.4%
December, 2020 Department of Social Services 19
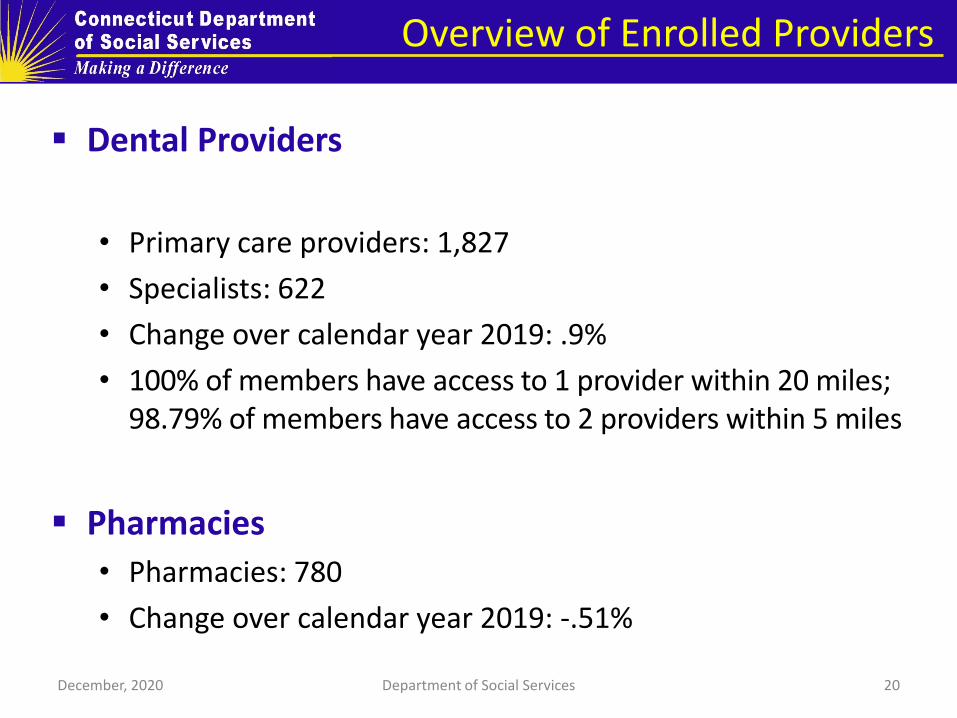
Overview of Enrolled Providers
Dental Providers
• Primary care providers: 1,827
• Specialists: 622
• Change over calendar year 2019: .9%
• 100% of members have access to 1 provider within 20 miles; 98.79% of members have access to 2 providers within 5 miles
Pharmacies
• Pharmacies: 780
• Change over calendar year 2019: -.51%
December, 2020 Department of Social Services 20

Adult and Child Measures
21 December, 2020 21 Department of Social Services
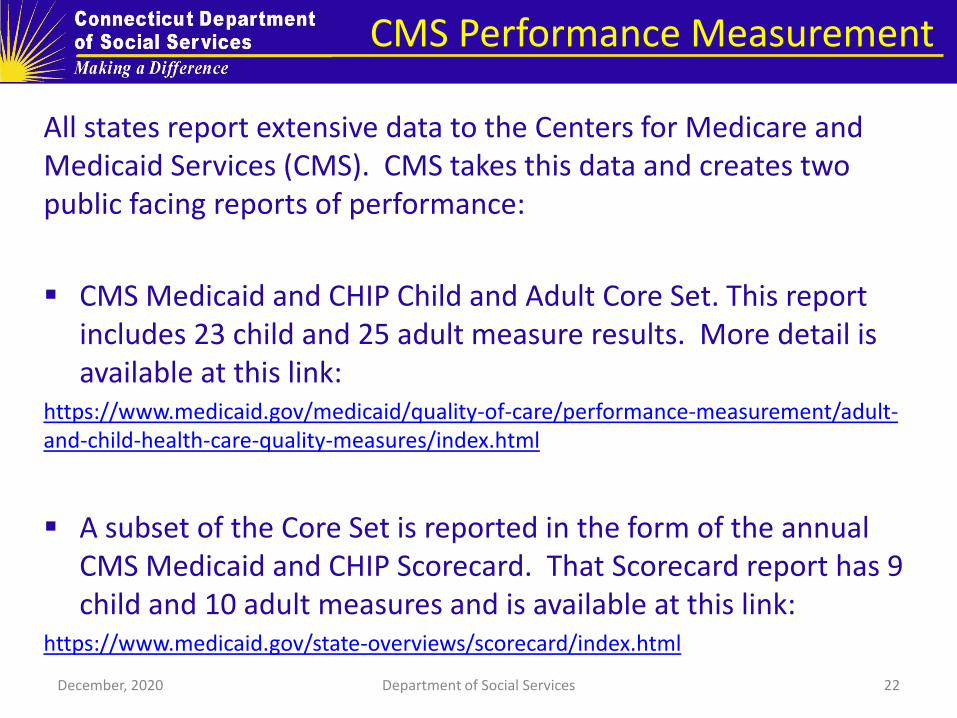
All states report extensive data to the Centers for Medicare and Medicaid Services (CMS). CMS takes this data and creates two public facing reports of performance:
CMS Medicaid and CHIP Child and Adult Core Set. This report includes 23 child and 25 adult measure results. More detail is available at this link:
https://www.medicaid.gov/medicaid/quality-of-care/performance-measurement/adult-and-child-health-care-quality-measures/index.html
A subset of the Core Set is reported in the form of the annual CMS Medicaid and CHIP Scorecard. That Scorecard report has 9 child and 10 adult measures and is available at this link:
https://www.medicaid.gov/state-overviews/scorecard/index.html
December, 2020 Department of Social Services 22
CMS Performance Measurement
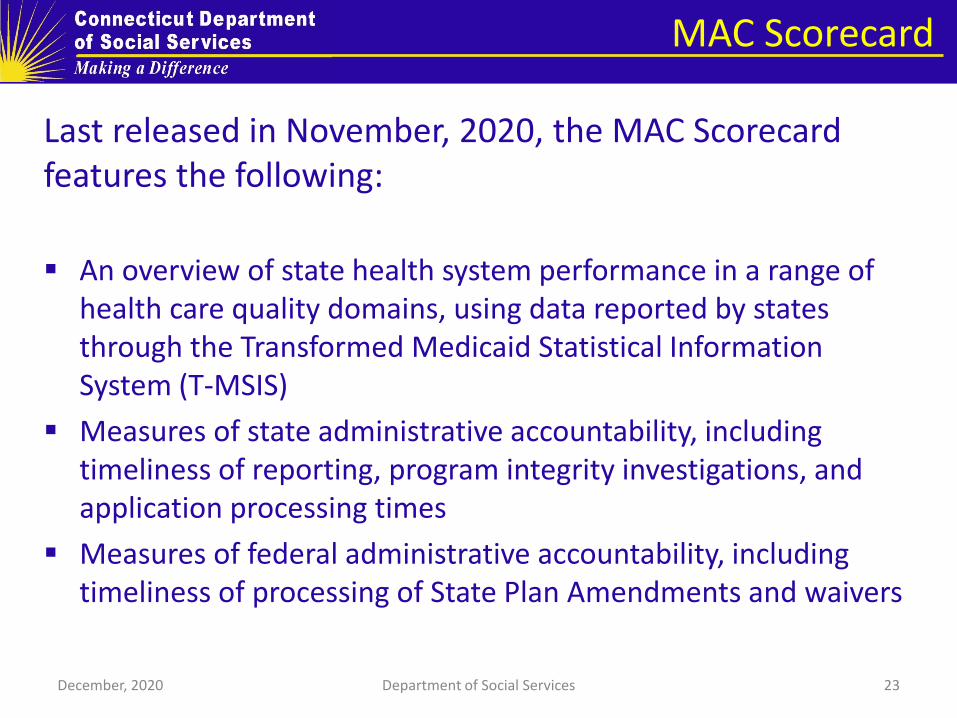
Last released in November, 2020, the MAC Scorecard features the following:
An overview of state health system performance in a range of health care quality domains, using data reported by states through the Transformed Medicaid Statistical Information System (T-MSIS)
Measures of state administrative accountability, including timeliness of reporting, program integrity investigations, and application processing times
Measures of federal administrative accountability, including timeliness of processing of State Plan Amendments and waivers
December, 2020 Department of Social Services 23
MAC Scorecard

All states report extensive data to the Centers for Medicare and Medicaid Services (CMS). CMS takes this data and creates two public facing reports of performance:
CMS Medicaid and CHIP Child and Adult Core Set. This report includes 23 child and 25 adult measure results. More detail is available at this link:
https://www.medicaid.gov/medicaid/quality-of-care/performance-measurement/adult-and-child-health-care-quality-measures/index.html
A subset of the Core Set is reported in the form of the annual CMS Medicaid and CHIP Scorecard. That Scorecard report has 9 child and 10 adult measures and is available at this link:
https://www.medicaid.gov/state-overviews/scorecard/index.html
December, 2020 Department of Social Services 24
CMS Performance Measurement
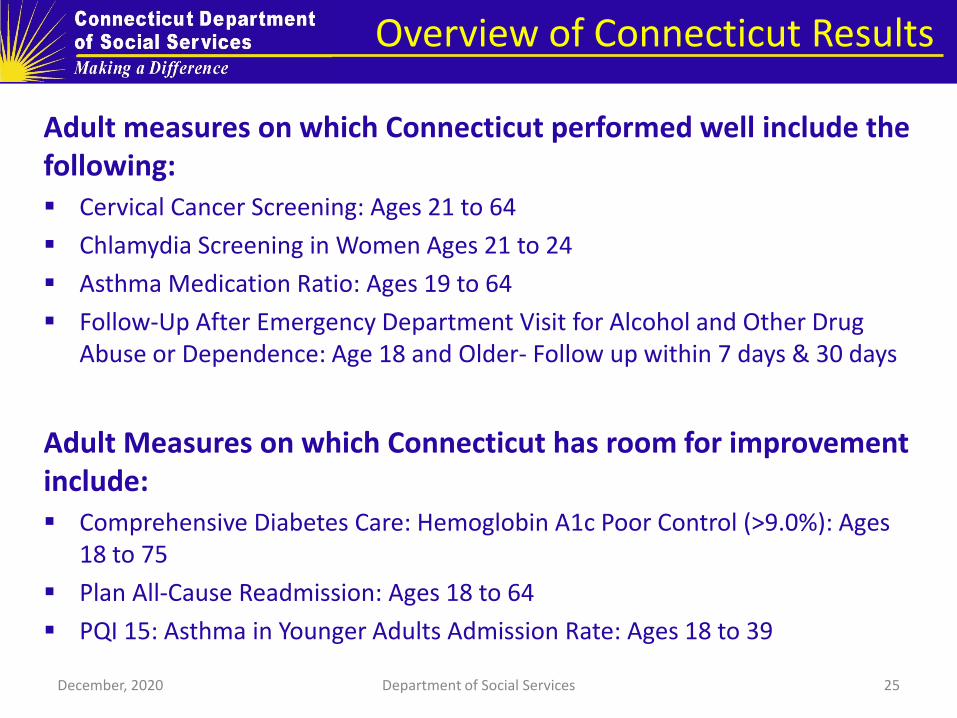
Adult measures on which Connecticut performed well include the following: Cervical Cancer Screening: Ages 21 to 64
Chlamydia Screening in Women Ages 21 to 24
Asthma Medication Ratio: Ages 19 to 64
Follow-Up After Emergency Department Visit for Alcohol and Other Drug Abuse or Dependence: Age 18 and Older- Follow up within 7 days & 30 days
Adult Measures on which Connecticut has room for improvement include: Comprehensive Diabetes Care: Hemoglobin A1c Poor Control (>9.0%): Ages
18 to 75
Plan All-Cause Readmission: Ages 18 to 64
PQI 15: Asthma in Younger Adults Admission Rate: Ages 18 to 39
December, 2020 Department of Social Services 25
Overview of Connecticut Results
December, 2020 Department of Social Services 26
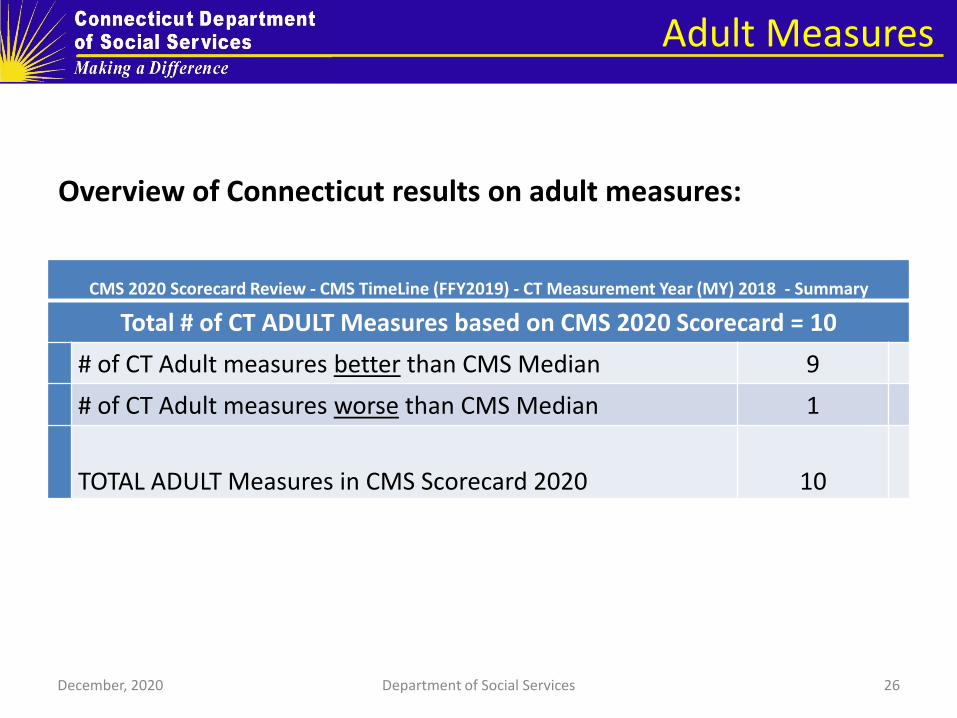
CMS 2020 Scorecard Review - CMS TimeLine (FFY2019) - CT Measurement Year (MY) 2018 - Summary
Total # of CT ADULT Measures based on CMS 2020 Scorecard = 10
# of CT Adult measures better than CMS Median 9
# of CT Adult measures worse than CMS Median 1
TOTAL ADULT Measures in CMS Scorecard 2020 10
Overview of Connecticut results on adult measures:
Adult Measures
December, 2020 Department of Social Services 27
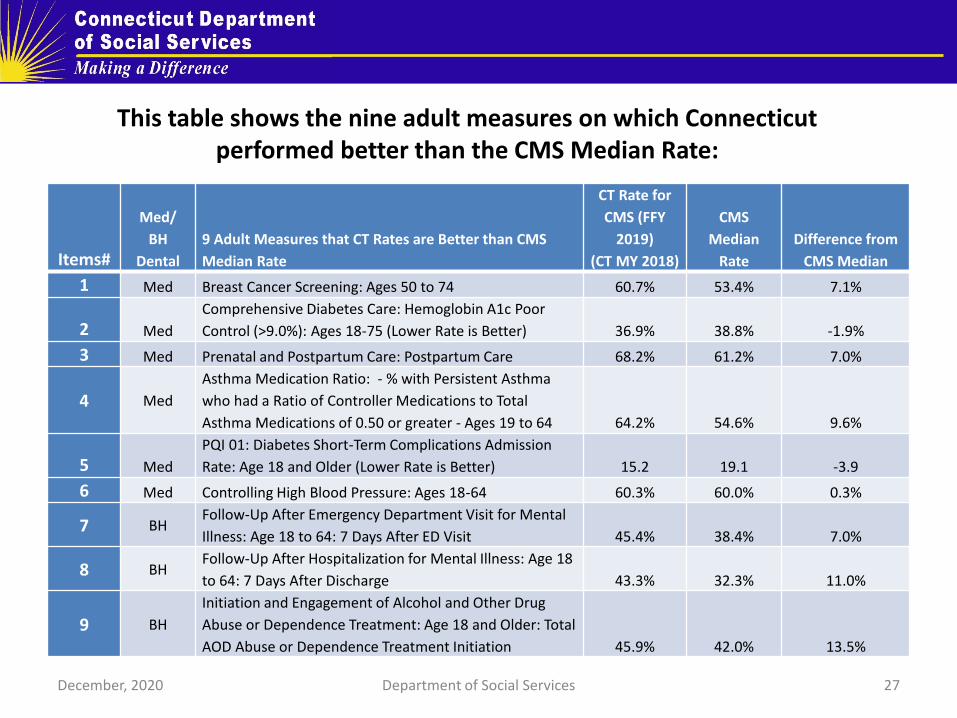
This table shows the nine adult measures on which Connecticut performed better than the CMS Median Rate:
Items#
Med/
BH
Dental
9 Adult Measures that CT Rates are Better than CMS
Median Rate
CT Rate for
CMS (FFY
2019)
(CT MY 2018)
CMS
Median
Rate
Difference from
CMS Median
1 Med Breast Cancer Screening: Ages 50 to 74 60.7% 53.4% 7.1%
2 Med
Comprehensive Diabetes Care: Hemoglobin A1c Poor
Control (>9.0%): Ages 18-75 (Lower Rate is Better) 36.9% 38.8% -1.9%
3 Med Prenatal and Postpartum Care: Postpartum Care 68.2% 61.2% 7.0%
4 Med
Asthma Medication Ratio: - % with Persistent Asthma
who had a Ratio of Controller Medications to Total
Asthma Medications of 0.50 or greater - Ages 19 to 64 64.2% 54.6% 9.6%
5 Med
PQI 01: Diabetes Short-Term Complications Admission
Rate: Age 18 and Older (Lower Rate is Better) 15.2 19.1 -3.9
6 Med Controlling High Blood Pressure: Ages 18-64 60.3% 60.0% 0.3%
7 BH Follow-Up After Emergency Department Visit for Mental
Illness: Age 18 to 64: 7 Days After ED Visit 45.4% 38.4% 7.0%
8 BH Follow-Up After Hospitalization for Mental Illness: Age 18
to 64: 7 Days After Discharge 43.3% 32.3% 11.0%
9 BH
Initiation and Engagement of Alcohol and Other Drug
Abuse or Dependence Treatment: Age 18 and Older: Total
AOD Abuse or Dependence Treatment Initiation 45.9% 42.0% 13.5%
December, 2020 Department of Social Services 28
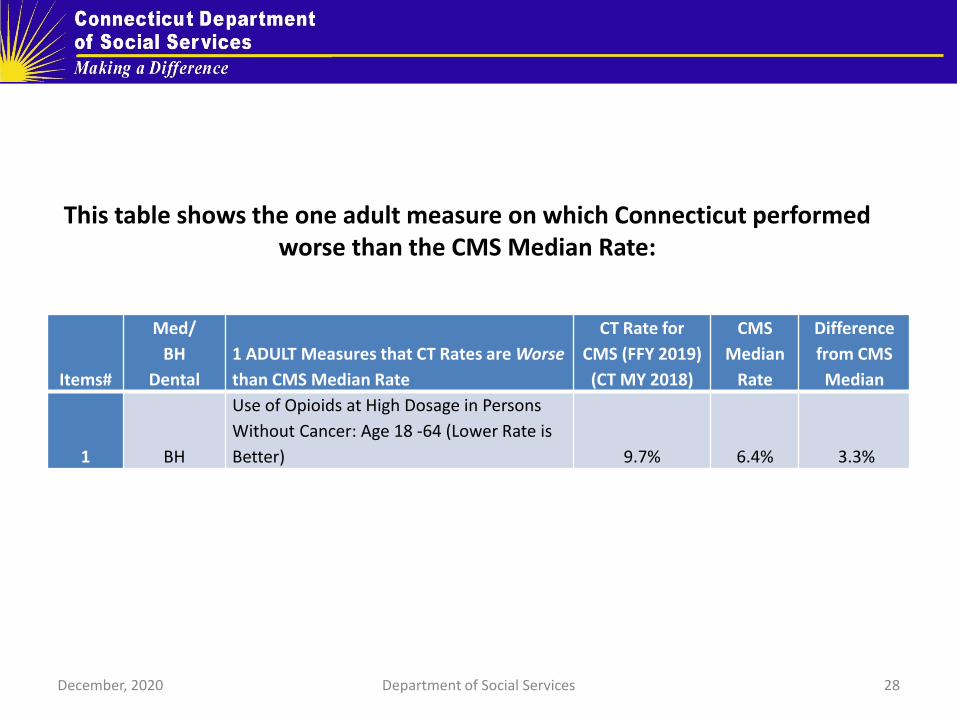
This table shows the one adult measure on which Connecticut performed worse than the CMS Median Rate:
Items#
Med/
BH
Dental
1 ADULT Measures that CT Rates are Worse
than CMS Median Rate
CT Rate for
CMS (FFY 2019)
(CT MY 2018)
CMS
Median
Rate
Difference
from CMS
Median
1 BH
Use of Opioids at High Dosage in Persons
Without Cancer: Age 18 -64 (Lower Rate is
Better) 9.7% 6.4% 3.3%

Child Measures on which Connecticut performed well: Adolescent Well-Care Visits: Ages 12 to 21
Well-Child Visits in the First 15 Months of Life
Childhood Immunization Status: Age 2 - % up to date on immunizations by 2nd birthday
Developmental Screening in the First Three Years of Life: Ages 0 to 3
Dental Sealants for 6-9 Year-Old Children at Elevated Caries Risk
Follow-Up after Hospitalization for mental illness Ages 6-17 - within 7 Days After Discharge
Use of First-Line Psychosocial Care for Children and Adolescents on Antipsychotics: Ages 1 to 17
Contraceptive Care: Postpartum Women Ages 15 to 20 - % provided with Most Effective or Moderately Effective Method of Contraception within 3 days of Delivery
Child Measures on which Connecticut has room for improvement: Ambulatory Care: Emergency Department (ED) Visits: Ages 0 to 19
Asthma Medication Ratio: Ages 5-18
Follow-Up Care for Children Prescribed Attention-Deficit/Hyperactivity Disorder (ADHD) Medication: Ages 6 to 12
December, 2020 Department of Social Services 29
Child Measures
December, 2020 Department of Social Services 30
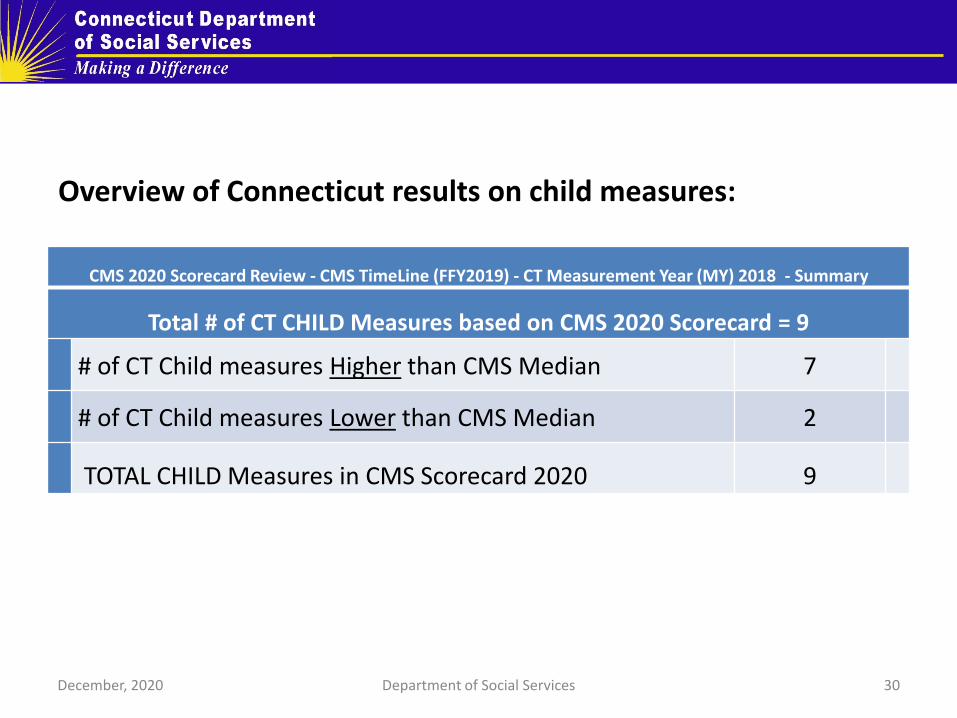
CMS 2020 Scorecard Review - CMS TimeLine (FFY2019) - CT Measurement Year (MY) 2018 - Summary
Total # of CT CHILD Measures based on CMS 2020 Scorecard = 9
# of CT Child measures Higher than CMS Median 7
# of CT Child measures Lower than CMS Median 2
TOTAL CHILD Measures in CMS Scorecard 2020 9
Overview of Connecticut results on child measures:
December, 2020 Department of Social Services 31
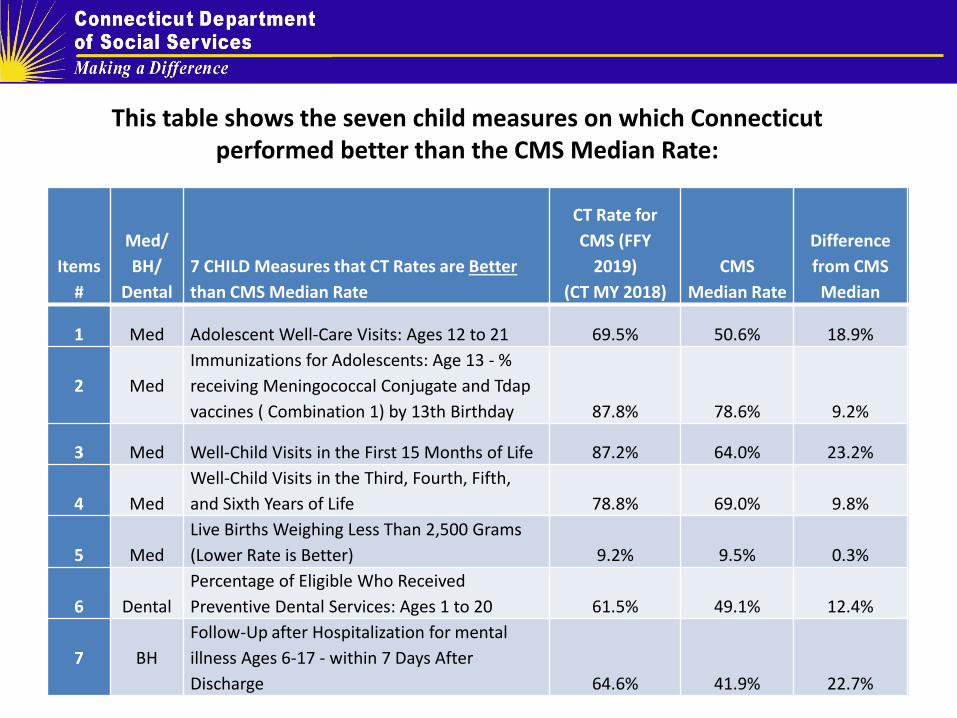
Items
#
Med/
BH/
Dental
7 CHILD Measures that CT Rates are Better
than CMS Median Rate
CT Rate for
CMS (FFY
2019)
(CT MY 2018)
CMS
Median Rate
Difference
from CMS
Median
1 Med Adolescent Well-Care Visits: Ages 12 to 21 69.5% 50.6% 18.9%
2 Med
Immunizations for Adolescents: Age 13 - %
receiving Meningococcal Conjugate and Tdap
vaccines ( Combination 1) by 13th Birthday 87.8% 78.6% 9.2%
3 Med Well-Child Visits in the First 15 Months of Life 87.2% 64.0% 23.2%
4 Med
Well-Child Visits in the Third, Fourth, Fifth,
and Sixth Years of Life 78.8% 69.0% 9.8%
5 Med
Live Births Weighing Less Than 2,500 Grams
(Lower Rate is Better) 9.2% 9.5% 0.3%
6 Dental
Percentage of Eligible Who Received
Preventive Dental Services: Ages 1 to 20 61.5% 49.1% 12.4%
7 BH
Follow-Up after Hospitalization for mental
illness Ages 6-17 - within 7 Days After
Discharge 64.6% 41.9% 22.7%
This table shows the seven child measures on which Connecticut performed better than the CMS Median Rate:
December, 2020 Department of Social Services 32
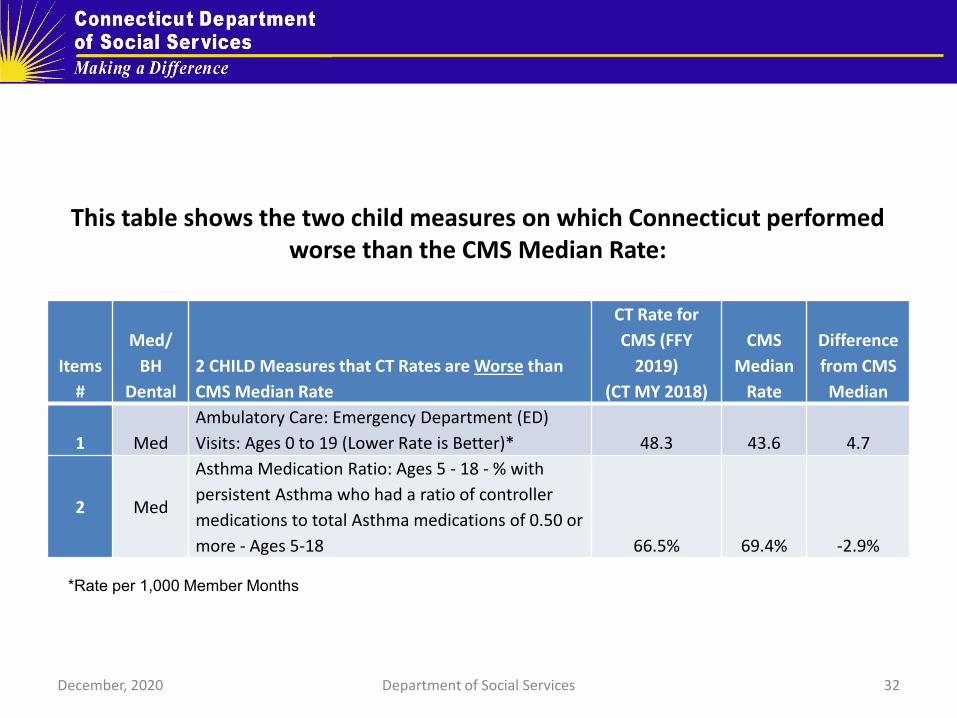
This table shows the two child measures on which Connecticut performed worse than the CMS Median Rate:
Items
#
Med/
BH
Dental
2 CHILD Measures that CT Rates are Worse than
CMS Median Rate
CT Rate for
CMS (FFY
2019)
(CT MY 2018)
CMS
Median
Rate
Difference
from CMS
Median
1 Med
Ambulatory Care: Emergency Department (ED)
Visits: Ages 0 to 19 (Lower Rate is Better)* 48.3 43.6 4.7
2 Med
Asthma Medication Ratio: Ages 5 - 18 - % with
persistent Asthma who had a ratio of controller
medications to total Asthma medications of 0.50 or
more - Ages 5-18 66.5% 69.4% -2.9%
*Rate per 1,000 Member Months
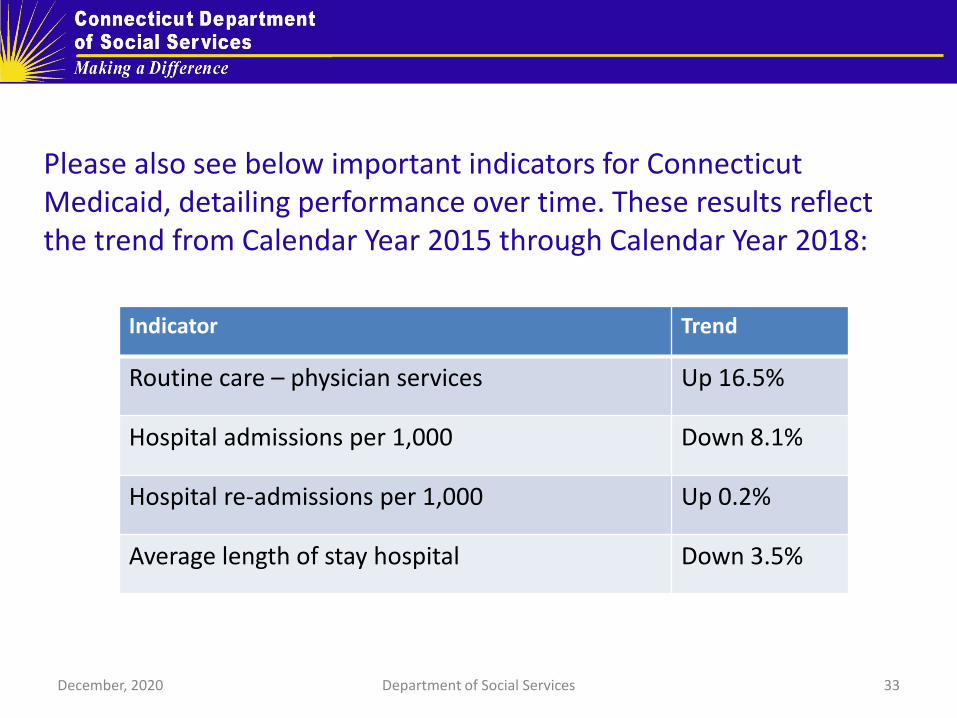
Please also see below important indicators for Connecticut Medicaid, detailing performance over time. These results reflect the trend from Calendar Year 2015 through Calendar Year 2018:
December, 2020 Department of Social Services 33
Indicator Trend
Routine care – physician services Up 16.5%
Hospital admissions per 1,000 Down 8.1%
Hospital re-admissions per 1,000 Up 0.2%
Average length of stay hospital Down 3.5%
Long-Term Services and Supports
34 December, 2020 34 Department of Social Services
Governor Lamont is deeply committed to ensuring that people served by Medicaid receive high quality long-term services and supports (LTSS) in the setting of their choice - be that in the community or in a nursing home. Under the Governor’s strategic “rebalancing” plan, Connecticut has implemented a range of tools and strategies designed to support these aims.
Rebalancing refers to reducing reliance on institutional care and expanding access to home and community-based services (HCBS). A rebalanced LTSS system gives Medicaid members greater choice in where they live and from whom they receive services. It also delivers LTSS that are integrated, effective, efficient, and person-centered.
December, 2020 Department of Social Services 35
Rebalancing
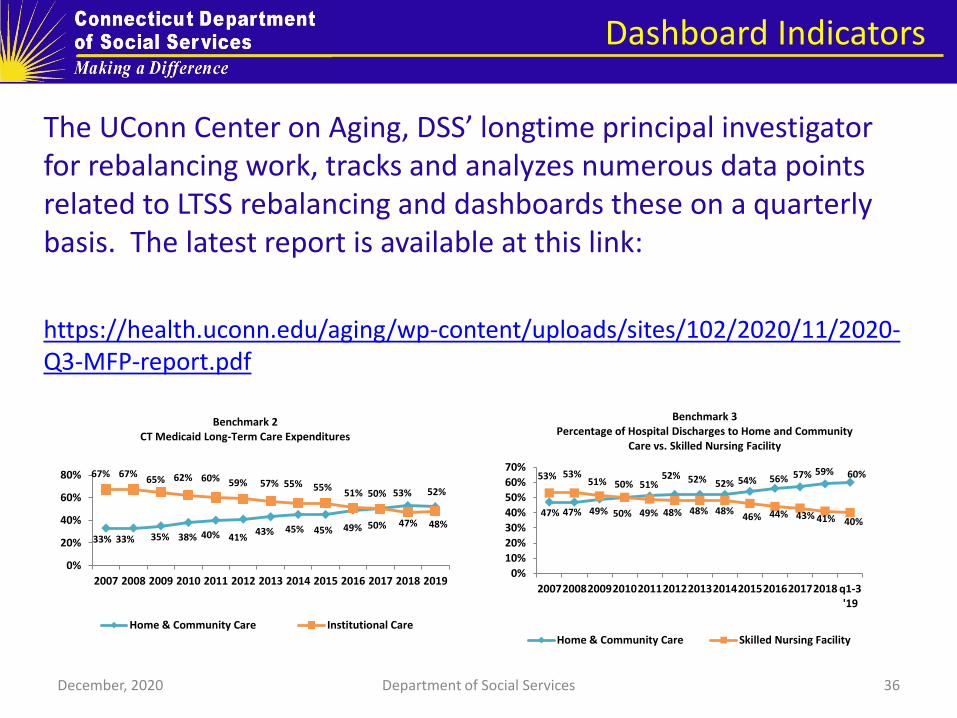
The UConn Center on Aging, DSS’ longtime principal investigator for rebalancing work, tracks and analyzes numerous data points related to LTSS rebalancing and dashboards these on a quarterly basis. The latest report is available at this link:
https://health.uconn.edu/aging/wp-content/uploads/sites/102/2020/11/2020-Q3-MFP-report.pdf
December, 2020 Department of Social Services 36
Dashboard Indicators
33% 33% 35% 38% 40% 41% 43% 45% 45% 49% 50%
53% 52%
67% 67% 65% 62% 60% 59% 57% 55% 55%
51% 50%
47% 48%
0%
20%
40%
60%
80%
2007 2008 2009 2010 2011 2012 2013 2014 2015 2016 2017 2018 2019
Benchmark 2 CT Medicaid Long-Term Care Expenditures
Home & Community Care Institutional Care
47% 47% 49% 50%
51% 52% 52% 52% 54% 56% 57% 59% 60% 53% 53%
51% 50%
49% 48% 48% 48% 46% 44% 43% 41% 40%
0%
10%
20%
30%
40%
50%
60%
70%
200720082009201020112012201320142015201620172018 q1-3'19
Benchmark 3 Percentage of Hospital Discharges to Home and Community
Care vs. Skilled Nursing Facility
Home & Community Care Skilled Nursing Facility

Equity
37 December, 2020 37 Department of Social Services
DSS acknowledges that there remain serious disparities of access and outcomes for people of color served by HUSKY Health
Non-exclusive examples include maternal health outcomes including mortality rates and various measures related to chronic conditions
Connecticut HUSKY Health routinely collects self-reported member race and ethnicity data as a part of the Medicaid and CHIP eligibility process
December, 2020 Department of Social Services 38
Equity
Because HUSKY Health is self-insured, DSS is able to maintain a fully integrated, statewide set of claims data that enables its Administrative Services Organizations (ASOs) to perform analyses of access, utilization and outcomes by race and ethnicity – this is a longstanding interest and a major area of current focus
An example of current work is that CHN is using Admissions, Discharge and Transfer (ADT) data received from the Connecticut Hospital Association to track incidence of COVID by features including race and ethnicity
December, 2020 Department of Social Services 39
December, 2020 Department of Social Services 40
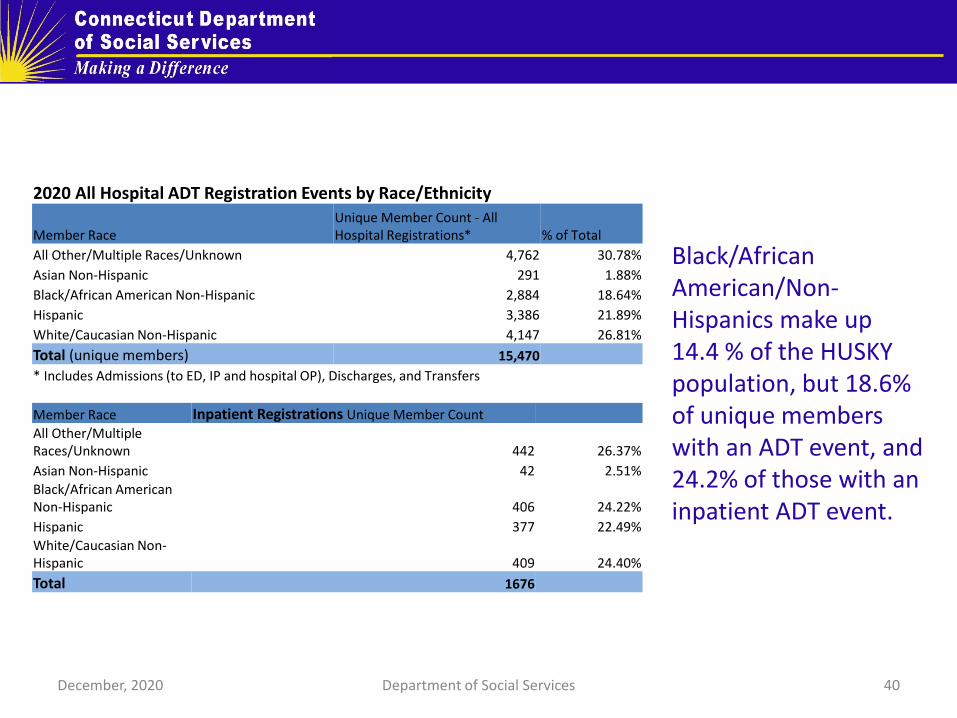
2020 All Hospital ADT Registration Events by Race/Ethnicity
Member Race Unique Member Count - All Hospital Registrations* % of Total
All Other/Multiple Races/Unknown 4,762 30.78%
Asian Non-Hispanic 291 1.88%
Black/African American Non-Hispanic 2,884 18.64%
Hispanic 3,386 21.89%
White/Caucasian Non-Hispanic 4,147 26.81%
Total (unique members) 15,470
* Includes Admissions (to ED, IP and hospital OP), Discharges, and Transfers
Member Race Inpatient Registrations Unique Member Count
All Other/Multiple Races/Unknown 442 26.37%
Asian Non-Hispanic 42 2.51%
Black/African American Non-Hispanic 406 24.22%
Hispanic 377 22.49%
White/Caucasian Non-Hispanic 409 24.40%
Total 1676
Black/African American/Non-Hispanics make up 14.4 % of the HUSKY population, but 18.6% of unique members with an ADT event, and 24.2% of those with an inpatient ADT event.

Experience of Care
41 December, 2020 41 Department of Social Services
Through its medical Administrative Services Organization, CHN, DSS contracts with GreatBlue Research to conduct Consumer Assessment of Healthcare Providers & Systems (CAHPS) surveys for PCMH+ practices and separately with SPH Analytics for the Medicaid population at large
During the latest PCMH+ CAHPS survey cycle (July 8, 2019 to October 21, 2019), the sample universe consisted of adults enrolled in the HUSKY Health Program and measured their satisfaction with their healthcare over the previous six months. GreatBlue completed 5,875 surveys.
GreatBlue utilized the adult version of the PCMH+ CAHPS survey, augmented by six additional behavioral health questions.
December, 2020 Department of Social Services 42
CAHPS

PCMH+ survey results, which are shown on the next slide, show the following: • 11 of 12 measures improved in 2019 compared to 2018
• 9 of 12 measures scored above 90%
• In 2019, the vast majority of adult HUSKY Health members reported their provider “showed respect for what they had to say” (96.8% over 96.1% in 2018) and “listened carefully to them” (95.4% over 94.8% in 2018)
• Areas of improvement include questions pertaining to specific health goals
It is exciting to note that in a 2018 cycle of CAHPS surveys that was conducted by the Yale School of Public Heath across payers under the auspices of the State Innovation Model grant, Medicaid recipients tended to report better care experiences than did commercially insured patients.
December, 2020 Department of Social Services 43
PCMH+ CAHPS
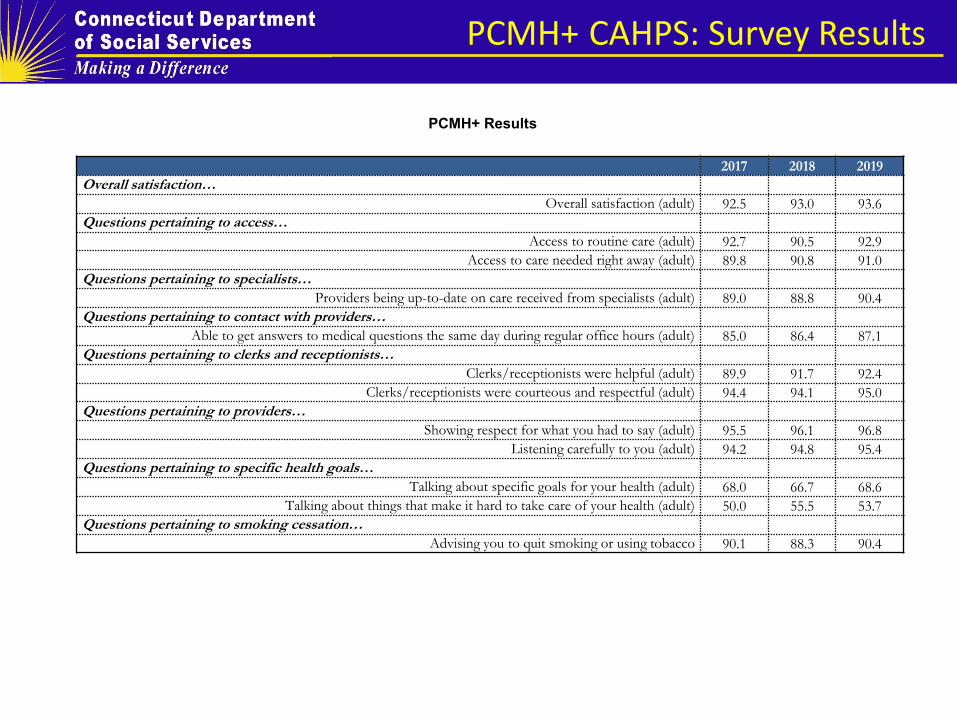
2017 2018 2019
Overall satisfaction…
Overall satisfaction (adult) 92.5 93.0 93.6
Questions pertaining to access…
Access to routine care (adult) 92.7 90.5 92.9
Access to care needed right away (adult) 89.8 90.8 91.0
Questions pertaining to specialists…
Providers being up-to-date on care received from specialists (adult) 89.0 88.8 90.4
Questions pertaining to contact with providers…
Able to get answers to medical questions the same day during regular office hours (adult) 85.0 86.4 87.1
Questions pertaining to clerks and receptionists…
Clerks/receptionists were helpful (adult) 89.9 91.7 92.4
Clerks/receptionists were courteous and respectful (adult) 94.4 94.1 95.0
Questions pertaining to providers…
Showing respect for what you had to say (adult) 95.5 96.1 96.8
Listening carefully to you (adult) 94.2 94.8 95.4
Questions pertaining to specific health goals…
Talking about specific goals for your health (adult) 68.0 66.7 68.6
Talking about things that make it hard to take care of your health (adult) 50.0 55.5 53.7
Questions pertaining to smoking cessation…
Advising you to quit smoking or using tobacco 90.1 88.3 90.4
PCMH+ Results
PCMH+ CAHPS: Survey Results
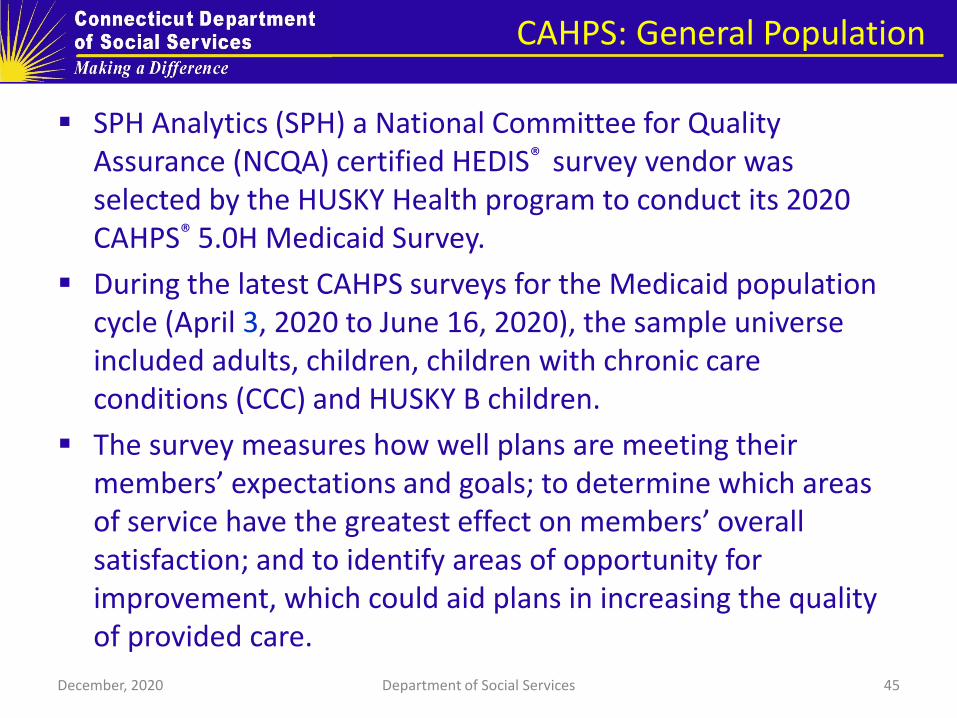
SPH Analytics (SPH) a National Committee for Quality Assurance (NCQA) certified HEDIS® survey vendor was selected by the HUSKY Health program to conduct its 2020 CAHPS® 5.0H Medicaid Survey.
During the latest CAHPS surveys for the Medicaid population cycle (April 3, 2020 to June 16, 2020), the sample universe included adults, children, children with chronic care conditions (CCC) and HUSKY B children.
The survey measures how well plans are meeting their members’ expectations and goals; to determine which areas of service have the greatest effect on members’ overall satisfaction; and to identify areas of opportunity for improvement, which could aid plans in increasing the quality of provided care.
December, 2020 Department of Social Services 45
CAHPS: General Population

CAHPS Survey: HUSKY A/C/D Adult
The following slides provide summary results and comparisons to Quality Compass for the HUSKY A/C/D adult survey (Quality Compass is a tool developed by NCQA that allows for comparative ratings of health plans nationally, ranking an individual plan’s performance compared to national averages by percentile).
All survey responses were above the 50th percentile compared to national adult Medicaid responses
Responses to four questions rated at or above the 75th percentile compared nationally:
• Getting Care Quickly (85.5% favorable responses, 75th percentile)
• How Well Doctors Communicate (93.6% favorable responses, 75th percentile)
• Customer Service (92.8% favorable responses, 90th percentile)
• Rating of Personal Doctor (85% favorable responses, 75th percentile)
Areas of greatest opportunity:
• Getting Needed Care (83.3%, 51st percentile)
• Rating of Health Care (76.3%, 59th percentile)
December, 2020 Department of Social Services 46
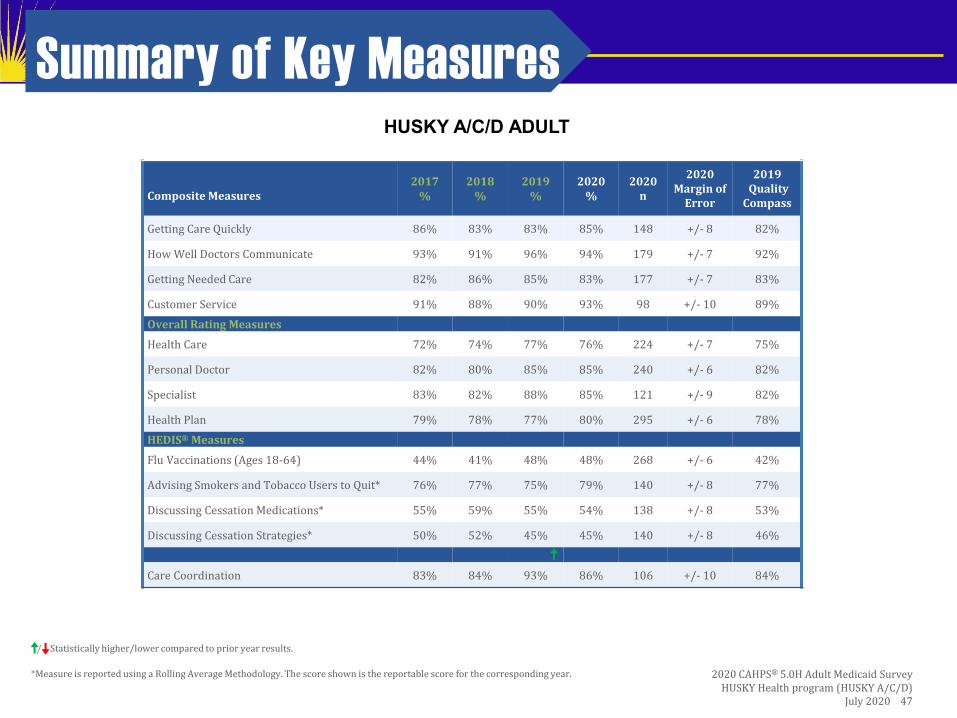
*Measure is reported using a Rolling Average Methodology. The score shown is the reportable score for the corresponding year.
Summary of Key Measures
Composite Measures
2017 %
2018 %
2019 %
2020 %
2020 n
2020 Margin of
Error
2019 Quality
Compass
Getting Care Quickly 86% 83% 83% 85% 148 +/- 8 82%
How Well Doctors Communicate 93% 91% 96% 94% 179 +/- 7 92%
Getting Needed Care 82% 86% 85% 83% 177 +/- 7 83%
Customer Service 91% 88% 90% 93% 98 +/- 10 89%
Overall Rating Measures
Health Care 72% 74% 77% 76% 224 +/- 7 75%
Personal Doctor 82% 80% 85% 85% 240 +/- 6 82%
Specialist 83% 82% 88% 85% 121 +/- 9 82%
Health Plan 79% 78% 77% 80% 295 +/- 6 78%
HEDIS® Measures
Flu Vaccinations (Ages 18-64) 44% 41% 48% 48% 268 +/- 6 42%
Advising Smokers and Tobacco Users to Quit* 76% 77% 75% 79% 140 +/- 8 77%
Discussing Cessation Medications* 55% 59% 55% 54% 138 +/- 8 53%
Discussing Cessation Strategies* 50% 52% 45% 45% 140 +/- 8 46%
Care Coordination 83% 84% 93% 86% 106 +/- 10 84%
2020 CAHPS® 5.0H Adult Medicaid Survey HUSKY Health program (HUSKY A/C/D)
July 2020 47
/ Statistically higher/lower compared to prior year results.
HUSKY A/C/D ADULT
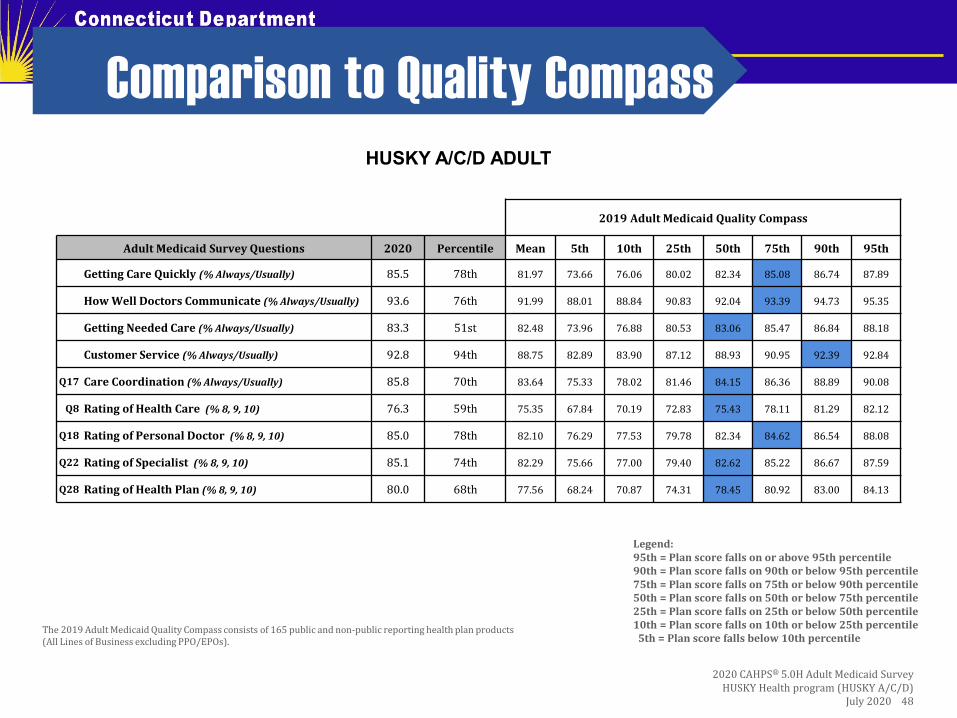
Comparison to Quality Compass
Legend: 95th = Plan score falls on or above 95th percentile 90th = Plan score falls on 90th or below 95th percentile 75th = Plan score falls on 75th or below 90th percentile 50th = Plan score falls on 50th or below 75th percentile 25th = Plan score falls on 25th or below 50th percentile 10th = Plan score falls on 10th or below 25th percentile 5th = Plan score falls below 10th percentile
The 2019 Adult Medicaid Quality Compass consists of 165 public and non-public reporting health plan products (All Lines of Business excluding PPO/EPOs).
2020 CAHPS® 5.0H Adult Medicaid Survey HUSKY Health program (HUSKY A/C/D)
July 2020 48
2019 Adult Medicaid Quality Compass
Adult Medicaid Survey Questions 2020 Percentile Mean 5th 10th 25th 50th 75th 90th 95th
Getting Care Quickly (% Always/Usually) 85.5 78th 81.97 73.66 76.06 80.02 82.34 85.08 86.74 87.89
How Well Doctors Communicate (% Always/Usually) 93.6 76th 91.99 88.01 88.84 90.83 92.04 93.39 94.73 95.35
Getting Needed Care (% Always/Usually) 83.3 51st 82.48 73.96 76.88 80.53 83.06 85.47 86.84 88.18
Customer Service (% Always/Usually) 92.8 94th 88.75 82.89 83.90 87.12 88.93 90.95 92.39 92.84
Q17 Care Coordination (% Always/Usually) 85.8 70th 83.64 75.33 78.02 81.46 84.15 86.36 88.89 90.08
Q8 Rating of Health Care (% 8, 9, 10) 76.3 59th 75.35 67.84 70.19 72.83 75.43 78.11 81.29 82.12
Q18 Rating of Personal Doctor (% 8, 9, 10) 85.0 78th 82.10 76.29 77.53 79.78 82.34 84.62 86.54 88.08
Q22 Rating of Specialist (% 8, 9, 10) 85.1 74th 82.29 75.66 77.00 79.40 82.62 85.22 86.67 87.59
Q28 Rating of Health Plan (% 8, 9, 10) 80.0 68th 77.56 68.24 70.87 74.31 78.45 80.92 83.00 84.13
HUSKY A/C/D ADULT
CAHPS Survey: HUSKY A/C Child- General Population
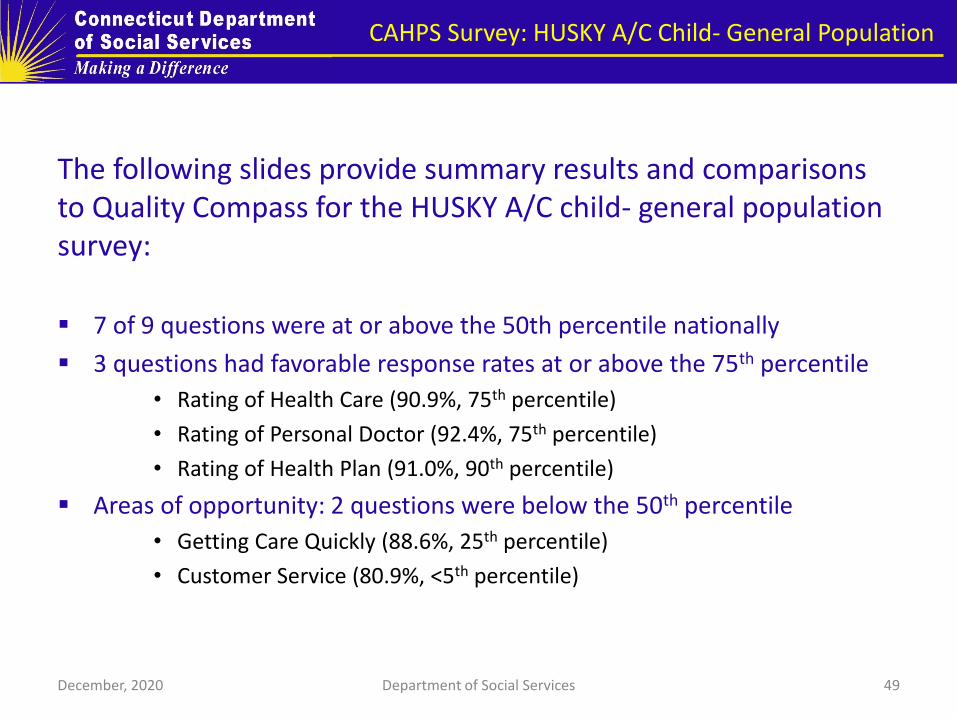
The following slides provide summary results and comparisons to Quality Compass for the HUSKY A/C child- general population survey:
7 of 9 questions were at or above the 50th percentile nationally
3 questions had favorable response rates at or above the 75th percentile
• Rating of Health Care (90.9%, 75th percentile)
• Rating of Personal Doctor (92.4%, 75th percentile)
• Rating of Health Plan (91.0%, 90th percentile)
Areas of opportunity: 2 questions were below the 50th percentile
• Getting Care Quickly (88.6%, 25th percentile)
• Customer Service (80.9%, <5th percentile)
December, 2020 Department of Social Services 49
2020 CAHPS® 5.0H Child Medicaid with CCC Survey HUSKY Health program (HUSKY A/C/D)
July 2020 50
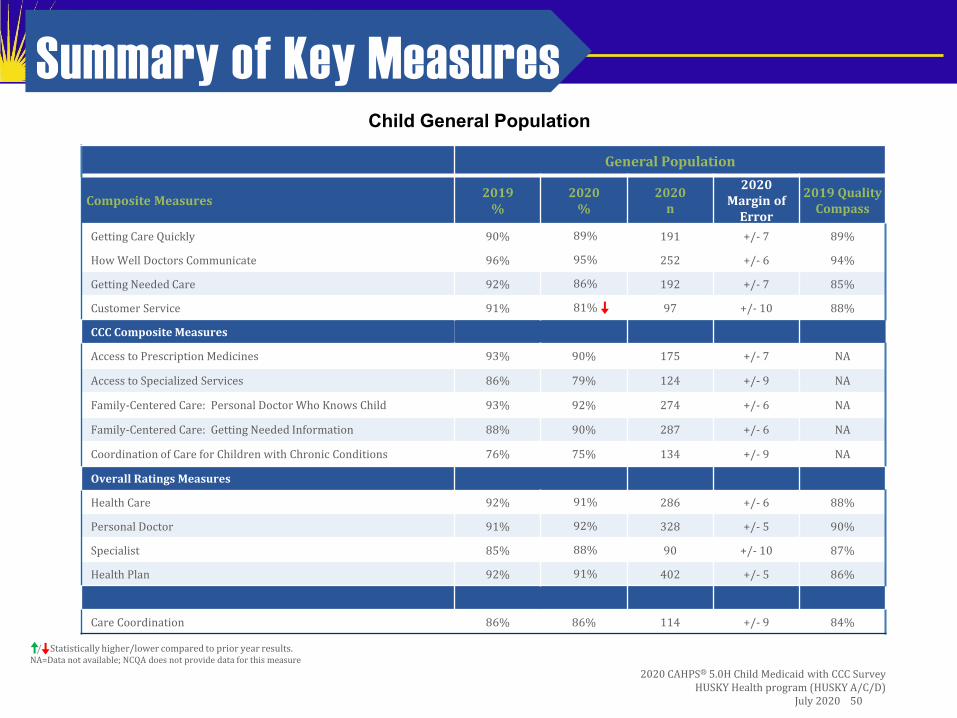
Summary of Key Measures
/ Statistically higher/lower compared to prior year results. NA=Data not available; NCQA does not provide data for this measure
General Population
Composite Measures 2019
% 2020
% 2020
n
2020 Margin of
Error
2019 Quality Compass
Getting Care Quickly 90% 89% 191 +/- 7 89%
How Well Doctors Communicate 96% 95% 252 +/- 6 94%
Getting Needed Care 92% 86% 192 +/- 7 85%
Customer Service 91% 81% 97 +/- 10 88%
CCC Composite Measures
Access to Prescription Medicines 93% 90% 175 +/- 7 NA
Access to Specialized Services 86% 79% 124 +/- 9 NA
Family-Centered Care: Personal Doctor Who Knows Child 93% 92% 274 +/- 6 NA
Family-Centered Care: Getting Needed Information 88% 90% 287 +/- 6 NA
Coordination of Care for Children with Chronic Conditions 76% 75% 134 +/- 9 NA
Overall Ratings Measures
Health Care 92% 91% 286 +/- 6 88%
Personal Doctor 91% 92% 328 +/- 5 90%
Specialist 85% 88% 90 +/- 10 87%
Health Plan 92% 91% 402 +/- 5 86%
Care Coordination 86% 86% 114 +/- 9 84%
Child General Population
2019 Child Medicaid Quality Compass General Population Results
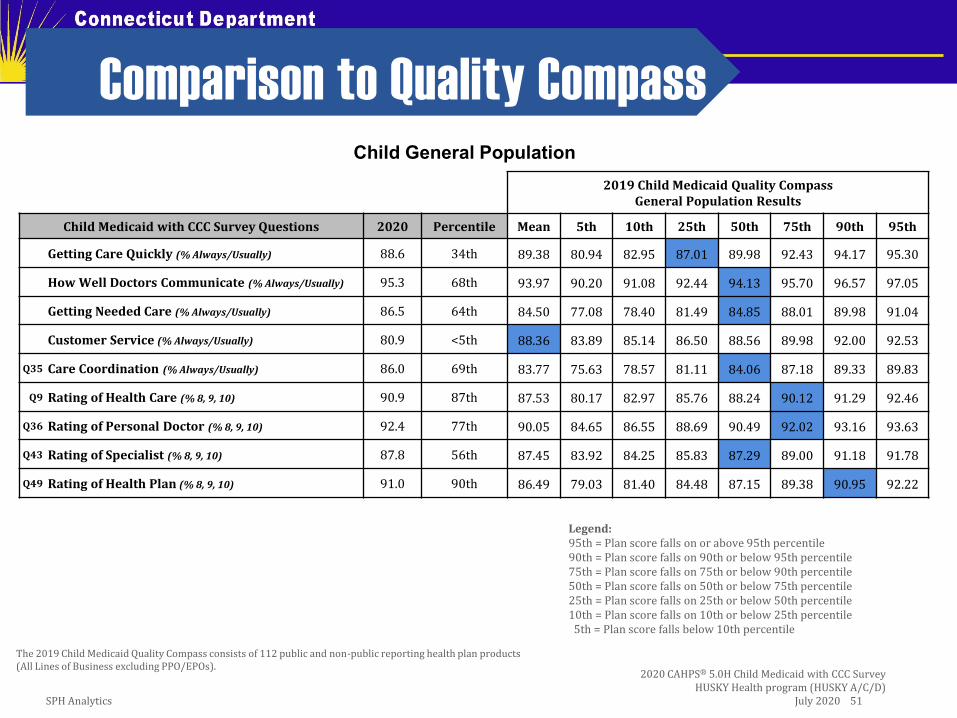
Child Medicaid with CCC Survey Questions 2020 Percentile Mean 5th 10th 25th 50th 75th 90th 95th
Getting Care Quickly (% Always/Usually) 88.6 34th 89.38 80.94 82.95 87.01 89.98 92.43 94.17 95.30
How Well Doctors Communicate (% Always/Usually) 95.3 68th 93.97 90.20 91.08 92.44 94.13 95.70 96.57 97.05
Getting Needed Care (% Always/Usually) 86.5 64th 84.50 77.08 78.40 81.49 84.85 88.01 89.98 91.04
Customer Service (% Always/Usually) 80.9 <5th 88.36 83.89 85.14 86.50 88.56 89.98 92.00 92.53
Q35 Care Coordination (% Always/Usually) 86.0 69th 83.77 75.63 78.57 81.11 84.06 87.18 89.33 89.83
Q9 Rating of Health Care (% 8, 9, 10) 90.9 87th 87.53 80.17 82.97 85.76 88.24 90.12 91.29 92.46
Q36 Rating of Personal Doctor (% 8, 9, 10) 92.4 77th 90.05 84.65 86.55 88.69 90.49 92.02 93.16 93.63
Q43 Rating of Specialist (% 8, 9, 10) 87.8 56th 87.45 83.92 84.25 85.83 87.29 89.00 91.18 91.78
Q49 Rating of Health Plan (% 8, 9, 10) 91.0 90th 86.49 79.03 81.40 84.48 87.15 89.38 90.95 92.22
Comparison to Quality Compass
Child General Population
Legend: 95th = Plan score falls on or above 95th percentile 90th = Plan score falls on 90th or below 95th percentile 75th = Plan score falls on 75th or below 90th percentile 50th = Plan score falls on 50th or below 75th percentile 25th = Plan score falls on 25th or below 50th percentile 10th = Plan score falls on 10th or below 25th percentile 5th = Plan score falls below 10th percentile
The 2019 Child Medicaid Quality Compass consists of 112 public and non-public reporting health plan products (All Lines of Business excluding PPO/EPOs).
2020 CAHPS® 5.0H Child Medicaid with CCC Survey HUSKY Health program (HUSKY A/C/D)
SPH Analytics July 2020 51
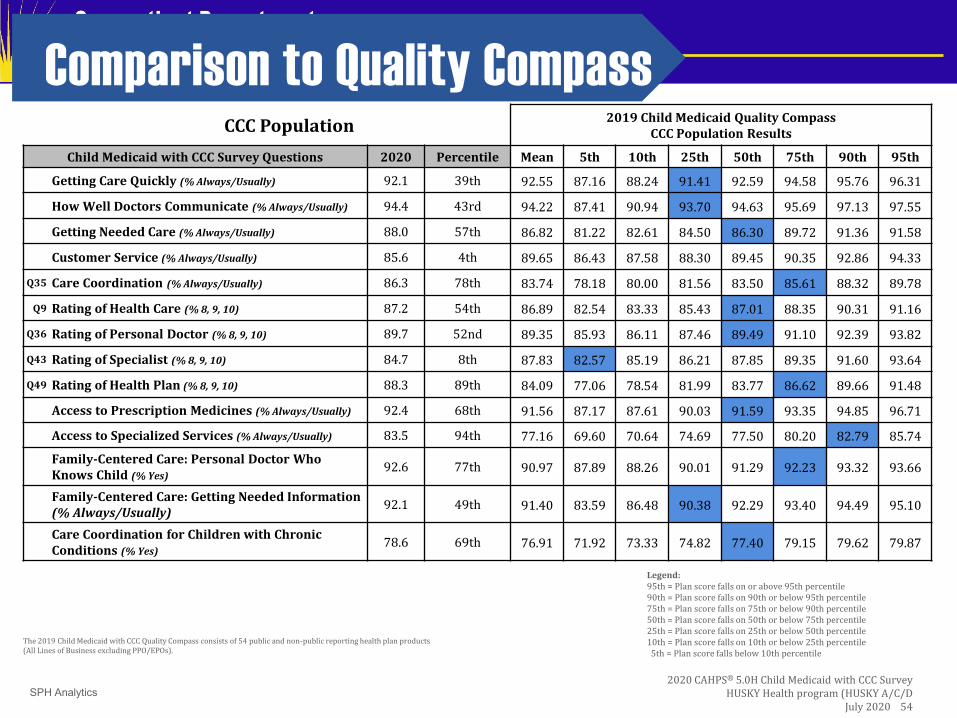
CAHPS: HUSKY A/C Child- Chronic Conditions
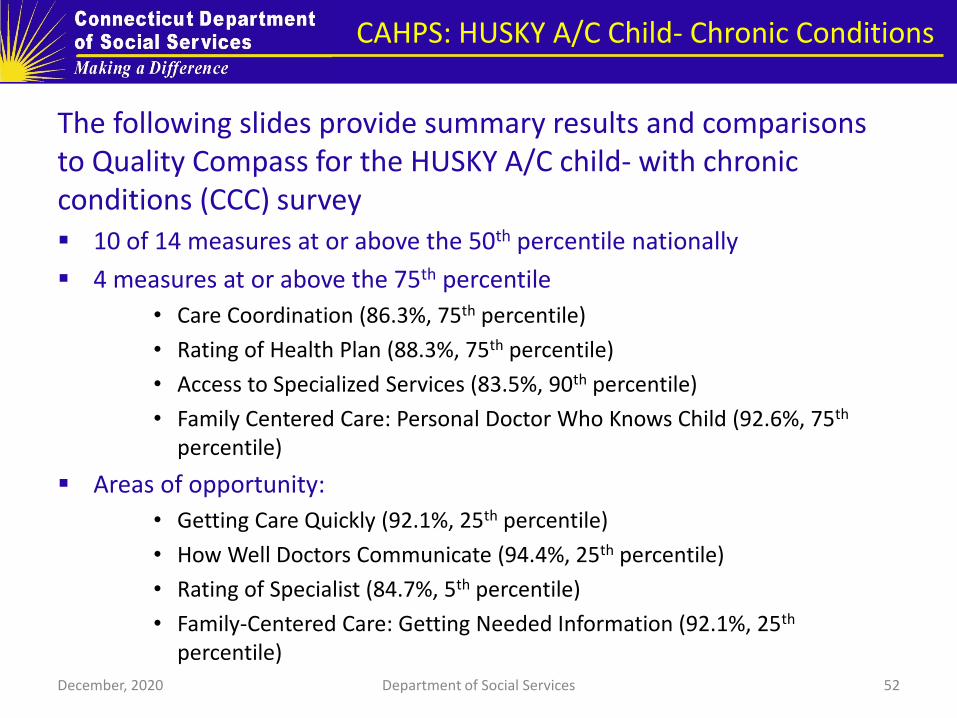
The following slides provide summary results and comparisons to Quality Compass for the HUSKY A/C child- with chronic conditions (CCC) survey 10 of 14 measures at or above the 50th percentile nationally
4 measures at or above the 75th percentile
• Care Coordination (86.3%, 75th percentile)
• Rating of Health Plan (88.3%, 75th percentile)
• Access to Specialized Services (83.5%, 90th percentile)
• Family Centered Care: Personal Doctor Who Knows Child (92.6%, 75th percentile)
Areas of opportunity:
• Getting Care Quickly (92.1%, 25th percentile)
• How Well Doctors Communicate (94.4%, 25th percentile)
• Rating of Specialist (84.7%, 5th percentile)
• Family-Centered Care: Getting Needed Information (92.1%, 25th percentile)
December, 2020 Department of Social Services 52
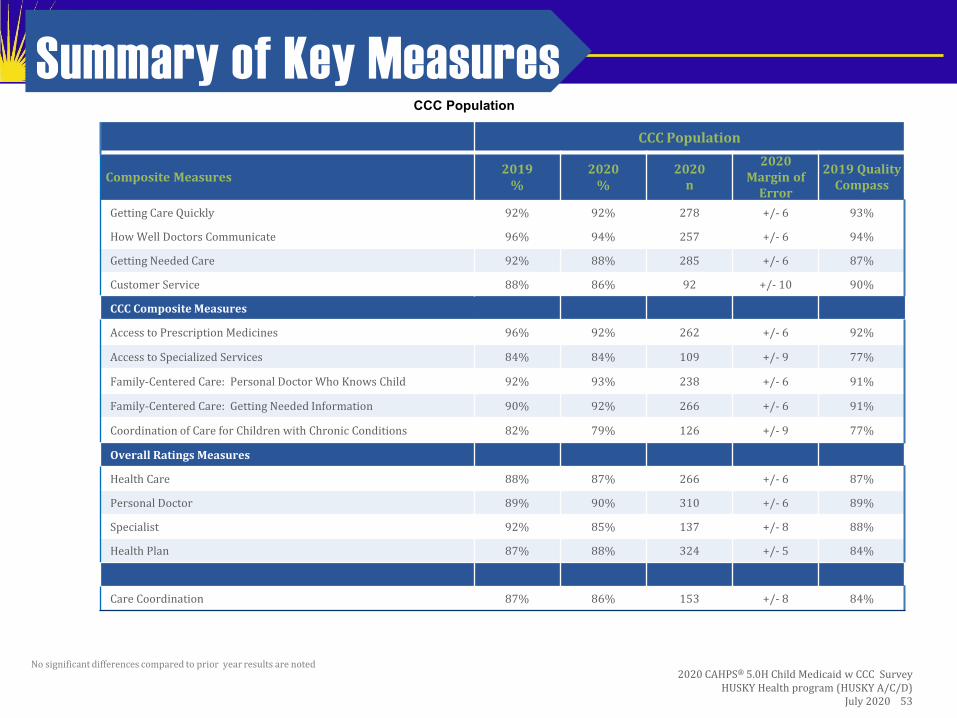
No significant differences compared to prior year results are noted
Summary of Key Measures
2020 CAHPS® 5.0H Child Medicaid w CCC Survey HUSKY Health program (HUSKY A/C/D)
July 2020 53
CCC Population
CCC Population
Composite Measures 2019
% 2020
% 2020
n
2020 Margin of
Error
2019 Quality Compass
Getting Care Quickly 92% 92% 278 +/- 6 93%
How Well Doctors Communicate 96% 94% 257 +/- 6 94%
Getting Needed Care 92% 88% 285 +/- 6 87%
Customer Service 88% 86% 92 +/- 10 90%
CCC Composite Measures
Access to Prescription Medicines 96% 92% 262 +/- 6 92%
Access to Specialized Services 84% 84% 109 +/- 9 77%
Family-Centered Care: Personal Doctor Who Knows Child 92% 93% 238 +/- 6 91%
Family-Centered Care: Getting Needed Information 90% 92% 266 +/- 6 91%
Coordination of Care for Children with Chronic Conditions 82% 79% 126 +/- 9 77%
Overall Ratings Measures
Health Care 88% 87% 266 +/- 6 87%
Personal Doctor 89% 90% 310 +/- 6 89%
Specialist 92% 85% 137 +/- 8 88%
Health Plan 87% 88% 324 +/- 5 84%
Care Coordination 87% 86% 153 +/- 8 84%
Summary of Key Measures Summary of Key Measures
CCC Population 2019 Child Medicaid Quality Compass
CCC Population Results
Child Medicaid with CCC Survey Questions 2020 Percentile Mean 5th 10th 25th 50th 75th 90th 95th
Getting Care Quickly (% Always/Usually) 92.1 39th 92.55 87.16 88.24 91.41 92.59 94.58 95.76 96.31
How Well Doctors Communicate (% Always/Usually) 94.4 43rd 94.22 87.41 90.94 93.70 94.63 95.69 97.13 97.55
Getting Needed Care (% Always/Usually) 88.0 57th 86.82 81.22 82.61 84.50 86.30 89.72 91.36 91.58
Customer Service (% Always/Usually) 85.6 4th 89.65 86.43 87.58 88.30 89.45 90.35 92.86 94.33
Q35 Care Coordination (% Always/Usually) 86.3 78th 83.74 78.18 80.00 81.56 83.50 85.61 88.32 89.78
Q9 Rating of Health Care (% 8, 9, 10) 87.2 54th 86.89 82.54 83.33 85.43 87.01 88.35 90.31 91.16
Q36 Rating of Personal Doctor (% 8, 9, 10) 89.7 52nd 89.35 85.93 86.11 87.46 89.49 91.10 92.39 93.82
Q43 Rating of Specialist (% 8, 9, 10) 84.7 8th 87.83 82.57 85.19 86.21 87.85 89.35 91.60 93.64
Q49 Rating of Health Plan (% 8, 9, 10) 88.3 89th 84.09 77.06 78.54 81.99 83.77 86.62 89.66 91.48
Access to Prescription Medicines (% Always/Usually) 92.4 68th 91.56 87.17 87.61 90.03 91.59 93.35 94.85 96.71
Access to Specialized Services (% Always/Usually) 83.5 94th 77.16 69.60 70.64 74.69 77.50 80.20 82.79 85.74
Family-Centered Care: Personal Doctor Who Knows Child (% Yes)
92.6 77th 90.97 87.89 88.26 90.01 91.29 92.23 93.32 93.66
Family-Centered Care: Getting Needed Information (% Always/Usually)
92.1 49th 91.40 83.59 86.48 90.38 92.29 93.40 94.49 95.10
Care Coordination for Children with Chronic Conditions (% Yes)
78.6 69th 76.91 71.92 73.33 74.82 77.40 79.15 79.62 79.87
Legend: 95th = Plan score falls on or above 95th percentile 90th = Plan score falls on 90th or below 95th percentile 75th = Plan score falls on 75th or below 90th percentile 50th = Plan score falls on 50th or below 75th percentile 25th = Plan score falls on 25th or below 50th percentile 10th = Plan score falls on 10th or below 25th percentile 5th = Plan score falls below 10th percentile
2020 CAHPS® 5.0H Child Medicaid with CCC Survey HUSKY Health program (HUSKY A/C/D
July 2020 54
The 2019 Child Medicaid with CCC Quality Compass consists of 54 public and non-public reporting health plan products (All Lines of Business excluding PPO/EPOs).
Comparison to Quality Compass
SPH Analytics

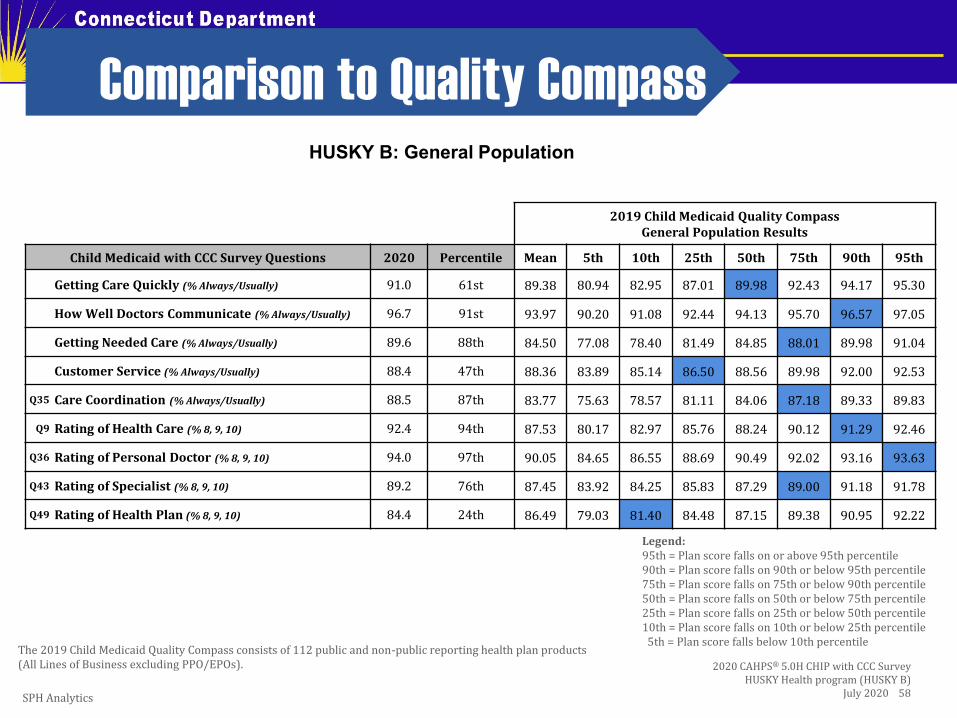
CAHPS: HUSKY B- General Population
The following slides provide summary results and comparisons to Quality Compass for the HUSKY B general population survey:
7 of 9 measures were at or above the 50th percentile
6 measures were at or above the 75th percentile
3 measures were at or above the 90th percentile
• How Well Doctors Communicated (96.7%, 90th percentile)
• Rating of Health Care (92.4%, 90th percentile)
• Rating of Personal Doctor (94.0%, 95th percentile)
Areas of opportunity: 2 measures were below the 50th percentile
• Customer Service (88.4%, 25th percentile)
• Rating of Health Plan (84.4%, 10th percentile)
December, 2020 Department of Social Services 55

NA=Data not available; NCQA does not provide data for this measure
Summary of Key Measures
2020 CAHPS® 5.0H CHIP w CCC Survey HUSKY Health program (HUSKY B)
July 2020 56
No significant differences to prior year are noted
HUSKY B: General Population
General Population
Composite Measures 2019
% 2020
% 2020
n
2020 Margin of
Error
2019 Quality Compass
Getting Care Quickly 93% 91% 231 +/- 6 89%
How Well Doctors Communicate 96% 97% 318 +/- 5 94%
Getting Needed Care 89% 90% 219 +/- 7 85%
Customer Service 88% 88% 121 +/- 9 88%
CCC Composite Measures
Access to Prescription Medicines 93% 90% 195 +/- 7 NA
Access to Specialized Services 80% 84% 42 +/- 15 NA
Family-Centered Care: Personal Doctor Who Knows Child 90% 92% 172 +/- 7 NA
Family-Centered Care: Getting Needed Information 91% 89% 341 +/- 5 NA
Coordination of Care for Children with Chronic Conditions 78% 73% 77 +/- 11 NA
Overall Ratings Measures
Health Care 92% 92% 343 +/- 5 88%
Personal Doctor 91% 94% 431 +/- 5 90%
Specialist 88% 89% 83 +/- 11 87%
Health Plan 87% 84% 493 +/- 4 86%
Care Coordination 86% 89% 113 +/- 9 84%
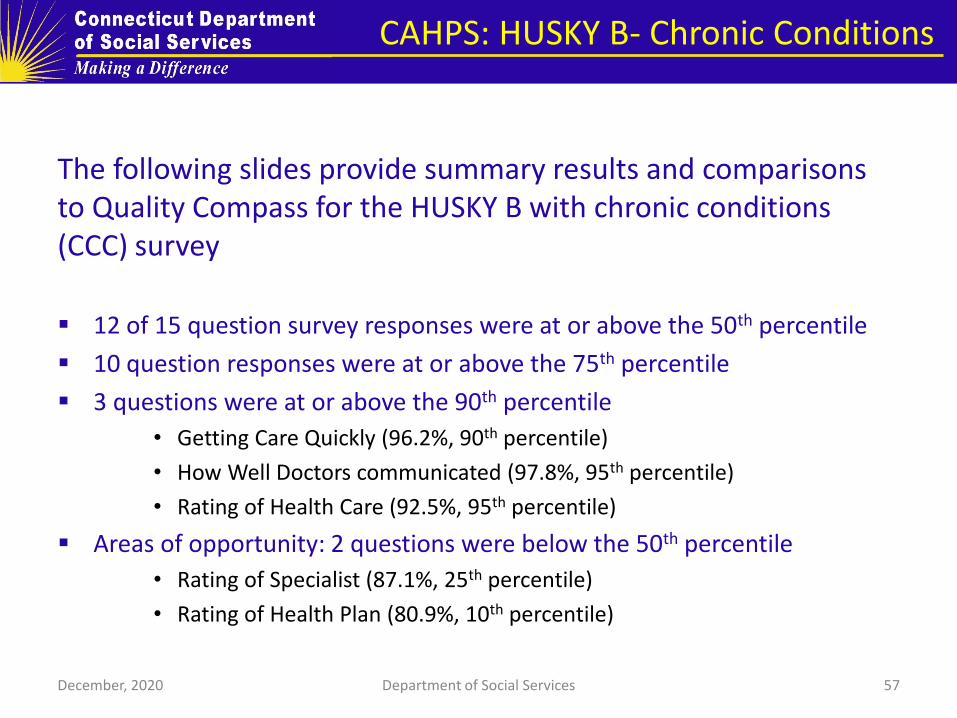
CAHPS: HUSKY B- Chronic Conditions
The following slides provide summary results and comparisons to Quality Compass for the HUSKY B with chronic conditions (CCC) survey
12 of 15 question survey responses were at or above the 50th percentile
10 question responses were at or above the 75th percentile
3 questions were at or above the 90th percentile
• Getting Care Quickly (96.2%, 90th percentile)
• How Well Doctors communicated (97.8%, 95th percentile)
• Rating of Health Care (92.5%, 95th percentile)
Areas of opportunity: 2 questions were below the 50th percentile
• Rating of Specialist (87.1%, 25th percentile)
• Rating of Health Plan (80.9%, 10th percentile)
December, 2020 Department of Social Services 57
Comparison to Quality Compass
HUSKY B: General Population
2019 Child Medicaid Quality Compass General Population Results
Child Medicaid with CCC Survey Questions 2020 Percentile Mean 5th 10th 25th 50th 75th 90th 95th
Getting Care Quickly (% Always/Usually) 91.0 61st 89.38 80.94 82.95 87.01 89.98 92.43 94.17 95.30
How Well Doctors Communicate (% Always/Usually) 96.7 91st 93.97 90.20 91.08 92.44 94.13 95.70 96.57 97.05
Getting Needed Care (% Always/Usually) 89.6 88th 84.50 77.08 78.40 81.49 84.85 88.01 89.98 91.04
Customer Service (% Always/Usually) 88.4 47th 88.36 83.89 85.14 86.50 88.56 89.98 92.00 92.53
Q35 Care Coordination (% Always/Usually) 88.5 87th 83.77 75.63 78.57 81.11 84.06 87.18 89.33 89.83
Q9 Rating of Health Care (% 8, 9, 10) 92.4 94th 87.53 80.17 82.97 85.76 88.24 90.12 91.29 92.46
Q36 Rating of Personal Doctor (% 8, 9, 10) 94.0 97th 90.05 84.65 86.55 88.69 90.49 92.02 93.16 93.63
Q43 Rating of Specialist (% 8, 9, 10) 89.2 76th 87.45 83.92 84.25 85.83 87.29 89.00 91.18 91.78
Q49 Rating of Health Plan (% 8, 9, 10) 84.4 24th 86.49 79.03 81.40 84.48 87.15 89.38 90.95 92.22
Legend: 95th = Plan score falls on or above 95th percentile 90th = Plan score falls on 90th or below 95th percentile 75th = Plan score falls on 75th or below 90th percentile 50th = Plan score falls on 50th or below 75th percentile 25th = Plan score falls on 25th or below 50th percentile 10th = Plan score falls on 10th or below 25th percentile 5th = Plan score falls below 10th percentile
2020 CAHPS® 5.0H CHIP with CCC Survey HUSKY Health program (HUSKY B)
July 2020 58
The 2019 Child Medicaid Quality Compass consists of 112 public and non-public reporting health plan products (All Lines of Business excluding PPO/EPOs).
SPH Analytics
No significant differences compared to prior year results are noted
Summary of Key Measures
2020 CAHPS® 5.0H Child Medicaid w CCC Survey HUSKY Health program (HUSKY A/C/D)
July 2020 59
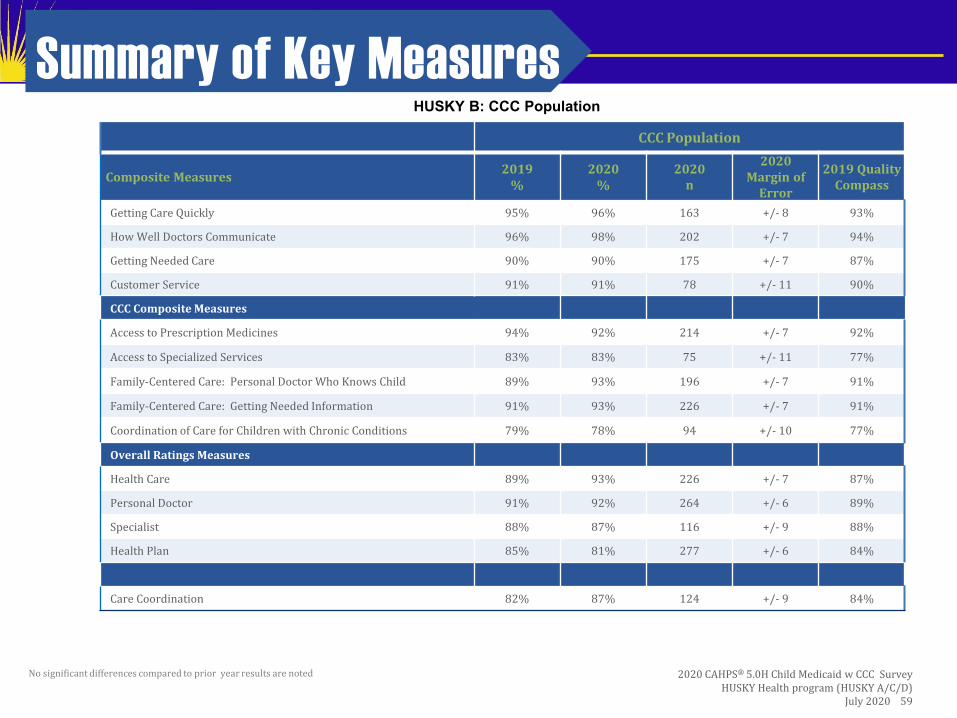
HUSKY B: CCC Population
CCC Population
Composite Measures 2019
% 2020
% 2020
n
2020 Margin of
Error
2019 Quality Compass
Getting Care Quickly 95% 96% 163 +/- 8 93%
How Well Doctors Communicate 96% 98% 202 +/- 7 94%
Getting Needed Care 90% 90% 175 +/- 7 87%
Customer Service 91% 91% 78 +/- 11 90%
CCC Composite Measures
Access to Prescription Medicines 94% 92% 214 +/- 7 92%
Access to Specialized Services 83% 83% 75 +/- 11 77%
Family-Centered Care: Personal Doctor Who Knows Child 89% 93% 196 +/- 7 91%
Family-Centered Care: Getting Needed Information 91% 93% 226 +/- 7 91%
Coordination of Care for Children with Chronic Conditions 79% 78% 94 +/- 10 77%
Overall Ratings Measures
Health Care 89% 93% 226 +/- 7 87%
Personal Doctor 91% 92% 264 +/- 6 89%
Specialist 88% 87% 116 +/- 9 88%
Health Plan 85% 81% 277 +/- 6 84%
Care Coordination 82% 87% 124 +/- 9 84%
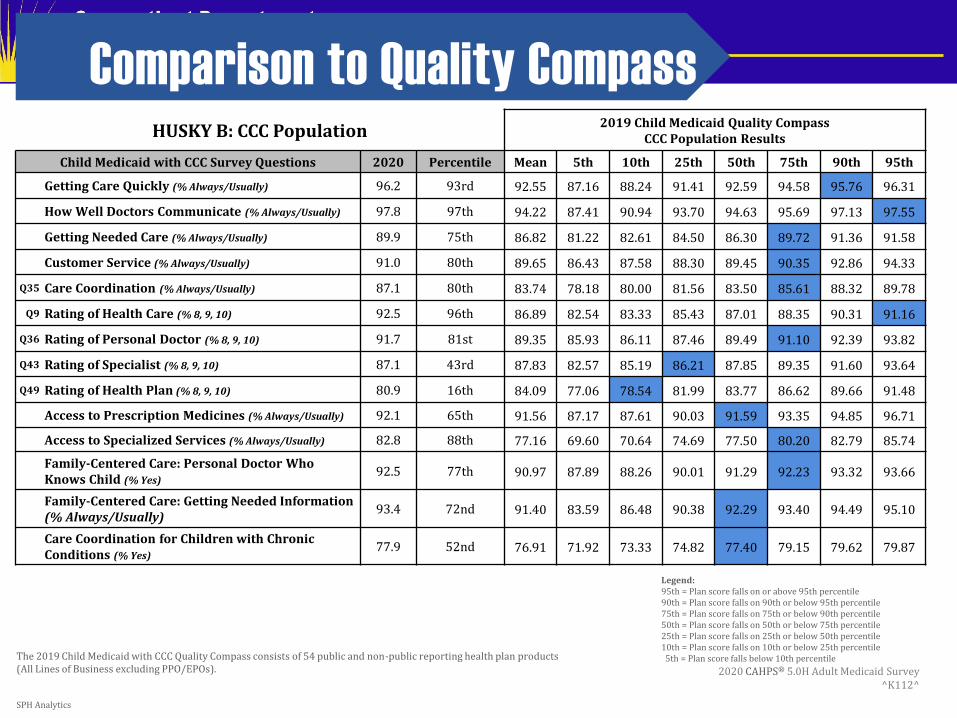
Comparison to Quality Compass
HUSKY B: CCC Population 2019 Child Medicaid Quality Compass
CCC Population Results
Child Medicaid with CCC Survey Questions 2020 Percentile Mean 5th 10th 25th 50th 75th 90th 95th
Getting Care Quickly (% Always/Usually) 96.2 93rd 92.55 87.16 88.24 91.41 92.59 94.58 95.76 96.31
How Well Doctors Communicate (% Always/Usually) 97.8 97th 94.22 87.41 90.94 93.70 94.63 95.69 97.13 97.55
Getting Needed Care (% Always/Usually) 89.9 75th 86.82 81.22 82.61 84.50 86.30 89.72 91.36 91.58
Customer Service (% Always/Usually) 91.0 80th 89.65 86.43 87.58 88.30 89.45 90.35 92.86 94.33
Q35 Care Coordination (% Always/Usually) 87.1 80th 83.74 78.18 80.00 81.56 83.50 85.61 88.32 89.78
Q9 Rating of Health Care (% 8, 9, 10) 92.5 96th 86.89 82.54 83.33 85.43 87.01 88.35 90.31 91.16
Q36 Rating of Personal Doctor (% 8, 9, 10) 91.7 81st 89.35 85.93 86.11 87.46 89.49 91.10 92.39 93.82
Q43 Rating of Specialist (% 8, 9, 10) 87.1 43rd 87.83 82.57 85.19 86.21 87.85 89.35 91.60 93.64
Q49 Rating of Health Plan (% 8, 9, 10) 80.9 16th 84.09 77.06 78.54 81.99 83.77 86.62 89.66 91.48
Access to Prescription Medicines (% Always/Usually) 92.1 65th 91.56 87.17 87.61 90.03 91.59 93.35 94.85 96.71
Access to Specialized Services (% Always/Usually) 82.8 88th 77.16 69.60 70.64 74.69 77.50 80.20 82.79 85.74
Family-Centered Care: Personal Doctor Who Knows Child (% Yes)
92.5 77th 90.97 87.89 88.26 90.01 91.29 92.23 93.32 93.66
Family-Centered Care: Getting Needed Information (% Always/Usually)
93.4 72nd 91.40 83.59 86.48 90.38 92.29 93.40 94.49 95.10
Care Coordination for Children with Chronic Conditions (% Yes)
77.9 52nd 76.91 71.92 73.33 74.82 77.40 79.15 79.62 79.87
The 2019 Child Medicaid with CCC Quality Compass consists of 54 public and non-public reporting health plan products (All Lines of Business excluding PPO/EPOs).
SPH Analytics
2020 CAHPS® 5.0H Adult Medicaid Survey ^K112^
Legend: 95th = Plan score falls on or above 95th percentile 90th = Plan score falls on 90th or below 95th percentile 75th = Plan score falls on 75th or below 90th percentile 50th = Plan score falls on 50th or below 75th percentile 25th = Plan score falls on 25th or below 50th percentile 10th = Plan score falls on 10th or below 25th percentile 5th = Plan score falls below 10th percentile

Cost Trends
61 December, 2020 61 Department of Social Services

The recently issued annual CMS Medicaid and CHIP quality scorecard for the first time includes both results on adult and child quality measures and state-by-state detail on per capita Medicaid expenditures
This has enabled DSS to compare HUSKY Health’s per capita expenses to Medicaid programs in all of the New England states, New York and New Jersey
Excitingly, Connecticut had the lowest per capita expenditures among those states in 2017, and second lowest in 2018
Per Capita Expenditures
62 December, 2020 62 Department of Social Services
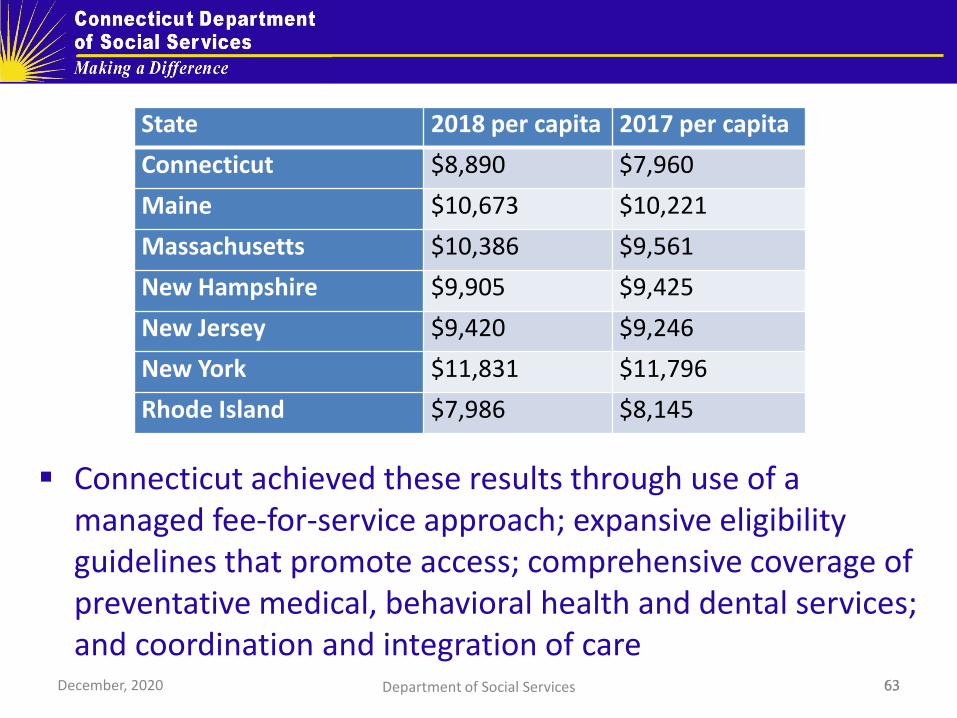
Connecticut achieved these results through use of a managed fee-for-service approach; expansive eligibility guidelines that promote access; comprehensive coverage of preventative medical, behavioral health and dental services; and coordination and integration of care
63 December, 2020 63 Department of Social Services
State 2018 per capita 2017 per capita
Connecticut $8,890 $7,960
Maine $10,673 $10,221
Massachusetts $10,386 $9,561
New Hampshire $9,905 $9,425
New Jersey $9,420 $9,246
New York $11,831 $11,796
Rhode Island $7,986 $8,145
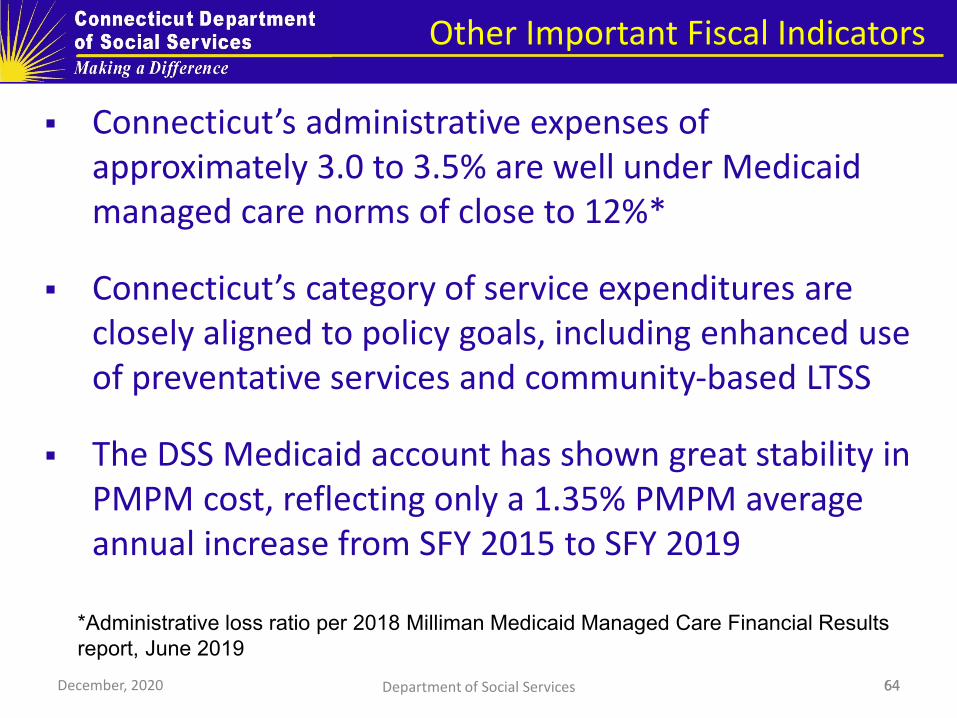
Connecticut’s administrative expenses of approximately 3.0 to 3.5% are well under Medicaid managed care norms of close to 12%*
Connecticut’s category of service expenditures are closely aligned to policy goals, including enhanced use of preventative services and community-based LTSS
The DSS Medicaid account has shown great stability in PMPM cost, reflecting only a 1.35% PMPM average annual increase from SFY 2015 to SFY 2019
Other Important Fiscal Indicators
64 December, 2020 64
*Administrative loss ratio per 2018 Milliman Medicaid Managed Care Financial Results
report, June 2019
Department of Social Services
This is also the case for the more comprehensive CMS-64 (quarterly expenditure report) representation of PMPM – the global PMPM has grown on average at 2.1% annually since SFY 2015
The SFY 2019 state share of Medicaid expenses was only $151 million, or 6.1%, higher than the estimated state share in SFY 2013 – an average annual increase of only 1.0%
Connecticut also compares very favorably with respect to the share of the state budget appropriated to Medicaid costs, compared to both national averages and “peer” regional states (~ 5-6% less)
65 December, 2020 65 Department of Social Services
Revenue Maximization
DSS has actively maximized federal revenue, including, but not limited to:
• 90% federal match on Medicaid expansion group
• 75% match on eligibility staff and systems operations
• 90% federal match on systems changes
• Enhanced match on long-term services and supports (LTSS)
Inclusive of one-time system development costs, the federal share of Connecticut Medicaid administrative costs has increased from 56.7% in 2013 to 61.5% in FFY 2018
Enhanced systems reimbursement resulted in an estimated $400 million in federal reimbursement for projects pursued over the past several years
December, 2020 Department of Social Services 66

Connecticut’s Medicaid structure also ensures that all financial benefits accrue directly to the state, as opposed to managed care organizations. This includes:
• All pharmacy rebates - note that 1) Connecticut Medicaid had a rebate rate of 68.9% in SFY 2019 (11th highest in the country); and 2) net pharmacy spend after rebates declined by $119 million from SFY 2015 to SFY 2019
• Any lapse of funds including current under-spending related to COVID pandemic (e.g., reduced utilization)
December, 2020 Department of Social Services 67
Areas of current focus for revenue maximization include:
• Efforts to create a Medicaid state plan benefit that will allow federal reimbursement for a portion of state-funded residential care home services, while integrating those services into a continuum of Medicaid LTSS
• Development of an 1115 waiver to enhance substance use disorder services through additional reimbursement for Institution for Mental Disease (IMD) services
• Review of certified public expenditure claiming processes to ensure continued access to federal reimbursement for a wide array of services managed by DSS’ sister agencies
December, 2020 Department of Social Services 68
Impacts of COVID
69 December, 2020 69 Department of Social Services
The COVID public health emergency has, despite implementation of telehealth, had dramatic effects on utilization. Please see in the next
several slides some nonexclusive examples of year-over-year comparison.
December, 2020 Department of Social Services 70

V V Covid-19
Map
Registrations
15,743 IP Admissions
1,852 ED Visits
3,676 OP Visits
1,374 Discharges
6,724 Facility Count
27
Currently Inpatient
100
© OpenStreetMap contributors
* Currently showing a limited data set.
Q. Admit Status
Admitted
Discharged
Registered
Facility
Q. Diagnosis Type
Exposure
Other
Positive
Member City
Q. Member State
CT
NY
MA
Member Zip Code
Hospital Admission, Discharge and Transfer Data by Zip Code

December, 2020 Department of Social Services 72
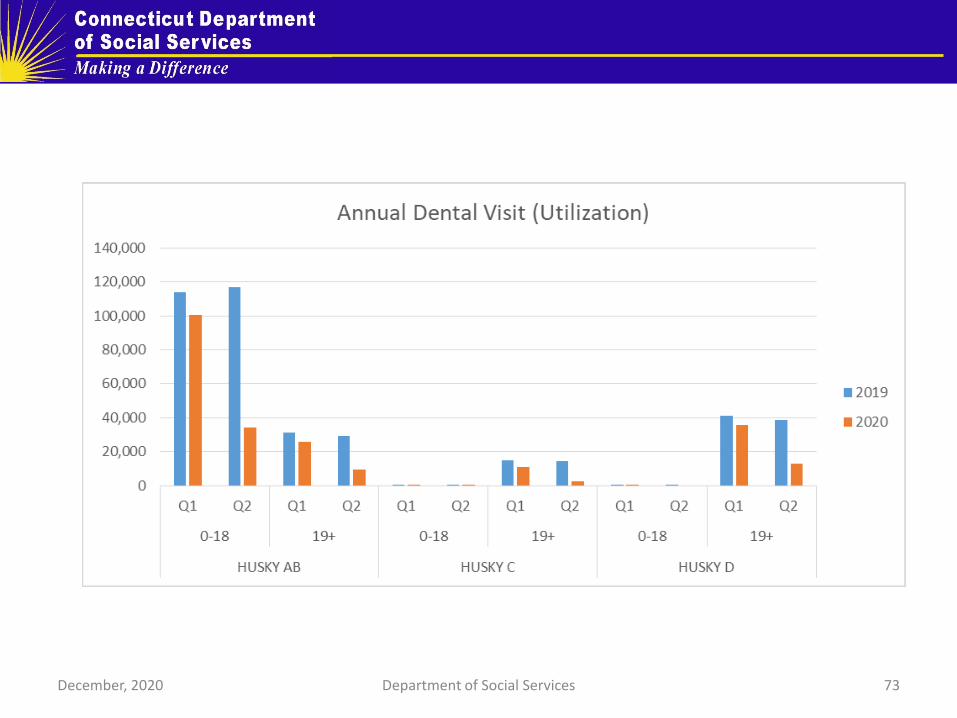
December, 2020 Department of Social Services 73
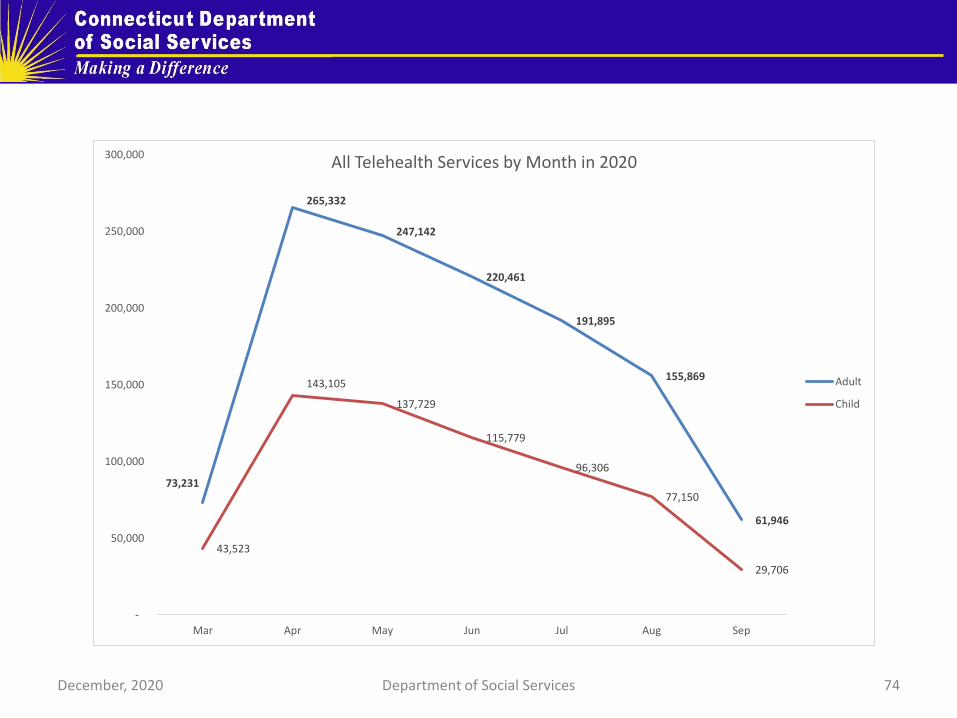
December, 2020 Department of Social Services 74
73,231
265,332
247,142
220,461
191,895
155,869
61,946
43,523
143,105
137,729
115,779
96,306
77,150
29,706
-
50,000
100,000
150,000
200,000
250,000
300,000
Mar Apr May Jun Jul Aug Sep
All Telehealth Services by Month in 2020
Adult
Child
Appendix: Additional Detail on
Connecticut Medicaid Finances
75 December, 2020 75 Department of Social Services
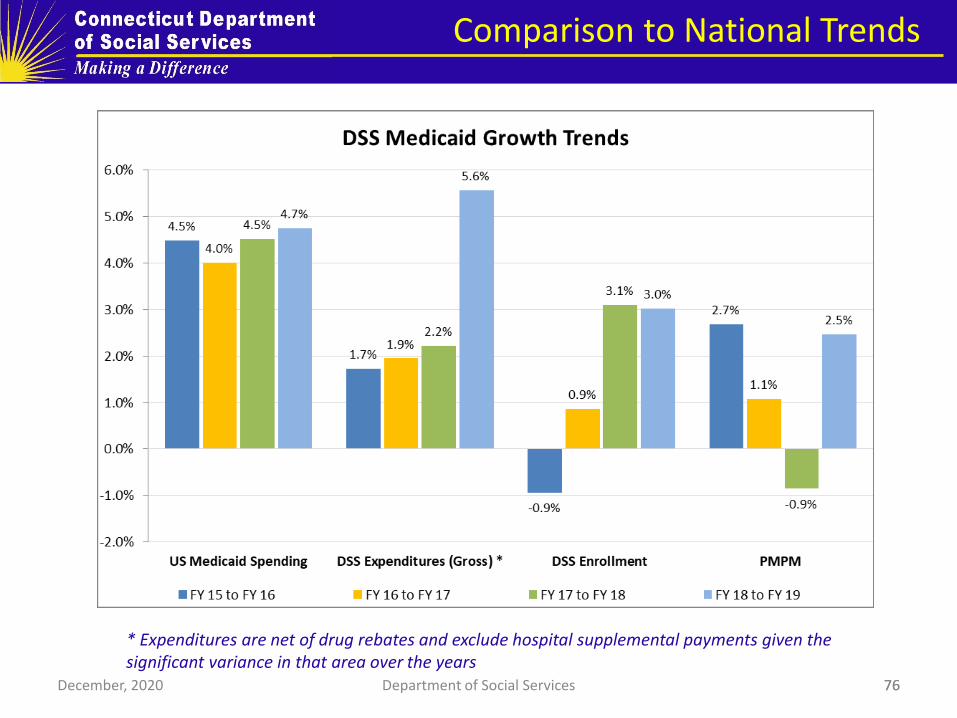
Comparison to National Trends
76
* Expenditures are net of drug rebates and exclude hospital supplemental payments given the significant variance in that area over the years
December, 2020 Department of Social Services 76
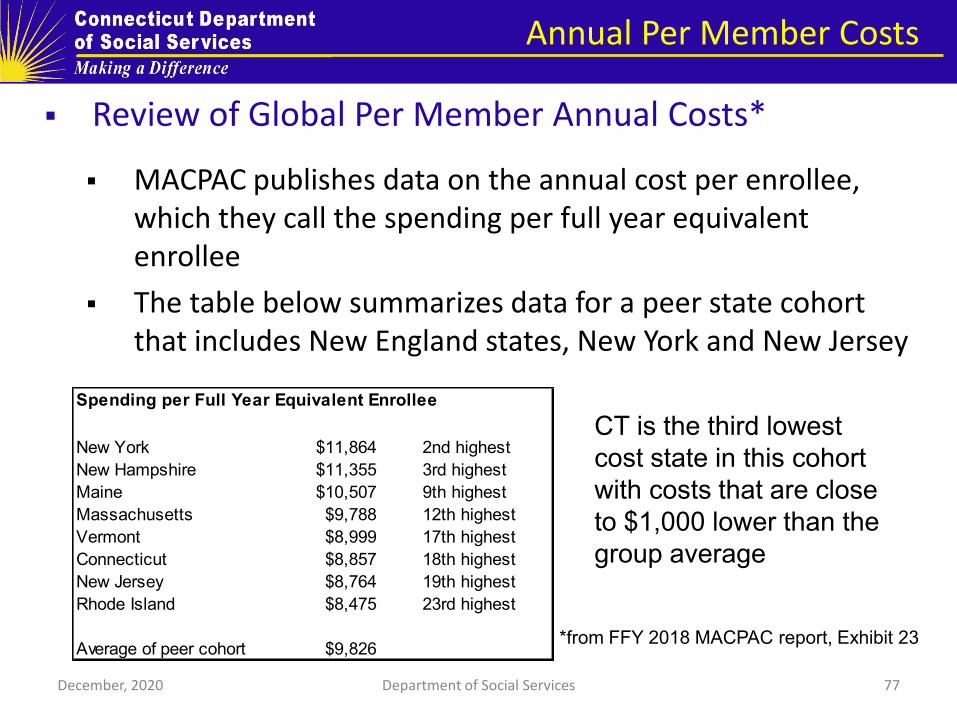
Review of Global Per Member Annual Costs*
MACPAC publishes data on the annual cost per enrollee, which they call the spending per full year equivalent enrollee
The table below summarizes data for a peer state cohort that includes New England states, New York and New Jersey
Annual Per Member Costs
December, 2020 77 Department of Social Services
Spending per Full Year Equivalent Enrollee
New York $11,864 2nd highest
New Hampshire $11,355 3rd highest
Maine $10,507 9th highest
Massachusetts $9,788 12th highest
Vermont $8,999 17th highest
Connecticut $8,857 18th highest
New Jersey $8,764 19th highest
Rhode Island $8,475 23rd highest
Average of peer cohort $9,826
CT is the third lowest
cost state in this cohort
with costs that are close
to $1,000 lower than the
group average
*from FFY 2018 MACPAC report, Exhibit 23

78 December, 2020 78
CT’s state share of Medicaid costs have remained stable State share of costs was virtually unchanged from SFY 2013 to 2017 SFY 2019 state share was only $151 million, or 6.1%, higher than the estimated SFY 2013 state share. This equates to an average annual increase of 1.0% SFY 2018 and 2019 began to rise due to lower federal reimbursement for single adults and hospital rate increases
Federal and State Share of Medicaid
Department of Social Services
*Excludes hospital supplemental payments
Medicaid Share of Total CT Budget
79
In SFY 2019, the “all states” average Medicaid expenditures as a percentage of total State expenditures: 28.9%*
Connecticut’s SFY 2019 Medicaid expenditures as a percentage of total State expenditures: 23.8%*
Going back as far as SFY 2010, CT compares extremely favorably to its “peer” states (New England, NY and NJ). For the entire period, we consistently were among the three states with the lowest percentage
In SFY 2015 through 2017, Connecticut had the lowest percentage share of the total state budget of all our peer states and had the second lowest percentage in SFY 2018 and 2019 (0.1% higher than NJ in both years)
December, 2020 Department of Social Services
* Per the most recent National Association of State Budget Officers (NASBO) State
Expenditure Report; includes both federal and state Medicaid shares